


Despite DOT Week, Memorial Day and increased produce demand causing some volatility in May and June, the peak season continued to underperform relative to typical seasonal patterns.
The Sonar Contract Load Accepted Volume Index (CLAV) measures accepted load tenders moving under contracted agreements. It is similar to the Outbound Tender Volume Index (OTVI) but removes all rejected tenders. In Q2, the CLAV index indicated contract volumes have been relatively strong compared to historical levels. Accepted contract volumes have been relatively strong in Q2. Overall volumes were up nearly 7% month-over-month in early June, largely driven by dry van freight, which increased 7.4% month-over-month. Reefer volumes regressed slightly, declining 1% month-over-month.
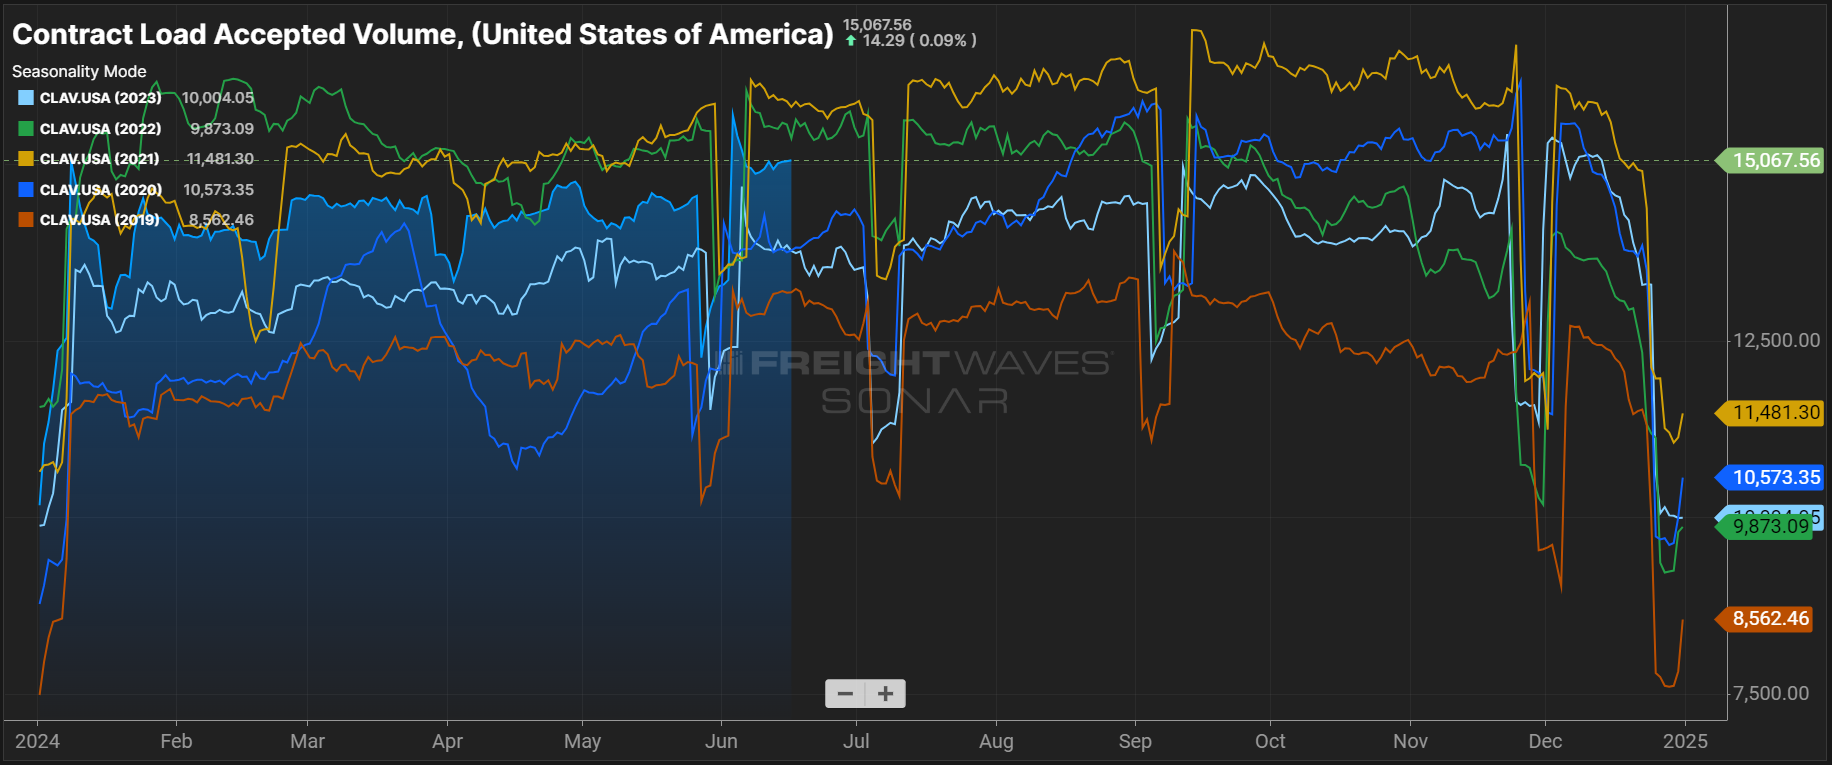 Contract Load Accepted Volume, SONAR
DAT reported an 18.7% increase in spot load posts from April to May. Though significant, this movement is in line with typical seasonality. Despite strong month-over-month growth, spot load posts declined 2.6% year-over-year. The decline is due to seasonal conditions similar to last year’s and the continued increase in spot capacity sourced through new methods, such as rate APIs. Carriers are also posting fewer trucks and spending more time searching for loads, indicated by spot truck postings declining by 22% year-over-year. This data does not necessarily mean there is 22% less capacity on the roads than a year ago; however, it supports the idea that the capacity correction is significantly further along compared to this time last year.
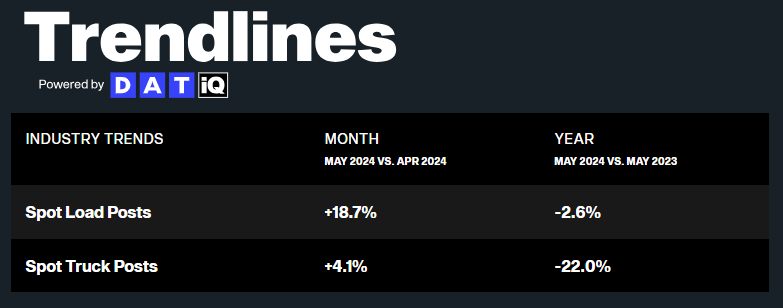 DAT Trendlines
The Cass Freight Index shipments component is a good indicator of overall market health because it encompasses both spot and contract freight based on bill data. The May reading showed flat month-over-month shipment trends from April to May on a seasonally adjusted basis, with spot load postings and accepted contract volumes ticking up. A clear sign the market is moving as expected based on typical seasonal patterns. Total shipments declined nearly 6% year-over-year, creating even more challenges for carriers in a market seeking greater supply and demand balance.
 Cass Freight Index Report – May 2024
While tracking total capacity is challenging, recent trends indicate that supply and demand are moving slowly toward balance. The market handled volatility relatively well throughout the summer peak season thus far, but will see greater rate volatility associated with seasonal pressures as it approaches equilibrium. As tender rejections slowly elevate from 2023 levels, spot rates will experience upward pressure and create increased vulnerability to sustained routing guide challenges, but this is now not expected until early 2025 at the earliest.
The Sonar Outbound Tender Reject Index (OTRI), which measures the rate at which carriers reject the freight they are contractually required to take, shows more volatility now than at this time last year. We believe the main driver of this trend is the closing gap between spot and contract rates in periods of elevated spot rates and some reduced capacity from a year ago. Conditions should continue to follow normal seasonality, but the impact will be muted relative to historical trends. With the index still below 5%, it is safe to say the market environment remains soft overall.
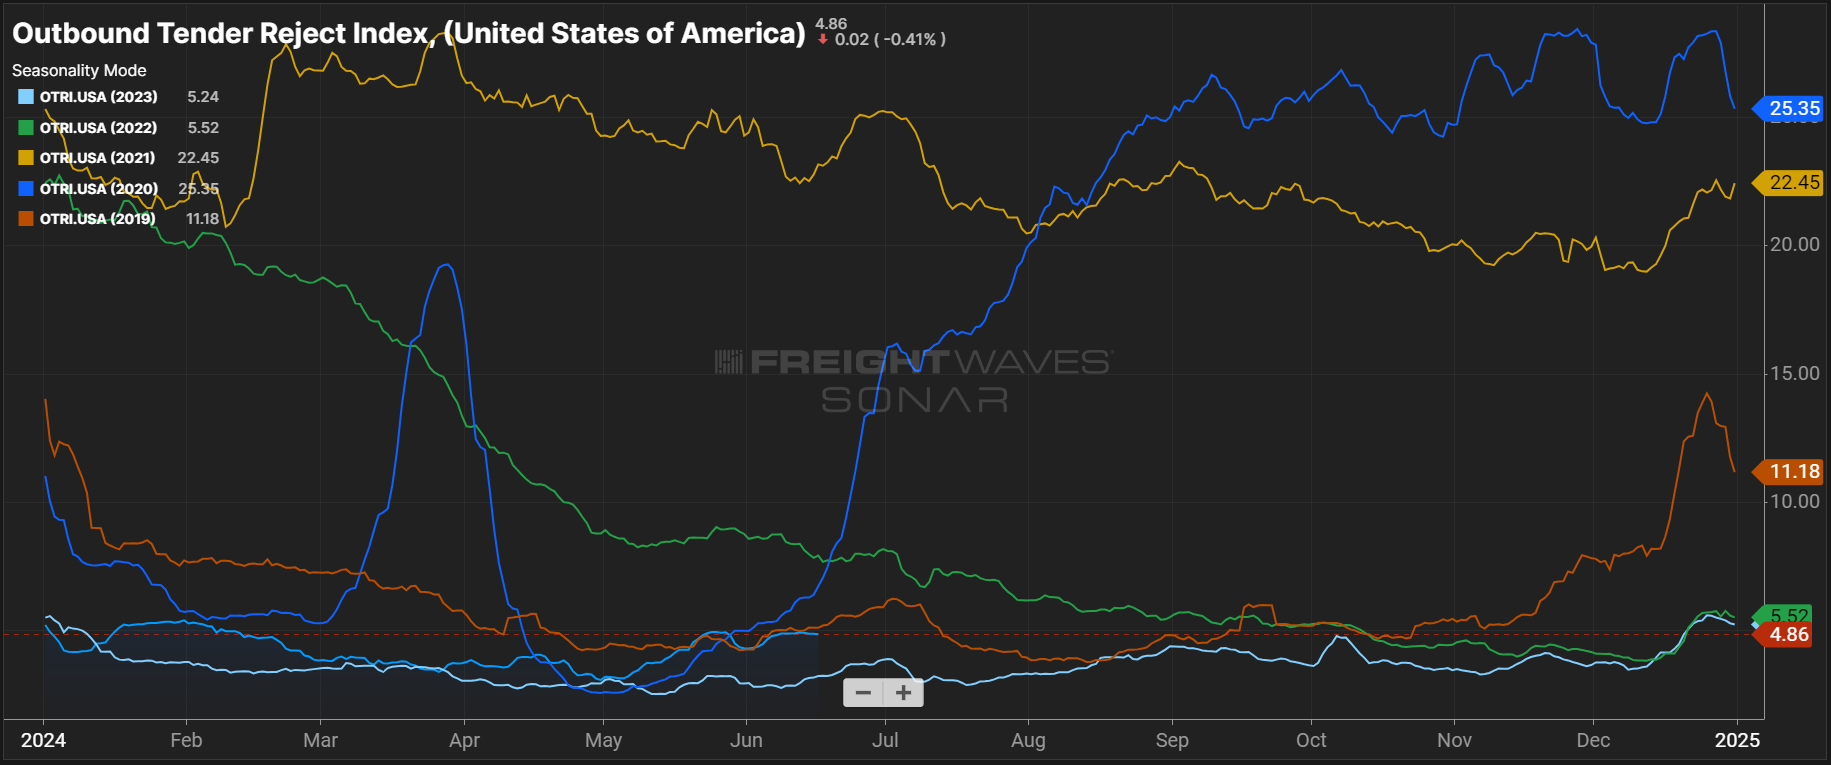 Outbound Tender Reject Index, SONAR: OTRI starting to move closely in line with 2019 levels, a year that saw limited disruption outside typical seasonal patterns.
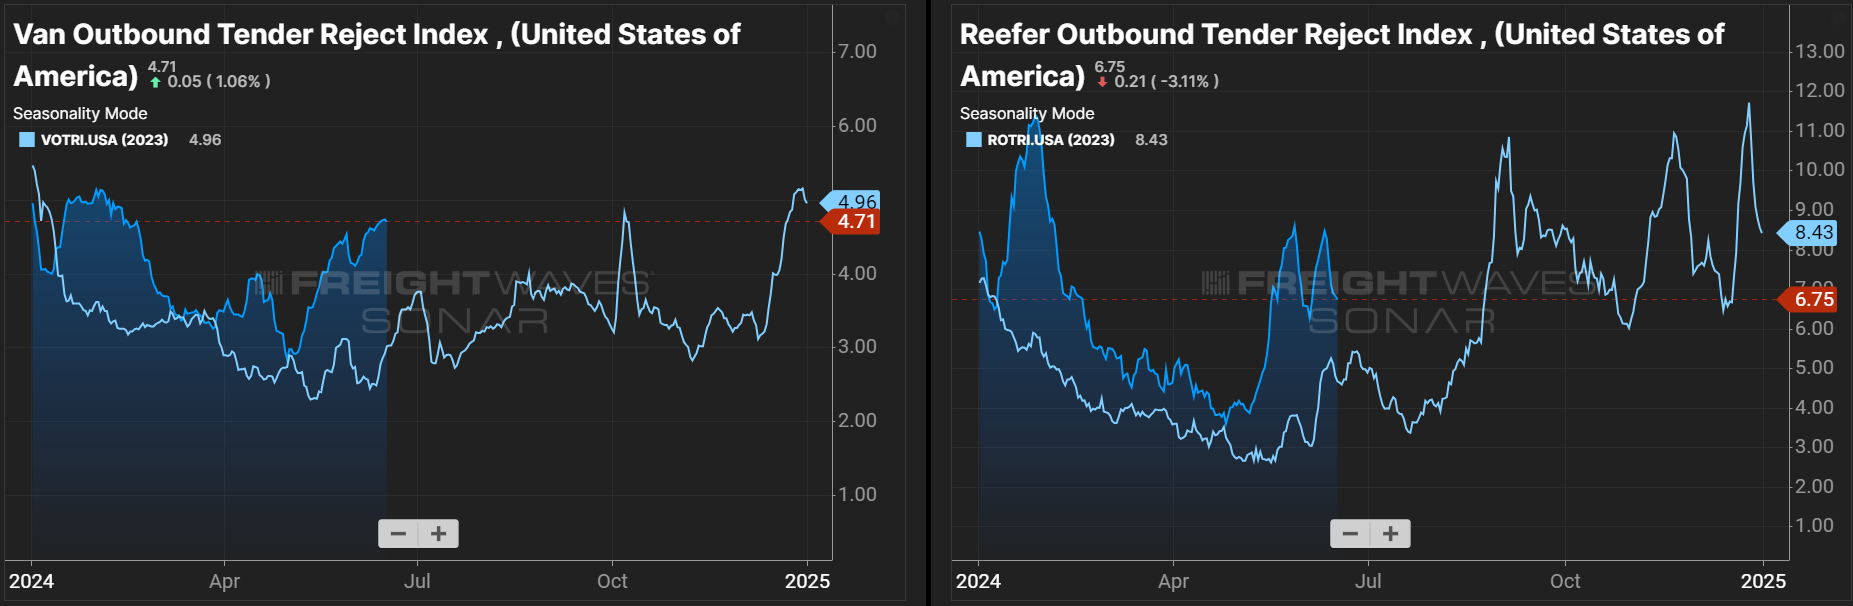 Van and Reefer Outbound Tender Reject Indices, SONAR: Dry van and reefer tender rejections remain elevated year-over-year.
The DAT Load-to-Truck Ratio measures the total number of loads relative to the total number of trucks posted on its spot board. The May reading ticked up for the third consecutive month, rising to 4.39. Such month-over-month increases are typical in May — in fact, this year’s load-to-truck reading was almost identical to May 2022. The reefer load-to-truck ratio increased month-over-month but not as significantly, reaching 6.28. It also increased from May 2023 but was below May 2022.
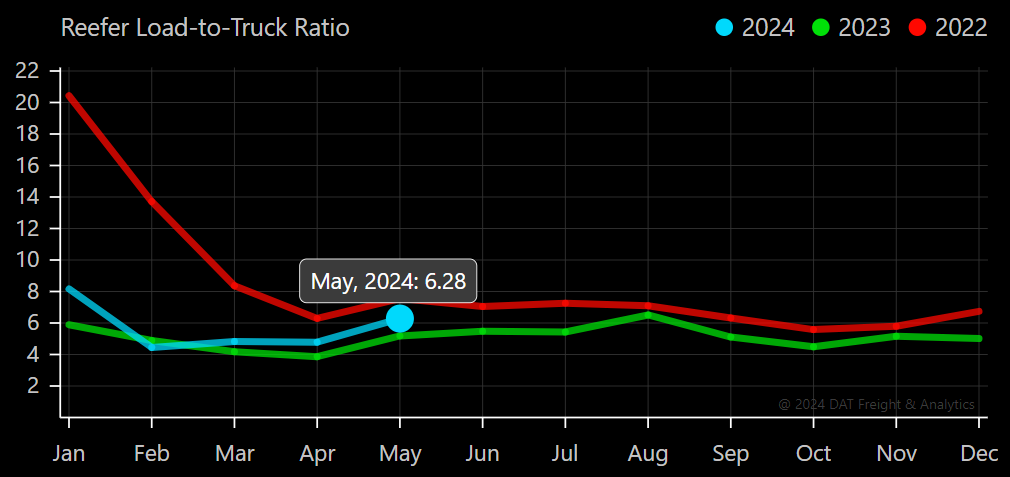 DAT Reefer Load-To-Truck Ratio
The Morgan Stanley Dry Van Freight Index is another measure of relative supply; the higher the index, the tighter the market conditions. The black line with triangle markers on the chart provides a great view of what directional trends would be in line with normal seasonality based on historical data dating back to 2007.
The most recent reading in early June indicated that the market is tightening faster than some historical data shows but at a similar pace as last year. After increased tightening in May, we expect trends to look much like in 2023, flattening after the Fourth of July and remaining relatively stable through the second half of the year. The reefer index showed a similar trend, moving at the same rate as in 2023, albeit in a slightly tighter environment. On the flatbed side, the index looks almost identical to last year.
 Morgan Stanley Dry Van Truckload Freight Index
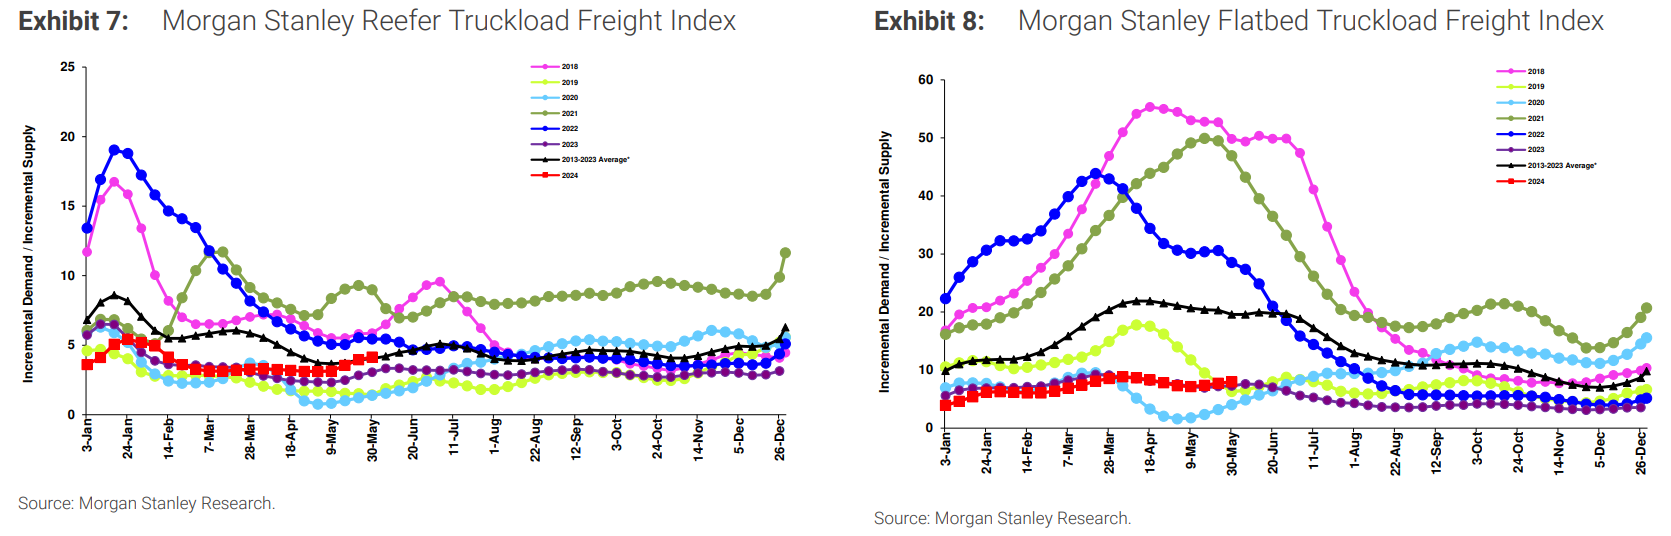 Morgan Stanley Reefer and Flatbed Truckload Freight Indices
Rates followed typical seasonal patterns in May and early June, increasing due to DOT week and Memorial Day, and easing through the first half of June. As we approach the end of the month, quarter and the Fourth of July, we expect additional meaningful rate increases in market areas seeing seasonal demand surges such as the Southeast and in the Southwest and California. Based on 2023 and prior year historical trends, rates should decline after the Fourth of July and continue to follow muted historical patterns.
Truckstop’s Weekly National Average Spot Rates provide a detailed view of week-to-week movements and a real-time look into the current environment. Rates are very similar to this time last year and continue to move in line with seasonal expectations, increasing for all three modes around Memorial Day. Reefer rates pulled back significantly following Memorial Day, while flatbed and dry van rates held steady. We expect rates to remain elevated until the Fourth of July and start to pull back shortly thereafter. Also of note, van rates are now year-over-year inflationary by $0.01 for the first time in more than two years. This will ebb and flow as we see seasonal fluctuations, but is a clear sign we continue to move along the bottom.
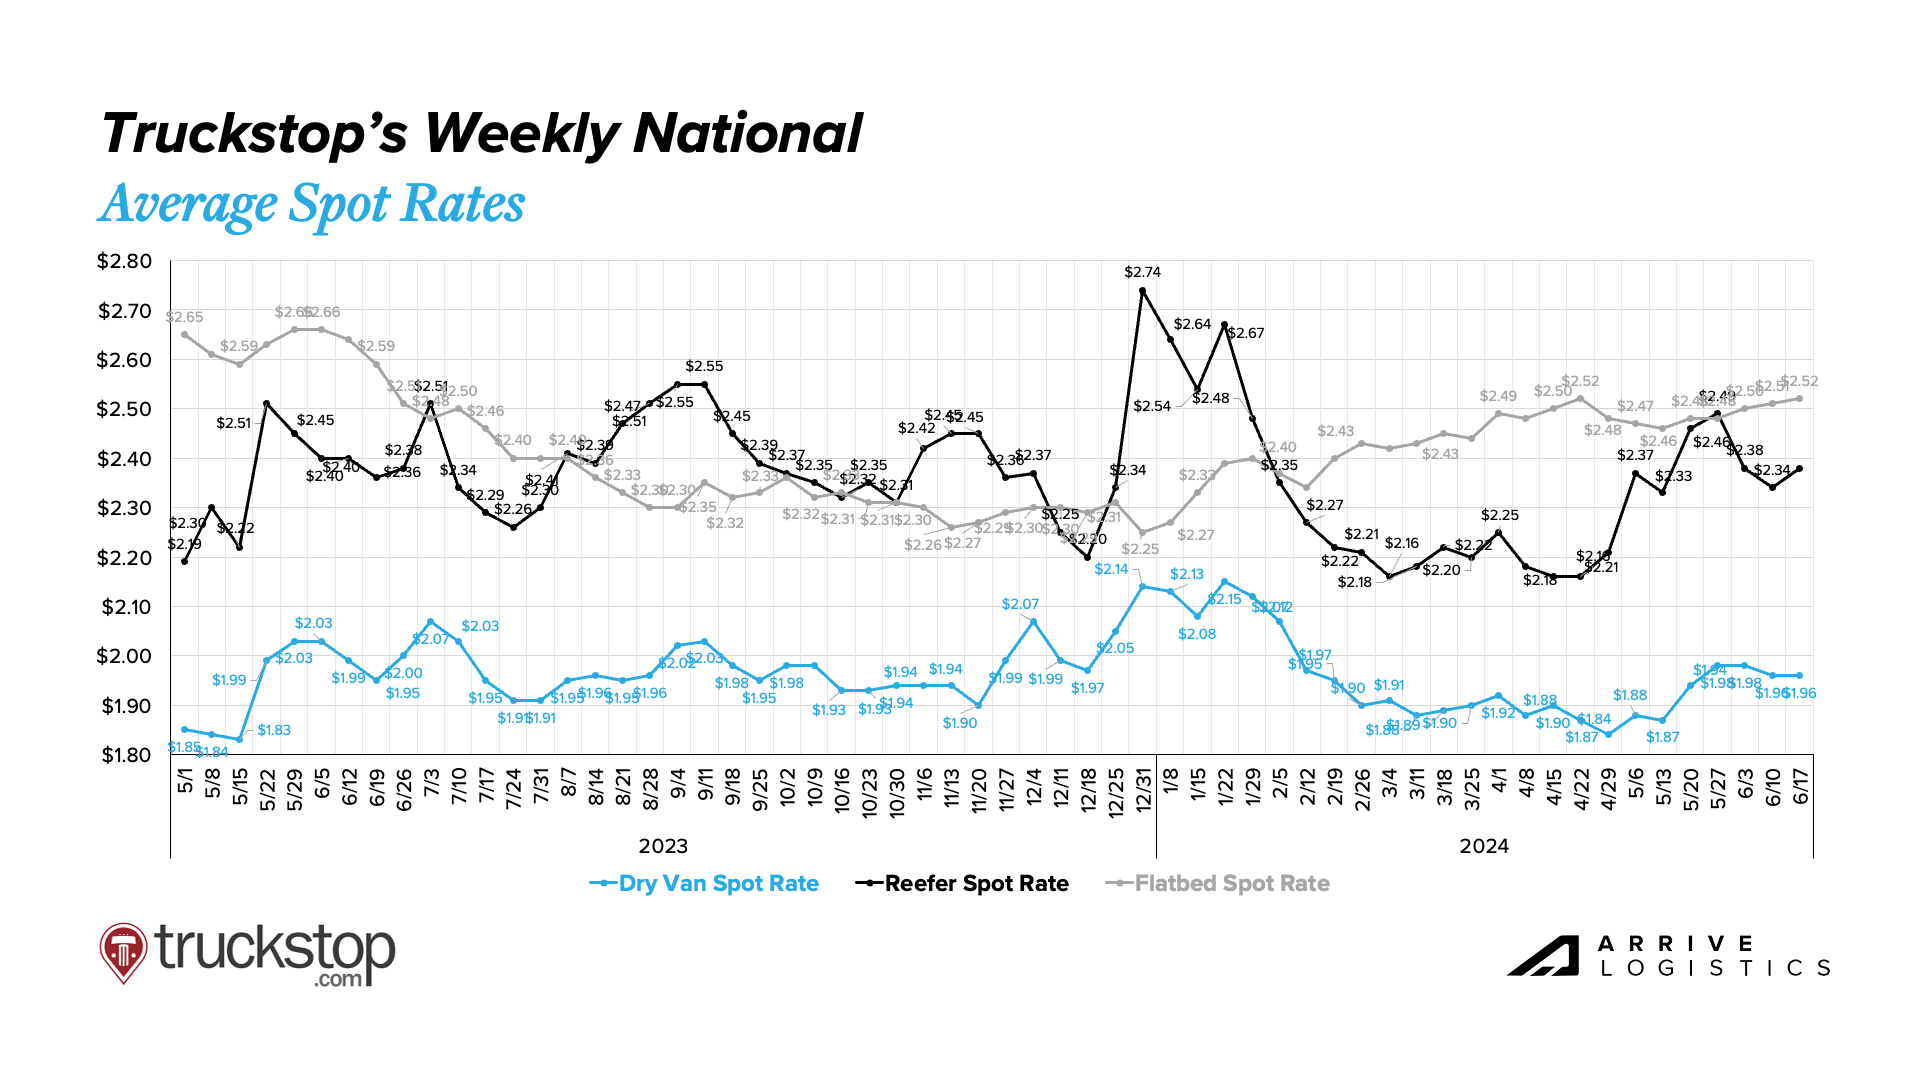 Truckstop’s Weekly National Average Spot Rates
According to DAT, all-in spot rates for dry van and reefer rose in May by $0.02 and $0.09, respectively, while flatbed rates remained steady. As of mid-June, dry van and flatbed rates have ticked up slightly, and reefer rates have regressed by $0.01. These trends align with expectations for early June and indicate normal seasonal pressures.
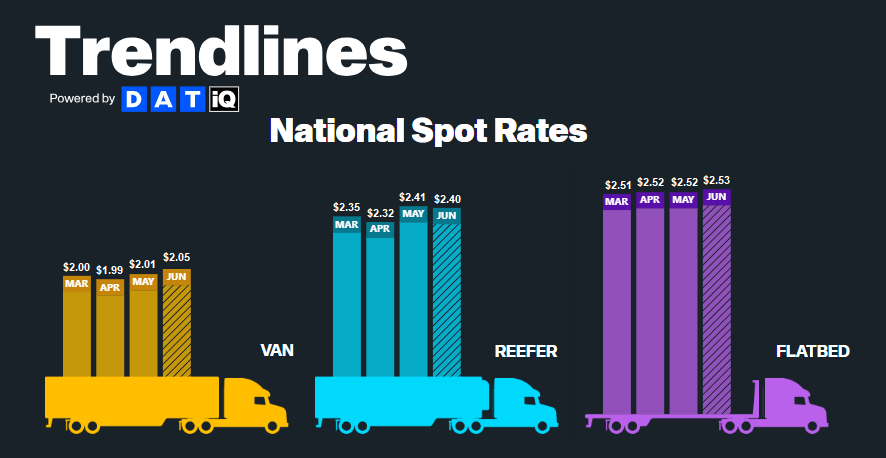 DAT Monthly Rate Trends
National diesel prices continued to decline in May and into June, averaging $3.71 per gallon through the first three weeks of this month. Lower prices have been a welcome relief for carriers as high operating costs persist. However, June 17 marked the first increase after ten consecutive week-over-week declines, and prices could continue rising as summer demand increases ahead of the Fourth of July.
DAT data continues to show line-haul spot rate increases. Rates ticked up $0.05 per mile from April to May, and data from mid-June shows another $0.06 per mile increase. Contract rates remained flat in May and are up $0.01 per mile as of mid-June. These trends looked similar last year, albeit with smaller increases.
Despite rising month-over-month, May linehaul spot rates were still down $0.03 per mile year-over-year, and June rates are down $0.01 per mile year-over-year. Contract rates have also seen decreases, down $0.11 per mile year-over-year. With the seasonal spot rate increase and the relative stability in contract pricing, excluding fuel, the spot-contract rate spread has dipped to $0.37, the lowest since January and second lowest since early 2022. While still historically high, the improvement from $0.47 a year ago indicates the slow increase in vulnerability of the market.
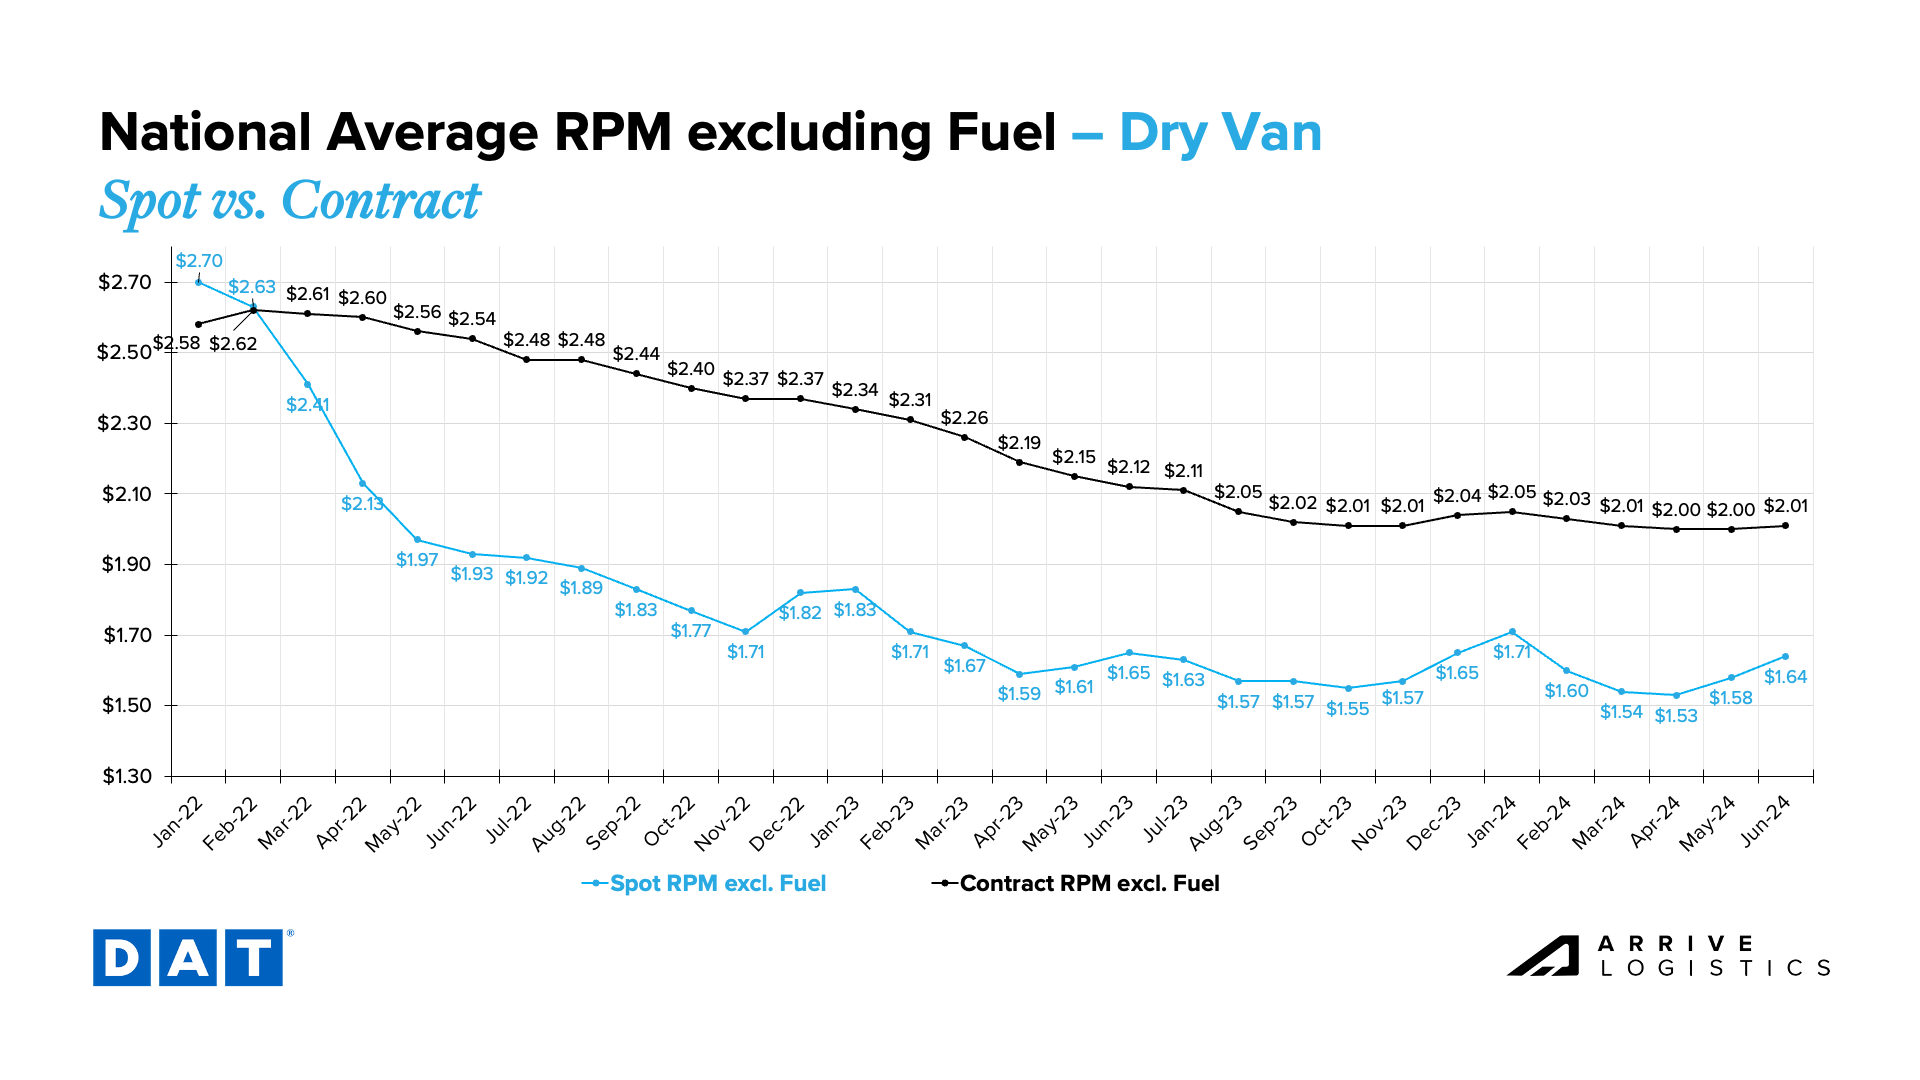 DAT Dry Van National Average RPM Spot vs. Contract
Reefer linehaul rate trends have also matched seasonal expectations, with month-over-month spot rate increases in May and June. The $0.12 per mile jump from April to May was the largest month-over-month increase since January. As of mid-June, reefer spot rates have flattened slightly to $1.96 per mile, excluding fuel. Despite increased volatility, reefer spot rates remain down year-over-year. Rates continue to decline slowly on the contract side, averaging $2.32 per mile in June, $0.12 per mile lower than last year.
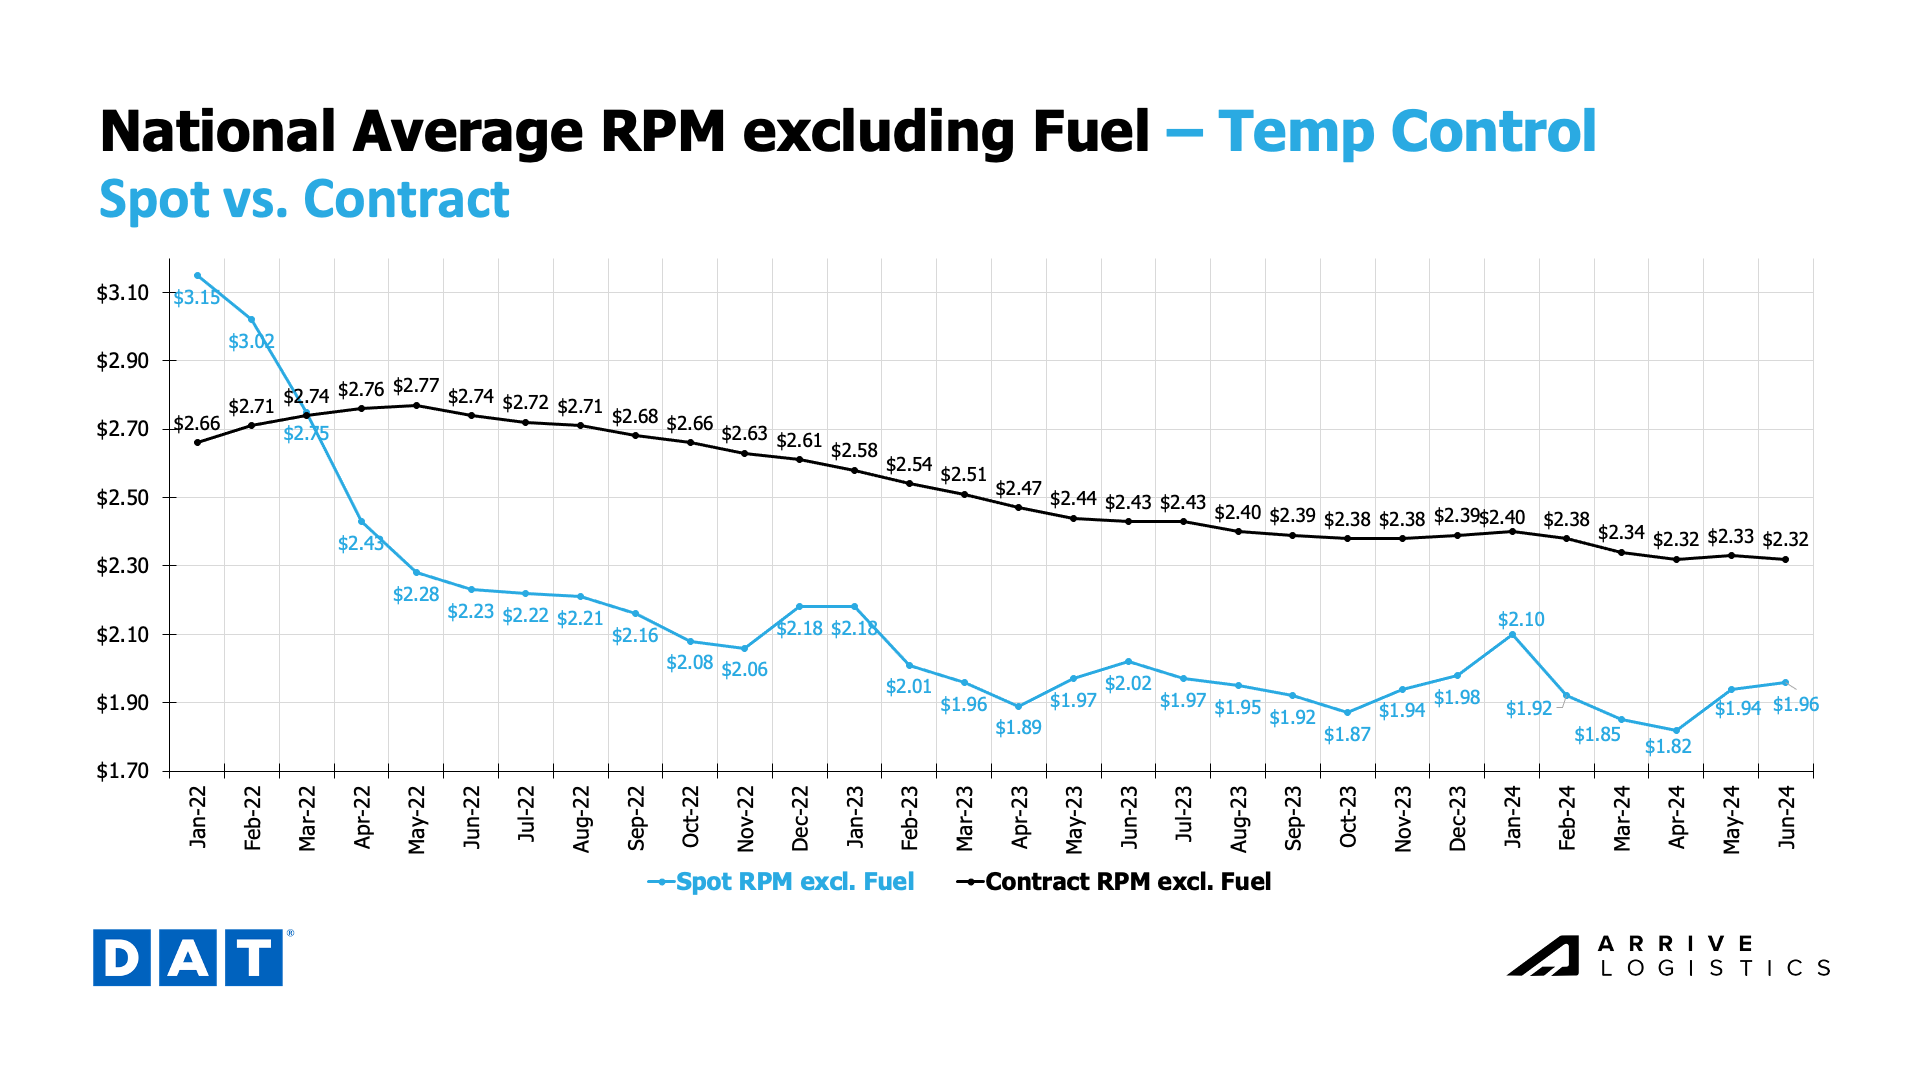 DAT Temp Control National Average RPM Spot vs. Contract
Flatbed spot rates ticked up for the fourth consecutive month, while contract rates declined for the first time since January. The spot rate increase comes amid growing demand for heavy equipment and project-based freight. In June 2023, rates rose before dropping relatively quickly over the following months. While a similar drop is unlikely, spot rates could begin to flatten.
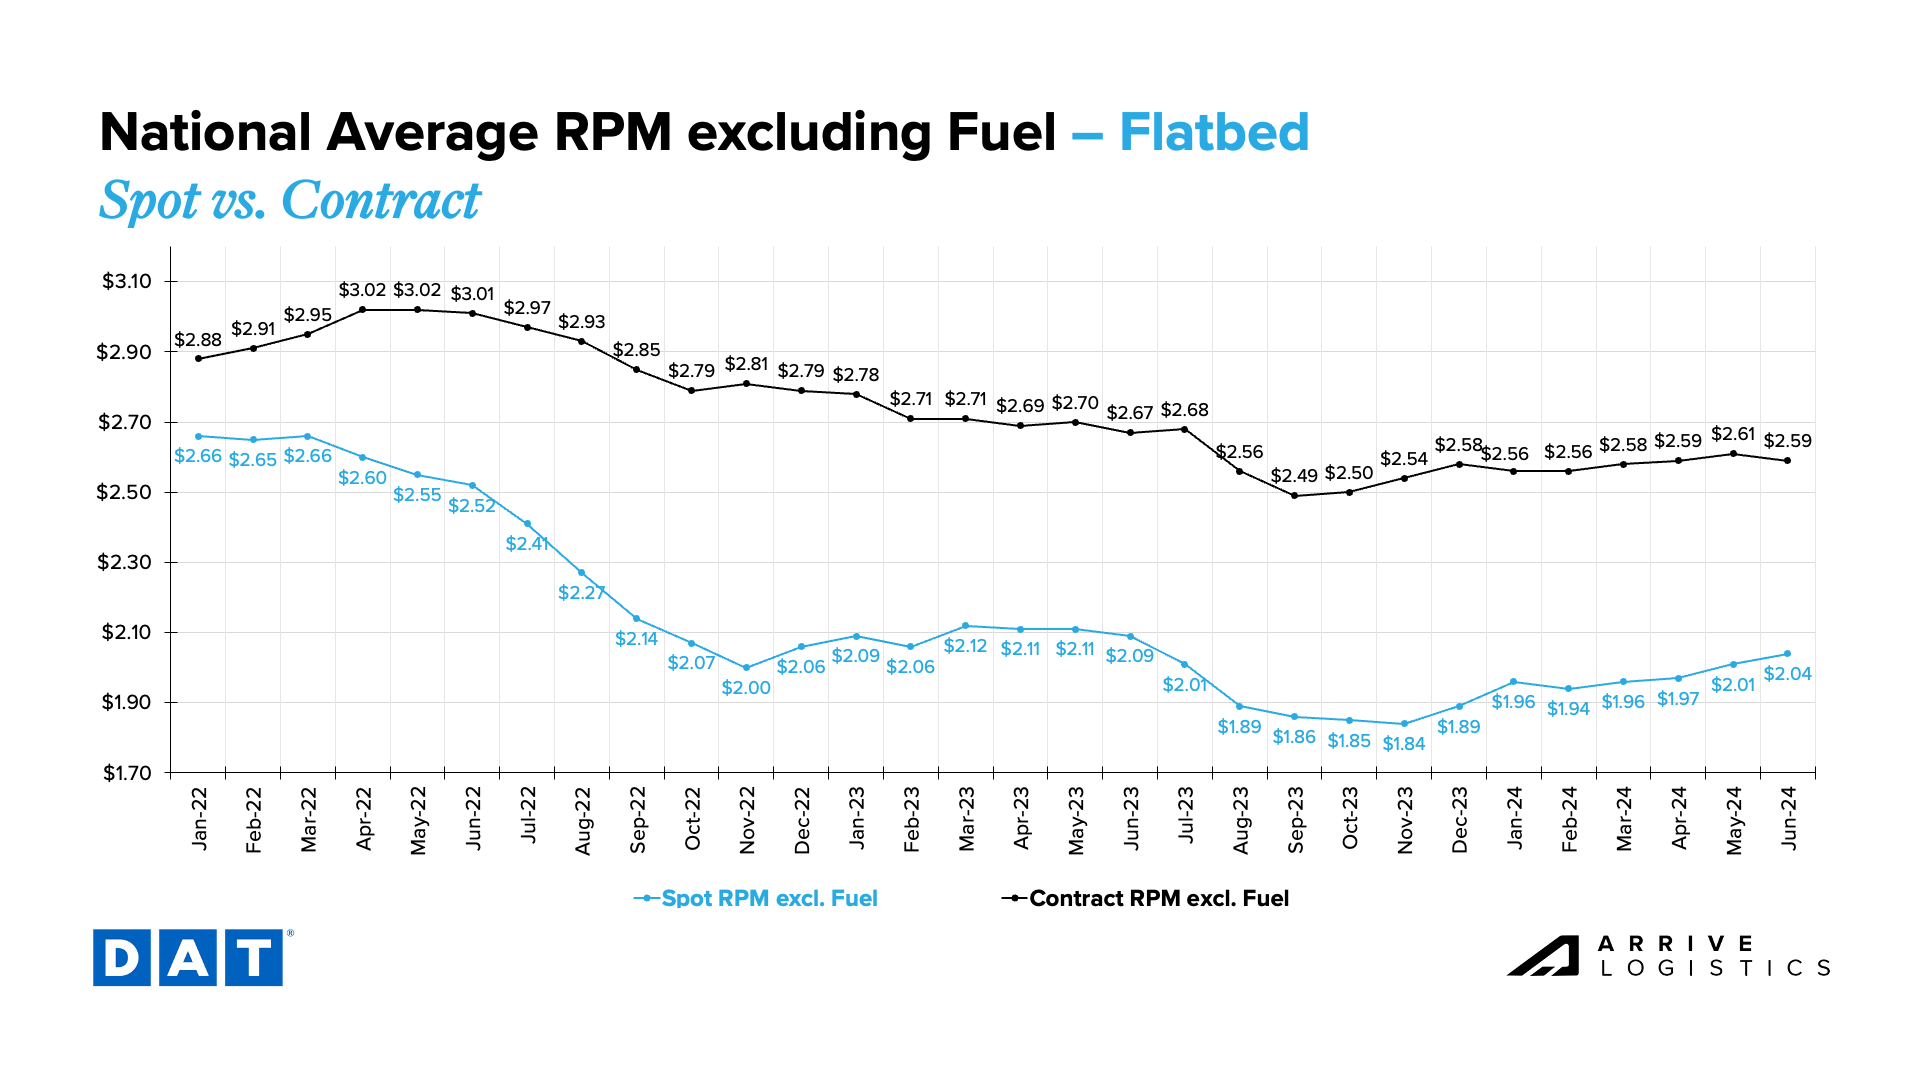 DAT Flatbed National Average RPM Spot vs. Contract
With slower-than-expected truckload demand due to the increasing number of new carriers entering the market amid gradually declining volume, capacity levels are returning to balance. Exacerbating these conditions is private fleets continuing to place new truck orders despite the low rate environment, a trend that differs from typical carrier activity in a down market. Ultimately, capacity remains resilient, which could extend the down-cycle and persistently low rates.
The most recent report on revocations supports this trend, indicating that the for-hire carrier population continued to decline but at a significantly slower rate over the past few months. The slow rate of decline was largely due to an increase in the number of new entrants and continued slowdowns in the number of revocations of authority. While this data isn’t the best indicator of true capacity levels as it measures companies not trucks, it does illustrate overall carrier sentiment.
According to FTR, the high number of new carrier entrants paired with settling levels of revocations could indicate that the weakest capacity has already left the market.
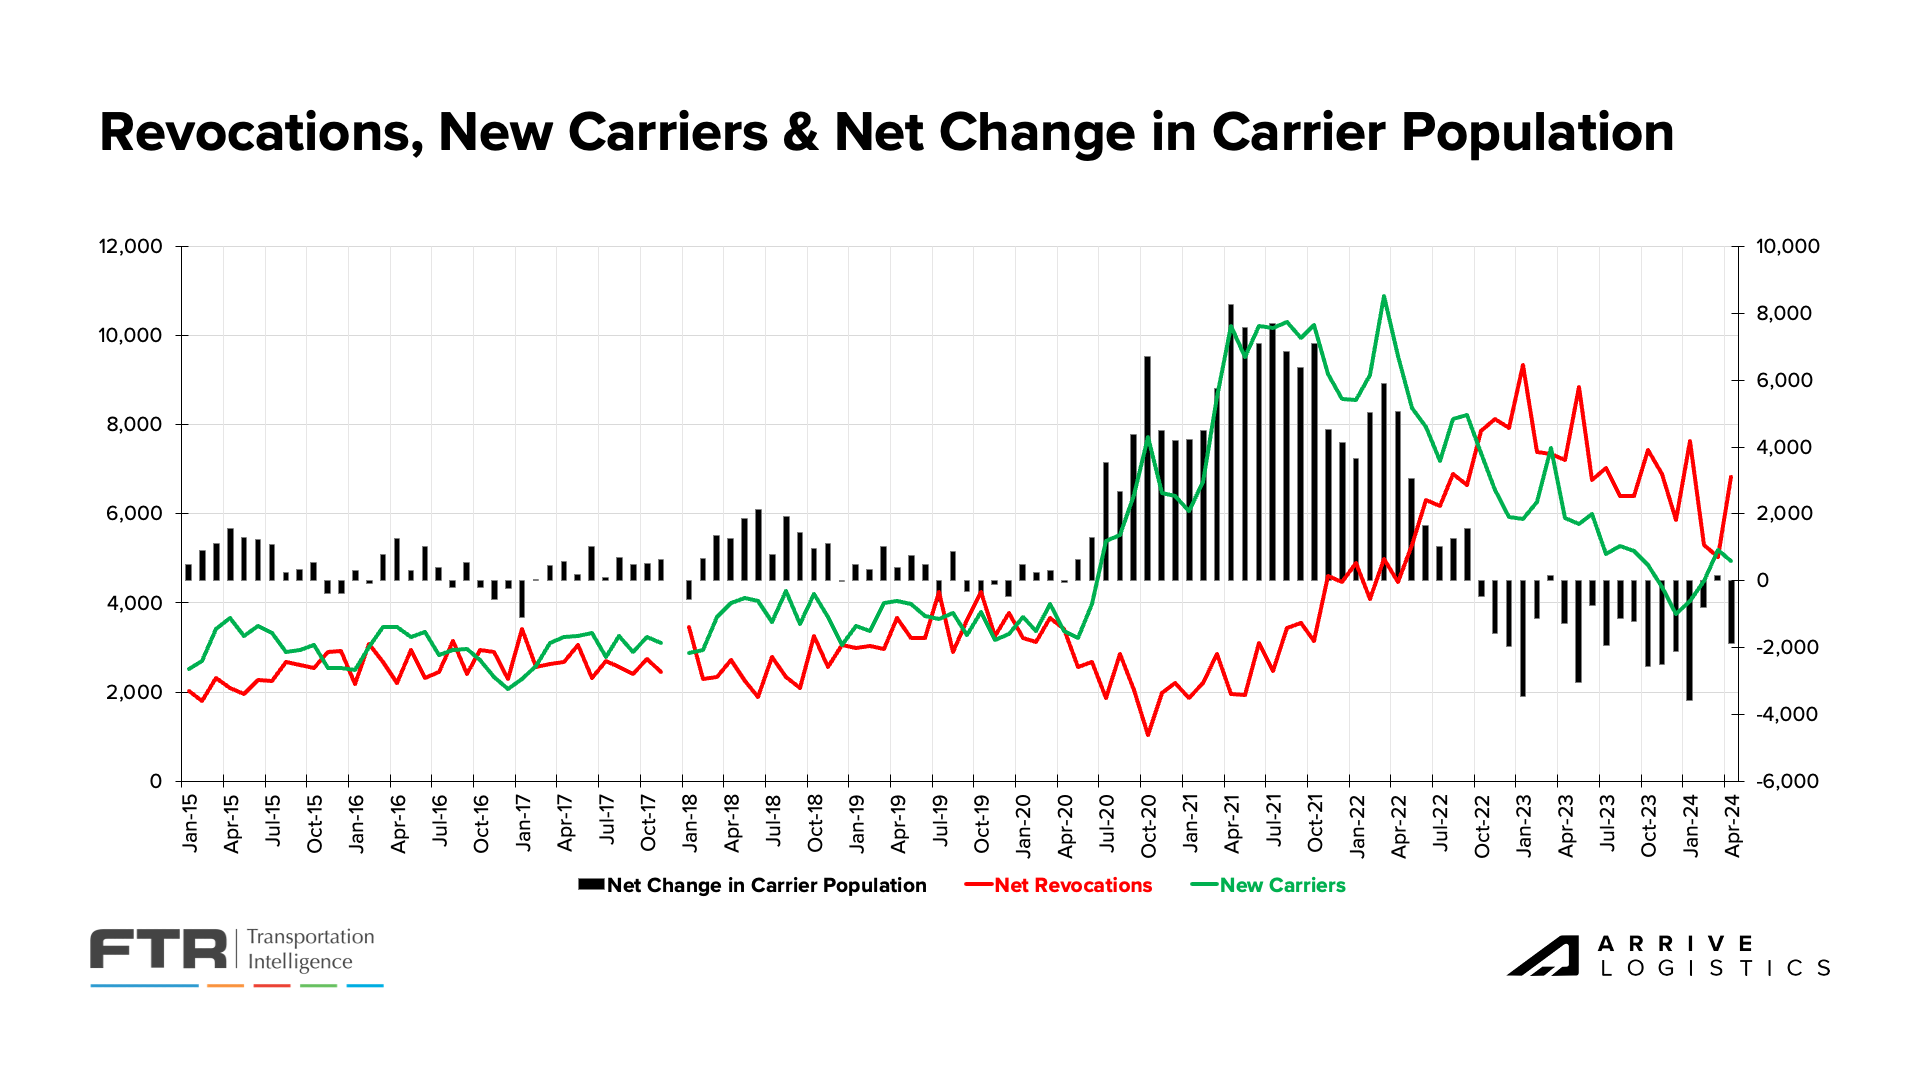 Carrier Revocations, New Carriers & Net Change in Carrier Population, FTR
According to ACT Research, Class 8 truck orders ticked up again in May despite for-hire profitability hitting a 14-year low. This trend strongly suggests that private fleets continue to add capacity despite lower rates. If orders continue to increase, it would likely contribute to a longer downcycle. Our own internal anecdotes tell us that while some fleets are thriving, others are trying to find their footing with the economics of managing a larger fleet. We are hearing from several fleets about their interest in finding freight to load their equipment on typically empty miles.
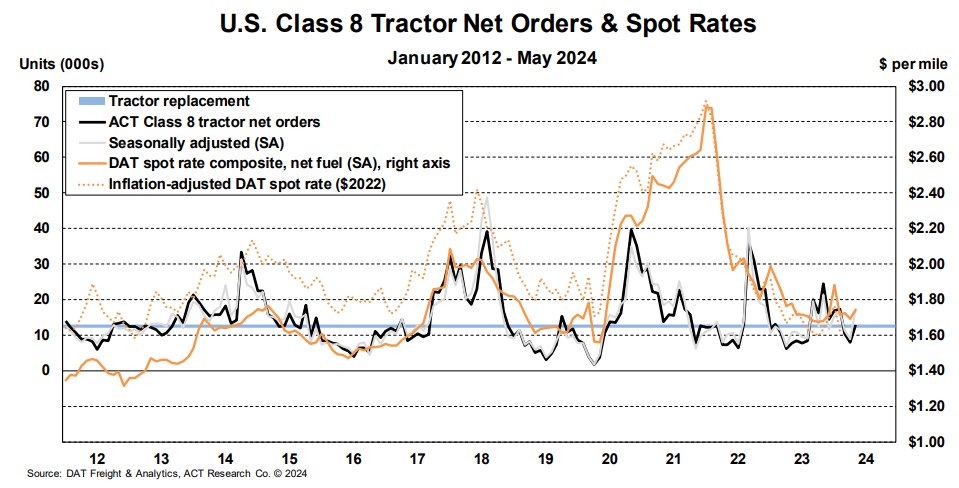 U.S. Class 8 Tractor Net Orders & Spot Rates, ACT Research
FTR’s truck utilization forecast shows that utilization bottomed out in 2023 but has started to tick up as carriers are making moves to right size their fleets. Less can afford to keep drivers seated in underutilized trucks at this point in the cycle as Shipper requested contract pricing discounts have continued to lead to margin erosion for carrier profits. Their forecast calls for additional increases in truck utilization throughout 2024 and into 2025.
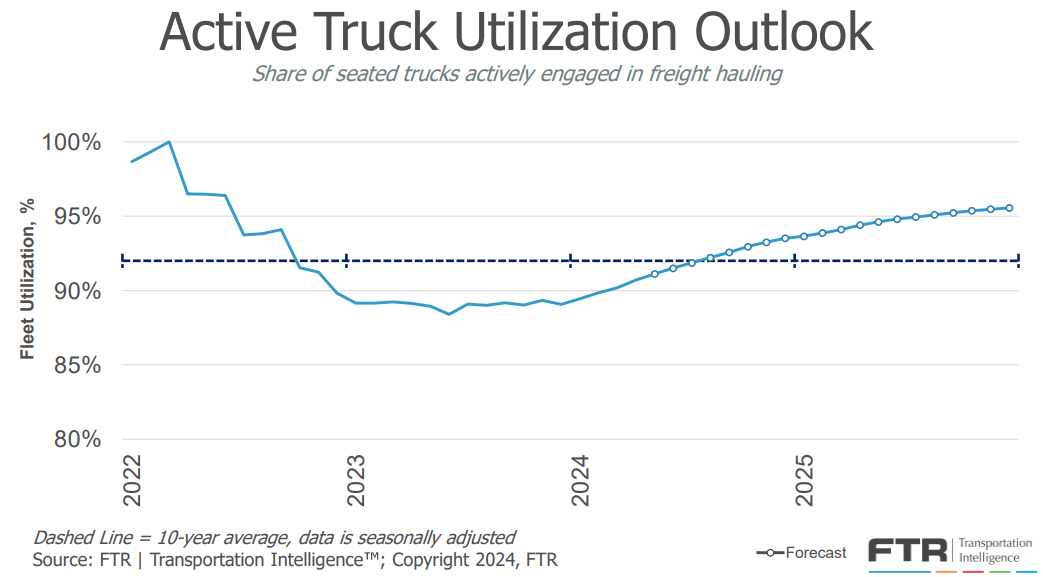 Active Truck Utilization, FTR
The overall demand outlook is a mixed bag of upside and downside indicators. The National Retail Federation (NRF) summer-fall import outlook remains strong and is one of the main upside drivers. U.S. ports handled 2.02 million TEUs in April, a 13.2% year-over-year increase and a 4.6% increase from March. The ports have handled an estimated 12.1 million total TEUs in the first half of the year, up 15% from the same time frame last year.
The NRF also projects that ports will handle over two million TEUs monthly from April 2024 to October 2024. Increased imports indicate that retailers are focused on restocking inventories before the holiday season in anticipation of increased consumer demand. We caution that while this data is encouraging, retail orders are not always a true indicator of what is to come for retail spending. If retail execs are wrong, then the result is another stockpile of inventories that need to be worked down, similar to the post-COVID era, which would have a deflationary impact on the market.
![]() NRF Monthly Imports
NRF Monthly Imports
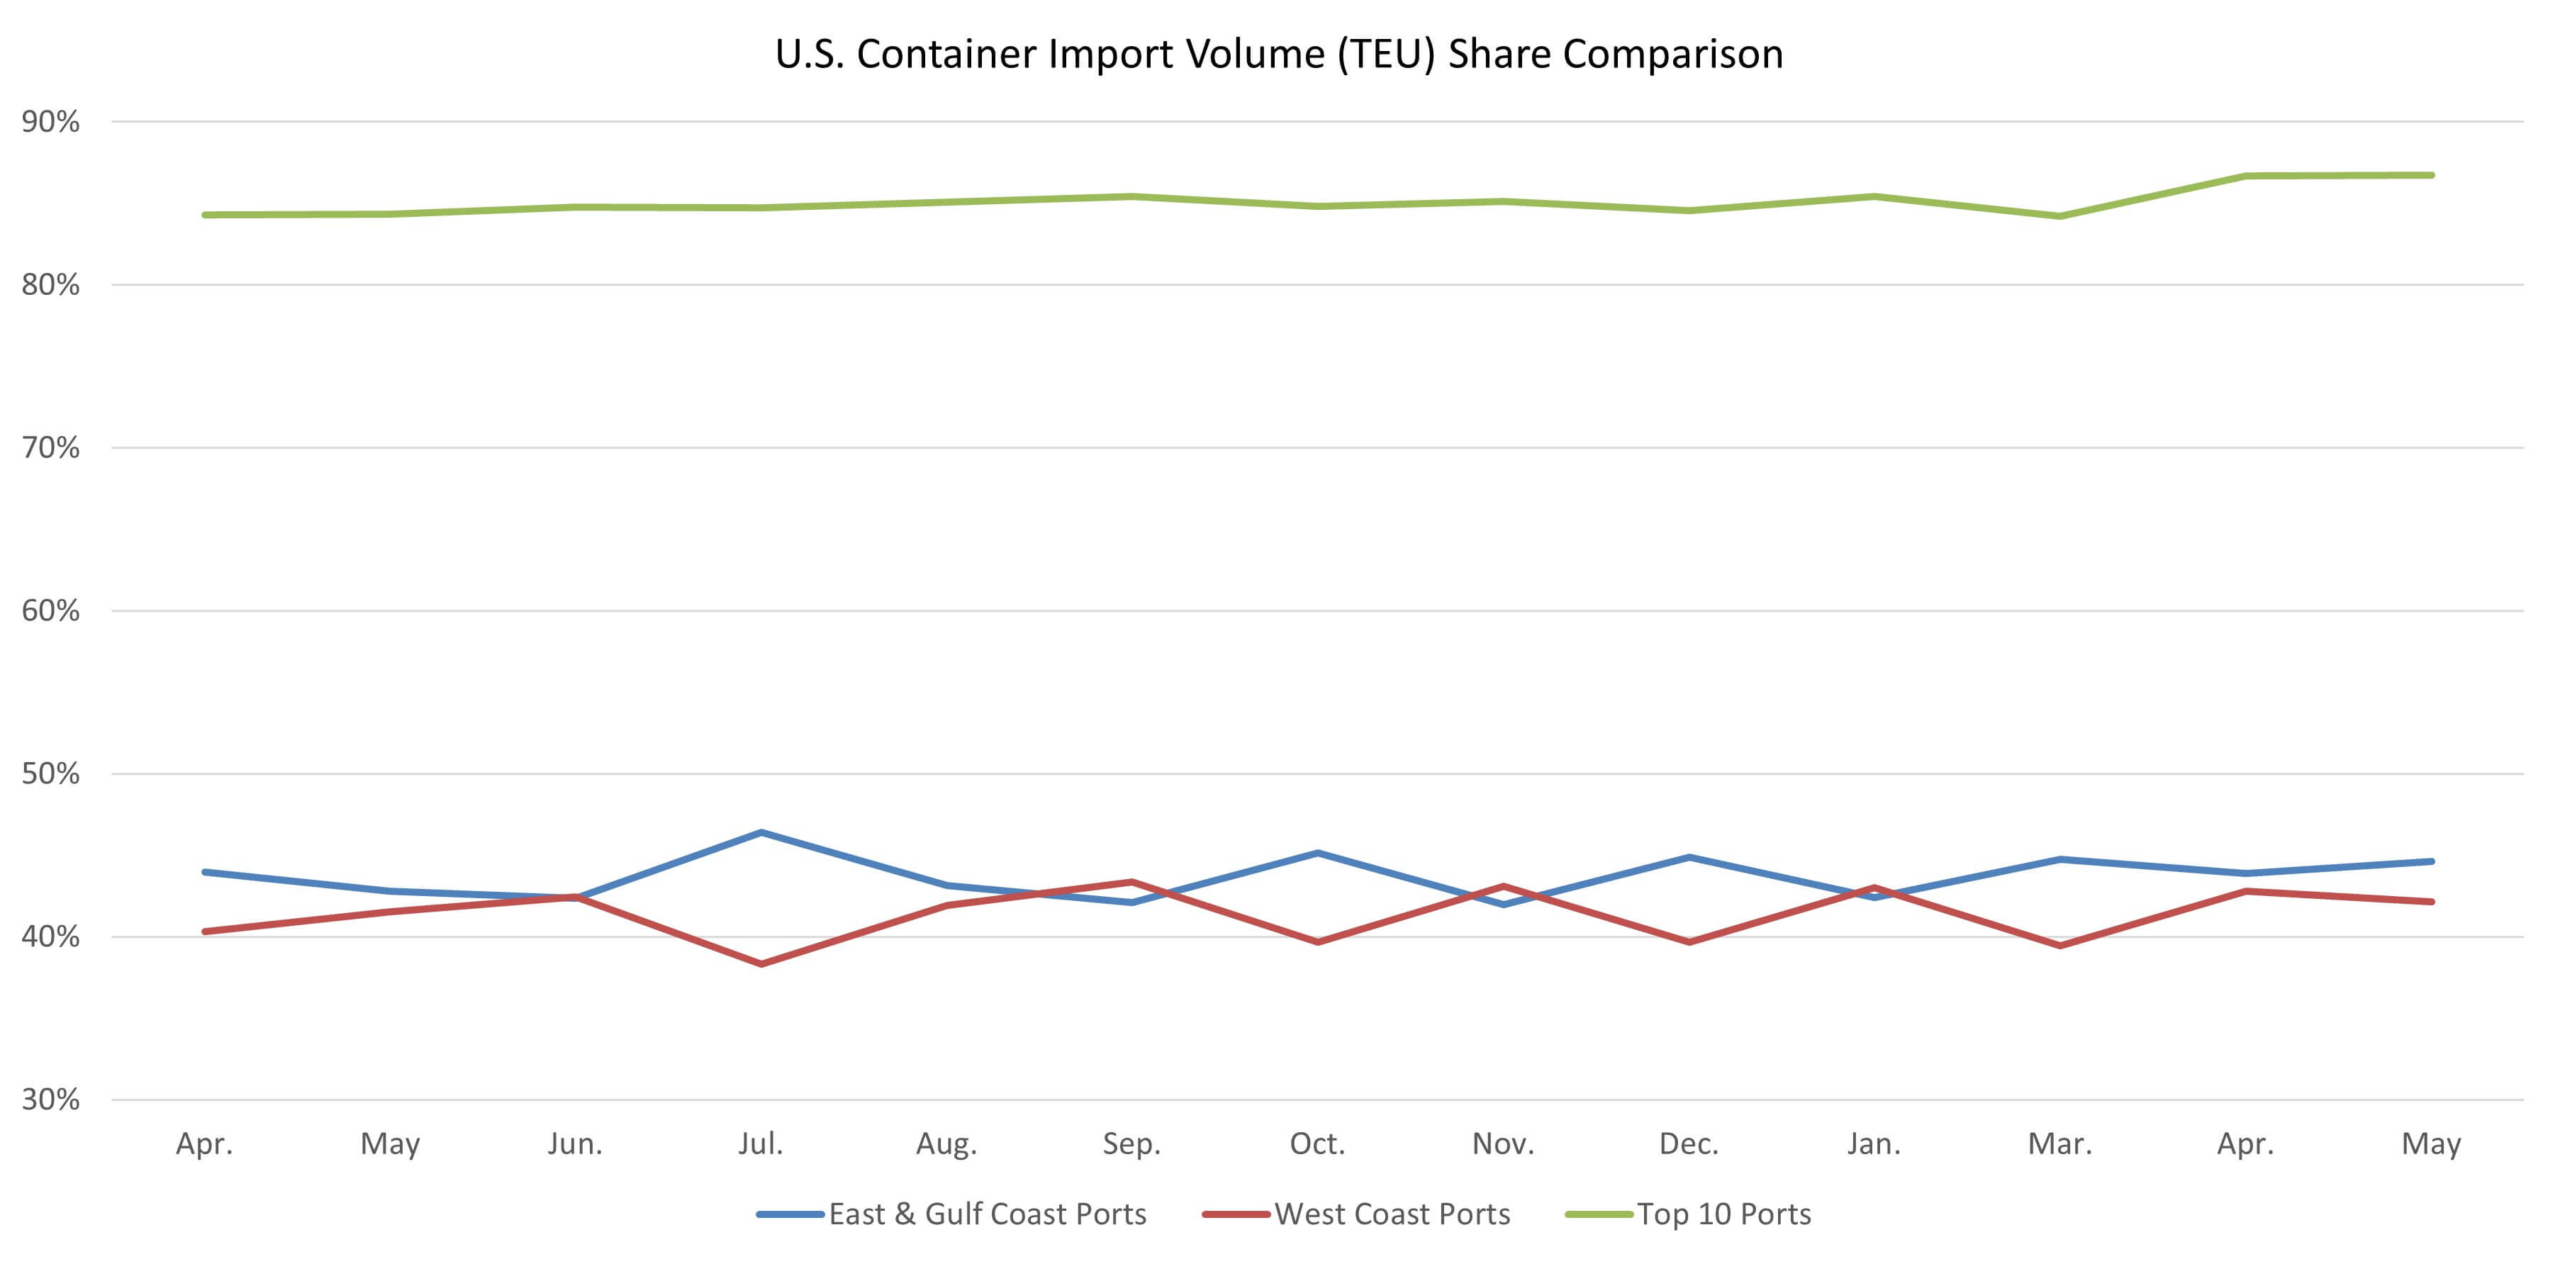
Descartes’s import data aligns with the NRF’s, showing over 2.3 million TEUs in May, a nearly 12% increase year-over-year and the highest number of imports since August 2022. Volumes got a significant boost from Chinese imports, which were up over 17% from April. The volume surge from China is unsurprising as retailers remain focused on restocking and shippers look to import goods before tariffs on Chinese imports increase starting in August. The East & Gulf Coast ports continue to handle slightly more imports than West Coast ports.
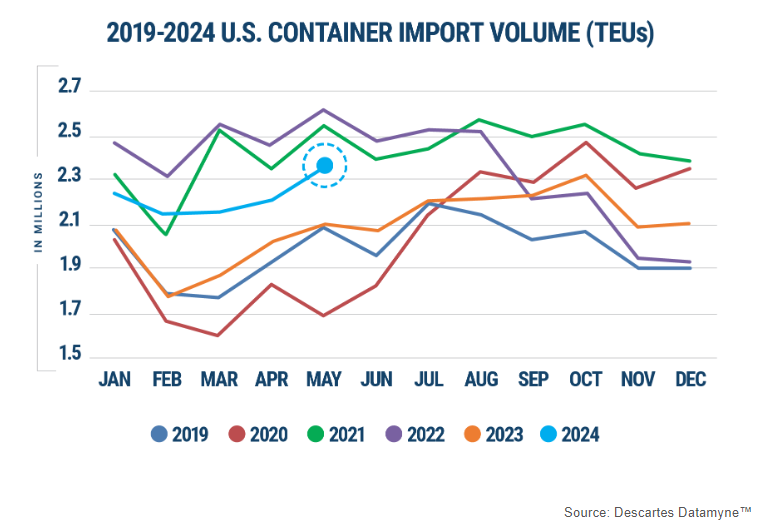 U.S. Container Import Volume 2019-2024, Descartes May 2024 Global Shipping Report
 U.S. Container Import Volume, Descartes May 2024 Global Shipping Report
Consumer health remains strong. However, industrial growth has setbacks. Total industrial production declined 0.4% month-over-month in April, and manufacturing declined 0.3% month-over-month. Both indices were also down year-over-year. Automotive and motor vehicle production remained strong, rising 2.8% month-over-month. Housing starts showed a strong increase in April but remain down 0.6% year-over-year. As a whole nothing points to any meaningful movement in truckload demand in either direction, but we will continue to monitor these industries as key drivers of freight demand fluctuations.
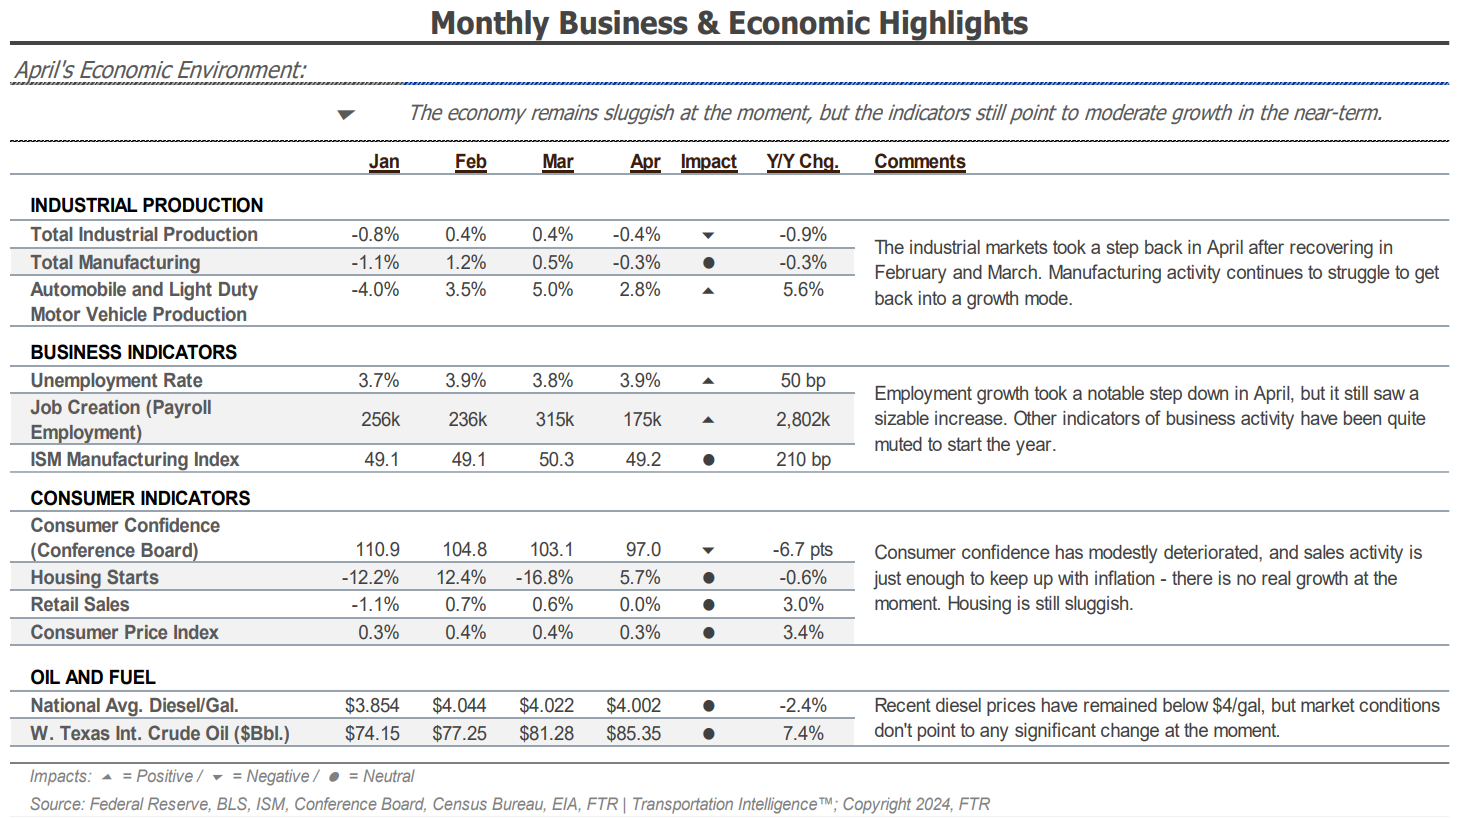 Monthly Business & Economic Highlights, FTR
FTR’s latest truck loadings forecast calls for 1.8% year-over-year growth in 2024, a positive revision from the 0.3% increase projected last month. Bolstering the change is a 3.6% projected increase for bulk freight, which just last month was expected to end the year down 2.2%.
Further, dry van loadings are forecasted to grow by 2.1%, up from last month’s 1.7% projection. Flatbed loadings will likely still fall this year, but the forecast has improved from a 1.4% decline to just 0.9%. These positive revisions bode well for the freight market and could signal a strong second half of the year for freight demand.
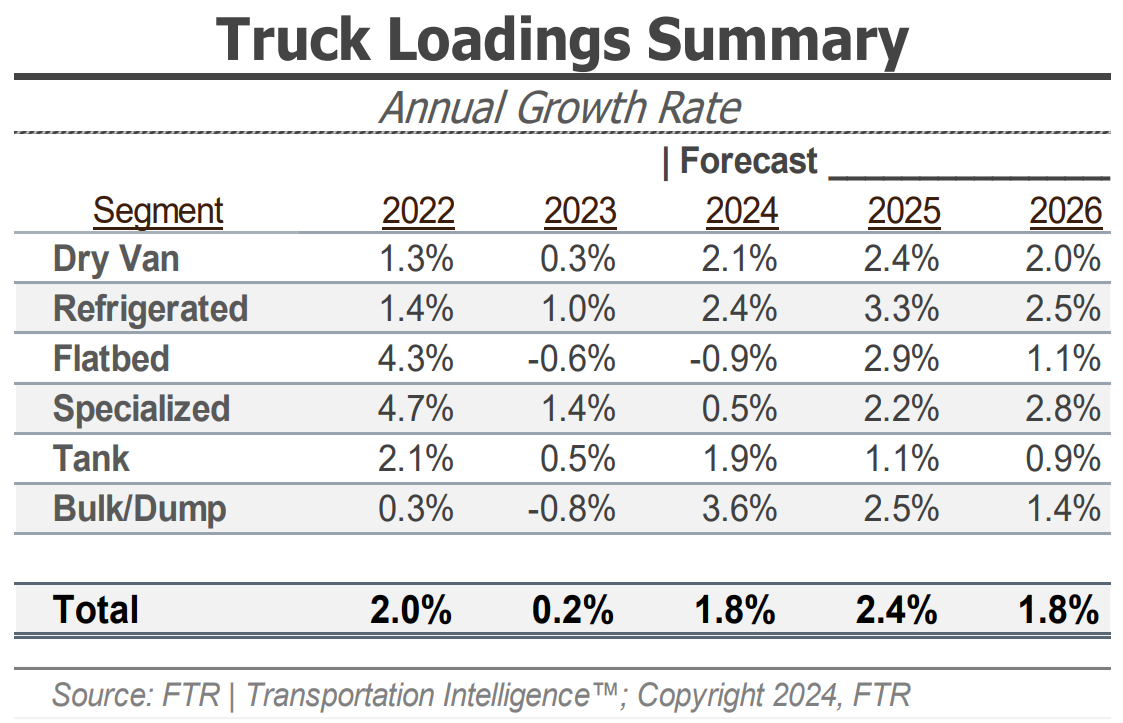 Truck Loadings Summary, FTR
CPI data was down from 3.4% in April to 3.3% in May, which is good news for consumers. The Fed announced that a single rate cut is likely in 2024, indicating that they believe that inflation will continue to cool. Rate cuts will likely trigger an increase in economic activity and spending as the cost of borrowing money declines. Ultimately, this will lead to increased freight demand, but it will still be several months before that demand materializes. We caution this being a trend of focus, as it is likely that rate cuts will also be accompanied by other less positive economic data, which could more than offset any gains that would come from slight declines in interest rates.
Bank of America card data showed overall spending increased by 0.7% year-over-year, marking the fourth consecutive month of positive year-over-year growth. Retail spending, excluding restaurants, remained down year-over-year but showed positive growth from April. On the other hand, services spending increased year-over-year despite a small pullback from April. Bank of America notes that Gen Z and Millenials accounted for about 30% of overall spending and 32% of households. In comparison, Gen X only accounted for 27% of total households but 34% of overall spending.
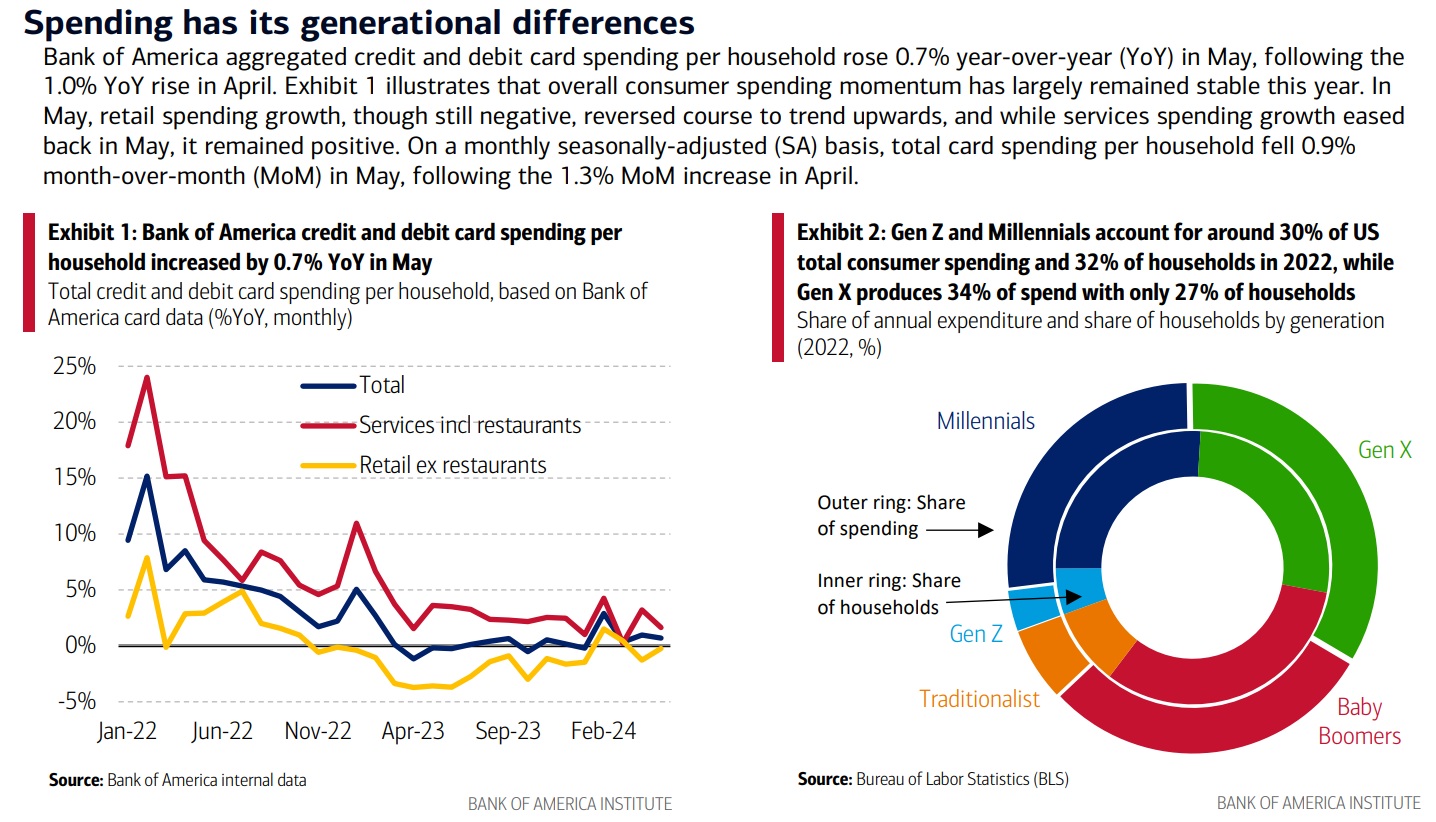 Bank of America Total Card & Generational Spending


