The freight market has largely followed typical seasonal patterns year-to-date, but some abnormal freight activity has been a clear side effect of recent tariff implementations and threats. Pull-forward volumes, alternative sourcing and supply chains stalling as they await tariff relief have caused temporary, unique demand fluctuations. In the case of Mexico and Canada, we have seen strong freight activity leading up to tariffs being followed by slowdowns once tariffs were live and in place.
Except for China, larger retaliatory tariffs on goods from other trade partners are paused until July 9th for negotiations. Once the pause ends, elevated tariffs on most imports are possible, meaning short-term volume gains will probably be temporary spikes.
Without tariffs, broader demand trends remain down, creating a moving target for supply and keeping rate disruptions minimal, aside from typical seasonal tightening. Should the downside risks to demand materialize, the chances of a sustained disruption in 2025 will become even less likely. With no clear evidence of upside risks to demand in the forecast, the chances of a disruption in 2025 were already looking subdued.
Supply-side trends are also adding complexity to this month’s narrative. With tender rejections up year-over-year across all modes, capacity is largely in equilibrium with demand and has become increasingly vulnerable to demand shocks. Trucking employment and carrier revocation data indicate stability as of late, evidence of more balanced conditions. With demand illustrating greater downside risk, equipment orders have fallen below replacement levels as carriers are not appearing optimistic about future freight conditions. This pattern makes sense but also sets the market up for increased risk of disruption if and when demand does make a meaningful recovery.
With that, the only certainty for the market seems to be more uncertainty ahead. From how broader economic trends will shape demand to whether or not capacity will falter under increased seasonal pressure, the next 90 days will reveal whether recent activity marks the beginning of a meaningful shift or is just another brief blip in the rebalancing cycle.
Keep reading for a closer look at the data behind these trends and what they could mean for your network in the months ahead.
David Spencer
VP of Market Intelligence
Key Takeaways
Weakening demand conditions have created a moving target for supply, with greater downside risks present.
The freight market will be tested again over the next 90 days. Seasonal demand from produce season and the 100 Days of Summer will put upward pressure on rates and tighten capacity, especially as supply indicators point to increased sensitivity to demand shocks compared to recent years.
Capacity is stabilizing into a slow-burn environment as carriers rightsize to create highly efficient networks.
With tender rejections already elevated heading into produce and summer peak season, van rejections could surpass 10% if current trends continue.
Rates continue to follow typical seasonal patterns, with no nationwide spot rate volatility expected until at least DOT Roadcheck week in mid-May.
The economy and consumer spending remain resilient, helping support a stable freight environment as we head further into 2025. However, uncertainty around tariffs and broader economic conditions is likely to keep businesses and consumers cautious regarding major spending decisions in the near term.
Truckload Demand
Looking Back
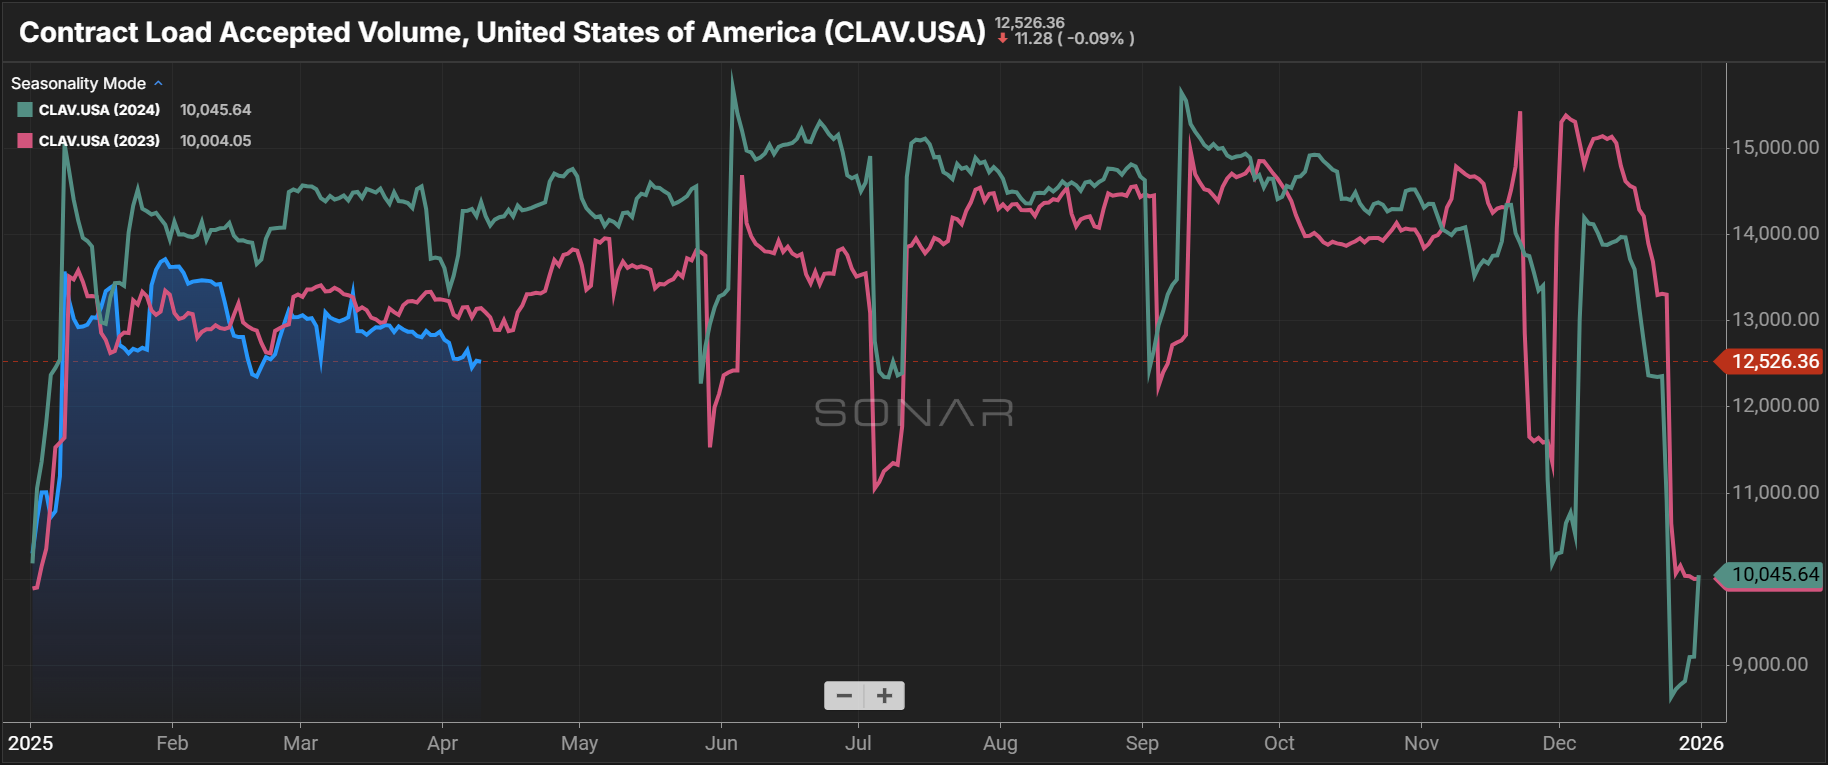
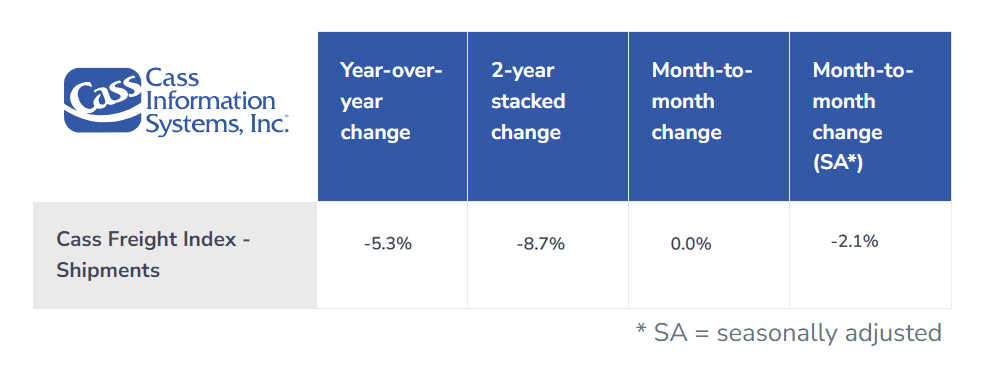
Demand weakness has created a moving target in the balancing of the truckload freight market. This is reflected in the ongoing decline of the Contract Load Accepted Volume Index (CLAV) since October 2024 and further illustrated by Cass Freight Index data, which shows a 5.3% year-over-year and 8.7% two-year stacked decline in shipment volumes.
Tariff-related uncertainty has positively and negatively impacted freight demand as shippers react to rising costs of imported raw materials and finished goods from global trade partners. Spot load volumes jumped significantly from February to March, rising 22% year-over-year as shippers pulled freight forward to mitigate tariff risks. Additional business days and the end-of-quarter push in March further contributed to the increase. Flatbed activity led the way, surging 39% as shippers moved up shipments of steel, aluminum and other tariffed materials. Flatbed rejections also spiked, and spot rates climbed well above 2024 levels.
March import data supports this narrative. Total import volumes increased as shippers front-loaded freight, while imports from China—which faced a 10% tariff on February 4th and another 10% on March 4th—declined. Meanwhile, volumes from other key trade partners rose, suggesting a clear shift in sourcing strategies to minimize tariff exposure.
Looking Ahead
The freight market will be tested again over the next 90 days. Seasonal demand from produce season and the 100 Days of Summer will put upward pressure on rates and tighten capacity, especially as supply indicators point to increased sensitivity to demand shocks compared to recent years.
Shifting trade flows add another layer of complexity. Heavy tariffs on China and paused tariffs on other global trade partners could accelerate the rerouting of freight away from West Coast ports and into East and Gulf Coast entry points, as importers rush to purchase goods from paused countries ahead of potential tariff implementation. This added volume would further strain capacity in already busy regions like the Southeast.
The tariff landscape remains one of the most significant market risks, as any extension or expansion of current policies could trigger more pull-forward activity and introduce downside risk to normal freight patterns heading into Q3.
View Related Data
Contract Load Accepted Volume, SONAR
Chart Notes
Contract Volumes Continue to Show Weakness: SONAR accepted contract volumes have trended downward since late Q3 2024 and remained roughly 10% lower year-over-year in April. Easing demand continues to shift the supply-demand balance, keeping rates relatively stable.
DAT Trendlines
Chart Notes
Spot Market Tightens Year-Over-Year and Month-Over-Month: DAT data showed spot volumes increased by 22.2% year-over-year, and truck postings fell by 28.9% year-over-year, evidence of a more balanced market. Flatbed load postings, up 39%, and Dry Van load postings, up 15%, drove this increase despite flat year-over-year growth in refrigerated load postings.
Cass Freight Index Report – March 2025
Chart Notes
Cass Freight Index Illustrates Easing Demand: Year-over-year and two-year stacked changes show continued demand weakness in March. A 2.1% seasonally-adjusted decline on a month-over-month basis is evidence of demand softening after implementing tariffs with Canada and Mexico.
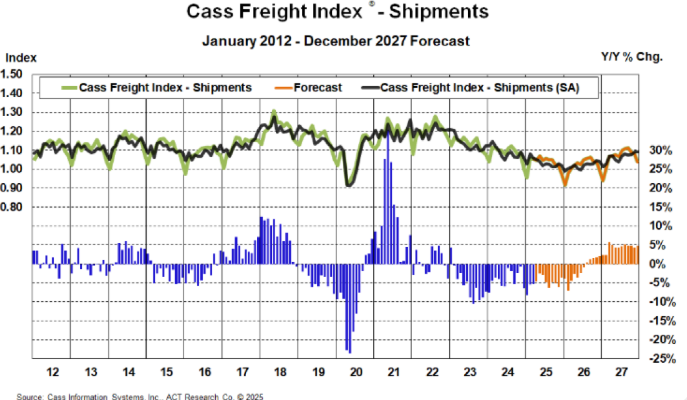
Cass Freight Index Shipments Forecast – March 2025
Chart Notes
Continued Demand Weakness Likely in 2025: In their latest truckload demand forecasts, ACT Research and Cass acknowledged the noticeable—but not catastrophic—impact of tariffs on volumes in 2025. With demand expected to remain soft, the likelihood of a sustained market disruption appears low for now.
Descartes U.S. Container Import Volume
Chart Notes
Imports Remain Strong, For Now: Descartes data shows imports increased by 11% from March 2024 to March 2025, likely reflecting pull-forward activity ahead of potential tariffs.
Descartes U.S. Container Import Volume Share Comparison
Chart Notes
Shifting Port Dynamics Amid Trade Tensions With China: Imports increased month-over-month in March despite a 12.6% decline in TEUs from China, America’s largest ocean trade partner. The rise in volumes from other regions, coupled with the pullback from China, is shifting port dynamics, with East and Gulf Coast ports gaining market share. These changing trade flows could significantly impact equipment and capacity balances in the market.
Manufacturing at a Glance, Manufacturing ISM
Chart Notes
Manufacturing Contracts: The ISM Manufacturing Index has contracted again after two months of expansion, which had snapped a 26-month streak of contraction.
Demand Weakens Despite Recent Strength: Indicators of weakening demand include declining new orders and contracting new export orders and order backlogs. Notably, output also weakened.
Monthly Business & Economic Highlights, FTR
Chart Notes
Economic Indicators Hold Steady, but Risks Remain: Economic conditions appear largely stable, heading into heightened uncertainty. Given the effects of pull-forward activity and other disruptions to typical behavior, the data is difficult to interpret. Significant downside risks remain, even if they have yet to surface in the data.
Truckload Supply
Looking Back
With tender rejections trending above 2024 levels, capacity continues to signal greater balance and a reduced ability to support demand shocks across the three major modes. Van and reefer supply trends show signs of tariff-related strain, though reefer equipment has followed more consistent seasonal patterns.
The sharp rise in flatbed rejections and load-to-truck ratios—driven by tariff-related demand coinciding with the onset of flatbed peak season—could offer early insight into what to expect during the summer peak for van and reefer equipment. As freight volumes remain elevated, rejection rates and spot rate volatility are likely to surpass 2024 levels.
Carrier exits have slowed, but growth remains mostly stagnant. March had the highest number of new entrants since September 2024, yet revocations still outpaced new authorities, resulting in flat net growth. That uptick may be seasonal and driven by reinstatements or the return of smaller carriers. Overall, the carrier population remains near a cycle low.
Looking Ahead
With tender rejections already elevated heading into produce and summer peak season, van rejections could surpass 10% if current trends continue—a threshold historically associated with market disruption. These conditions suggest supply and demand are nearing equilibrium, meaning even a modest volume surge could trigger significant supply tightening.
At the same time, weakening demand may limit the duration of any disruption. Spot market volatility could ease rapidly once seasonal peaks pass without sustained pressure. Carrier population growth will be a key variable to watch—if soft demand continues and more capacity exits the market, conditions will become increasingly vulnerable to sudden increases in truckload volumes.
View Related Data
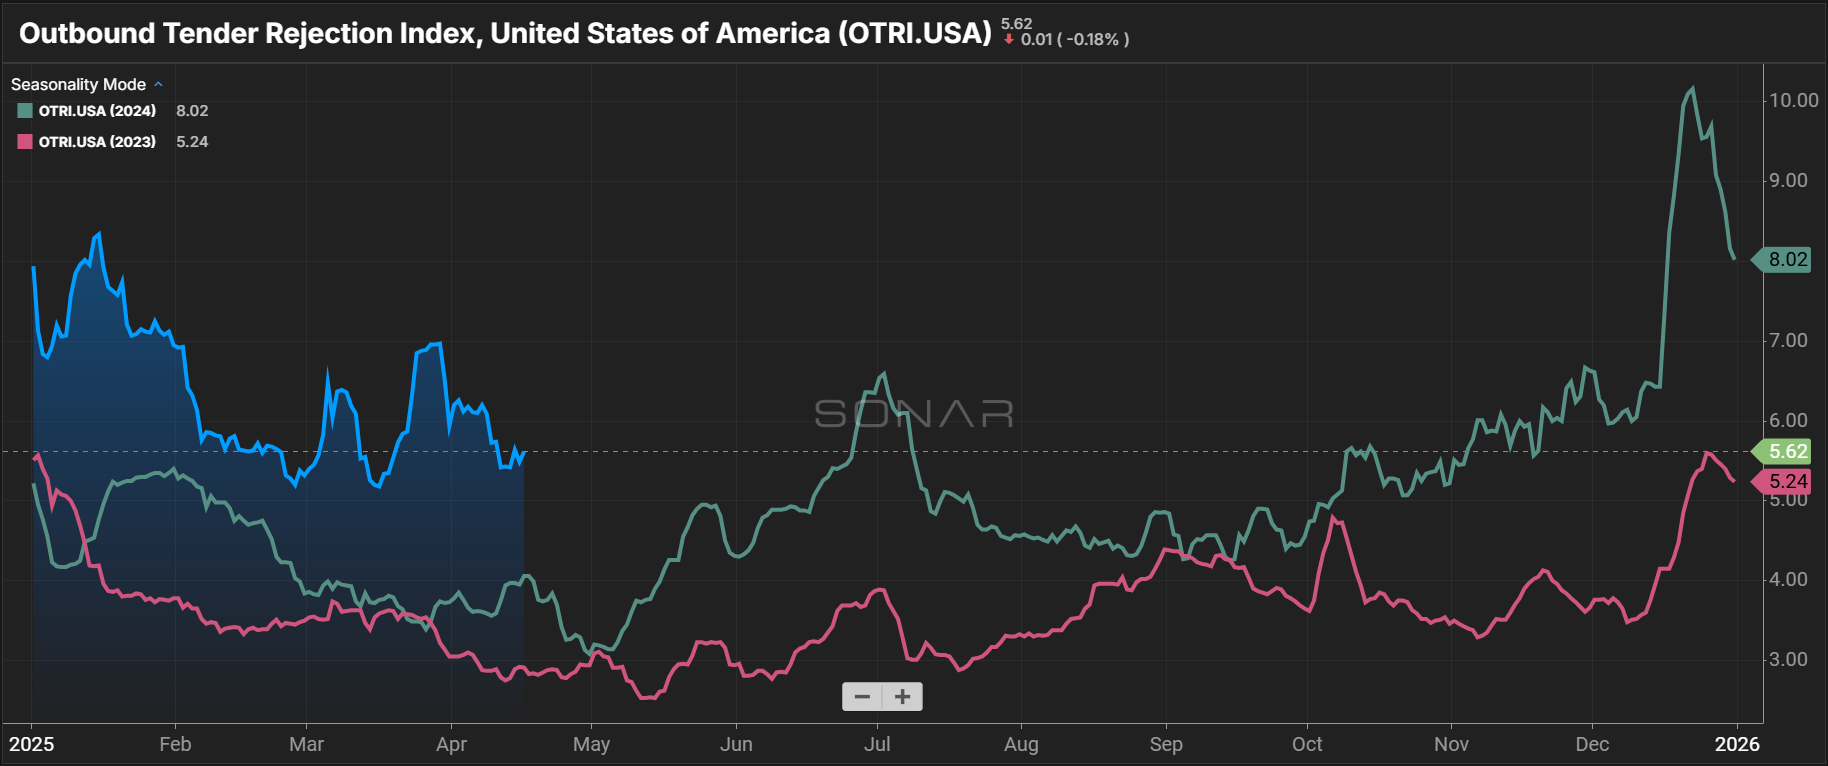
Outbound Tender Reject Index, SONAR
Chart Notes
Tender Rejections Elevated in Early 2025: The Sonar OTRI Index, inclusive of all equipment types, rose briefly as tariffs temporarily rattled the market. It has since settled back to February levels, but strong flatbed rejections keep the global measure elevated.
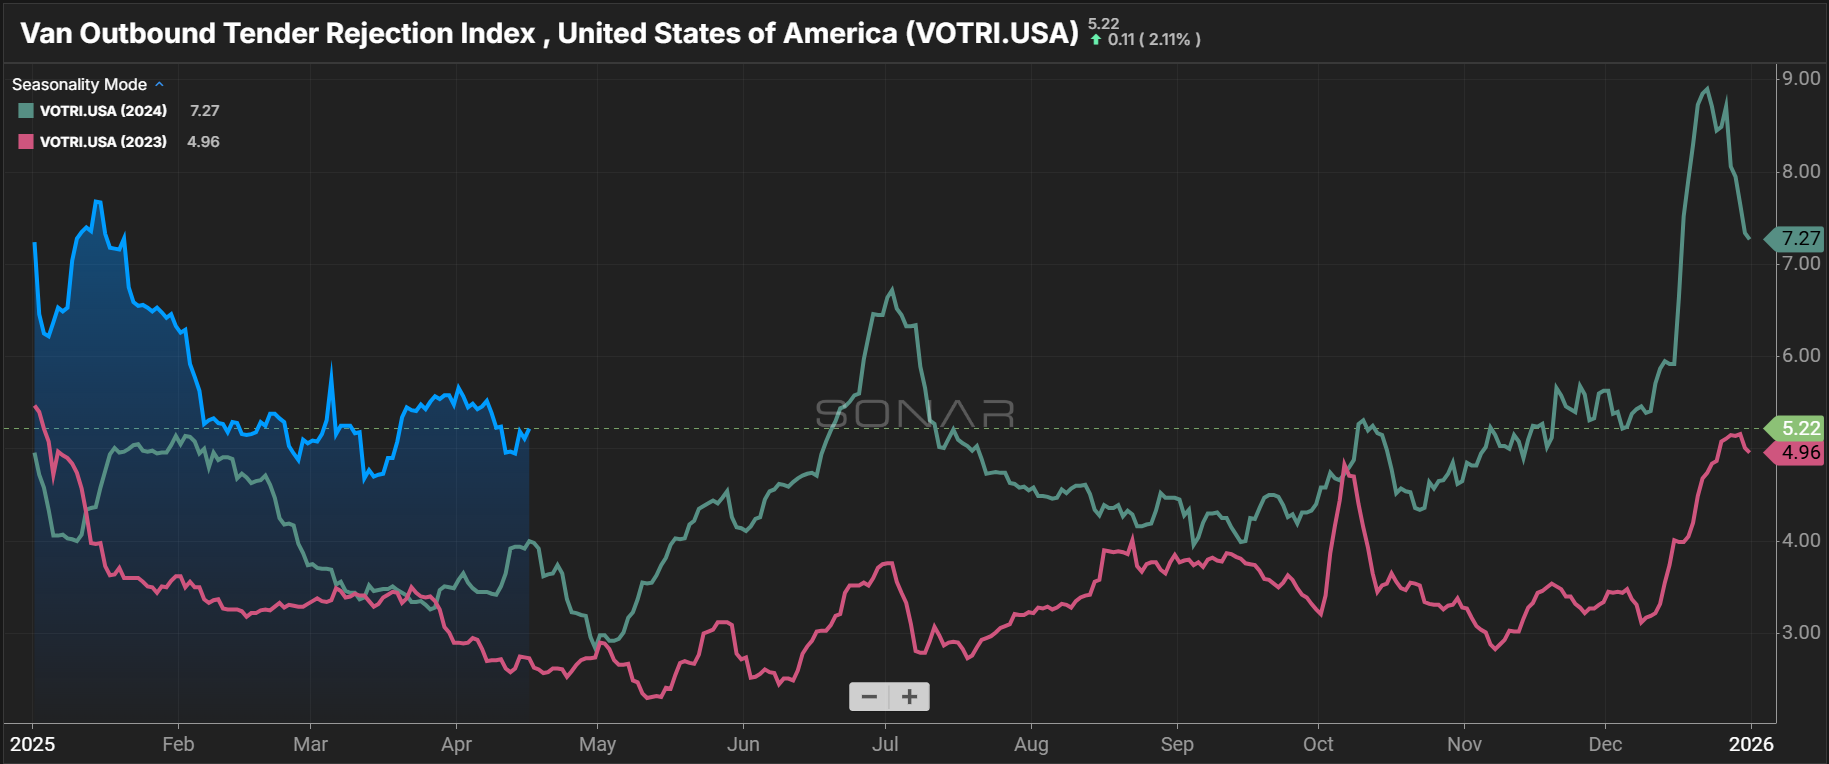
Van Outbound Tender Rejection Index, SONAR
Chart Notes
Dry Van Tender Rejections Trending Above 2024 Levels: Dry van rejections are trending higher than last year as tariff disruptions limited the usual seasonal easing. However, overall rejection rates remain manageable.
Summer Peak Will Be Next Market Test: Spot rate volatility during the summer and winter peak seasons offers a chance to gauge the health of shipper routing guides. With rejection rates trending upward from 2024, the lead-up to the Fourth of July will be the market’s next true test.
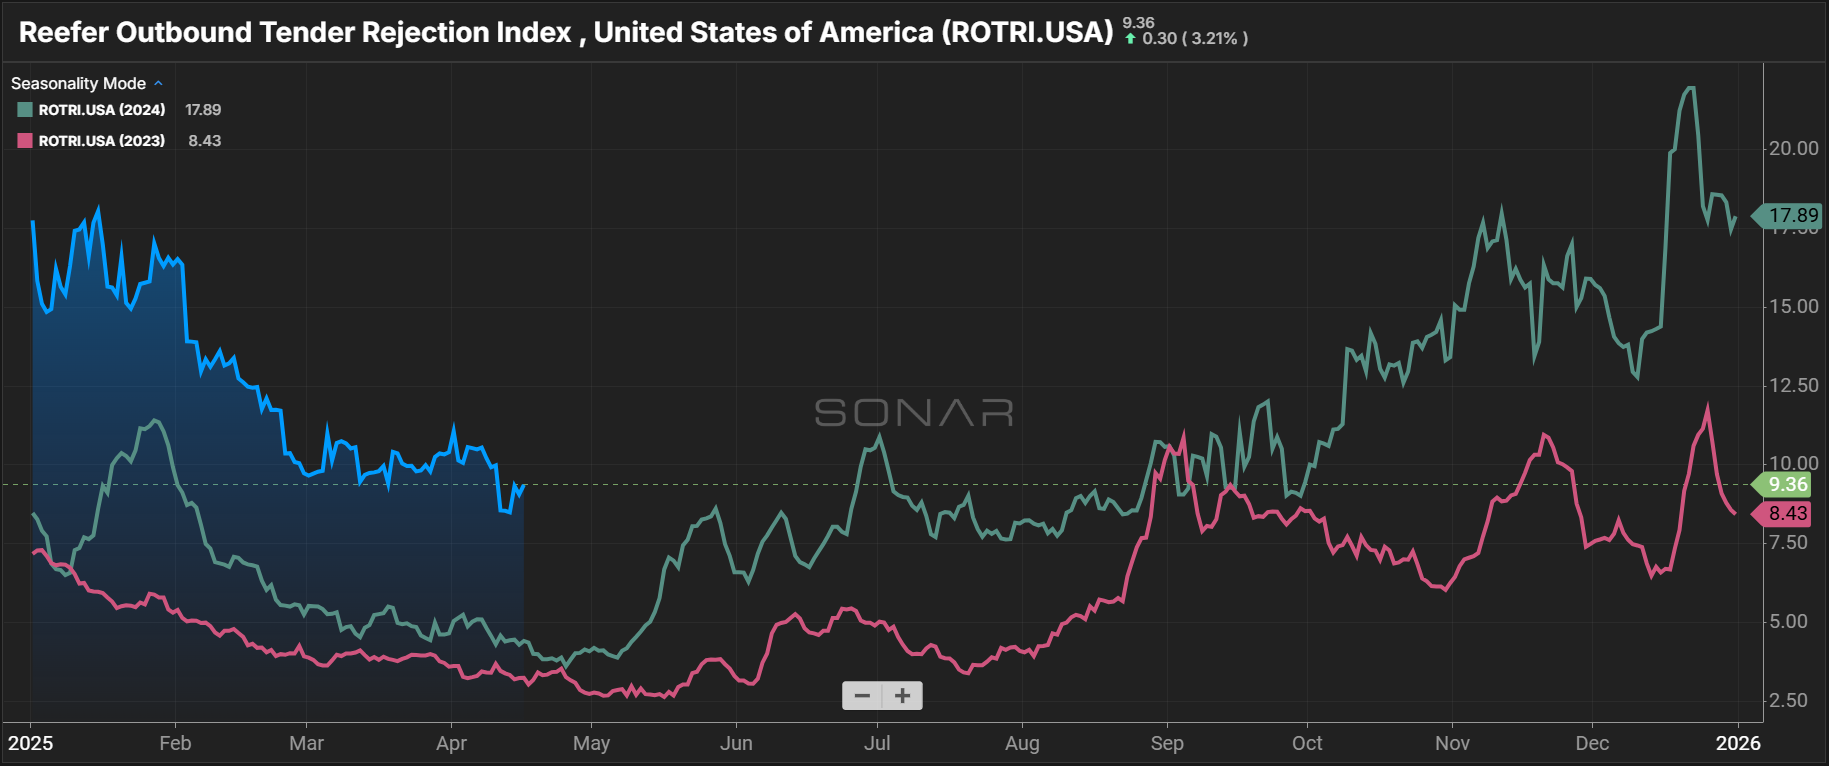
Reefer Outbound Tender Rejection Index, SONAR
Chart Notes
Reefer Tender Rejections Less Impacted by Tariff Disruptions: Reefer rejections have followed a more typical seasonal curve than van and flatbed equipment. However, with Q4 peak season rejection rates exceeding 20% and current levels still elevated above 2024, shippers that rely heavily on reefer capacity could face challenges during this year’s summer peak.
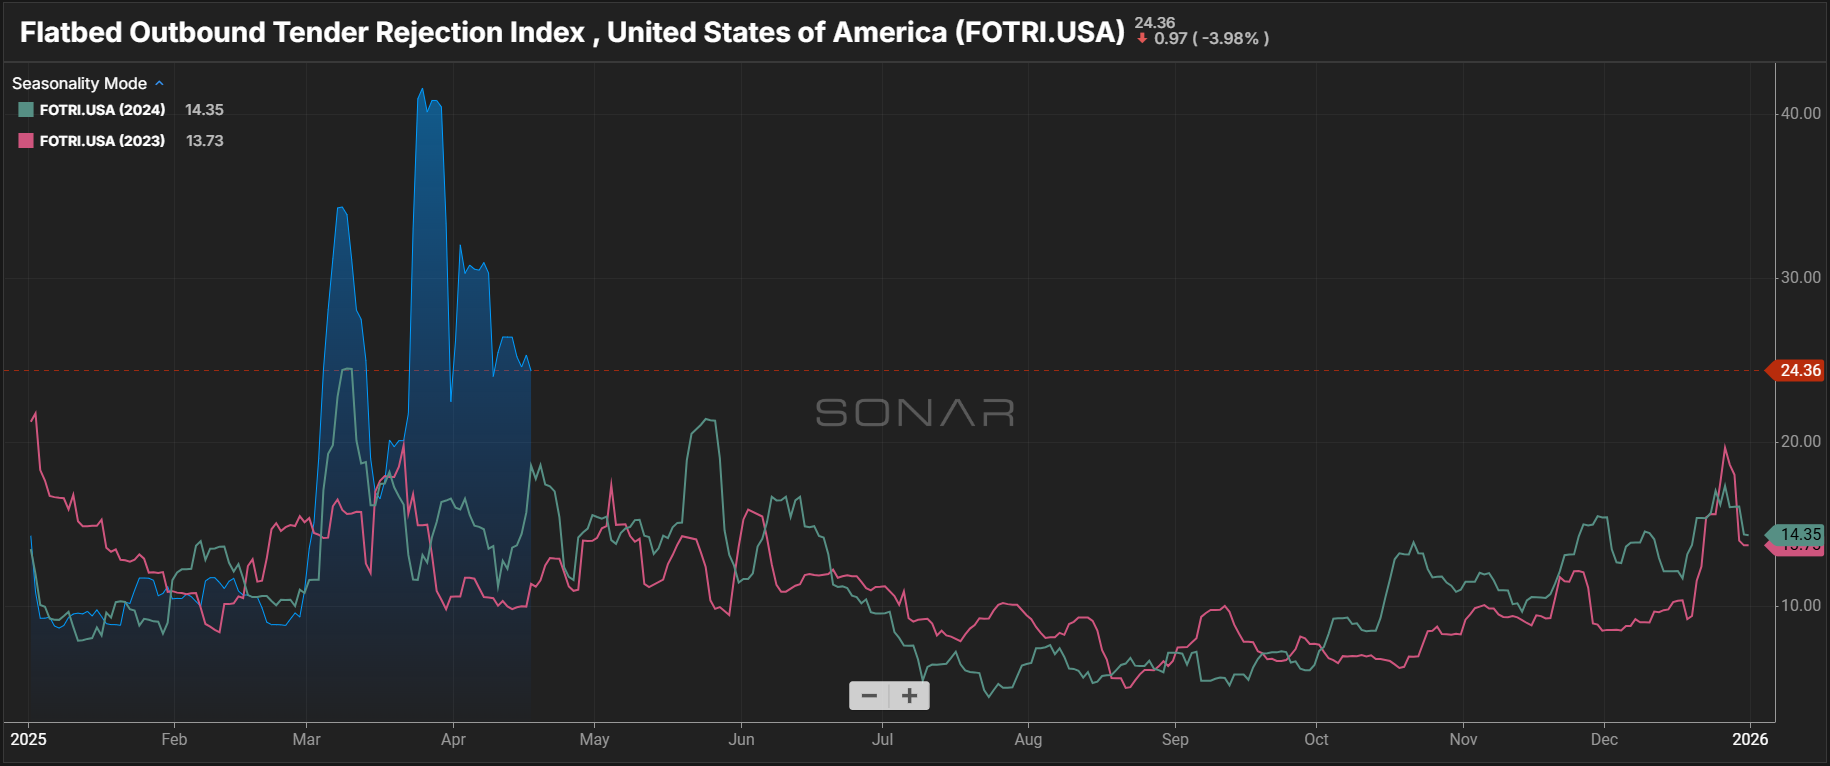
Flatbed Outbound Tender Rejection Index, SONAR
Chart Notes
Flatbed Rejection Rates Climb Above Prior Years: Tariff-disrupted activity coincided with the onset of open-deck seasonality, significantly exposing routing guides over the past month. The flatbed spot market has been highly active of late, showing how conditions might shape van and reefer equipment during the summer peak season.
Van, Reefer & Flatbed Load-to-Truck Ratios
Chart Notes
Van Ratios Remain Stable as Reefer Ratios Ease: Van and reefer load-to-truck ratios remain elevated compared to prior years, reflecting a similar narrative to tender rejection data. Both typically rise from April to May as summer peak season begins, making the next month one to watch closely.
Flatbed Load-to-Truck Ratios Rise Sharply: Flatbed equipment has shown signs of significant tightening in 2025. Load-to-truck ratios reflect this trend, and recent activity indicates further increases in April.
Morgan Stanley Dry Van Freight Index
Chart Notes
Morgan Stanley Index Shows Relatively Seasonal Behavior: The index indicates that capacity availability across all three equipment types is trending close to historical averages. Van and reefer equipment will likely ease through early May, with conditions expected to tighten by mid-year. Well into its peak season, the flatbed market is outperforming 2024 trends.
Carrier Revocations, New Carriers & Net Change in Carrier Population, FTR
Chart Notes
Carrier Revocations Slow: According to FTR, the number of authorized for-hire trucking firms declined by 11, as new entrants nearly matched those exiting the market. The slower rate of decline is further evidence of more balanced conditions following three years of net losses.
Class 8 Tractor Retail Sales, ACT Research
Chart Notes
Tractor Sales Trend Below Replacement Levels: With sales in both January and February falling below replacement levels, the U.S. Class 8 tractor fleet contracted for the first time in three years.
Monthly Change in Trucking Jobs, FRED Economic Data
Chart Notes
March Employment Growth: In an unexpected turn, total trucking employment posted the largest single-month gains since the height of the pandemic. Declines were expected, but tariff-related pull-forward activity and a surging flatbed market likely contributed to short-term employment growth.
Active Truck Utilization, FTR
Chart Notes
Truck Utilization Shallows: FTR’s updated Truck Utilization forecast has declined and now looks to remain under 95% through mid-2026. The lower estimate is partly due to revisions in their historical data and signals that carriers could face further challenges in optimizing the utilization of their equipment.
U.S. Class 8 Tractors Backlog & Backlog/Build Ratio, ACT Research
Chart Notes
Backlog / Build Ratio Falls: The class 8 tractor backlog/build ratio fell to 8.1 months in February, down from 9.0 months in January. As trucking conditions remain poor, backlog accumulation is likely to ease.
For-Hire Driver Availability Index, ACT Research
Chart Notes
Driver Availability Loosening: According to ACT Research, February was the 33rd consecutive month the index has been loosening. They indicate that a large factor behind this sustained availability could be struggling owner-operators turning in their authorities and becoming available to larger fleets.
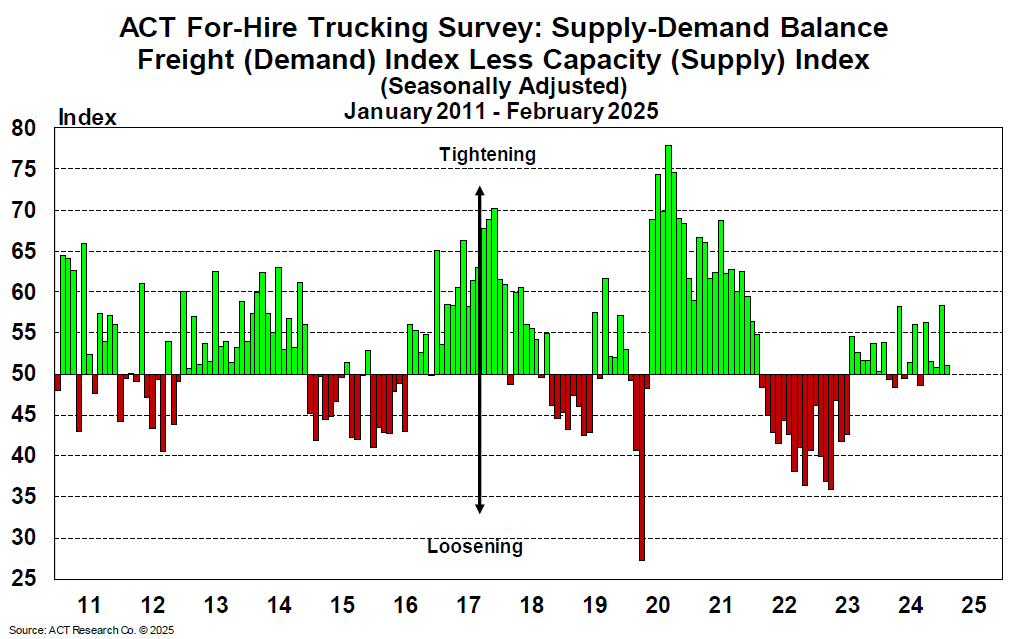
For-Hire Trucking Survey: Supply-Demand Balance, ACT Research
Chart Notes
Balance Growth Slows: The Supply-Demand balance grew slower as freight volumes decreased and capacity contracted at a slower rate. Despite the continued tightening trend, trade-war-impacted demand is likely to result in an extended period of more balanced conditions.
Truckload Rates
Looking Back
Rates largely followed seasonal norms in March and early April. Dry van rates fell $0.02 per mile from February to March, while reefer rates dropped $0.08. Both modes are now approaching their seasonal floors ahead of the summer peak. Despite these declines, year-over-year comparisons are showing an increase. As of April, dry van linehaul rates are up 3.3% from 2024 levels, while reefer rates are up 1.1%.
Meanwhile, a demand surge has pushed flatbed spot linehaul rates up $0.16 per mile since February, bringing year-over-year gains to 8.1%—a trend that reflects flatbed rejections and tightening supply.
As spot rates eased, the spot-contract rate gap widened across van and reefer equipment types. The dry van gap grew from $0.29 per mile in January to $0.42 in April, and reefer widened from $0.23 per mile to $0.48 over the same period, indicating pricing stability in the near term.
Looking Ahead
Seasonal rate pressure is expected to build through May and into July as produce season continues and the summer peak season begins. Dry van and reefer rates may begin rebounding from recent floors, though the pace of recovery will depend on how demand trends evolve through early summer.
Flatbed rates are expected to continue rising in the coming months, supported by ongoing demand strength and tightening capacity. If these trends continue, the market may see year-over-year gains this peak season.
While the widening spot-contract gap points to less immediate risk of rate volatility, any sharp demand shock—especially in already tight regions—could close that gap quickly and create short-term pricing pressure.
View Related Data
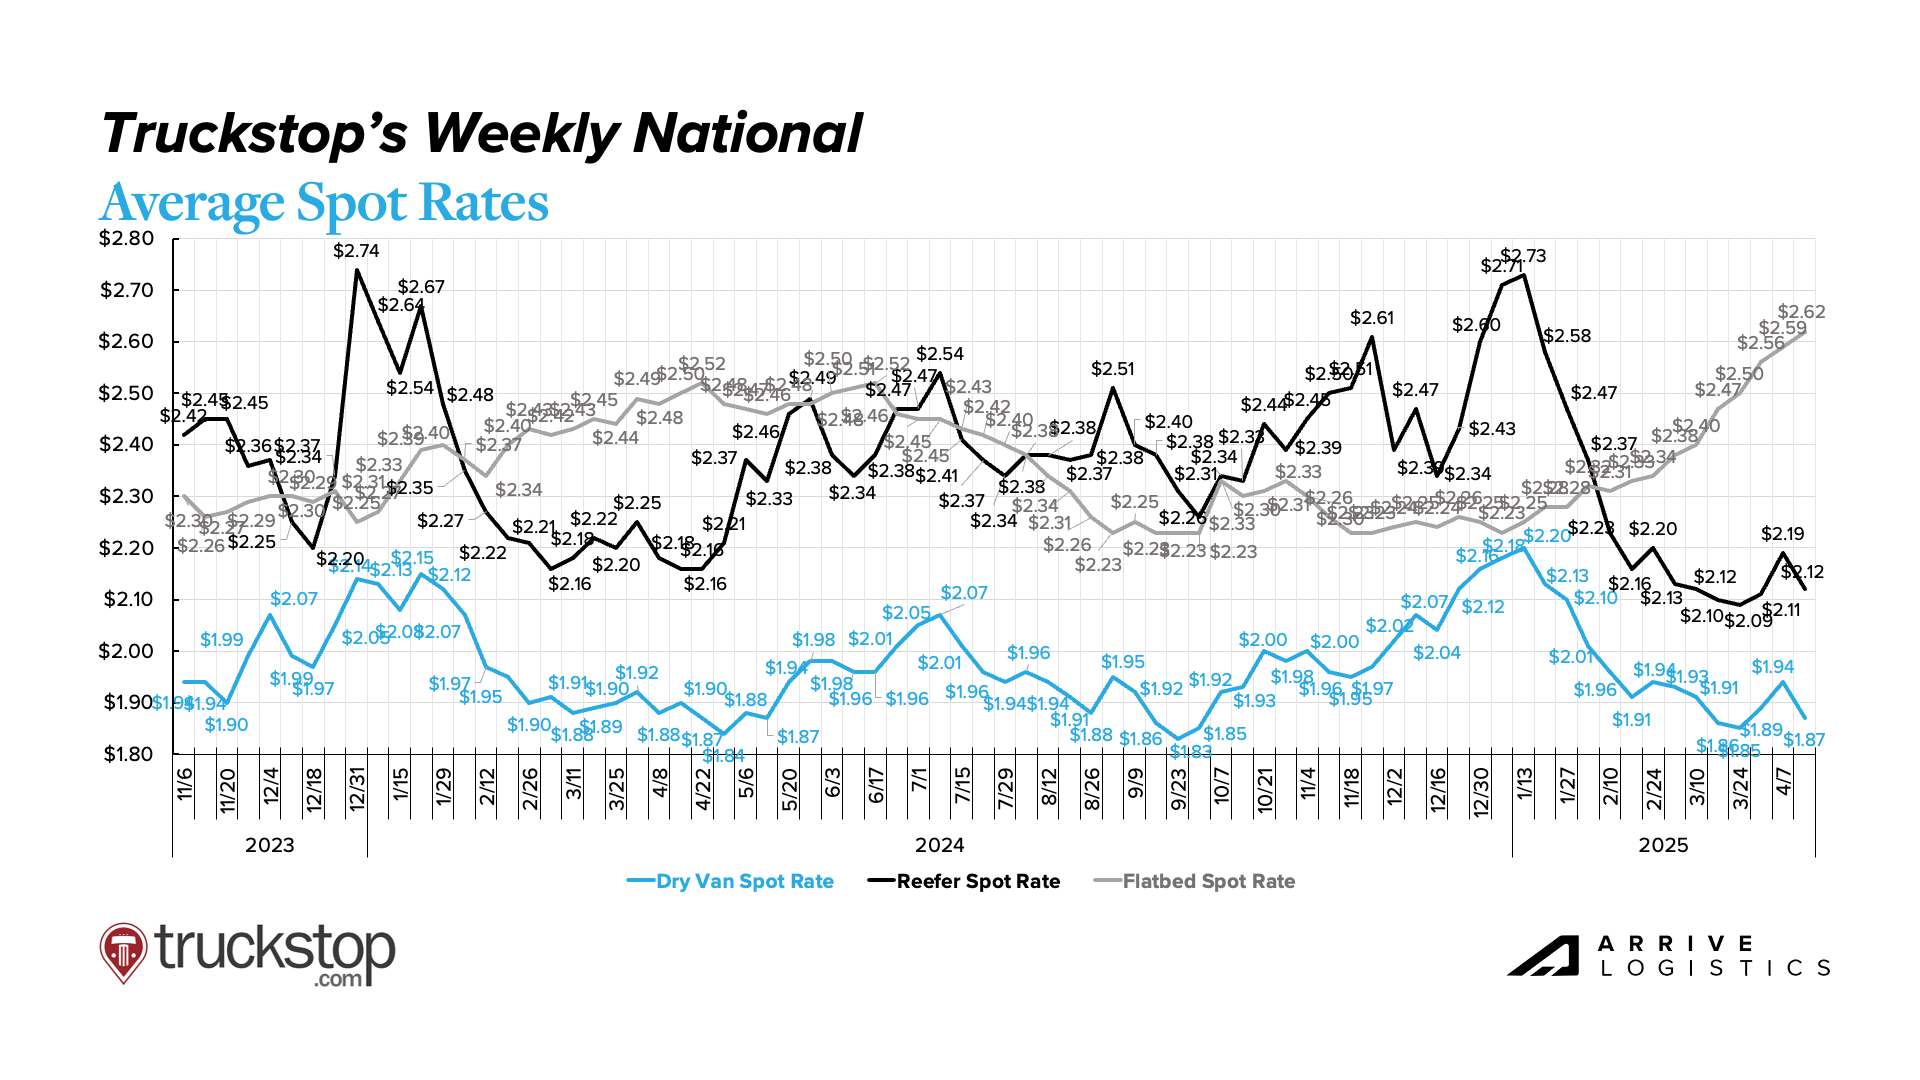
Truckstop Weekly National Average Spot Rates
Chart Notes
Rates Following Seasonal Norms: Van and reefer rates have followed highly similar patterns and currently sit almost perfectly in line with levels seen a year ago. Flatbed rates are increasing rapidly and are outpacing 2024 levels.
DAT Monthly Rate Trends
Chart Notes
Van and Reefer Decline: All-in dry van and reefer rates were down $0.03 and $0.08 per mile, respectively, in March. Van rates are down $0.02 per mile, and Reefer rates are flat month-to-date in April.
Flatbed Rates Increasing: All-in flatbed rates jumped $0.09 per mile in March and have continued to climb at a similar pace, currently up $0.07 per mile month-to-date in April.
DAT Fuel Trends
Chart Notes
April Diesel Prices Trend Downward: After falling in March from a six-month high in February, the national average diesel price rose slightly over the full month of April. However, it has eased in recent weeks and is now down more than 10% from $4.02 per gallon in April 2024.
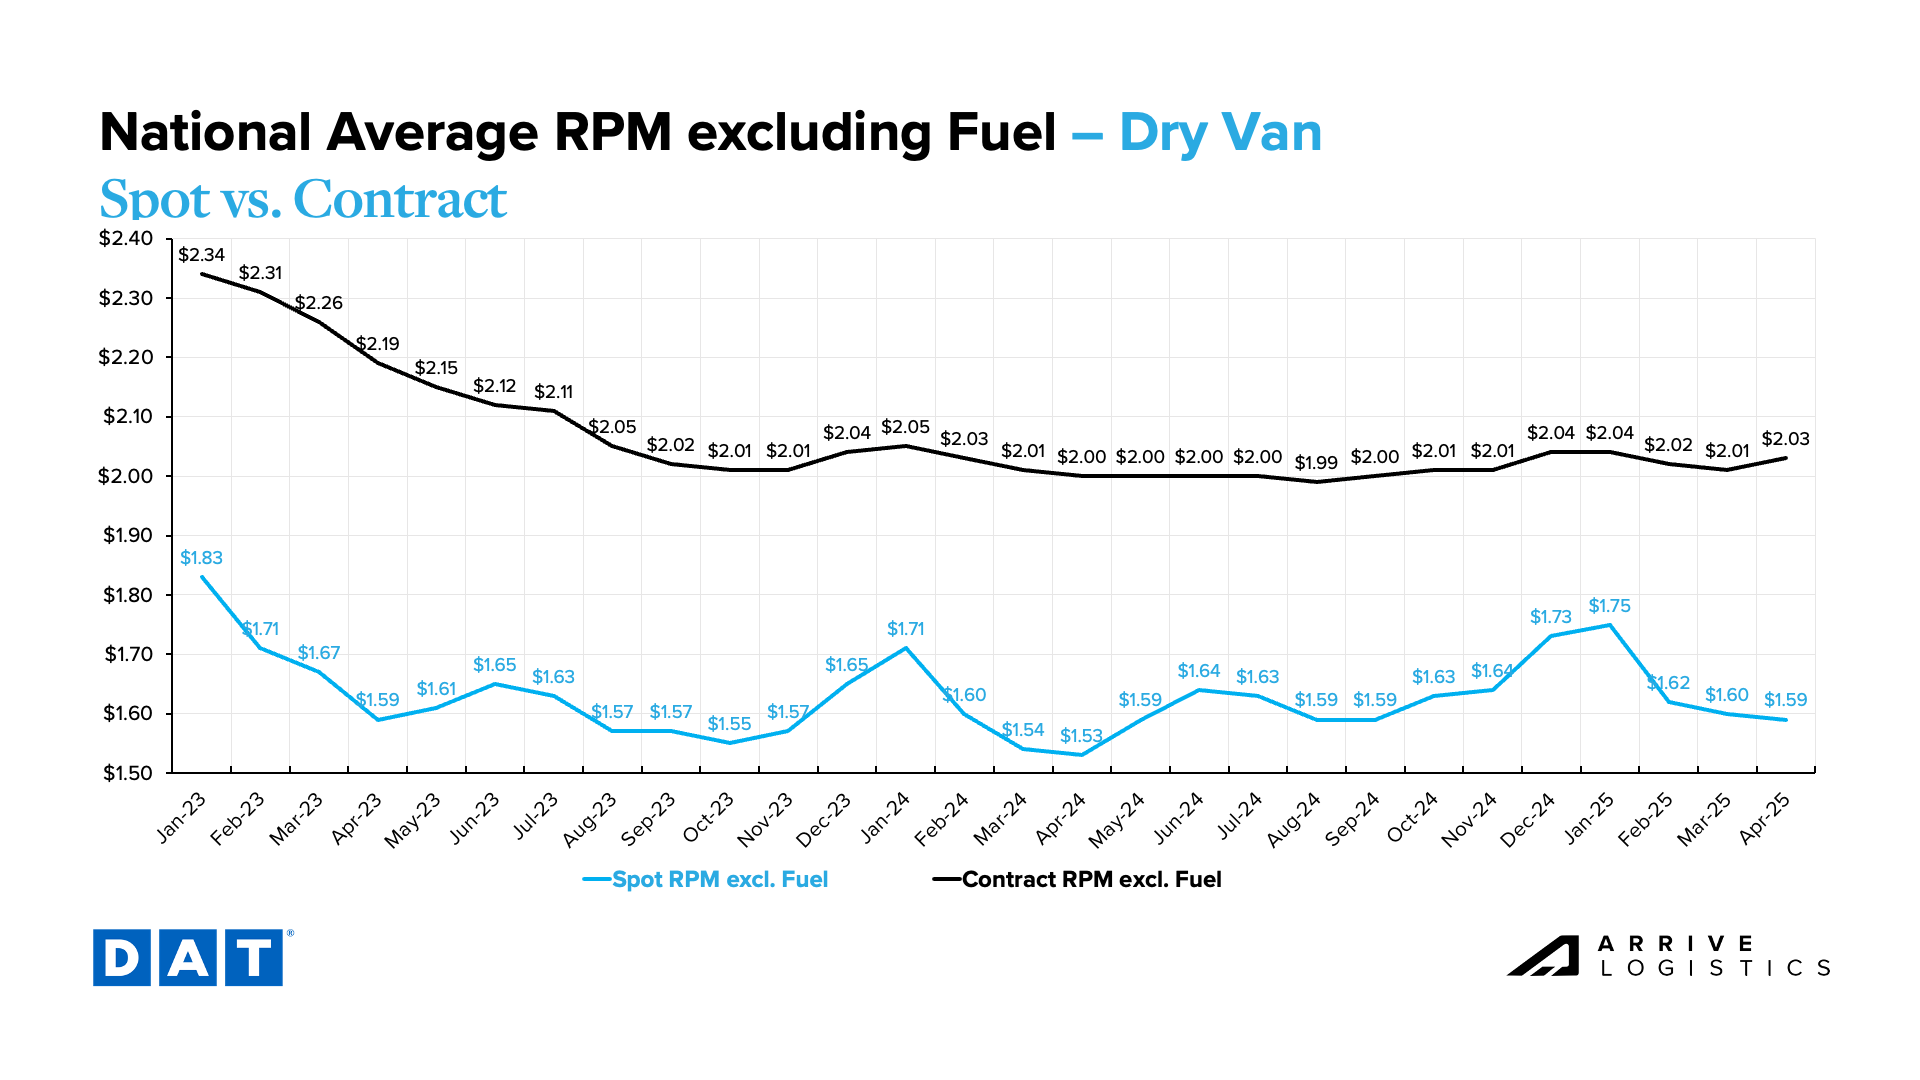
DAT Dry Van National Average RPM Spot vs. Contract
Chart Notes
Dry Van Linehaul Rates Continue to Slide in April: Typical for this time of year, spot linehaul rates were relatively stable in March, falling $0.02 per mile month-over-month and settling near a seasonal floor ahead of the summer peak season. Year-over-year, spot rates are up 3.3% from $1.53 per mile in April 2024.
Spot-Contract Rate Gap Widens as Spot Rates Fall: The dry van spot-contract gap has increased from a cycle low of $0.29 per mile in January to $0.42 per mile in April as spot rates eased in line with seasonal norms. A narrower gap typically signals increased market sensitivity to disruption.
DAT Temp Controlled National Average RPM Spot vs. Contract
Chart Notes
Reefer Linehaul Rates Continue Slide in April: Typical for this time of year, reefer spot linehaul rates eased in March, decreasing by $0.08 per mile, and are settling to a floor ahead of the summer peak season. Year-over-year, spot linehaul rates are currently up 1.1% from $1.82 per mile in April 2024.
Spot-Contract Rate Gap Widens as Spot Rates Fall: As spot rates eased in line with seasonal norms, the reefer spot-contract gap increased from a cycle low of $0.23 per mile in January to $0.48 per mile in April. As noted with dry van rates previously, a narrower gap typically signals increased sensitivity to disruption.
DAT Flatbed National Average RPM Spot vs. Contract
Chart Notes
Flatbed Linehaul Rates Rise Sharply: Strong flatbed demand has driven spot linehaul rates up by $0.16 per mile since February, with additional increases likely over the next few months. Year-over-year, flatbed spot linehaul rates are up 8.1% from $1.97 in April 2024.
Economic Conditions
Looking Back
Inflation has leaned toward the downside in recent months, which is positive news for consumers. The Fed, however, is still indicating it plans to be patient with any changes to interest rates. The labor market has also remained relatively stable, with the unemployment rate hovering around 4.2%, a sign that no indications of fracture are present yet.
Consumer spending has shown modest growth, even though sentiment indicators have trended somewhat negatively. That contrast suggests households are still willing to spend, particularly on essentials, though discretionary spending has shown some early signs of softening amid economic concerns among consumers.
Looking Ahead
Inflation will likely remain somewhat of a wildcard in the coming months. While conditions indicate the Fed will hold off on further rate increases, any renewed inflationary pressure or economic challenges could quickly shift that stance in either direction.
Ongoing uncertainty around the impact of tariffs and overall economic conditions will likely keep businesses and consumers playing it safe with major spending decisions in the near term. Whether or not this caution is justified, its impact on capital deployment and consumer behavior will be important to watch in the coming months.
View Related Data
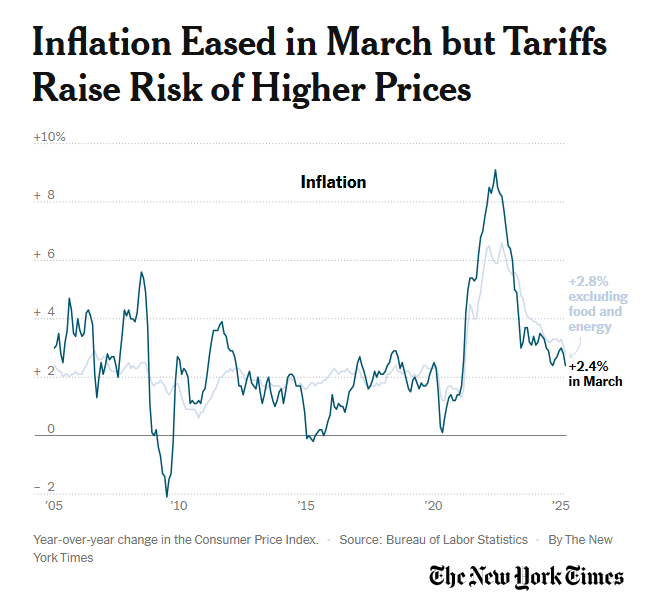
Consumer Price Index, New York Times
Chart Notes
Inflation Eased as Prices Dropped in March: The CPI eased more than expected in March. While the reading is positive, tariffs are still expected to increase prices later in the year. The Fed faces a difficult decision but will likely remain cautious, monitoring how the economy responds to ongoing uncertainty—limiting any near-term boost to freight demand from potential rate cuts.
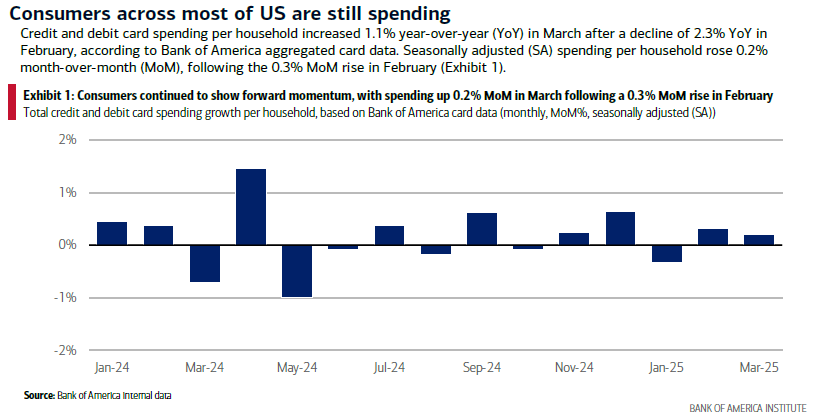
Bank of America Total Card Spending, Bank of America Consumer Checkpoints
Chart Notes
Consumer Spending Strength Holds: Bank of America reported that seasonally adjusted household spending rose 0.2% month-over-month in March and is up 1.1% year-over-year, following a 2.3% decline in February. The threat of future price increases could bolster spending and support truckload demand in the near term.
Employment Situation – March 2025, U.S. Bureau of Labor Statistics
Chart Notes
Unemployment Little Changed: The unemployment rate has remained in a narrow range of 4.0% to 4.2% since May 2024. A stable labor market supports healthy consumer spending, which should continue to bolster freight demand.
Multimodal Notes
Cross-Border Canada
Freight volumes are down since tariffs went live, with carriers left dealing with downward pressure on rates.
Due to tariff uncertainty and the upcoming Canadian federal election, many shippers are holding off on cross-border activity.
Political considerations contribute to delays—Former Bank of Canada governor and current Liberal Party leadership contender, Mark Carney, is reportedly hesitant to make any trade deals ahead of the election due to potential political fallout.
A “buy Canadian” sentiment is gaining traction domestically, which could be impacting demand for U.S. imports. One notable example: Canadian liquor stores recently pulled American bourbon from shelves.
Cross-Border Mexico
Capacity remains tight in the Bajío region, particularly near Querétaro and Guanajuato, driven by seasonal produce and increased demand from the automotive sector.
Transit delays have increased slightly at key border crossings, including Laredo and El Paso, due to heightened inspections and northbound congestion.
Volumes dipped 15–20% to start April, which aligns with typical seasonal slowdowns. However, uncertainty around tariffs is also prompting some shippers to pause activity until there’s more clarity. Volume is expected to pick back up toward the end of the month.
Mother’s Day, Holy Week and the ongoing produce season will keep capacity tight through May, particularly for reefer and dry van loads moving out of western Mexico.
Read about Open Deck
Open Deck
The load-to-truck ratio is above 40:1 for the first time since May 2022.
Spot rates have risen $0.23 per mile since the start of the year, including a $0.13 increase over the last three weeks.
Morgan Stanley reports the sharpest LTR increase since early COVID-era disruption in 2021.
Frontline feedback confirms tightening capacity and upward pressure on spot rates.
Navigate the freight market with confidence.
Get this free report delivered straight to your inbox every month.
Matt Pyatt is the Chief Executive Officer of Arrive Logistics. He co-founded Arrive with President Eric Dunigan in 2014 after building his career at Command Transportation. As CEO, he is responsible for overseeing the company’s financial health, strategic vision and culture, as well as building a scalable leadership team to support Arrive’s growth.
Subscribe to receive freight market updates
"*" indicates required fields
Subscribe to receive freight market updates
Quick Apply
"*" indicates required fields
Arrive Carrier Requirements
Please have the following info ready to complete registration
MC, MX, DOT, or state reg #
Tax ID & W9 info
Cert of Insurance: $100k cargo, $1M Auto, & $1M commercial general liability coverage
Freight fraud continues to impact our industry. We encourage shippers and carriers to reach out to Arrive immediately if there is ever a shipment in question that may be subject to fraud (including fictitious actors and websites). Arrive will not ask you to pay upfront for any dedicated lane or committed capacity program. If the offer you are receiving sounds too good to be true or unrealistic, it may be fraud.Arrive Logistics recommends verifying all communications come from our registered email domain is @arrivelogistics.com and notes that access via VPN or Proxy is prohibited on Arrive systems. Our 24/7 phone number is 888-861-0650 and our leadership team can also be reached at feedback@arrivelogistics.com.
Use of Cookies
We use cookies to enhance your browsing experience, serve personalized ads or content, and analyze site traffic. By continuing to use this website, you acknowledge and consent to our use of cookies as detailed in our privacy policy.
Get Access to the Shipper Portal
Current Customers
Already shipping with Arrive?
Connect with your representative to get access to your ARRIVEnow Shipper Portal. Can’t connect with your rep? Use this form to reach out.
New Customers
Not shipping with Arrive yet?
If you’re not an Arrive customer, please join our network to access the portal.
Scott Sandager is the Chief Administrative Officer at Arrive Logistics. He joined Arrive in 2018, bringing over 14 years of logistics and brokerage experience, with expertise in project and change management, organizational design, talent development and customer satisfaction. Scott previously held many diverse roles of increasing responsibility with AFN, a Chicago-based freight brokerage.
Eric Dunigan, President & Co-Founder
Eric Dunigan is the President of Arrive Logistics. He began his career at Command Transportation before co-founding Arrive with Matt Pyatt in 2014. As president, he is responsible for driving revenue and growth, as well as leading the Strategic Partnerships team — a veteran group of supply chain experts who work with Arrive’s customers to reimagine their shipping strategy.
Start shipping with Arrive
"*" indicates required fields
David Spencer, VP of Market Intelligence
David Spencer is the Vice President of Market Intelligence at Arrive Logistics. David joined Arrive in 2017 after spending six years at AFN focused on business intelligence. His department provides critical market data and expert analysis to internal teams and publishes monthly market updates for shippers and carriers under the Arrive Insights banner.
Andrew Clarke, Board Chair, Arrive Logistics and Global Critical Logistics
Andrew Clarke is Board Chairman for Global Critical and DCLI, Inc., and a board member for Arrive Logistics and Element Fleet Management Corp. His 20 years of global transportation and logistics experience include time as CFO of C.H. Robinson, CEO of Panther Expedited Services, Inc. and SVP and CFO roles at Forward Air Corporation.
Dean Croke, Principal Analyst at DAT Freight and Analytics
Dean Croke is a Market Analyst at DAT Solutions, where he focuses on freight market intelligence and data analytics. His 35 years of experience with data analytics, transportation, supply chain management, mining and insurance risk management include time as co-founder of FleetRisk Advisors and in a number of other high-level roles with FreightWaves, Spireon, Lancer Insurance, Omnitracs Analytics (formerly Qualcomm) and more.
Asanka Jayasuriya, CTO and Partner at 8VC
Asanka Jayasuriya is the CTO at 8VC. He is an accomplished engineering and product leader with 20+ years of experience in the cloud. He has a strong background in enterprise SaaS, PLG products, infrastructure, and security. Notably, he served as CTO and SVP of Engineering at SailPoint, leading their successful transition to the cloud and successful exit event. He also held senior leadership roles at InVision, Atlassian, and Amazon, driving growth, operational excellence, and innovation. At 8VC, Asanka works with the entrepreneurs and leaders in our portfolio as a virtual CTO supporting their growth.
Chad Eichelberger, President at Reliance Partners
Chad Eichelberger is the President of Reliance Partners. Since 2015, he’s leveraged his extensive experience in risk management, compliance, best practices and contracts to lead the company’s logistics and truck insurance strategy and operations. Chad was previously the President of Access America Transport, where he led the company from $8M to over $600M in revenue.
Barry Conlon, CEO & Founder at Overhaul
Barry Conlon is the CEO and founder of Overhaul, the global leader in active supply chain risk management and intelligence. With a remarkable career spanning over 30 years in supply chain security, he is widely regarded as a trailblazer in modern-day supply chain security standards and best practices.
Tim Denoyer, VP and Senior Analyst at ACT Research
As VP and Senior Analyst at ACT Research, Tim analyzes commercial vehicle demand and alternative powertrain development (i.e. electrification), and authors the ACT Freight Forecast, U.S. Rate and Volume Outlook. He previously spent fifteen years in equity research focused primarily on the transportation, machinery, and automotive industries, and co-founded leading equity research firm Wolfe Research.