Need Help
close button

How can we help?

Select One:
Arrive Insights™

May 2025 Freight Market Update

Table of Contents

Market Memo

From the Desk of David Spencer

Tariff policy conversations have taken center stage in recent months, with speculation about demand destruction dominating media headlines as shifting trade dynamics create strategic complexities for supply chain stakeholders.

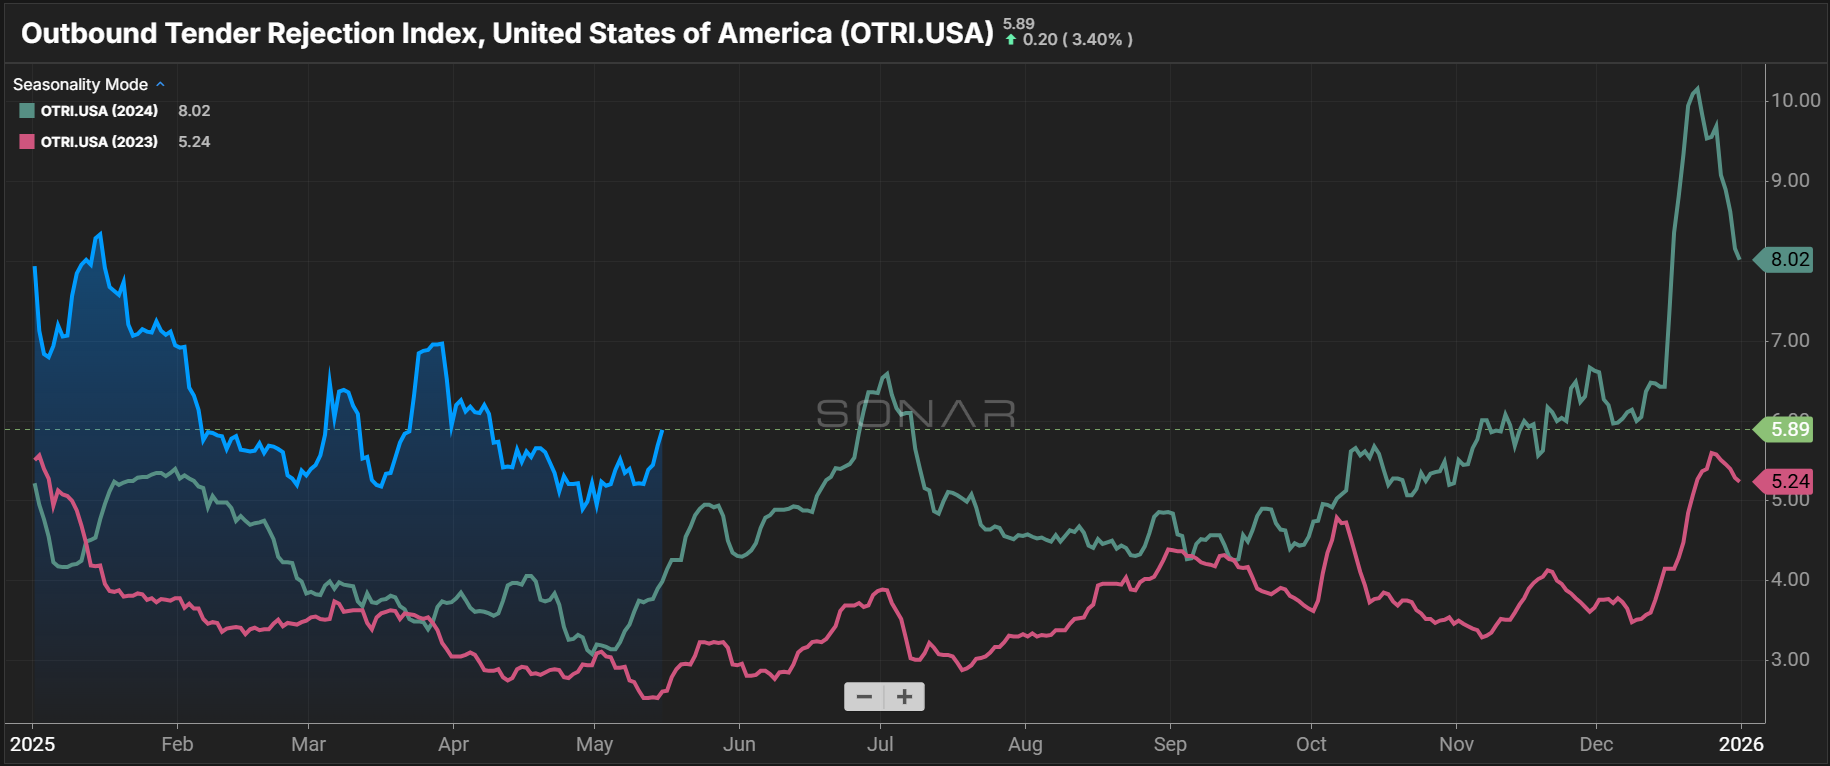
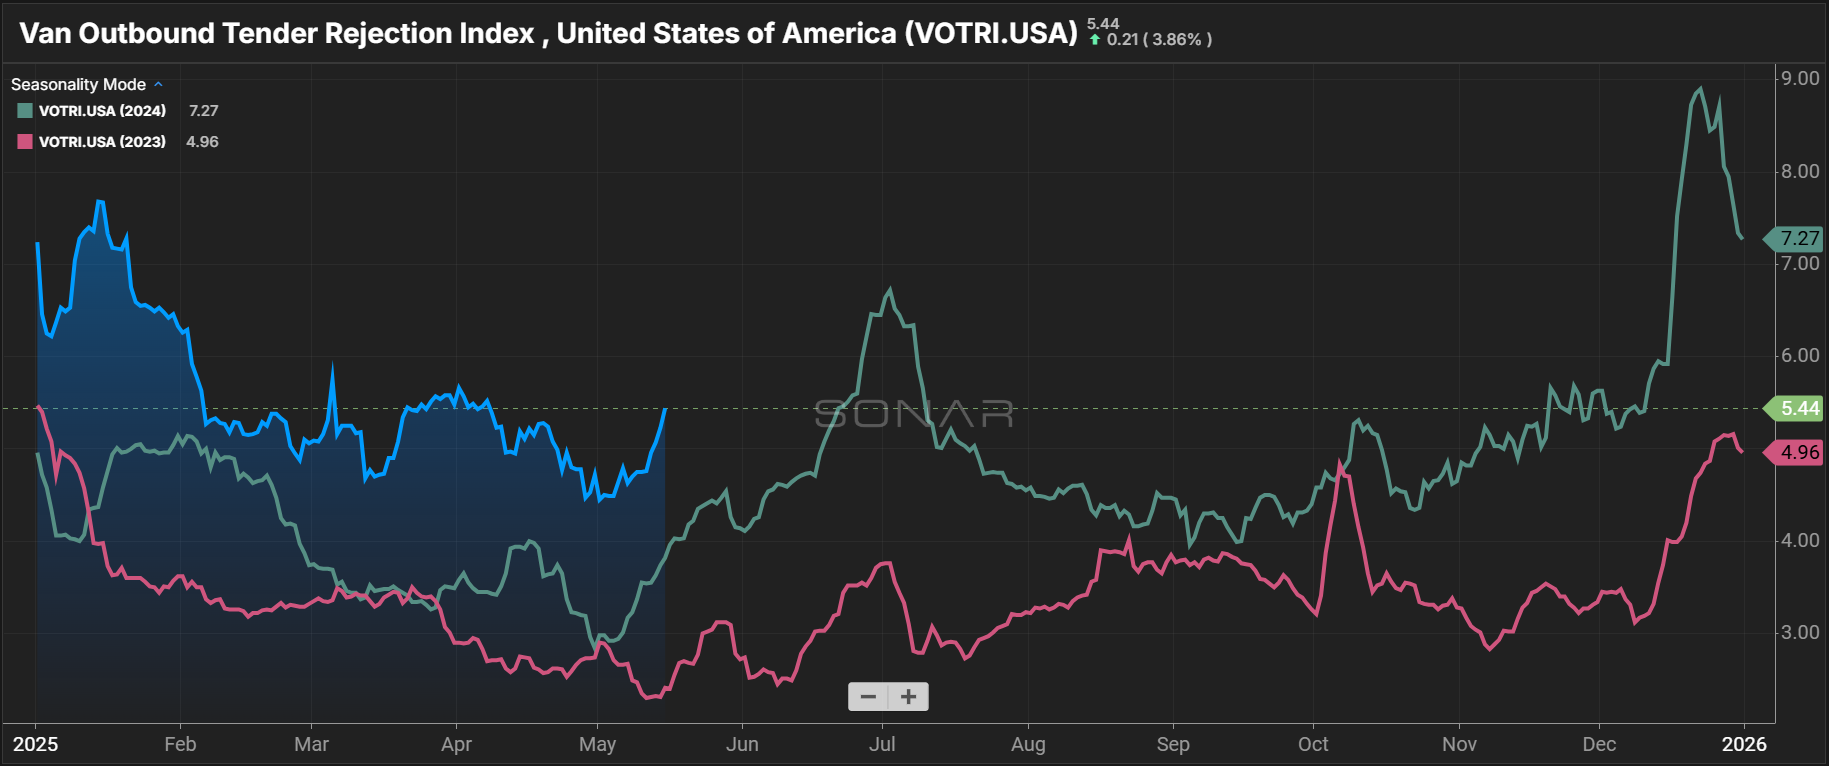
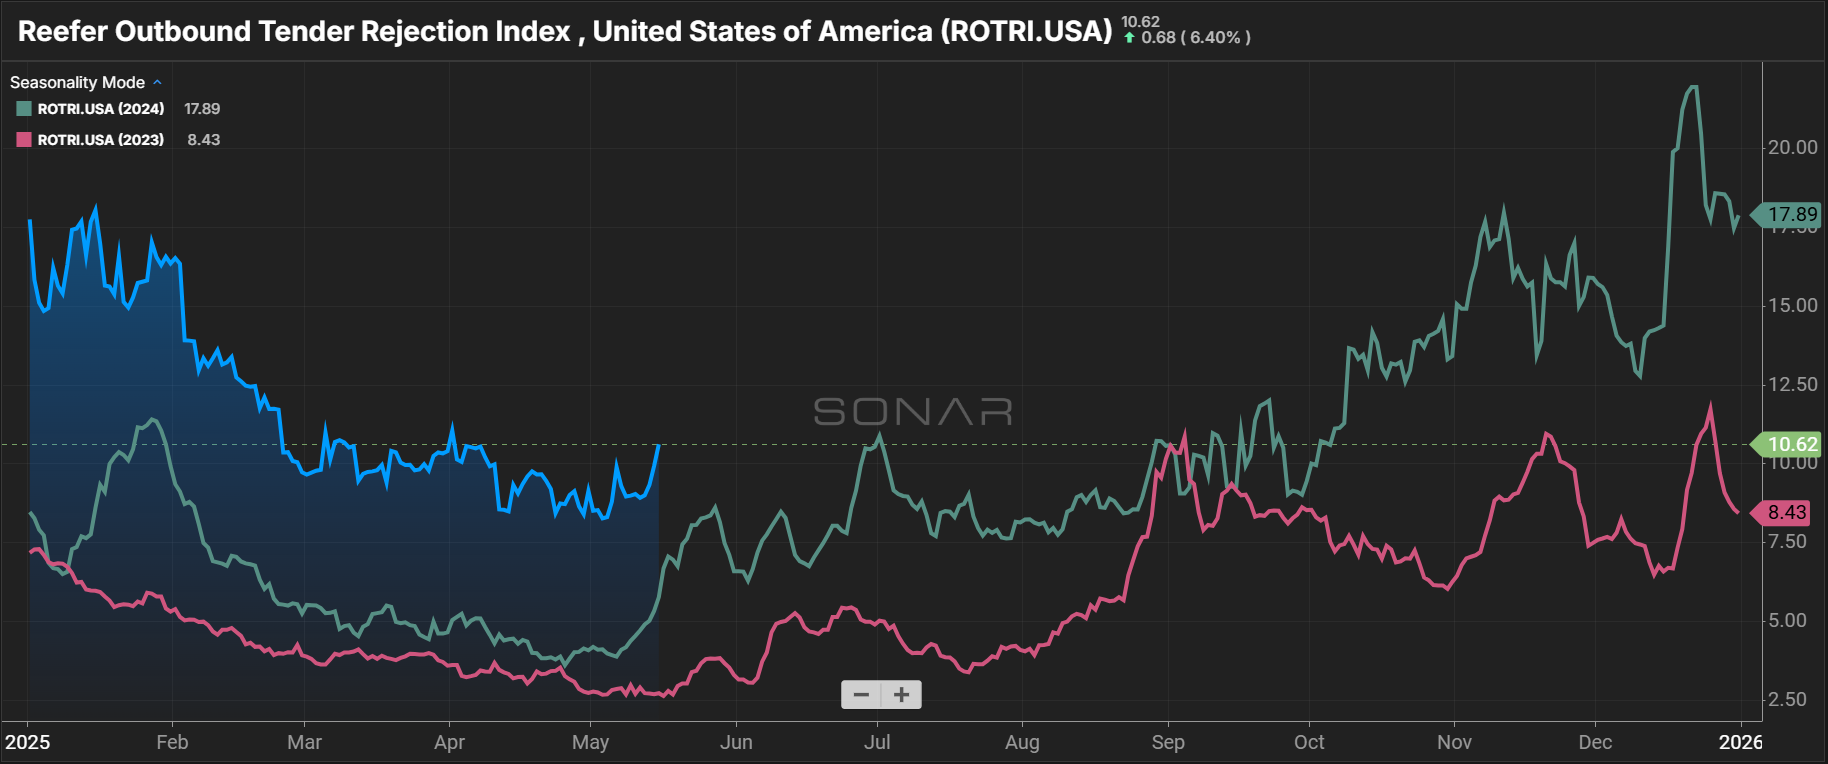
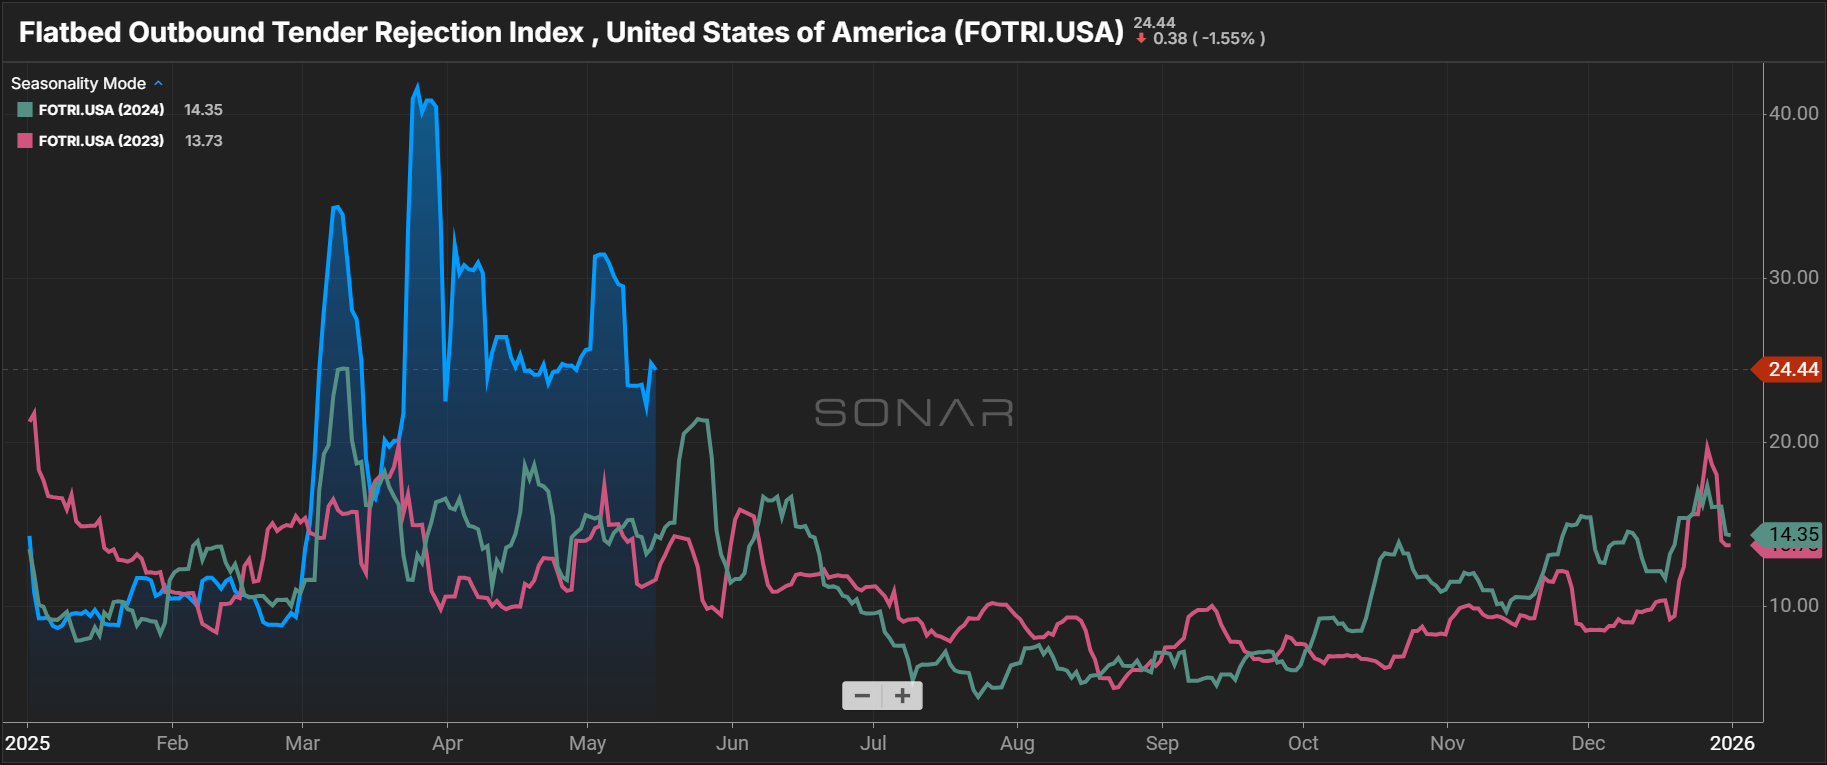
While the stop-and-start nature of elevated tariffs has created some abnormal freight movements and periods of regional volatility, the data tells a more nuanced story. In fact, the prevailing market narrative remains one of typical seasonality amid ongoing rebalancing—and that’s likely to continue for as long as demand levels hold.

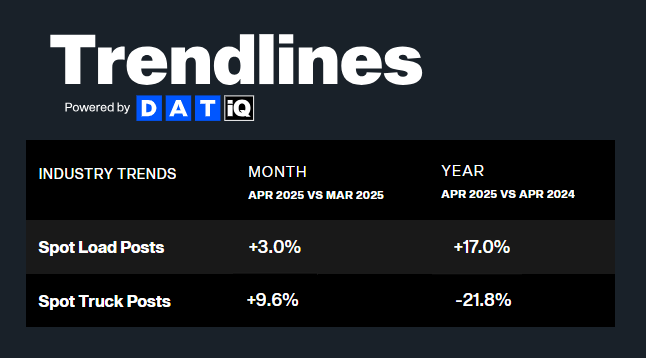
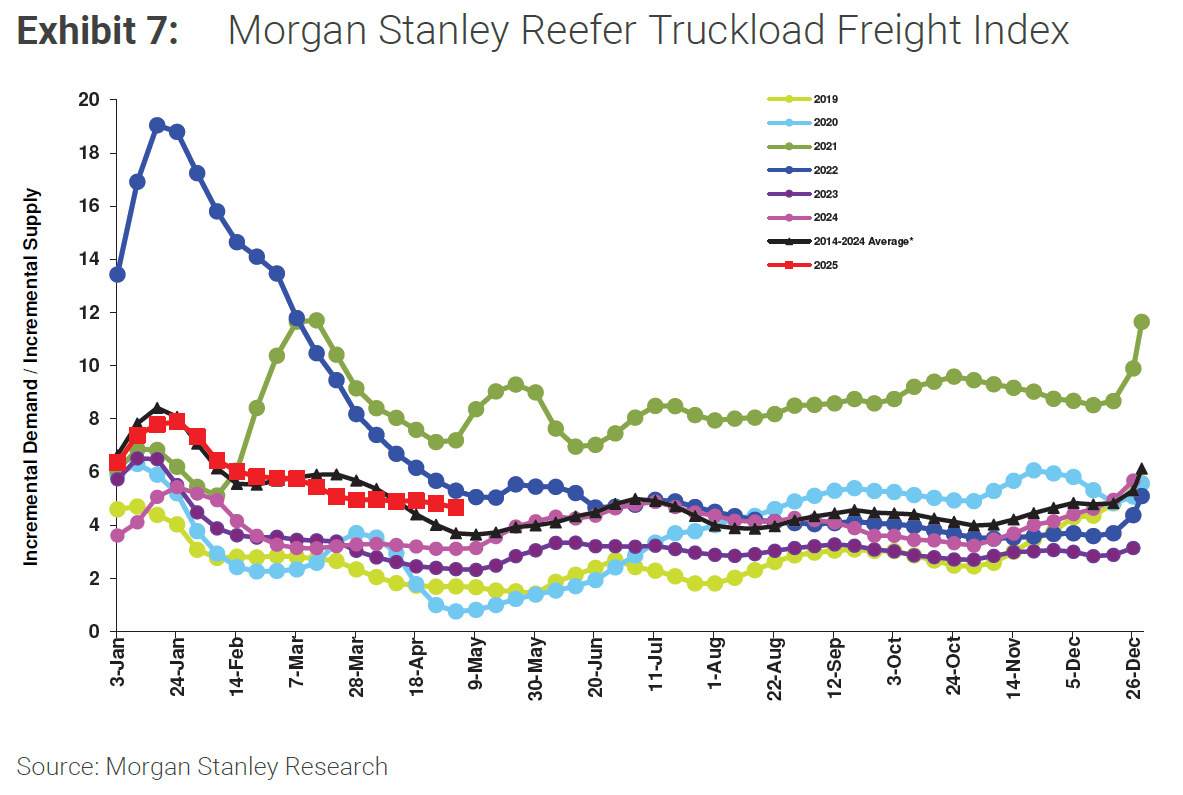
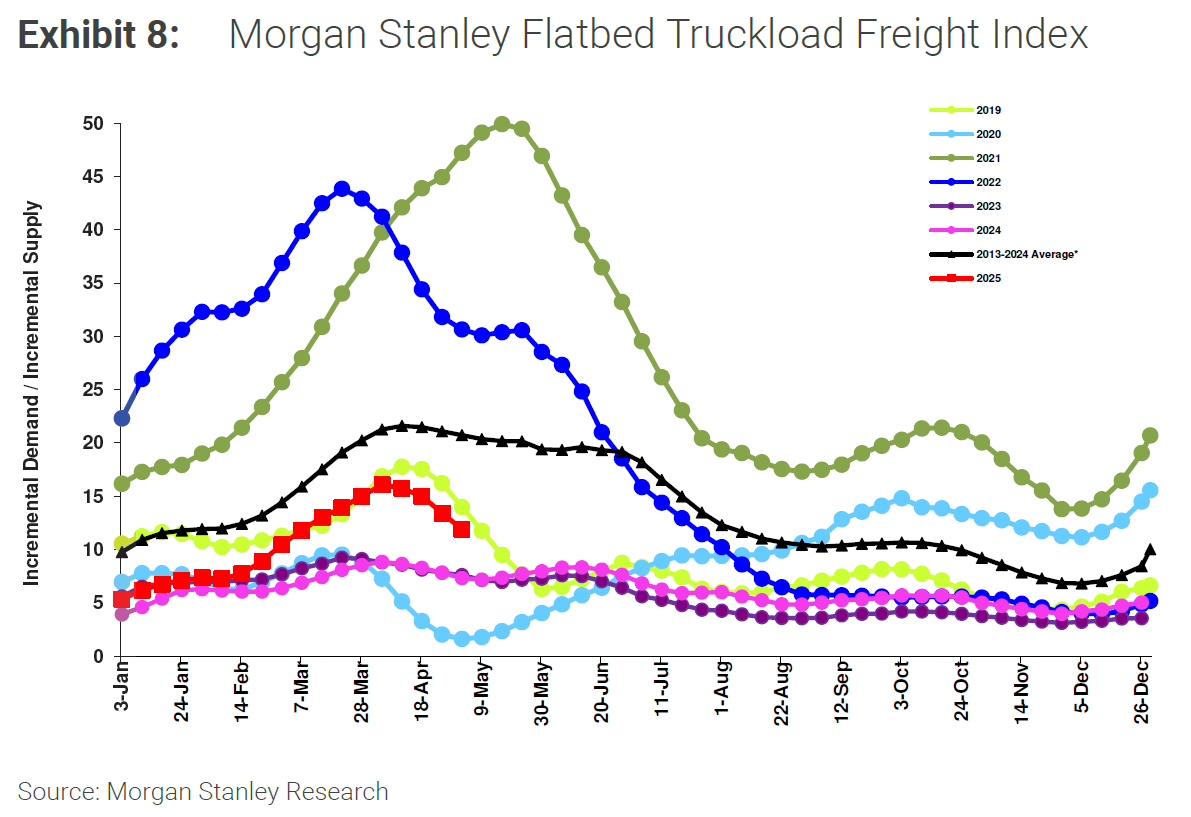
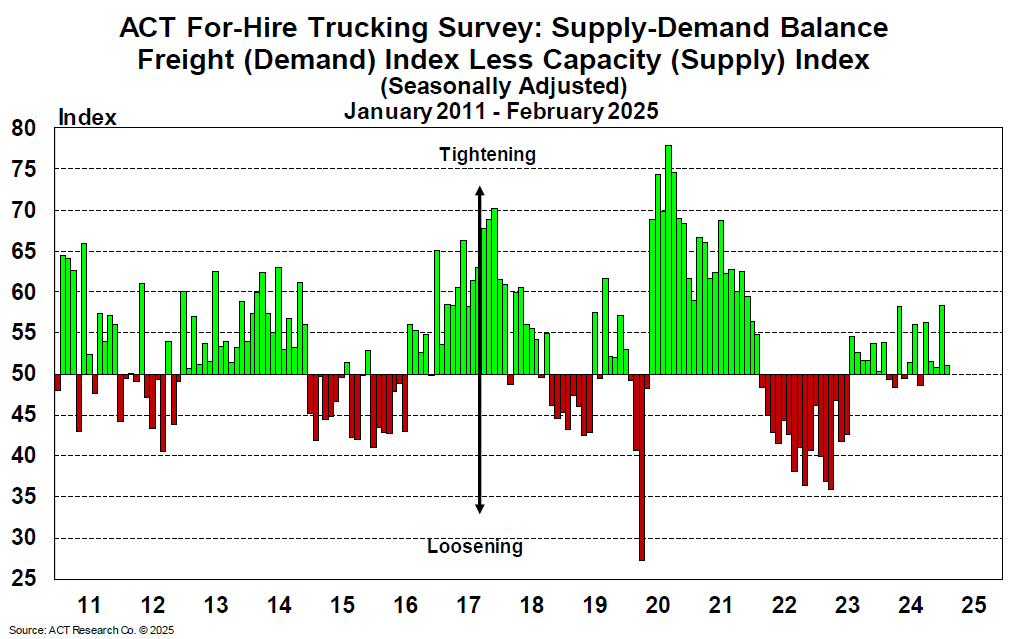
April and early May supply indicators confirm that narrative. Capacity tightened as equipment went offline during the Commercial Vehicle Safety Alliance’s (CVSA) Roadcheck Week alongside increased early peak season spot activity, supporting our position that supply has become more vulnerable to upside demand risks.

If the trade war de-escalates and economic indicators improve, those risks could soon materialize. But if negotiations reverse course and demand dramatically softens, supply would contract in turn, leaving the market more vulnerable to disruption when volume returns.

As that story unfolds, some shippers are using this window to reevaluate supply chain and production strategies, such as reformulating SKUs to reduce reliance on tariff-exposed suppliers. Freight flows are also being reshaped in ways that will keep stakeholders on their toes. For example, new lanes and shifting demand patterns are reconfiguring capacity networks, driving further change in an already dynamic environment.

As the market responds to these pressures, the year-end picture will continue coming into sharper focus. While shippers will face varying levels of tariff exposure and must navigate accordingly, peak season should otherwise be business as usual. Beyond that, patience, planning and strategic preparation around evolving trade policy and capacity shifts will be key to managing risk on the road ahead.

For a closer look at what’s happening across demand, supply and rates, keep reading.

Arrive Logistics VP of Market Intelligence David Spencer Headshot
David Spencer
VP of Market Intelligence

Key Takeaways

  • Elevated tariffs on Chinese goods have not yet shown significant effects on truckload demand, though some ebb and flow is expected through the remainder of Q2.
  • Capacity tightened meaningfully as a large number of drivers temporarily exited the market during CVSA Roadcheck Week.
  • While overall capacity levels remain stable, persistently low equipment orders could lead to a tractor population decline.
  • Despite trade tensions, seasonal tender rejection and rate patterns continue to mirror prior years.
  • Rates are expected to follow typical seasonal trends, with additional upward spot rate pressure likely through at least the Fourth of July.
  • A resilient economy and steady consumer spending are helping stabilize freight demand. Greater clarity on tariffs and broader economic conditions may encourage more typical behavior from both consumers and businesses, reducing the risk of a sharp demand downturn.

Truckload Demand

Looking Back

April data continued to reflect typical seasonal trends. Volumes were down slightly year-over-year, but the major indices showed no evidence of a looming near-term cliff. Truck postings outpaced spot load postings month-over-month, bringing down the overall load-to-truck ratio—a typical shift for this time of year. Among the three major equipment types, reefer and flatbed were the most active.

On the import side, indicators point to an uptick from March, with April volumes landing near record 2022 levels—well above the dramatic lows some analysts expected. Import pullbacks are expected in May, but the recent tariff pause with China should lead to a recovery in June or July.

Looking Ahead

Near-term peak season conditions should remain relatively stable, but even as import volumes from China begin to recover, several leading indicators point to potential demand headwinds later this summer.

Most notably, the manufacturing sector—a key contributor to domestic freight volumes—is showing signs of contraction. New orders have declined for three straight months, while production fell and backlogs shrank for the last two, indicating a growing downside demand risk. This trend also mirrors data from past periods of shifting trade policy.

These and other signals have prompted more cautious outlooks from analysts. FTR Transportation Intelligence (FTR), for example, recently lowered its economic forecast, citing declining import activity and ongoing tariff uncertainty as key risks that could weigh on freight demand in the months ahead.

Contract Load Accepted Volume, SONAR

Chart Notes
  • Contract Volumes Continue to Show Weakness: FreightWaves SONAR accepted contract volumes have trended downward since late Q3 2024 and remained roughly 10% lower year-over-year into early May. Easing demand continues to shift the supply-demand balance, keeping rates relatively stable.

DAT Trendlines

Chart Notes
  • More Available Capacity Drove Month-Over-Month Softening Despite Year-Over-Year Tightening: DAT data showed spot volumes increased 17% year-over-year, and truck postings fell 21.8% year-over-year—evidence of a more balanced market. Dry van and flatbed load-to-truck ratios declined month-over-month, offsetting a 16.5% jump for reefer equipment.

Cass Freight Index Report – April 2025

Chart Notes
  • Cass Freight Index Illustrates Recent Demand Stability: April shipments rose 0.3% on a seasonally adjusted basis, with year-over-year and two-year stacked changes showing smaller declines.

Cass Freight Index Shipments Forecast – April 2025

Chart Notes
  • Continued Demand Weakness Likely in 2025: In their latest truckload demand forecasts, ACT Research and Cass acknowledged that recent progress in trade negotiations with China could boost near-term volumes slightly, but still project negative demand growth through mid-2026.

Descartes U.S. Container Import Volume

Chart Notes
  • Imports Remain Strong For Now: Descartes data shows imports increased by 1.2% from March 2025 and 9.1% compared to April 2024, likely reflecting pull-forward activity ahead of potential tariffs.

Manufacturing at a Glance, Manufacturing ISM

Chart Notes
  • Manufacturing Contracts: The ISM Manufacturing Index has contracted again after two months of expansion, which ended a 26-month contraction streak.
  • Demand Weakens Despite Recent Strength: Signs of weakening demand include three consecutive months of declining new orders, two consecutive months of reduced production and a shrinking order backlog.

Monthly Business & Economic Highlights, FTR

Chart Notes
  • Economic Forecasts Lowered: Uncertainty and tariff-related risks are driving economic slowdowns and future trends. FTR analysts predict that declining production and imports will significantly reduce freight demand.

Truckload Supply

Looking Back

Capacity conditions softened in April, with rejection rates easing across the three major equipment types in line with seasonal expectations. However, they remained elevated above year-ago levels ahead of CVSA Roadcheck Week and the 100 Days of Summer. As expected, rejection rates have increased sharply with the onset of Roadcheck Week and are expected to remain elevated through the Fourth of July as seasonal demand increases.

Notably, capacity got a meaningful boost in April. A total of 555 new carriers entered the market—the largest increase since mid-2022—driven in large part by short-term opportunities tied to tariff-related freight activity. More than 8,000 trucking jobs were also added over the last few months, with total transportation and warehousing payrolls rising even faster, reinforcing the near-term supply strength narrative.

Looking Ahead

While recent growth supports near-term supply strength, the longer-term outlook is less certain as trade negotiations make demand forecasting difficult. 

April Class 8 tractor orders fell well below replacement levels, signaling that carriers may already be adjusting to a weaker outlook. Additionally, OEMs are scaling back production and raising prices to offset tariff-related costs, then passing those increases along to buyers—a shift that could further discourage new truck purchases and slow private fleet expansion.

Taken together, declining equipment orders, reduced fleet investment and fewer new entrants amid an uncertain volume outlook could gradually tighten available capacity, even if demand holds steady.

Outbound Tender Reject Index, SONAR

Chart Notes
  • Tender Rejections Spike During CVSA Roadcheck Week: After returning to pre-tariff boost levels in late April, the SONAR OTRI Index shows tender rejections spiked sharply in mid-May amid capacity crunches caused by the annual CVSA Roadcheck.

Van Outbound Tender Rejection Index, SONAR

Chart Notes
  • Dry Van Tender Rejections Indicate Summer Tightening is Underway: After settling at a new year-to-date low in early May, dry van rejections are climbing as seasonal tightening continues.
  • Summer Peak Season Will Test the Market Next: Volatility during summer and winter peak seasons serves as a helpful gauge of shipper routing guide health. With rejection rates rising compared to 2024, the lead-up to the Fourth of July will be the market’s next true test.

Reefer Outbound Tender Rejection Index, SONAR

Chart Notes
  • Reefer Tender Rejections Less Affected by Tariff Disruptions: Reefer rejections continue to follow more typical seasonal patterns than van and flatbed. However, with current levels remaining elevated year-over-year, shippers relying heavily on reefer capacity could see more peak season disruption.

Flatbed Outbound Tender Rejection Index, SONAR

Chart Notes
  • Flatbed Rejection Rates Remain Elevated: Tariff-related disruptions coincided with the onset of open-deck season, significantly exposing routing guides over the past two months. The particularly active flatbed spot market offers a glimpse into how van and reefer conditions might play out during this peak season.

Van Load-to-Truck Ratios

Reefer Load-to-Truck Ratio

Chart Notes
  • Dry Van Ratios Dip as Reefer Ratios Rise: Van and reefer load-to-truck ratios remain elevated compared to previous years, mirroring tender rejection trends. Both typically climb from April to June as the summer peak season begins, making next month one to watch closely.

Flatbed Load-to-Truck Ratios

Chart Notes
  • Flatbed Load-to-Truck Ratios Ease but Remain Elevated: Flatbed capacity has tightened significantly in early 2025. Conditions softened in April as March’s pull-forward demand subsided, but overall tightness remains well above recent years.

Morgan Stanley Dry Van ONLY Truckload Freight Index

Morgan Stanley Reefer Truckload Freight Index

Morgan Stanley Flatbed Truckload Freight Index

Chart Notes
  • Morgan Stanley Index Indicates Typical Seasonality: Capacity across all three equipment types is trending near historical averages. If demand holds, van and reefer markets are likely to tighten from May through early July. Flatbed continues to outperform 2024 trends as peak season continues.

Carrier Revocations, New Carriers & Net Change in Carrier Population, FTR

Chart Notes
  • Carrier Population Grows in April: According to FTR, the number of authorized for-hire trucking firms rose by 555 in April, outpacing carrier exits. However, continued population growth is unlikely, as recent improvements in trucking conditions are expected to be short-lived.

Class 8 Tractor Net Orders, ACT Research

Chart Notes
  • Tractor Orders Trend Below Replacement Levels: Class 8 tractor orders fell to just 5,600 in April, well below replacement levels. If equipment investment remains low, ongoing truck population declines could increase market vulnerability.

Monthly Change in Trucking Jobs, FRED Economic Data

Chart Notes
  • April Employment Growth: Consecutive trucking employment increases created more than 8,000 jobs over the past two months. That growth likely reflects recent market strength, but as with the rise in carrier population, demand challenges later this year may reverse the trend.

Active Truck Utilization, FTR

Chart Notes
  • Truck Utilization Dips: FTR’s truck utilization forecast declined further due to lowered expectations for loadings. While a recovery is projected for 2026, uncertainty remains high given the wide range of possible outcomes.

U.S. Class 8 Tractors Backlog & Backlog/Build Ratio, ACT Research

Chart Notes
  • Backlog-to-Build Ratio Falls: Despite a 7,100-unit drop in the backlog, the April Class 8 tractor backlog-to-build ratio remained unchanged from March at 6.6 months, underscoring the impact of declining production alongside falling orders.

For-Hire Driver Availability Index, ACT Research

Chart Notes
  • Driver Availability Softens: February marked the 34th consecutive month of softening in ACT Research’s Driver Availability Index. Struggling owner-operators relinquishing their authorities and joining larger fleets are cited as a key driver of the trend.

For-Hire Trucking Survey: Supply-Demand Balance, ACT Research

Chart Notes
  • Market Rebalancing Slows: As capacity grew and volumes fell, the market’s ongoing rebalancing slowed in April. While peak season may reverse this trend, softness is expected during other seasonally slow periods in the near term.

Truckload Rates

Looking Back

Truckload rates held mostly steady through April and early May, following normal seasonal patterns amid what is typically a slower demand period. However, costs have picked up quickly in mid-May as Roadcheck Week reduced available capacity.

Van and reefer rates have closely aligned with year-ago levels and flatbed rates dipped slightly from recent highs, but remained elevated, especially in construction-heavy areas.

All-in rates trended slightly below year-ago levels as declining diesel prices contributed to lower fuel surcharges. While not a primary rate driver, soft global diesel demand has offered cost relief for carriers and helped reduce total landed costs for shippers.

Looking Ahead

Rates will likely continue trending upward as stable to increasing demand drives tightness through Memorial Day. Van and reefer rates should rise modestly, with flatbed expected to remain elevated as well.

If downside demand risks begin to materialize after the holiday, rate pressure could increase in turn. However, ongoing capacity reductions should help limit any dramatic declines.

If global diesel demand continues to weaken while production stays elevated, domestic fuel prices should remain relatively low, easing shipper costs and supporting improved carrier margins.

Truckstop Weekly National Average Spot Rates

Chart Notes
  • Rates Following Seasonal Norms: Van and reefer rates have followed similar patterns but dropped below levels heading into last year’s Roadcheck Week. Flatbed rates are outpacing year-ago levels, but have begun easing from recent highs, mirroring the timing of a similar dip last year.

DAT Monthly Rate Trends

Chart Notes
  • Van Rates Decline: All-in dry van rates fell $0.03 per mile in April and were trending down another $0.02 per mile heading into Roadcheck Week.
  • Reefer and Flatbed Rates Increase: All-in reefer and flatbed rates rose $0.01 and $0.04 per mile, respectively, in April. Reefer rates continued to rise in May, while flatbed showed early signs of stability, dipping $0.01 per mile ahead of Roadcheck Week.

DAT Fuel Trends

Chart Notes
  • May Diesel Prices Trend Downward: Weakening demand and elevated production levels drove diesel prices down in early May, offering relief to both shippers and carriers.

DAT Dry Van National Average RPM Spot vs. Contract

Chart Notes
  • Dry Van Linehaul Rates Continue to Slide in Early May: As is typical for this time of year, spot linehaul rates have settled near their seasonal floor, though possible increases later this month could shift that trend. Year-over-year, spot rates rose 2.6% from $1.53 per mile in April 2024.
  • Spot-Contract Gap Widens as Spot Rates Fall: As spot rates eased, the dry van spot-contract gap widened from a cycle low of $0.29 per mile in January to $0.46 per mile in early May. A narrower gap typically indicates greater market sensitivity to disruption.

DAT Temp Controlled National Average RPM Spot vs. Contract

Chart Notes
  • Reefer Linehaul Rates Stabilize Heading Into Peak Season: Year-over-year, spot linehaul rates rose 2.2%, from $1.82 per mile in April 2024 to $1.86 in April 2025.
  • Reefer Spot-Contract Gap Widens as Spot Rates Fall: As spot rates eased, the reefer spot-contract gap widened from a cycle low of $0.23 per mile in January to $0.43 per mile in early May. As with dry van, a narrower gap typically signals increased sensitivity to disruption.

DAT Flatbed National Average RPM Spot vs. Contract

Chart Notes

  • Flatbed Linehaul Rate Growth Peaks: Strong early-season flatbed rate growth has leveled off and is holding steady in May. Year-over-year, flatbed spot linehaul rates rose 7.1% from $1.97 per mile in April 2024.

Economic Conditions

Looking Back

Economic conditions remained relatively stable through April. Labor market strength supported steady consumer spending, which could get an additional boost from recent pull-forward activity. Inflation held near the mid–2% range, offering little direction for the Fed regarding monetary policy in either direction.

Looking Ahead

Early indicators suggest a steady economic outlook through the end of Q2. Labor market stability should continue to support consumer demand, and with inflation tracking near target levels and no immediate catalysts for policy change, the Fed is likely maintain its “wait-and-see” position.

Consumer Price Index, New York Times

Chart Notes
  • Prices Rise Just 0.2% in April as Inflation Softens: The April CPI reading eased more than expected, signaling continued progress on inflation. While the result is positive, tariffs are still expected to push prices higher later in the year. The Fed is likely to remain cautious, monitoring how the economy responds to ongoing uncertainty—which could limit any near-term freight demand gains from potential rate cuts.

Bank of America Total Card Spending, Bank of America Consumer Checkpoints

Chart Notes
  • Strong Consumer Spending Holds: Bank of America reported that seasonally adjusted household spending was flat month-over-month in April and up 1% year-over-year. The threat of future price increases could bolster near-term spending and support truckload demand.

Employment Situation – April 2025, U.S. Bureau of Labor Statistics

Chart Notes
  • Unemployment Unchanged, Payrolls Increase: The unemployment rate has held within a narrow range of 4.0% to 4.2% since May 2024. A stable labor market supports healthy consumer spending, which should continue to drive freight demand.

Navigate the freight market
with confidence.

Get this free report delivered straight to your inbox every month.

Download May 2025 Freight Market Update

Scott Sandager,
Chief Administrative Officer 

Scott Sandager is the Chief Administrative Officer at Arrive Logistics. He joined Arrive in 2018, bringing over 14 years of logistics and brokerage experience, with expertise in project and change management, organizational design, talent development and customer satisfaction. Scott previously held many diverse roles of increasing responsibility with AFN, a Chicago-based freight brokerage.

Subscribe to receive freight market updates​​

"*" indicates required fields


Subscribe to receive freight market updates

Quick Apply

"*" indicates required fields

Max. file size: 50 MB.

Arrive Carrier Requirements

Please have the following info ready to complete registration

  • MC, MX, DOT, or state reg #
  • Tax ID & W9 info
  • Cert of Insurance: $100k cargo, $1M Auto, & $1M commercial general liability coverage
  • Active Common or Contract Authority (365+ days)
  • Safety Rating of at least Satisfactory (or None)

Fraud Prevention

Freight fraud continues to impact our industry. We encourage shippers and carriers to reach out to Arrive immediately if there is ever a shipment in question that may be subject to fraud. Arrive will not ask you to pay upfront for any dedicated lane or committed capacity program. If the offer you are receiving sounds too good to be true or unrealistic, it may be fraud. Arrive Logistics recommends verifying all communications come from our registered email domain is @arrivelogistics.com. Our 24/7 phone number is 888-861-0650 and our leadership team can also be reached at feedback@arrivelogistics.com.

Use of Cookies

We use cookies to enhance your browsing experience, serve personalized ads or content, and analyze site traffic. By continuing to use this website, you acknowledge and consent to our use of cookies as detailed in our privacy policy.

Get Access to the Shipper Portal

Current Customers

Already shipping with Arrive?

Connect with your representative to get access to your ARRIVEnow Shipper Portal. Can’t connect with your rep? Use this form to reach out.

New Customers

Not shipping with Arrive yet?

If you’re not an Arrive customer, please join our network to access the portal.

Carrier Scorecard Feedback

Contact Us

"*" indicates required fields

Matt Pyatt, Chief Executive Officer

Matt Pyatt is the Chief Executive Officer of Arrive Logistics. He co-founded Arrive with President Eric Dunigan in 2014 after building his career at Command Transportation. As CEO, he is responsible for overseeing the company’s financial health, strategic vision and culture, as well as building a scalable leadership team to support Arrive’s growth.

Request Arrive's SOC 2 Report

Eric Dunigan,
President & Co-Founder

Eric Dunigan is the President of Arrive Logistics. He began his career at Command Transportation before co-founding Arrive with Matt Pyatt in 2014. As president, he is responsible for driving revenue and growth, as well as leading the Strategic Partnerships team — a veteran group of supply chain experts who work with Arrive’s customers to reimagine their shipping strategy.

Arrive Logistics VP of Market Intelligence David Spencer Headshot

David Spencer,
VP of Market Intelligence

David Spencer is the Vice President of Market Intelligence at Arrive Logistics. David joined Arrive in 2017 after spending six years at AFN focused on business intelligence. His department provides critical market data and expert analysis to internal teams and publishes monthly market updates for shippers and carriers under the Arrive Insights banner.

Andrew Clarke, Board Chair,
Arrive Logistics and Global Critical Logistics

Andrew Clarke is Board Chairman for Global Critical and DCLI, Inc., and a board member for Arrive Logistics and Element Fleet Management Corp. His 20 years of global transportation and logistics experience include time as CFO of C.H. Robinson, CEO of Panther Expedited Services, Inc. and SVP and CFO roles at Forward Air Corporation.

Dean Croke,
Principal Analyst
at DAT Freight and Analytics

Dean Croke is a Market Analyst at DAT Solutions, where he focuses on freight market intelligence and data analytics. His 35 years of experience with data analytics, transportation, supply chain management, mining and insurance risk management include time as co-founder of FleetRisk Advisors and in a number of other high-level roles with FreightWaves, Spireon, Lancer Insurance, Omnitracs Analytics (formerly Qualcomm) and more.

Asanka Jayasuriya,
CTO and Partner at 8VC

Asanka Jayasuriya is the CTO at 8VC. He is an accomplished engineering and product leader with 20+ years of experience in the cloud. He has a strong background in enterprise SaaS, PLG products, infrastructure, and security. Notably, he served as CTO and SVP of Engineering at SailPoint, leading their successful transition to the cloud and successful exit event. He also held senior leadership roles at InVision, Atlassian, and Amazon, driving growth, operational excellence, and innovation. At 8VC, Asanka works with the entrepreneurs and leaders in our portfolio as a virtual CTO supporting their growth.

Chad Eichelberger,
President at Reliance Partners

Chad Eichelberger is the President of Reliance Partners. Since 2015, he’s leveraged his extensive experience in risk management, compliance, best practices and contracts to lead the company’s logistics and truck insurance strategy and operations. Chad was previously the President of Access America Transport, where he led the company from $8M to over $600M in revenue.

Barry Conlon,
CEO & Founder at Overhaul

Barry Conlon is the CEO and founder of Overhaul, the global leader in active supply chain risk management and intelligence. With a remarkable career spanning over 30 years in supply chain security, he is widely regarded as a trailblazer in modern-day supply chain security standards and best practices.

Tim Denoyer,
VP and Senior Analyst at ACT Research

As VP and Senior Analyst at ACT Research, Tim analyzes commercial vehicle demand and alternative powertrain development (i.e. electrification), and authors the ACT Freight Forecast, U.S. Rate and Volume Outlook. He previously spent fifteen years in equity research focused primarily on the transportation, machinery, and automotive industries, and co-founded leading equity research firm Wolfe Research.

Download this Report

"*" indicates required fields

Add me to the monthly distribution