Need Help
close button

How can we help?

Select One:
Arrive Insights™

July 2025 Freight Market Update

Table of Contents

Market Memo

From the Desk of David Spencer

The summer peak season is one of two key litmus tests for the freight market, but a number of variables at play this year made for somewhat complicated results.

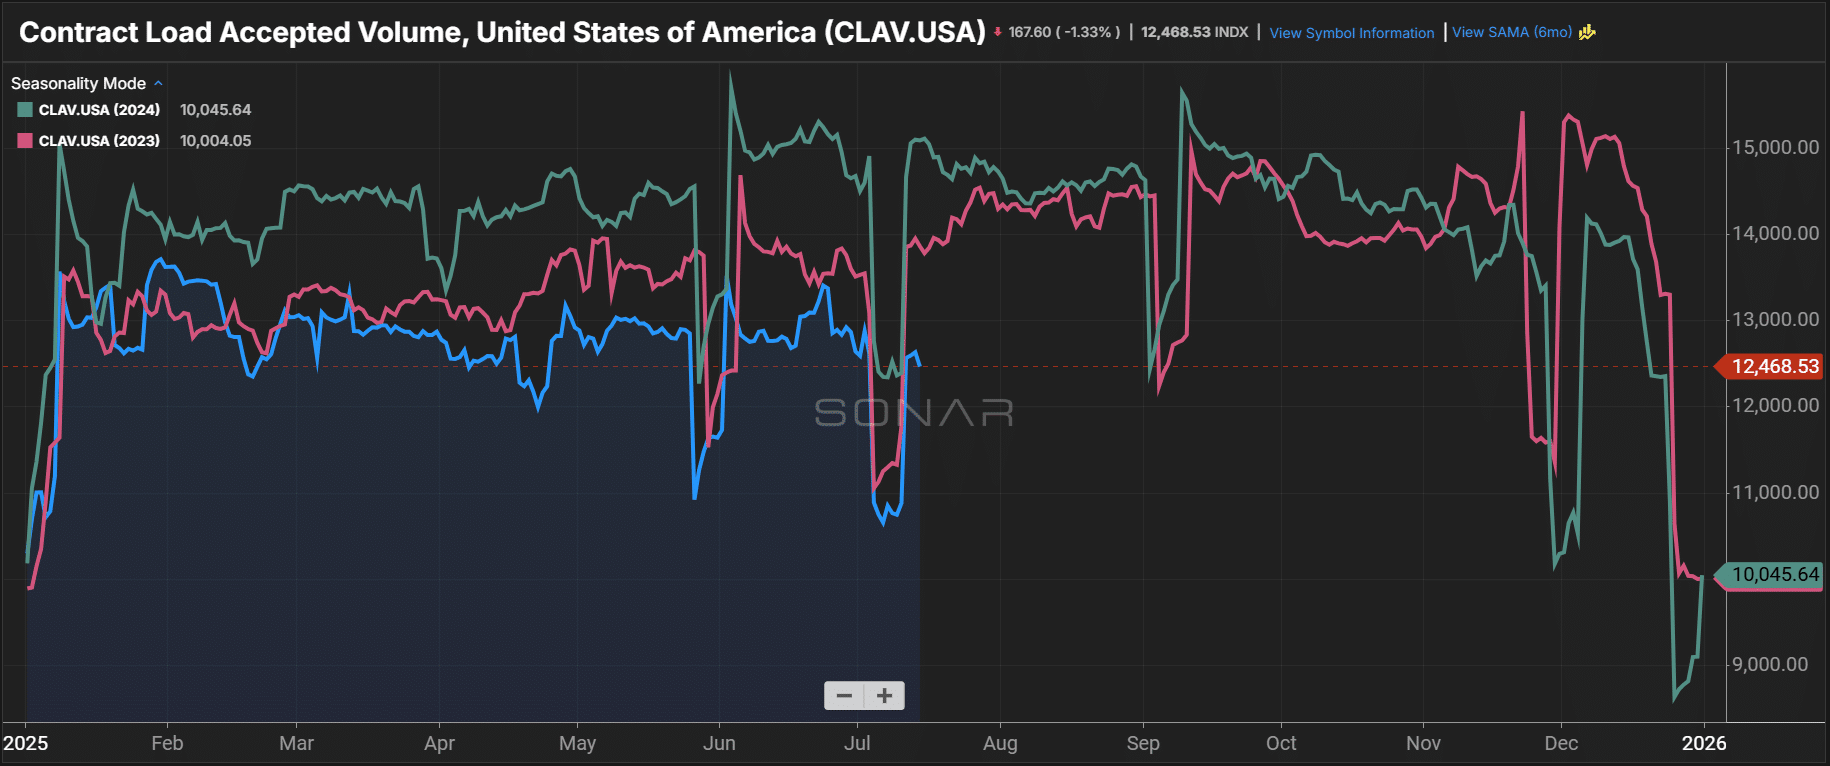
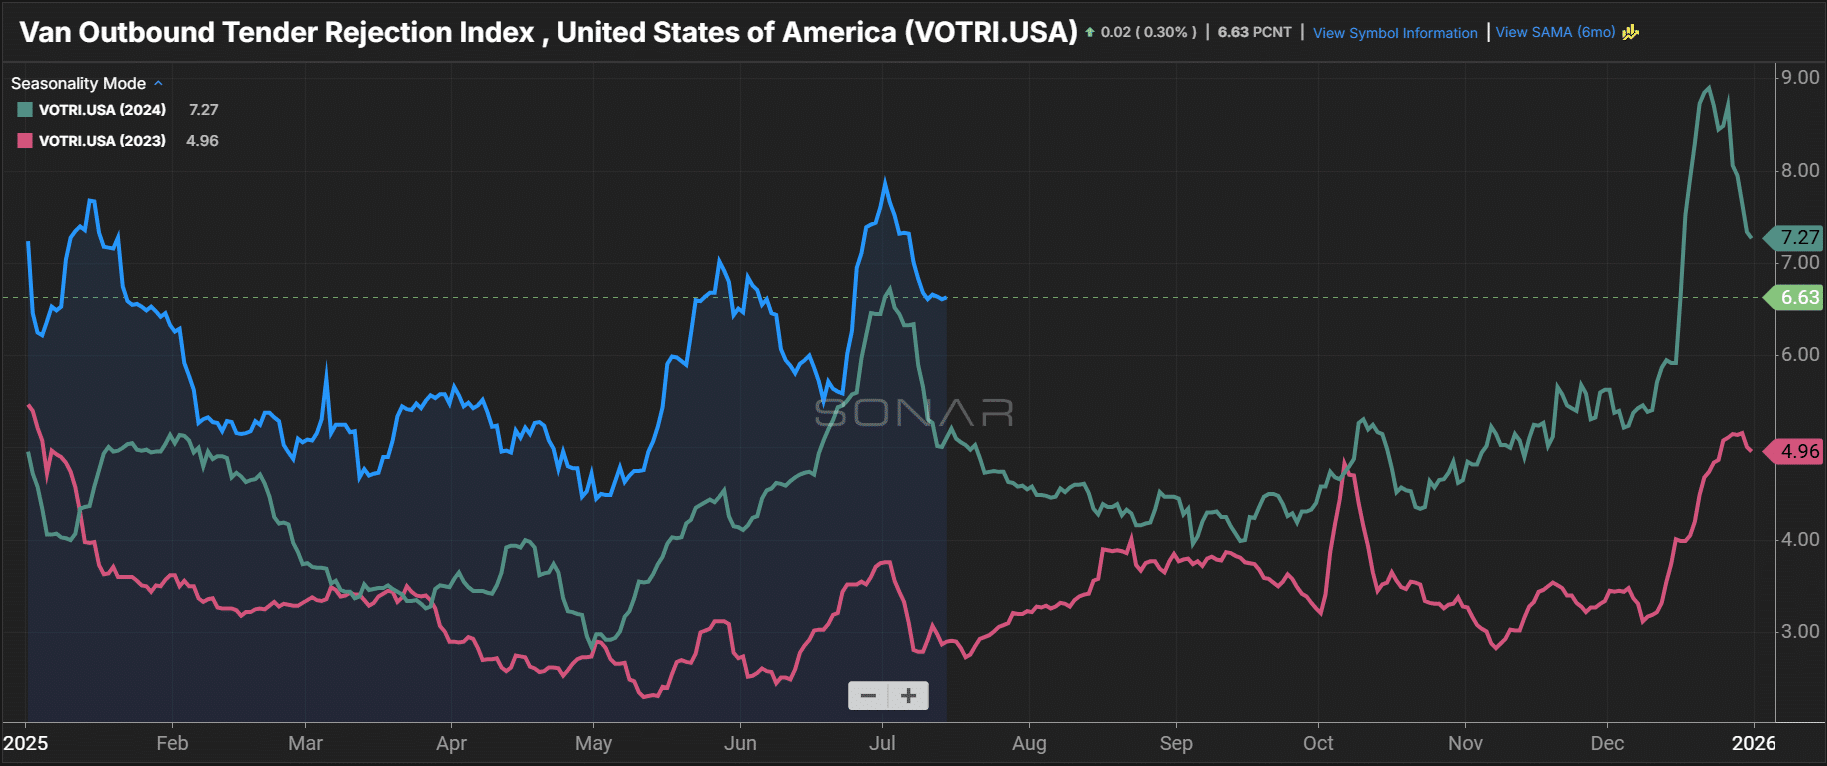
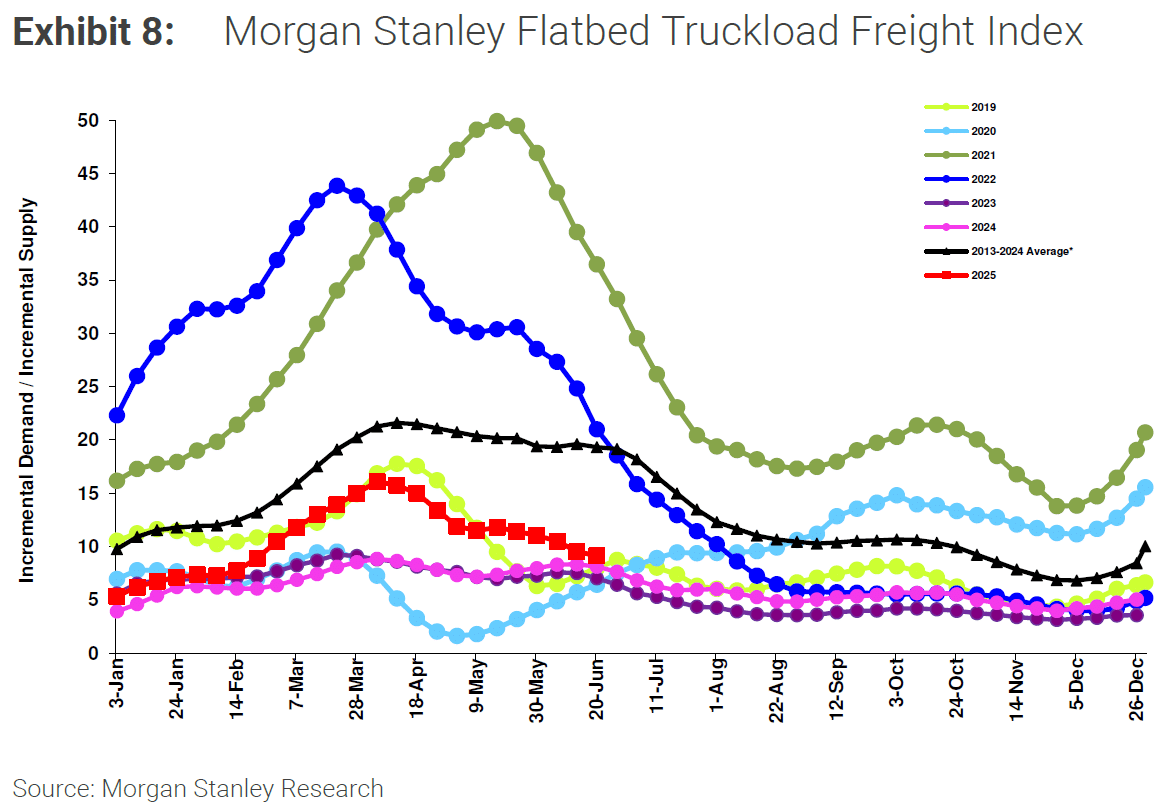
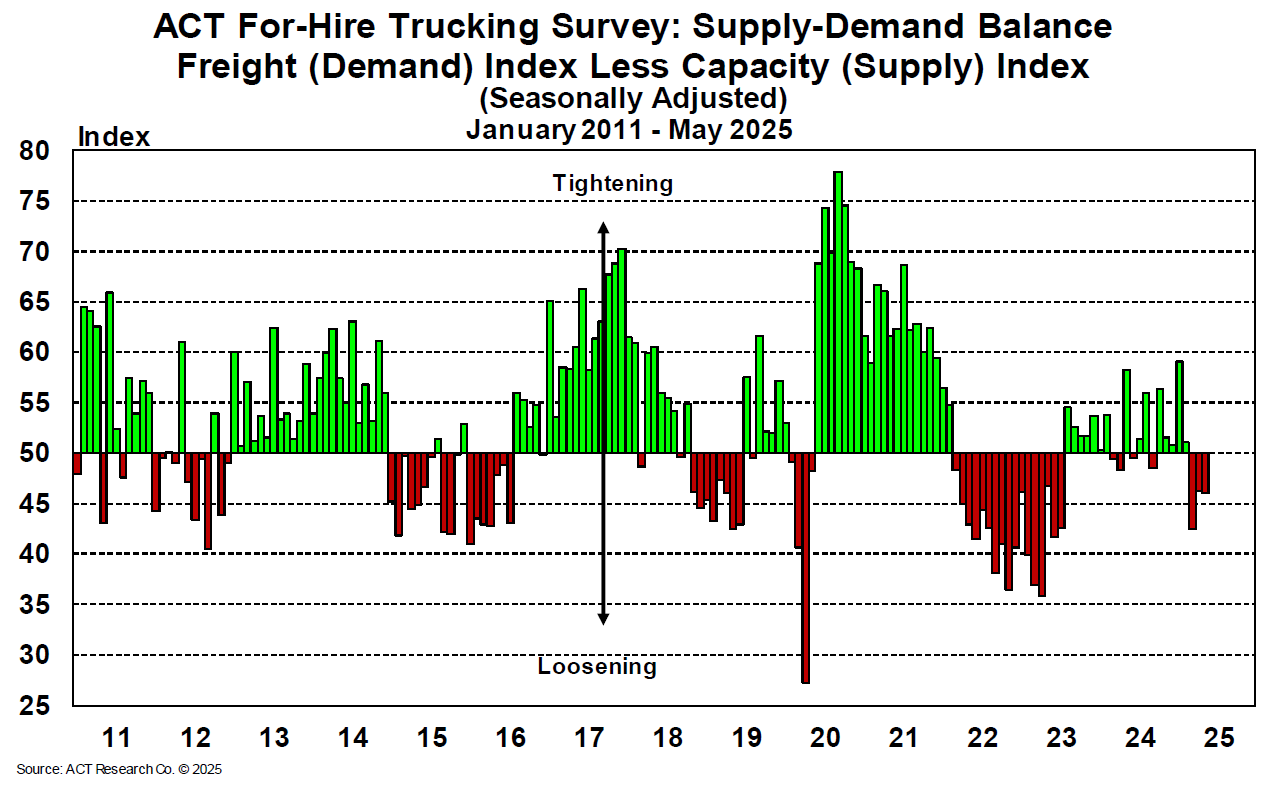
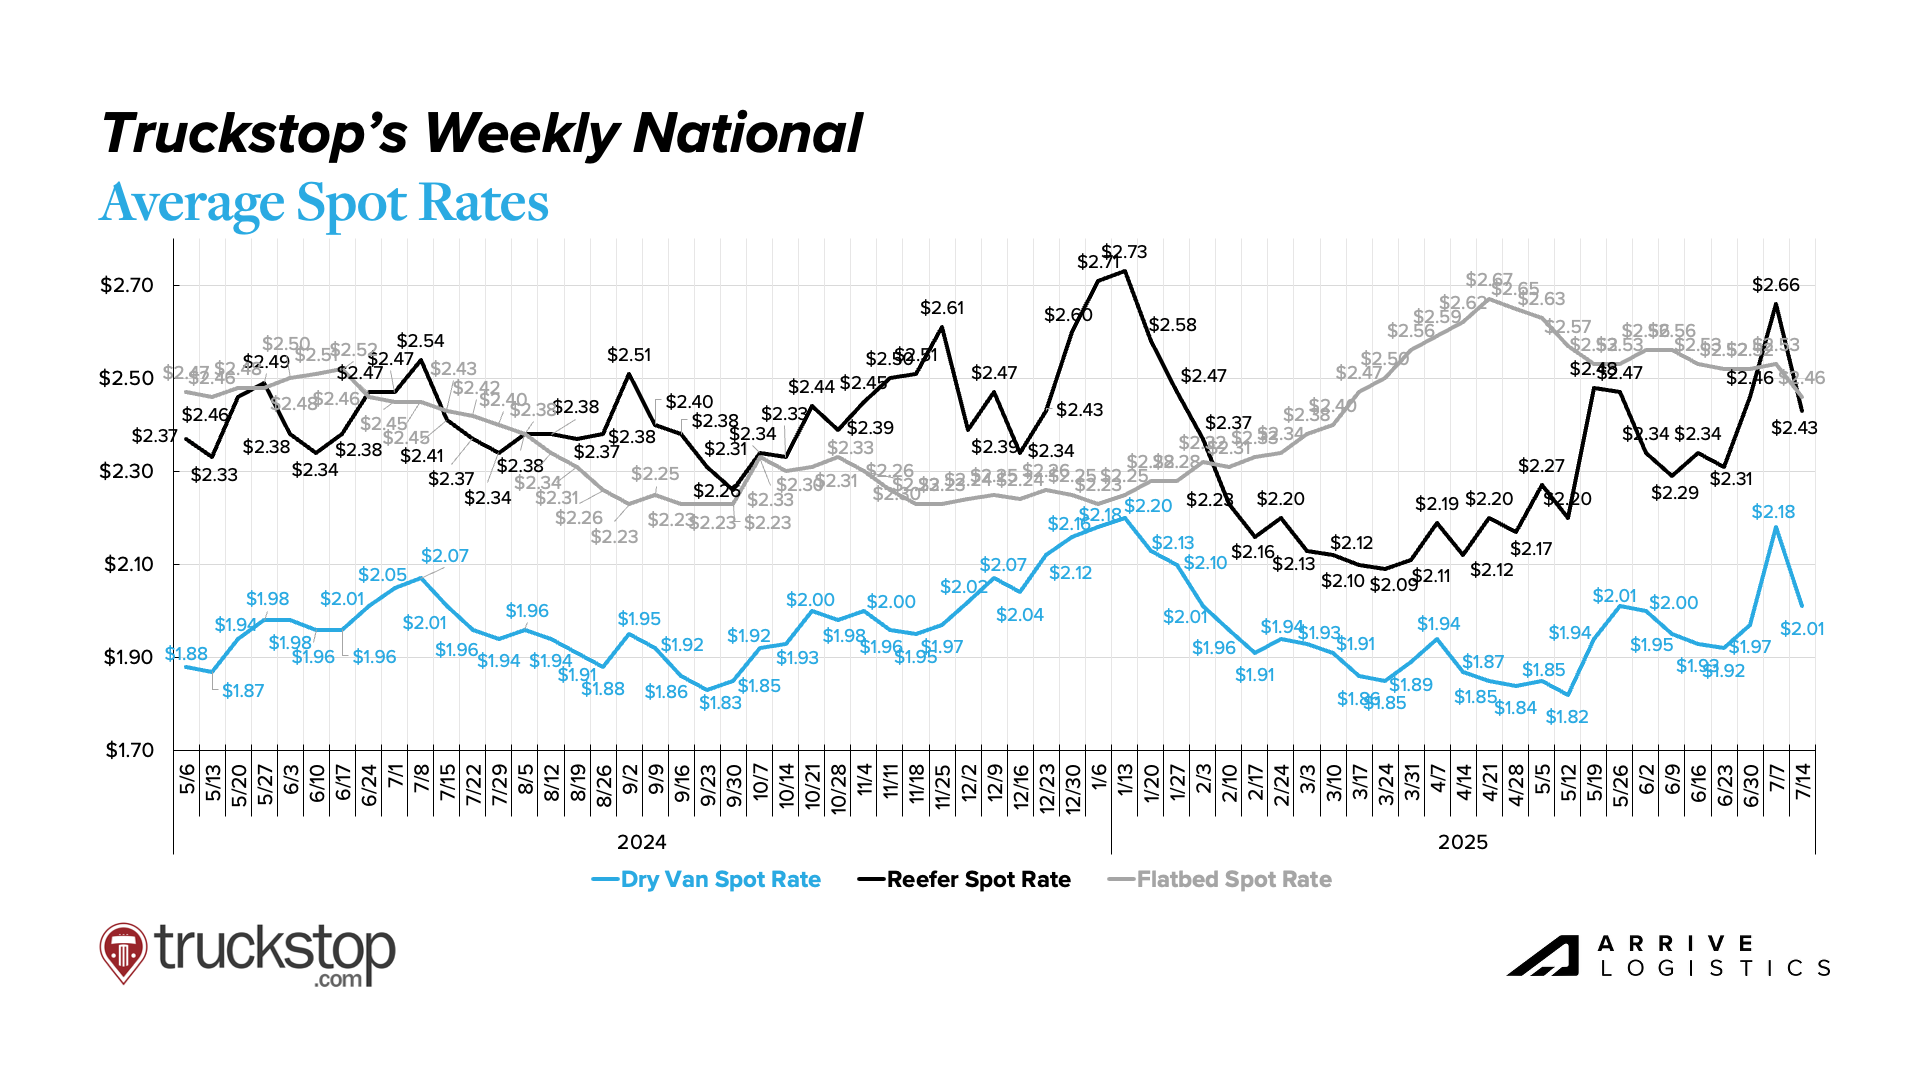
Coming off a June that underperformed historical patterns, this year’s Fourth of July ramp-up largely followed suit. With many shippers holding well-stocked inventories after pulling freight forward to avoid tariffs, typical seasonal tightness arrived late and fizzled quickly, making the holiday week a fleeting high point amid an otherwise soft peak season.

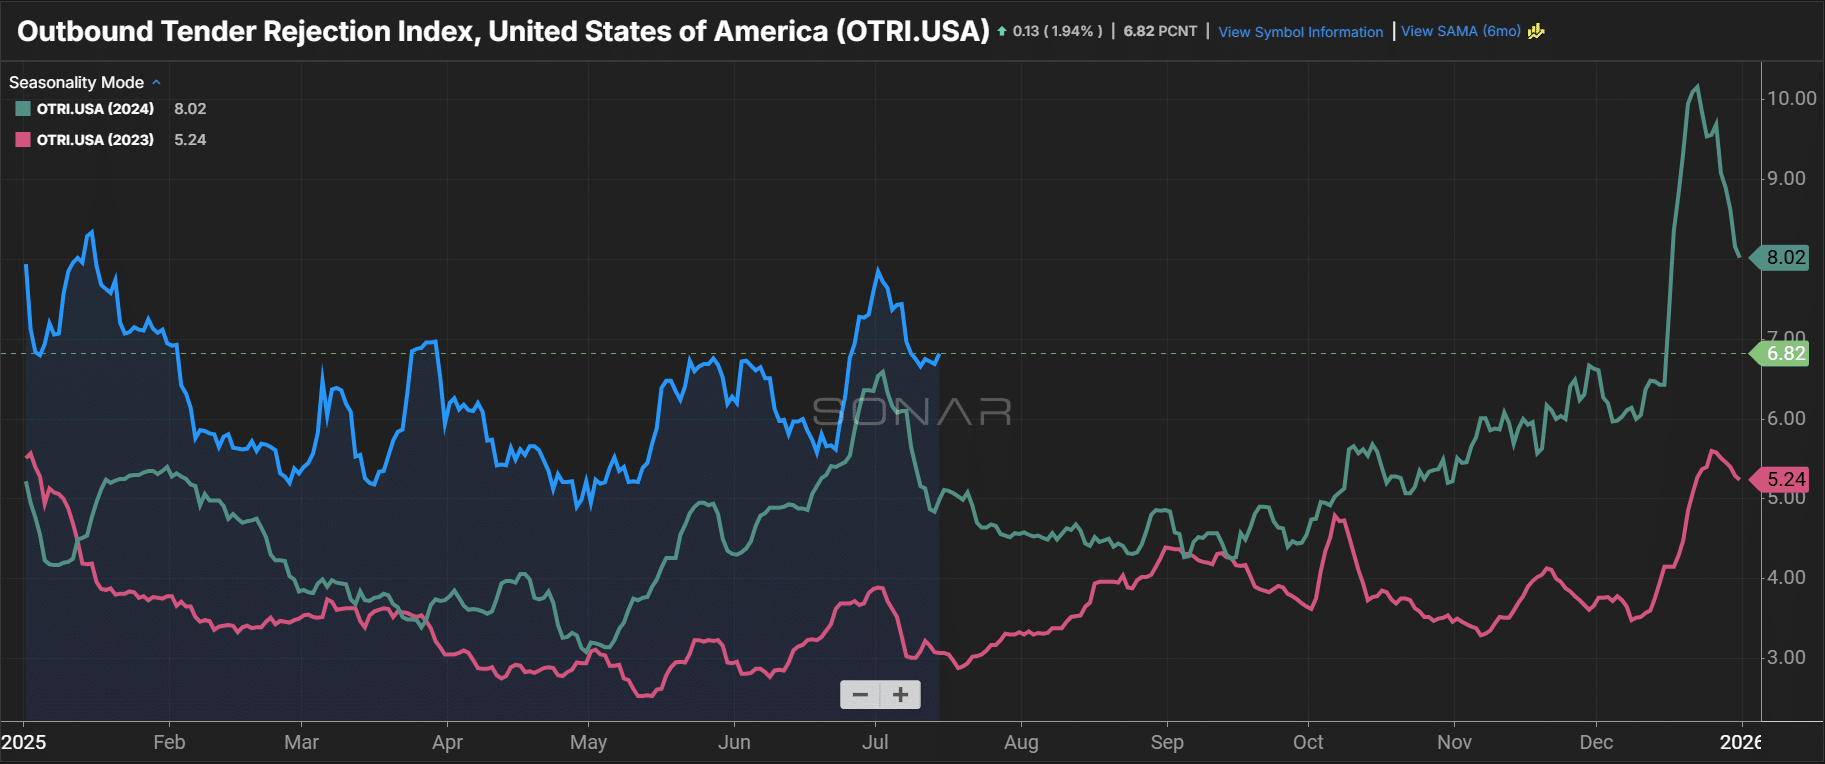
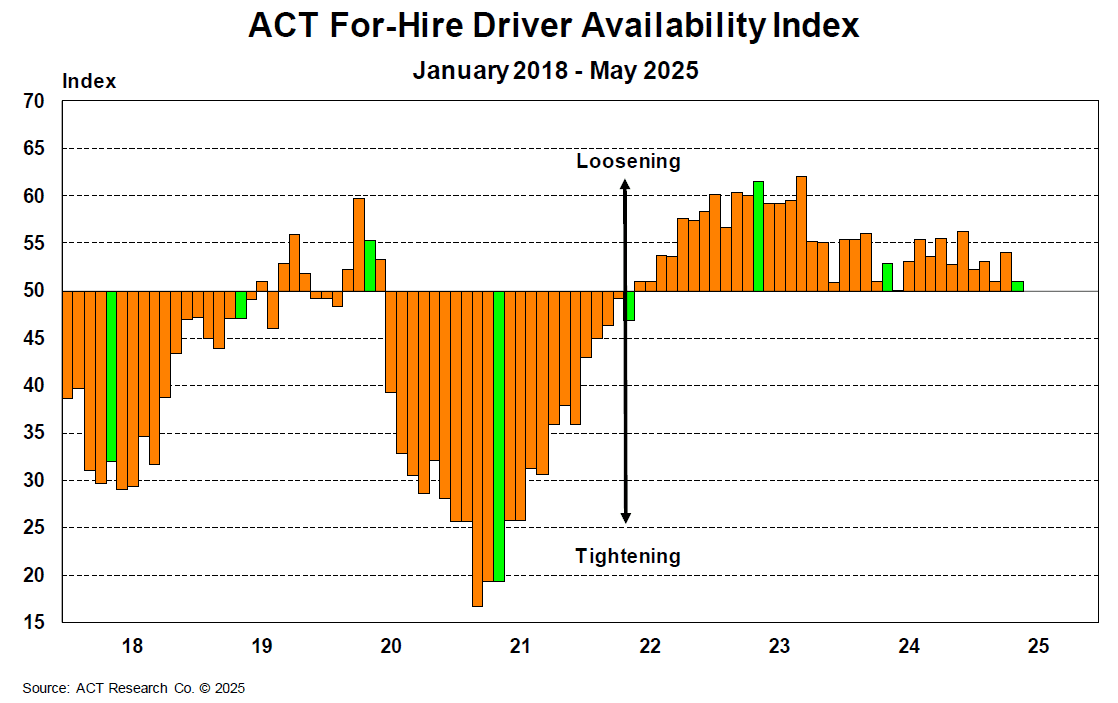
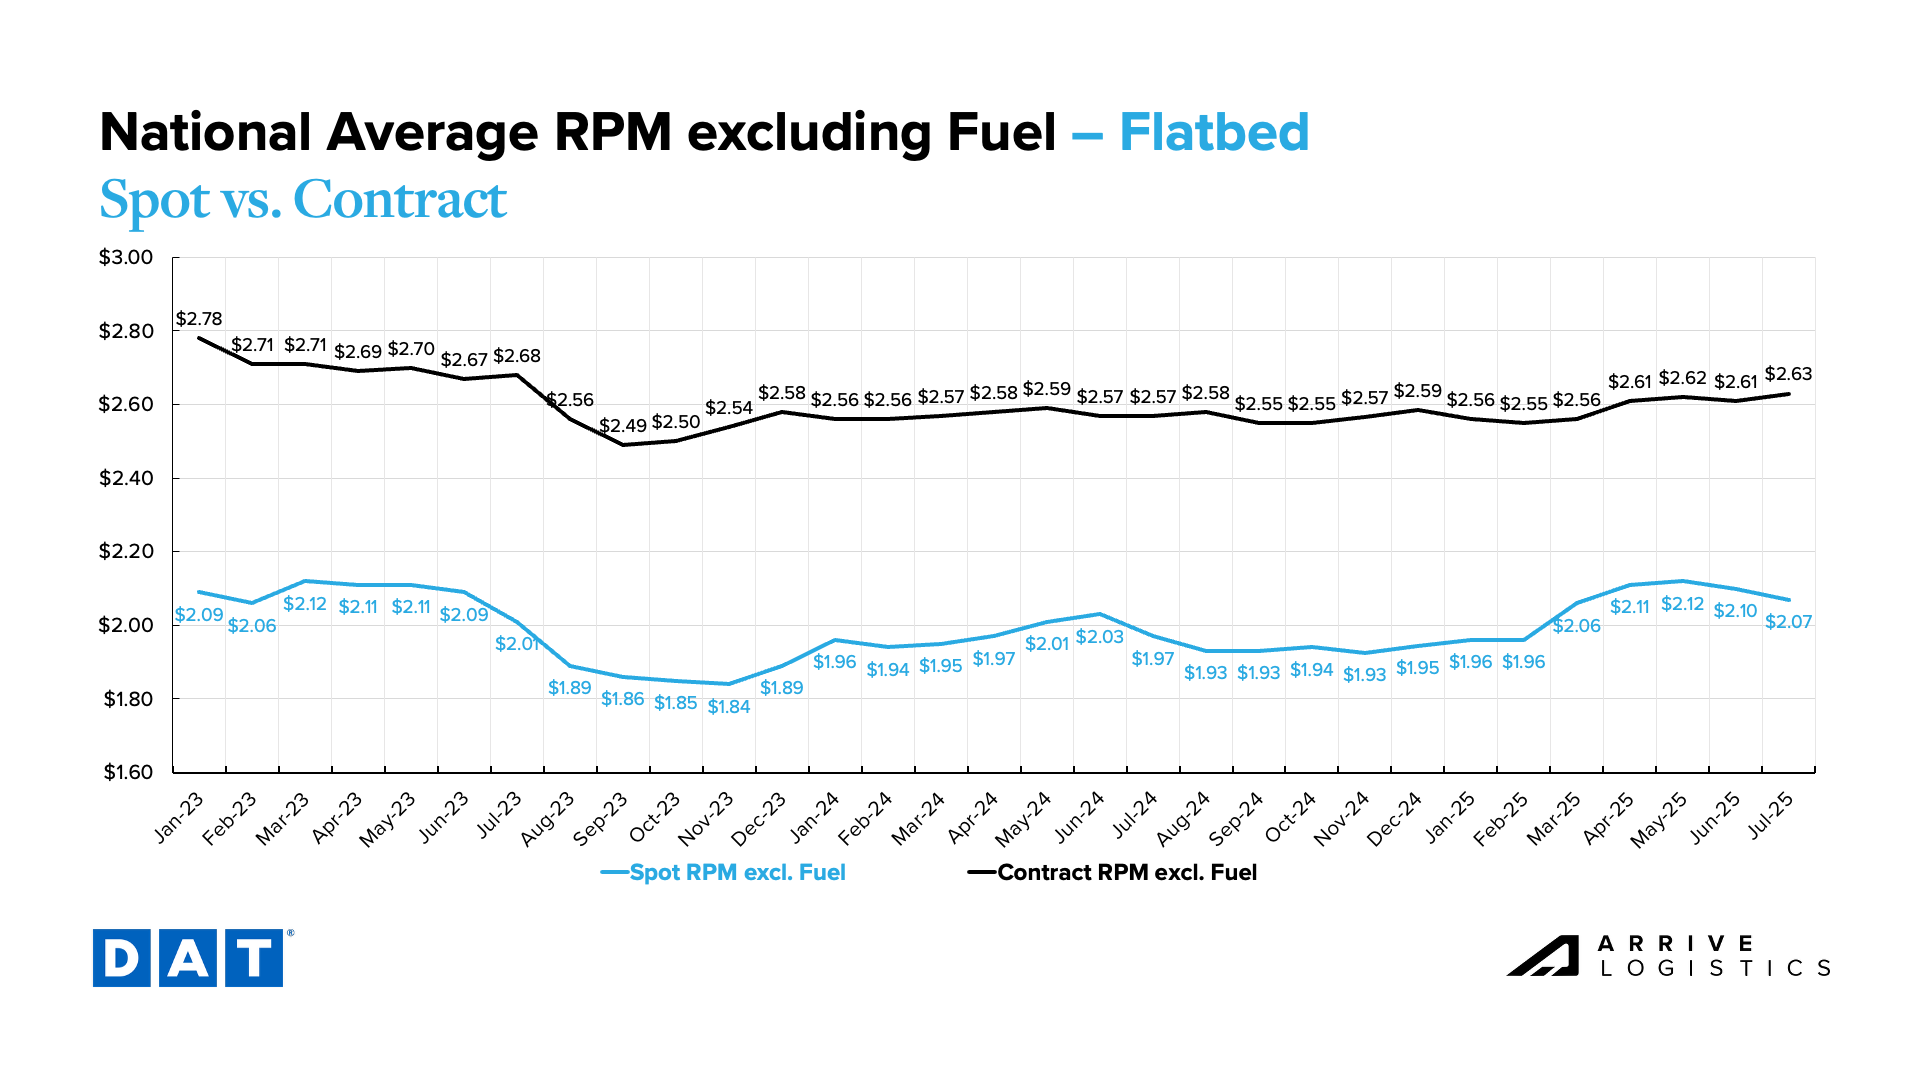
The short-lived volume surge offered carriers a brief reprieve from the persistently low rate environment. Supply showed some signs of strain but recovered quickly, indicating that current market conditions will likely persist or deteriorate further before improving.

For now, the only upside demand risk is the possibility that the Supreme Court rules that the use of the International Emergency Economic Powers Act (IEEPA) to enact retaliatory tariffs was illegal — a decision that could reverse the current policies and restore trade flows. Otherwise, demand will likely continue to fade in Q3 and remain soft well into next year. 

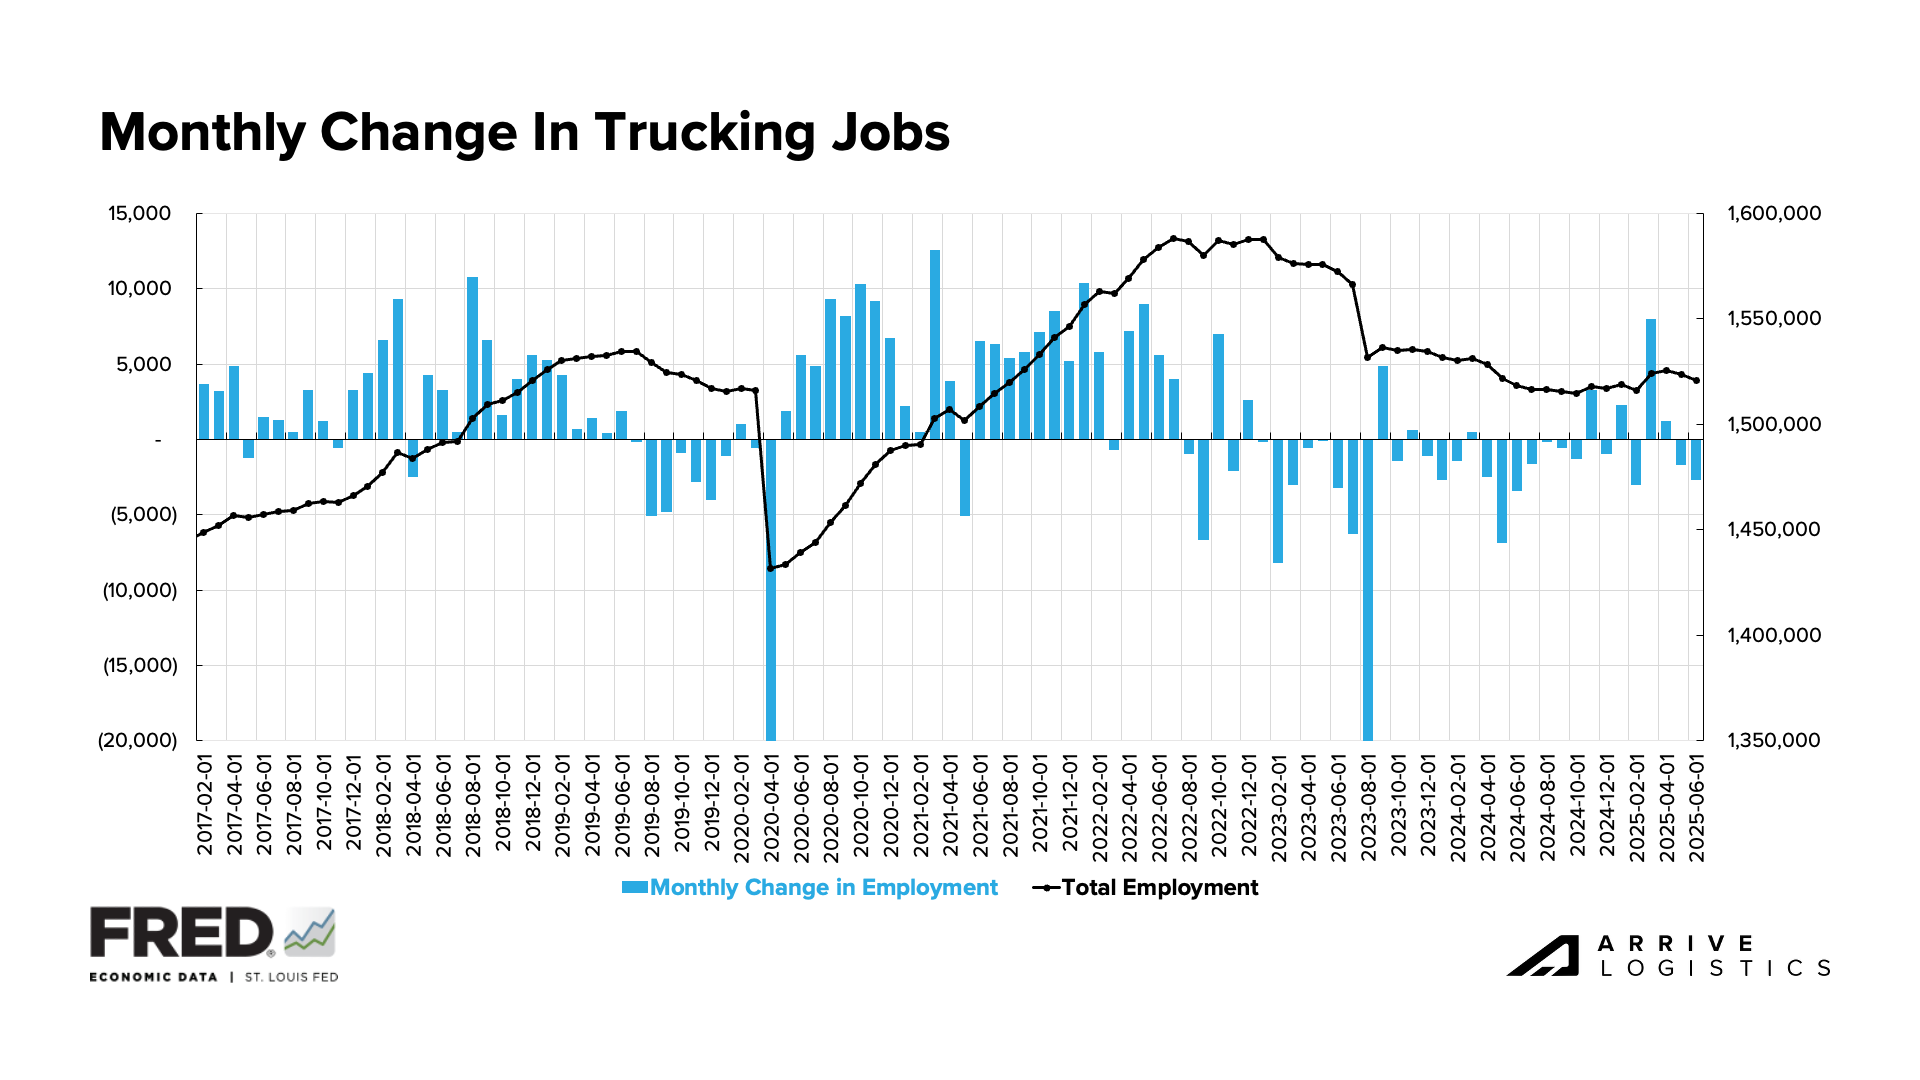
The combination of low demand, soft rates and high carrier operating costs remains the most significant risk to capacity. If current conditions persist, reductions will continue in the form of carrier exits and smaller truck counts at active fleets. Federal Motor Carrier Safety Administration initiatives like English proficiency requirements also pose a risk — the impacts have been limited so far, but that could change if enforcement ramps up.

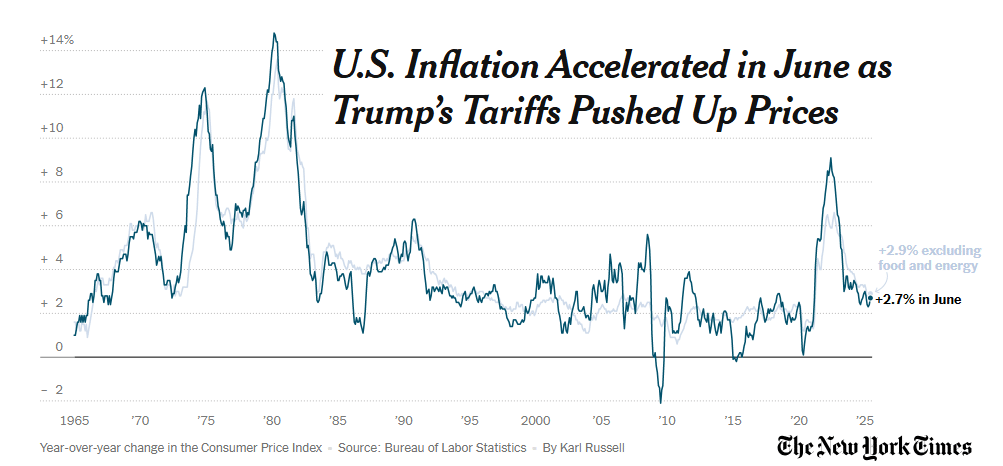
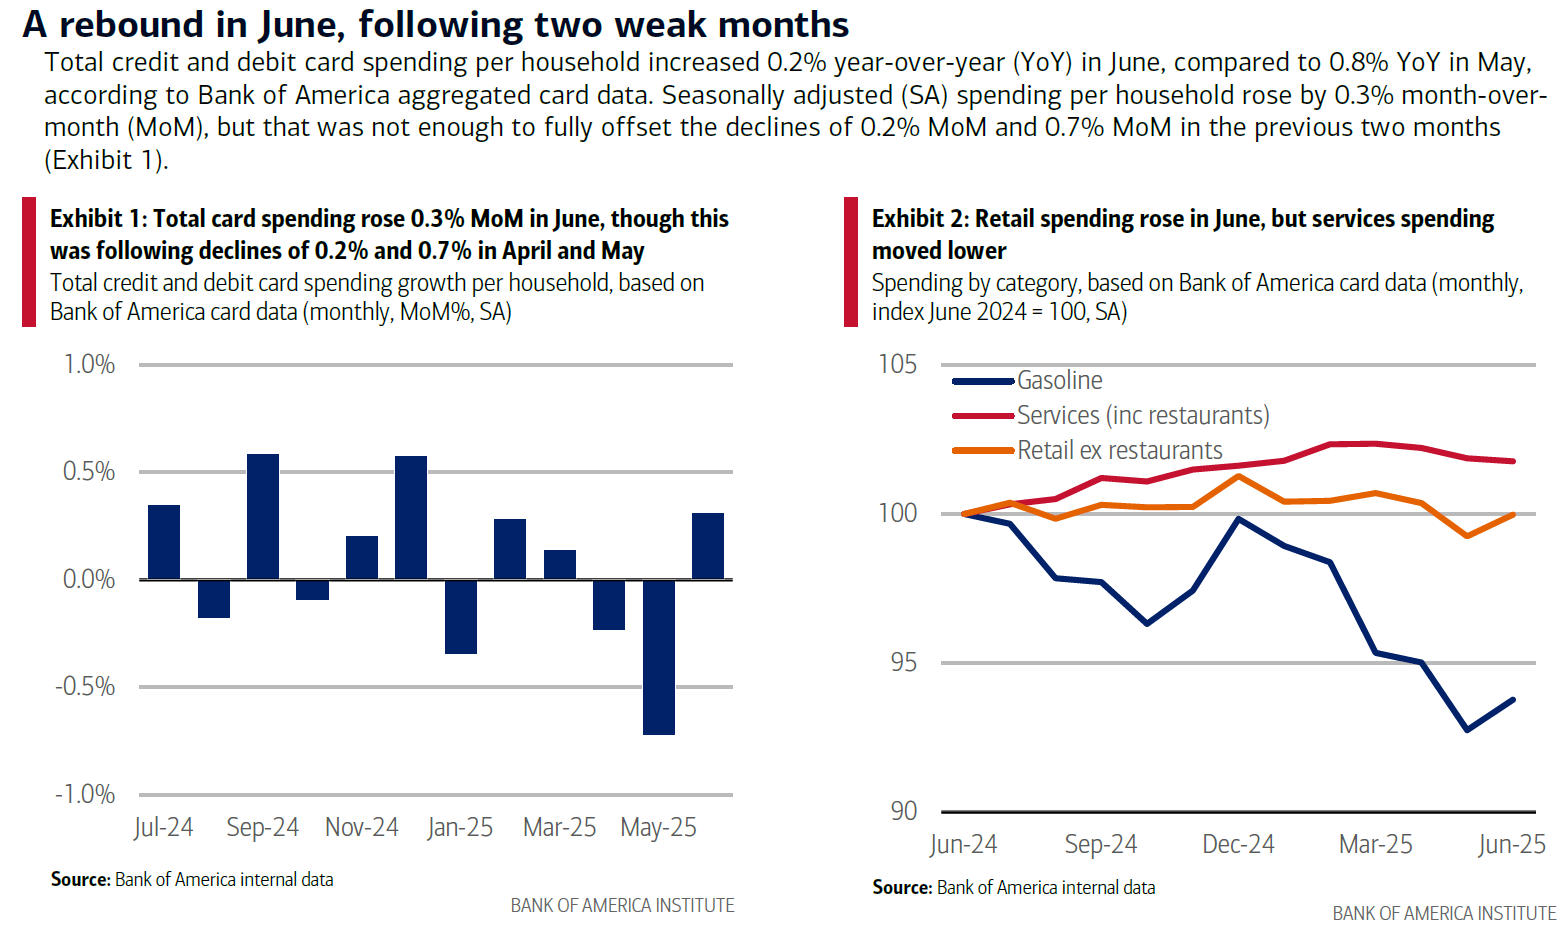
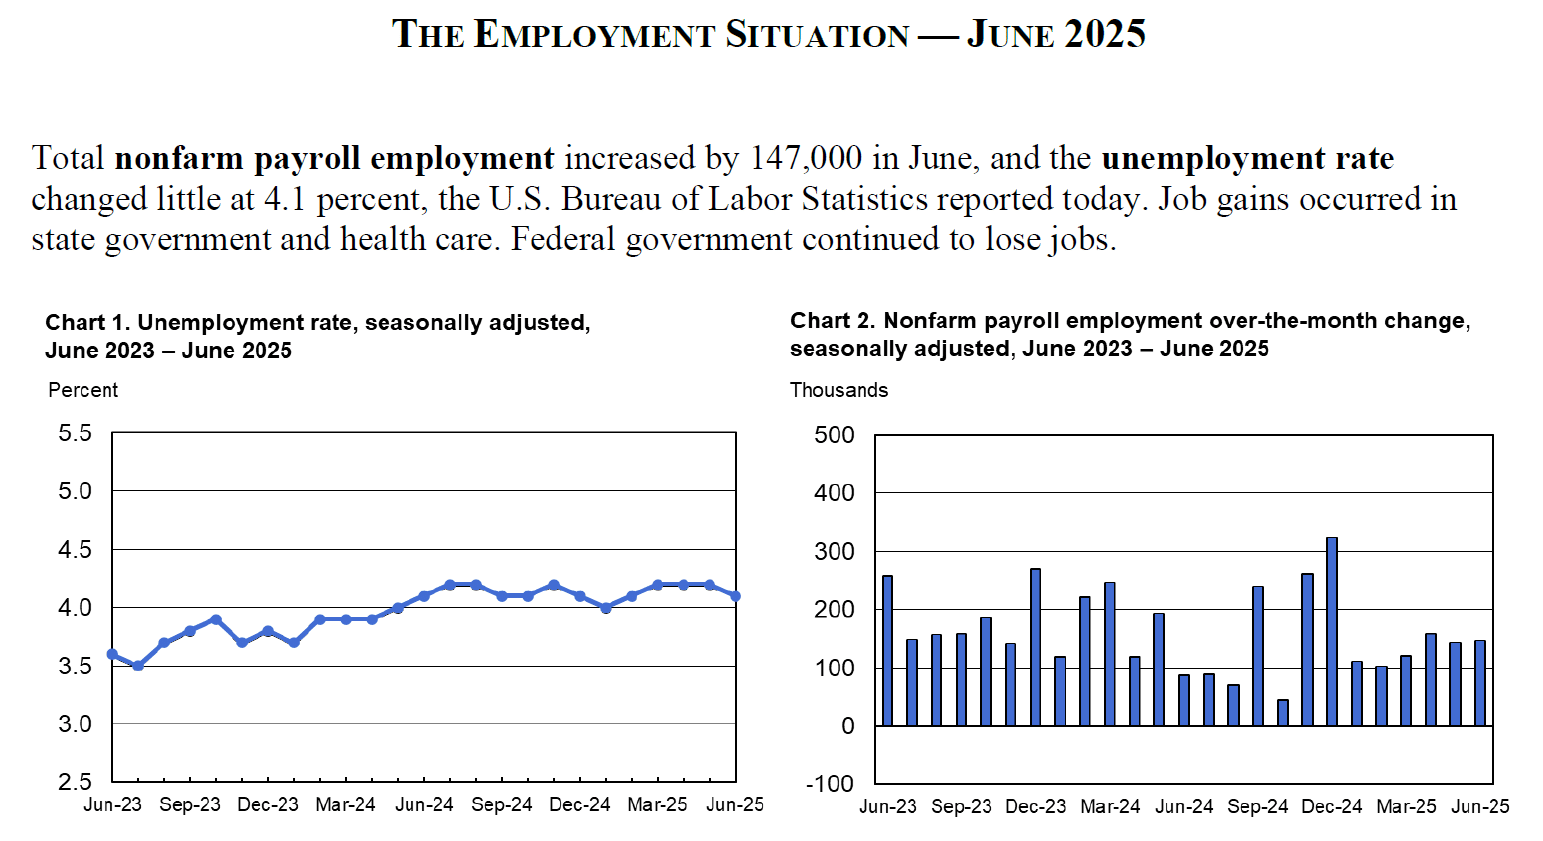
A healthy broader economy and relatively strong consumer spending should continue to support demand for now. The next period of volatility will come as the back-to-school shopping season begins, though rising inflation later this year could limit its impact.

That said, shippers and carriers can expect more of the same market conditions in August.

Keep reading for a closer look at what’s unfolding across demand, supply and rates.

Arrive Logistics VP of Market Intelligence David Spencer Headshot
David Spencer
VP of Market Intelligence

Key Takeaways

  • Demand is facing headwinds, with imports and manufacturing orders expected to decline.
  • The Fourth of July drove a short-lived spike in spot rate volatility, as June’s seasonal underperformance carried into July.
  • Overall capacity is at risk as persistently low equipment orders worsened in June, likely contributing to a reduction in the tractor population.
  • Enforcement of the Executive Order on English language proficiency has had limited impact so far and is unlikely to meaningfully affect overall capacity.
  • A recovery in import orders during the pause on elevated China tariffs stabilized volumes in June and likely drove further increases through July. However, the recovery is expected to be short-lived.
  • Spot rates climbed the week of the Fourth of July but have eased since, especially for dry van equipment. Seasonal patterns should keep volatility in check through Labor Day, with only minimal impacts expected.
  • Fuel prices rose in June and July in line with typical seasonal demand increases, but relative stability is expected moving forward.
  • A resilient economy and steady spending are helping stabilize freight demand. That said, the effects of tariff-related price hikes have yet to fully reach shoppers and thus pose the most significant risk to consumer-driven freight demand in the back half of the year.

Truckload Demand

Looking Back

Accepted contract volumes remained below prior-year levels in June. Spot activity rose 6% year-over-year, driven primarily by reefer and flatbed, while van volumes held flat.

The spot market lift likely stemmed from seasonal routing guide disruption — amplified by end-of-quarter pressure and fiscal year closeouts — alongside stabilizing import volumes in June. With tariffs on Chinese goods lifted in May, many shippers rushed to frontload freight, which should support continued import strength through the remainder of July.

Looking Ahead

With peak season and pull-forward activity winding down — and new import orders following suit — freight volumes are set to continue to see downward pressure through August. Back-to-school shopping may bolster volumes slightly but not nearly enough to drive a significant market shift. The outcome of the Supreme Court’s tariff decision remains a key variable, but until then, our forecast calls for muted demand well into next year.

Contract Load Accepted Volume, SONAR

Chart Notes
  • Accepted contract volumes continue to show weakness: FreightWaves SONAR data shows volumes have trended downward since late Q3 2024 and are now 17% lower year-over-year as of mid-July, following increases of 10% in Q1 and 13%–15% in Q2. Easing demand continues to define the supply-demand balance and hold rates near the floor.

DAT Trendlines

Chart Notes
  • Reefer and flatbed supported June spot demand, while capacity reductions drove up load-to-truck ratios: DAT data shows total spot volumes rose 6% year-over-year, led by a 5% increase in reefer and a 17% increase in flatbed postings. Van volumes held flat. Equipment postings declined 22% year-over-year in June — the 24th consecutive monthly drop.

Cass Freight Index Report – June 2025

Chart Notes
  • Cass Freight Index illustrates steady month-over-month volumes amid broader demand weakness: June volumes dipped just 0.2% from May and remain down 2.4% year-over-year as tariffs continue to weigh on demand. The index’s one- and two-year stacked changes — down 4.0% and 9.6% in May — showed slight improvement with the recent stabilization.

Cass Freight Index Shipments Forecast – June 2025

Chart Notes
  • Continued demand weakness likely through early 2026: In its latest truckload demand forecast, ACT Research outlined both upside and downside risks for freight volumes over the next year — including prolonged weakness tied to tariff-driven price hikes and a potential upside if the Supreme Court determines the IEEPA was used legally.

Descartes U.S. Container Import Volume

Chart Notes
  • Imports stabilize in June: Descartes data shows imports rose 1.8% month-over-month after a 9.7% drop in May. Year-over-year declines also improved, down just 3.5% compared to 7.2% the month prior. While imports from China held flat, gains from other Southeast Asian countries helped West Coast ports reclaim 6.7% of market share.

Inbound Ocean TEUs Volume Index, SONAR

Chart Notes
  • Imports trending down after recent rally: A pause on elevated China tariffs drove import orders to a peak of +12% year-over-year in early July. But by mid-month, volumes had slipped back into slightly negative territory, proving the rally was short-lived amid high inventories and softening consumer goods spending.

Manufacturing at a Glance, Manufacturing ISM

Chart Notes
  • Manufacturing contraction: The ISM Manufacturing Index declined for the fourth straight month, with new orders and the order backlog both contracting. Production expanded slightly, but with orders still weak, the trend is not expected to hold. Continued manufacturing weakness, a key driver of freight activity, will likely further limit demand.

Monthly Business & Economic Highlights, FTR

Chart Notes
  • Mostly weak economic indicators: FTR reported sluggish economic performance with only a few signs of strength in May. Despite soft goods spending, tariff-related risks and broader uncertainty continue to weigh on economic activity. Declining production and reduced imports are expected to limit freight demand, though a recent court ruling and temporary stay on tariff enforcement have complicated the outlook.

Truckload Supply

Looking Back

Supply easily handled June’s muted seasonal demand surge. Van rejection rates ticked up in the back half of the month but stayed well below historical norms and failed to generate meaningful pricing pressure. Reefer rejections were slightly higher year-over-year but followed a similar pattern.

Class 8 truck orders were below replacement levels for the fifth straight month, as carriers remained hesitant to invest in fleets amid weak demand. Trucking employment and active carrier counts also continued to decline, signaling that supply is still slowly but steadily contracting.

Looking Ahead

Unless near-term volumes rebound significantly, capacity reductions will continue this year. And with a major demand shock remaining unlikely, capacity reduction alone won’t be enough to drive a meaningful market shift.

Outbound Tender Reject Index, SONAR

Chart Notes
  • Tender rejections illustrate shortened peak season: Rejections typically rise in late June and peak ahead of the Fourth of July. Though that pattern held true this year, the surge arrived late and faded quickly, indicating a shorter peak season than usual.

Van Outbound Tender Rejection Index, SONAR

Chart Notes
  • Dry van rejections elevated in 2025: Despite the shorter peak season, tender rejections still climbed to nearly 8% — about 1.5% higher than the Fourth of July peak in 2024. The increase and continued year-over-year gains point to less reliable shipper routing guides, even as demand continues to soften.

Reefer Outbound Tender Rejection Index, SONAR

Chart Notes
  • Reefer tender rejections less affected by tariff disruptions: Reefer rejections have followed more typical seasonal patterns than van, with tightness concentrated in key summer produce regions, especially the Southeast and Central California.

Flatbed Outbound Tender Rejection Index, SONAR

Chart Notes
  • Flatbed rejection rates in early July exceed 2023 and 2024 levels: Early-year flatbed volatility gave way to more stable conditions through Q2. However, recent trends point to another increase in year-over-year tender rejections in early Q3, which is typically the tail end of the flatbed peak season.

Van Load-to-Truck Ratios

Reefer Load-to-Truck Ratio

Chart Notes
  • Dry van and reefer ratios underperform in June: Limited spot opportunities kept dry van load-to-truck ratios flat and drove reefer ratios down.

Flatbed Load-to-Truck Ratios

Chart Notes
  • Flatbed load-to-truck ratios ease but remain elevated: Flatbed conditions softened through May and June following significant tightening early in 2025, but DAT reports supply remains tighter than in previous years.

Morgan Stanley Dry Van ONLY Truckload Freight Index

Chart Notes
  • Morgan Stanley Index shows weak seasonality across equipment types: Van, reefer and flatbed indices all trended down through June, reinforcing the soft seasonal response reflected in other key data sources.

Morgan Stanley Reefer Truckload Freight Index

Morgan Stanley Flatbed Truckload Freight Index

Carrier Revocations, New Carriers & Net Change in Carrier Population, FTR

Chart Notes
  • Carrier population contracts in June: The carrier count fell by nearly 500 after two consecutive months of growth, according to FTR.

Class 8 Tractor Net Orders, ACT Research

Chart Notes
  • Tractor orders continue to show weakness: Class 8 tractor orders fell to 4,700 units in June, down 34% year-over-year and less than half the volume needed to maintain replacement levels. Recent manufacturer price increases to account for steel and aluminum tariffs of 25% to 50% have added several thousand dollars to the cost of each truck.

Monthly Change in Trucking Jobs, FRED Economic Data

Chart Notes
  • Employment declines: While total employment is seeing its strongest year-over-year growth since 2023, declines in May and June suggest a downward trend that will likely persist if demand and rates remain under pressure.

Active Truck Utilization, FTR

Chart Notes
  • Truck utilization forecast remains steady: FTR’s forecast was unchanged in June but still calls for some softening later this year.

U.S. Class 8 Tractors Backlog & Backlog/Build Ratio, ACT Research

Chart Notes
  • Backlog-to-build ratio falls: Class 8 tractor backlogs declined by roughly 8,800 units in June, bringing the backlog-to-build ratio down from 4.8 months to 4.3 months.

For-Hire Driver Availability Index, ACT Research

Chart Notes
  • Driver availability softens further: May marked the 36th consecutive month of softening in ACT Research’s Driver Availability Index, which tightened 3.1 points from April. 

For-Hire Trucking Survey: Supply-Demand Balance, ACT Research

Chart Notes
  • Demand weakness expected to drive softer market balance: ACT reports that weakening economic activity and declining imports will continue to weigh on freight volumes. In turn, capacity is expected to contract, keeping the market at or near equilibrium.

Truckload Rates

Looking Back

Spot rates were volatile around the Fourth of July, but the surge faded as quickly as it arrived, particularly for dry van equipment. National trends softened further as the month progressed and indicators point to flat or declining year-over-year rates through the remainder of July as the market finds a new floor.

Looking Ahead

Rates will likely follow historical trends through August amid declining demand and slow capacity attrition. Some volatility could emerge around Labor Day, but any disruption is expected to be muted and short-lived. 

Truckstop Weekly National Average Spot Rates

Chart Notes
  • Rates spike due to holiday pressures: Van and reefer rates abruptly surged during the week of July 4 compared to a more gradual climb last year. The spike mirrored mid-May trends and reflects how the market responds to short weeks when typical capacity patterns are disrupted.

DAT Monthly Rate Trends

Chart Notes
  • Van and reefer rates rise: All-in dry van rates rose $0.03 per mile in June and climbed another $0.05 per mile in early July. Reefer rates were up $0.01 per mile in June and have increased by $0.07 per mile through mid-July.
  • Flatbed rates locked in: Flatbed rates have held steady at $2.57 per mile, including fuel, for four consecutive months.

DAT Fuel Trends

Chart Notes
  • Diesel prices trend up: Diesel prices rose from May lows amid increased seasonal demand in June and July. The latest U.S. Energy Information Administration forecast calls for modest increases but overall price stability.

DAT Dry Van National Average RPM Spot vs. Contract

Chart Notes
  • Underperformance in June leads to July dry van rate hike: Strong June seasonality typically results in larger rate increases that fade by late July. This year, however, underperformance pushed most of that spike into July, creating an atypical month-to-month trend. Rates are now declining in late July and are expected to ease further in August. Spot rates were down 0.6% year-over-year from $1.64 per mile in June 2024, but are currently up 1.8% from July 2024 levels.
  • Spot-contract gap holding steady: The dry van spot-contract gap has hovered between $0.38 per mile and $0.43 per mile over the past six months and sits at $0.38 per mile in mid-July. A smaller gap suggests greater market sensitivity to disruption, though the current reading still signals limited risk of sustained volatility.

DAT Temp Controlled National Average RPM Spot vs. Contract

Chart Notes
  • Reefer linehaul rates rise with peak season demand: Spot linehaul rates fell from $1.95 per mile in May to $1.94 per mile in June 2025. Year-over-year, rates were down 2.0% from $1.98 per mile in June 2024 but are currently up 1.0% from July 2024 levels.
  • Reefer spot-contract gap narrows in July as spot rates hold: An uptick in July spot rates narrowed the reefer spot-contract gap from $0.36 per mile in June to $0.31 per mile in July. While a smaller gap typically signals greater market sensitivity to disruption, current levels still suggest limited risk of sustained volatility.

DAT Flatbed National Average RPM Spot vs. Contract

Chart Notes

  • Flatbed linehaul rates seeing stable year-over-year growth: After strong early-season gains, flatbed spot linehaul rates have stabilized in June and July. Rates rose 5.5% year-over-year in May, 3.4% in June and are up 5.1% in mid-July.

Economic Conditions

Looking Back

June data showed a moderate month-over-month increase in consumer spending and more labor market strength as unemployment dipped slightly. Inflation also ticked up but it has yet to directly impact freight demand. 

Looking Ahead

A strong labor market should continue to support consumer health through the end of the quarter, but rising prices for consumer goods due to tariff-related hikes remain a real risk to spending.

Consumer Price Index, New York Times

Chart Notes
  • Inflation accelerates in June: The first signs of tariff-driven inflation have appeared in the June CPI report, with prices rising 2.7% year-over-year, up from 2.4% in May. The month-over-month increase also rose to 0.3%, compared to 0.1% in May. The reading lowers the likelihood of interest rate cuts, which will limit any near-term freight demand upside from monetary policy.

Bank of America Total Card Spending, Bank of America Consumer Checkpoints

Chart Notes
  • Signs of slowing consumer spending in June: Bank of America reported that seasonally adjusted household spending rose 0.3% month-over-month and 0.2% year-over-year in June. Although spending increased from the prior month, growth compared with the prior year slowed from 0.8%. Analysts noted particular weakness in discretionary services, though the slowdown was not broad-based.

Employment Situation – June 2025, U.S. Bureau of Labor Statistics

Chart Notes
  • Unemployment little changed, payrolls increase: The unemployment rate has hovered within a narrow range of 4.0% to 4.2% since June 2024 and was little changed from May to June 2025. A stable labor market typically provides the foundation for consumer spending health, which is important for sustaining freight demand.

Navigate the freight market
with confidence.

Get this free report delivered straight to your inbox every month.

Download July 2025 Freight Market Update

Scott Sandager,
Chief Administrative Officer 

Scott Sandager is the Chief Administrative Officer at Arrive Logistics. He joined Arrive in 2018, bringing over 14 years of logistics and brokerage experience, with expertise in project and change management, organizational design, talent development and customer satisfaction. Scott previously held many diverse roles of increasing responsibility with AFN, a Chicago-based freight brokerage.

Subscribe to receive freight market updates​​

"*" indicates required fields


Subscribe to receive freight market updates

Quick Apply

"*" indicates required fields

Max. file size: 50 MB.

Arrive Carrier Requirements

Please have the following info ready to complete registration

  • MC, MX, DOT, or state reg #
  • Tax ID & W9 info
  • Cert of Insurance: $100k cargo, $1M Auto, & $1M commercial general liability coverage
  • Active Common or Contract Authority (365+ days)
  • Safety Rating of at least Satisfactory (or None)

Fraud Prevention

Freight fraud continues to impact our industry. We encourage shippers and carriers to reach out to Arrive immediately if there is ever a shipment in question that may be subject to fraud (including fictitious actors and websites). Arrive will not ask you to pay upfront for any dedicated lane or committed capacity program. If the offer you are receiving sounds too good to be true or unrealistic, it may be fraud. Arrive Logistics recommends verifying all communications come from our registered email domain is @arrivelogistics.com. Our 24/7 phone number is 888-861-0650 and our leadership team can also be reached at feedback@arrivelogistics.com.

Use of Cookies

We use cookies to enhance your browsing experience, serve personalized ads or content, and analyze site traffic. By continuing to use this website, you acknowledge and consent to our use of cookies as detailed in our privacy policy.

Get Access to the Shipper Portal

Current Customers

Already shipping with Arrive?

Connect with your representative to get access to your ARRIVEnow Shipper Portal. Can’t connect with your rep? Use this form to reach out.

New Customers

Not shipping with Arrive yet?

If you’re not an Arrive customer, please join our network to access the portal.

Carrier Scorecard Feedback

Contact Us

"*" indicates required fields

Matt Pyatt, Chief Executive Officer

Matt Pyatt is the Chief Executive Officer of Arrive Logistics. He co-founded Arrive with President Eric Dunigan in 2014 after building his career at Command Transportation. As CEO, he is responsible for overseeing the company’s financial health, strategic vision and culture, as well as building a scalable leadership team to support Arrive’s growth.

Request Arrive's SOC 2 Report

Eric Dunigan,
President & Co-Founder

Eric Dunigan is the President of Arrive Logistics. He began his career at Command Transportation before co-founding Arrive with Matt Pyatt in 2014. As president, he is responsible for driving revenue and growth, as well as leading the Strategic Partnerships team — a veteran group of supply chain experts who work with Arrive’s customers to reimagine their shipping strategy.

Arrive Logistics VP of Market Intelligence David Spencer Headshot

David Spencer,
VP of Market Intelligence

David Spencer is the Vice President of Market Intelligence at Arrive Logistics. David joined Arrive in 2017 after spending six years at AFN focused on business intelligence. His department provides critical market data and expert analysis to internal teams and publishes monthly market updates for shippers and carriers under the Arrive Insights banner.

Andrew Clarke, Board Chair,
Arrive Logistics and Global Critical Logistics

Andrew Clarke is Board Chairman for Global Critical and DCLI, Inc., and a board member for Arrive Logistics and Element Fleet Management Corp. His 20 years of global transportation and logistics experience include time as CFO of C.H. Robinson, CEO of Panther Expedited Services, Inc. and SVP and CFO roles at Forward Air Corporation.

Dean Croke,
Principal Analyst
at DAT Freight and Analytics

Dean Croke is a Market Analyst at DAT Solutions, where he focuses on freight market intelligence and data analytics. His 35 years of experience with data analytics, transportation, supply chain management, mining and insurance risk management include time as co-founder of FleetRisk Advisors and in a number of other high-level roles with FreightWaves, Spireon, Lancer Insurance, Omnitracs Analytics (formerly Qualcomm) and more.

Asanka Jayasuriya,
CTO and Partner at 8VC

Asanka Jayasuriya is the CTO at 8VC. He is an accomplished engineering and product leader with 20+ years of experience in the cloud. He has a strong background in enterprise SaaS, PLG products, infrastructure, and security. Notably, he served as CTO and SVP of Engineering at SailPoint, leading their successful transition to the cloud and successful exit event. He also held senior leadership roles at InVision, Atlassian, and Amazon, driving growth, operational excellence, and innovation. At 8VC, Asanka works with the entrepreneurs and leaders in our portfolio as a virtual CTO supporting their growth.

Chad Eichelberger,
President at Reliance Partners

Chad Eichelberger is the President of Reliance Partners. Since 2015, he’s leveraged his extensive experience in risk management, compliance, best practices and contracts to lead the company’s logistics and truck insurance strategy and operations. Chad was previously the President of Access America Transport, where he led the company from $8M to over $600M in revenue.

Barry Conlon,
CEO & Founder at Overhaul

Barry Conlon is the CEO and founder of Overhaul, the global leader in active supply chain risk management and intelligence. With a remarkable career spanning over 30 years in supply chain security, he is widely regarded as a trailblazer in modern-day supply chain security standards and best practices.

Tim Denoyer,
VP and Senior Analyst at ACT Research

As VP and Senior Analyst at ACT Research, Tim analyzes commercial vehicle demand and alternative powertrain development (i.e. electrification), and authors the ACT Freight Forecast, U.S. Rate and Volume Outlook. He previously spent fifteen years in equity research focused primarily on the transportation, machinery, and automotive industries, and co-founded leading equity research firm Wolfe Research.

Download this Report

"*" indicates required fields

Add me to the monthly distribution