The short-lived seasonal spike in early July delivered only a brief respite from the stagnant freight market. Seasonal demand caused rates to rise around the Fourth of July holiday, but they quickly slid back, returning to the floor with both spot and contract rates finishing the month flat year-over-year.
On the demand side, activity out of China and Hong Kong drove a sharp import recovery as shippers front-loaded what is typically late-summer retail volume. With inventories still elevated and most seasonal freight already in position, that early push suggests the peak import season, typically seen later in Q3, is already winding down.
Supply remains mostly abundant even as carrier attrition continues. However, there are signs of real challenges that could lead to vulnerable conditions should demand firm up or grow materially. Class 8 tractor orders remain below replacement levels, signaling a likely decline in equipment levels that could tighten capacity in the months ahead. Recent legislation regarding driver English proficiency requirements has also had little, if any, impact on supply conditions.
Looking ahead, fall retail shopping and Labor Day demand may give volumes a slight boost, especially for temperature-controlled freight. But if last year is any indication, the impact will likely be muted. Beyond the near-term, the conditions defining this summer — soft demand, steady supply, low rates and a wide spot-to-contract rate gap — appear set to carry into fall.
Read the full report for a closer look at trends across demand, supply and rates.
David Spencer
VP of Market Intelligence
Key Takeaways
Demand is facing headwinds, with import orders sliding and manufacturing orders expected to decline.
Early July spot rate volatility faded in line with typical seasonal patterns as the month progressed.
Overall capacity remains at risk as persistently low equipment orders continued in July, likely contributing to a reduction in the tractor population.
Enforcement of the Executive Order on English language proficiency has had limited impact so far and is unlikely to meaningfully affect overall capacity.
A strong recovery in import orders from China led to the second-highest import reading ever in July. However, with orders now fading, that trend is likely to reverse sharply in the coming months.
Spot rates, particularly for temperature-controlled equipment, may see some stabilization or upward pressure in the lead-up to Labor Day but should otherwise remain subdued.
A resilient economy and steady spending are helping stabilize freight demand, but tariff-related price hikes have yet to fully reach shoppers and thus remain the most significant risk to consumer-driven demand in the back half of this year or early next.
Truckload Demand
Looking Back
July import volumes surged roughly 25% from June, driven almost entirely by shipments from China (44%) and Hong Kong (48%) following the temporary easing of tariffs earlier in the year. Much of that freight moved by rail rather than over the road, which kept truckload demand and rate pressure in check despite near-record volumes at the Port of Los Angeles.
On the domestic side, spot activity climbed sharply — up about 20% year-over-year — while contract volumes remained below prior-year levels. The timing of the import spike pulled typical late-summer retail freight into July, aligning with the seasonal lift around the Fourth of July. Spot activity faded quickly and rates returned to the floor as the month progressed.
Looking Ahead
With the bulk of seasonal retail imports already stateside, freight demand faces renewed downward pressure through the remainder of Q3. Retail import forecasts point to significant pullbacks through year-end as earlier pull-forward reduces the need for replenishment. New manufacturing orders and the order backlog also continue to contract. While fall retail shopping and Labor Day may give volumes a temporary bump, the gains are likely to be muted.
Tariff policy remains a potential risk, though no immediate changes are expected. For now, steady supply and subdued demand suggest the market will stay soft heading into fall.
View Related Data
Contract Load Accepted Volume, SONAR
Chart Notes
Accepted contract volumes continue to show weakness: FreightWaves SONAR data shows volumes have trended downward since late Q3 2024 and are now 16% lower year-over-year as of mid-August, following increases of 10% in Q1 and 13%–15% in Q2. Easing demand continues to define the supply-demand balance and keep rates near the floor.
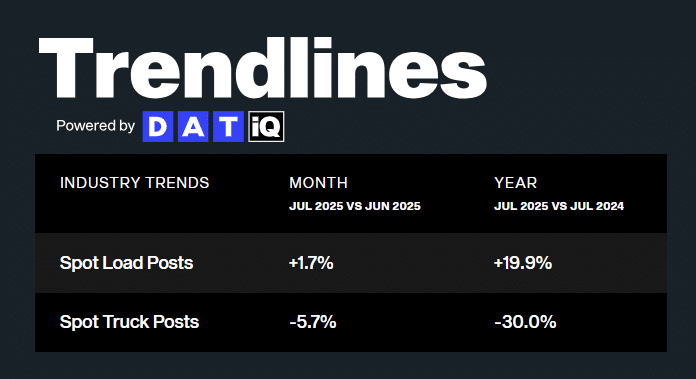
DAT Trendlines
Chart Notes
Spot demand increased across all equipment types, driving up load-to-truck ratios in July: DAT data shows total spot volumes rose 19.9% year-over-year, led by a 23% increase in reefer postings, 26% increase in flatbed postings and a 14% increase in van postings. Equipment postings fell 30% year-over-year in July — the 25th straight month of year-over-year declines.
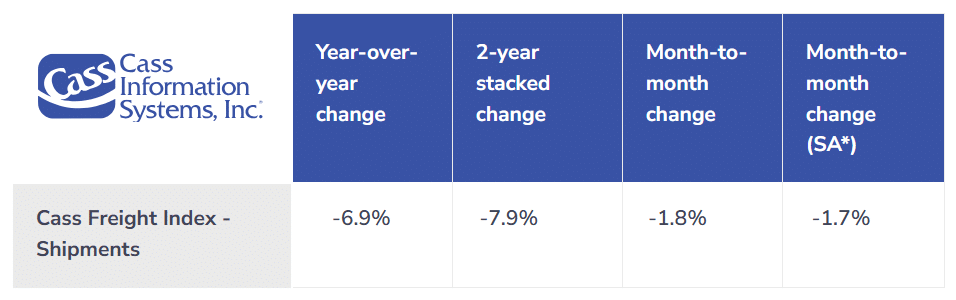
Cass Freight Index Report – July 2025
Chart Notes
Cass Freight Index illustrates demand weakness in July: Volumes fell 1.8% from June and were down 6.9% from a year earlier as tariffs weighed more heavily on shipments. Recent import strength could point to a modest rebound in August, which typically sees a seasonal dip from July.
Cass Freight Index Shipments Forecast – July 2025
Chart Notes
“Freight recession to persist into 2026”: In its latest truckload demand forecast, ACT Research said tariff-driven inflation and freight pulled forward earlier this year will weigh on volumes in the months ahead.
Descartes U.S. Container Import Volume
Chart Notes
Imports fall just shy of all-time high in July: Descartes data shows imports jumped 18.2% from June after a 9.7% decline in May. The surge was driven by a 44.4% month-over-month increase in imports from China and a 47.8% increase from Hong Kong.
Inbound Ocean TEUs Volume Index, SONAR
Chart Notes
Imports reverse trend after July spike: A pause on elevated China tariffs pushed import orders up 12% year-over-year in early July, but the recovery was short-lived. Volumes in 2025 have since fallen below 2023 levels and are expected to keep trending downward, signaling a pullback in the second half of the year and an earlier-than-normal peak season for inbound shipments.
Monthly Imports, National Retail Federation
Chart Notes
Retail imports to decline in 2H 2025: The National Retail Federation expects retailers to scale back imports after a strong pull-forward in the first half. The pullback should soften related demand and keep peak season rate pressures in check.
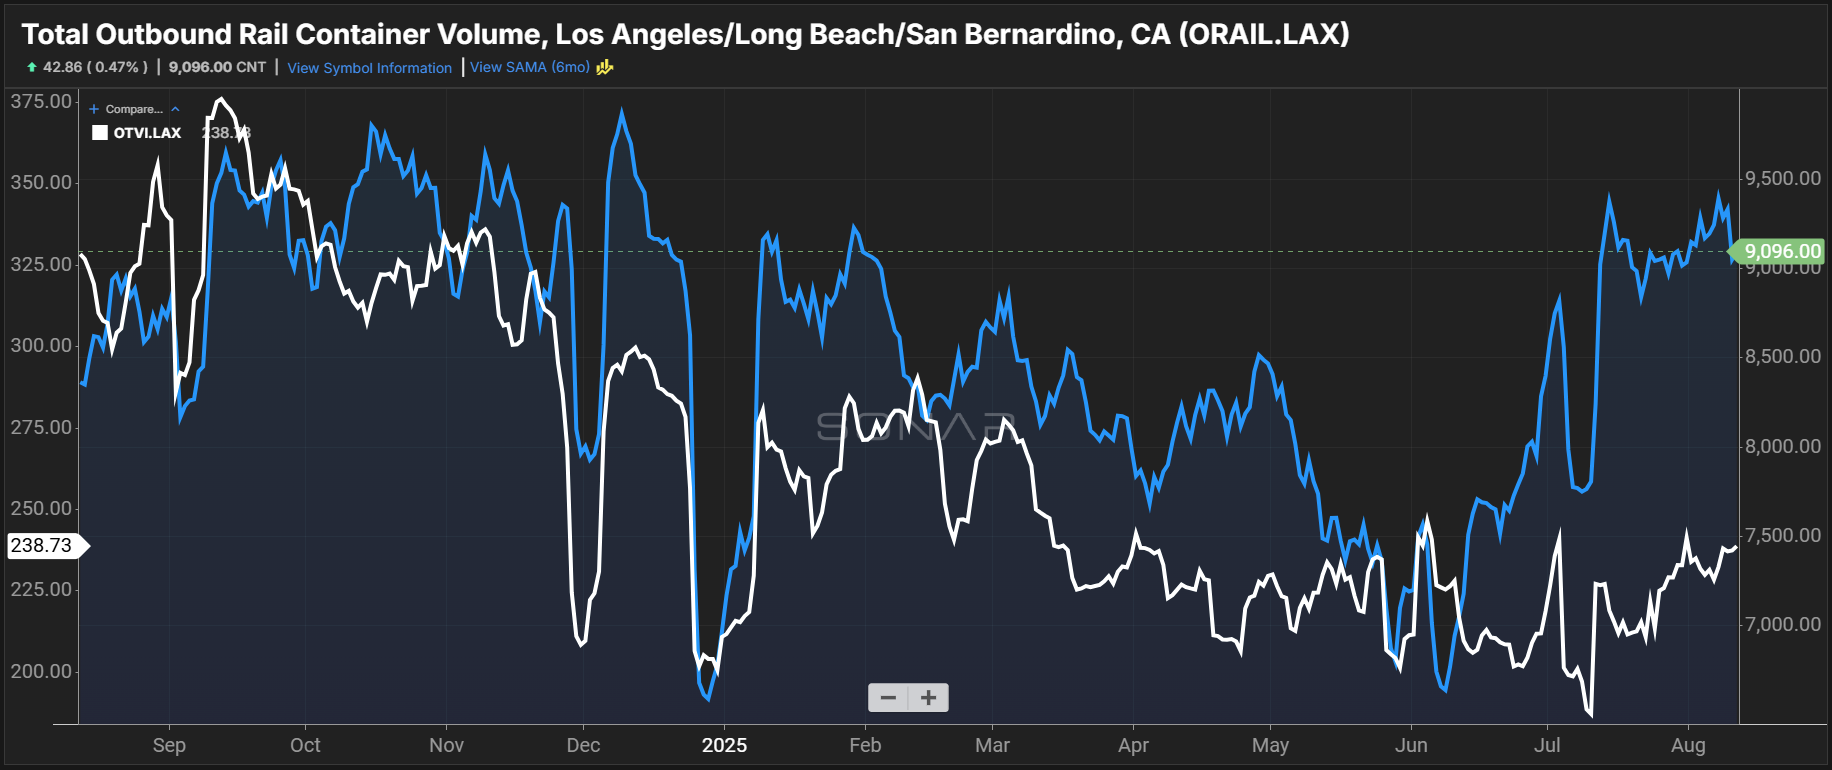
Total Outbound Rail Container Volume, SONAR
Chart Notes
July import surge absorbed by rail: Descartes data shows volumes rose 18% at the Port of Los Angeles and 24% at the Port of Long Beach from June to July. The increase was largely absorbed by rail, limiting upward pressure on dry van rates, though some tightness emerged. Future import surges are also likely to be supported heavily by rail.
Manufacturing at a Glance, Manufacturing ISM
Chart Notes
Manufacturing contraction: The ISM Manufacturing Index fell for the fifth straight month, with both new orders and backlogs contracting. Production expanded slightly, but with orders still weak, the trend is unlikely to last. Ongoing manufacturing softness — a key driver of freight — is expected to further limit demand.
Monthly Business & Economic Highlights, FTR
Chart Notes
‘Solid but not robust’ economic indicators in June: FTR reported muted economic performance in June. Production and manufacturing remain relatively weak, though tariffs have not yet significantly affected goods prices.
Truckload Supply
Looking Back
Ample truckload capacity kept last month’s demand surge from generating more than short-lived rate volatility. Since the holiday, conditions have eased in line with typical patterns. Van tender rejection rates then followed the usual post-Fourth of July decline, while reefer rejections held relatively stable. Flatbed rejections eased, landing below earlier-year highs but still above year-ago levels.
Looking Ahead
Van capacity is expected to remain abundant through most of this quarter, with a slight blip possible around Labor Day. Reefer markets are likely to see a modest bump during the same period. Beyond the holiday, persistently weak equipment orders indicate supply could soon begin to tighten, following demand to the downside. If demand were to stabilize and begin to grow, it could expose ongoing capacity reductions.
View Related Data
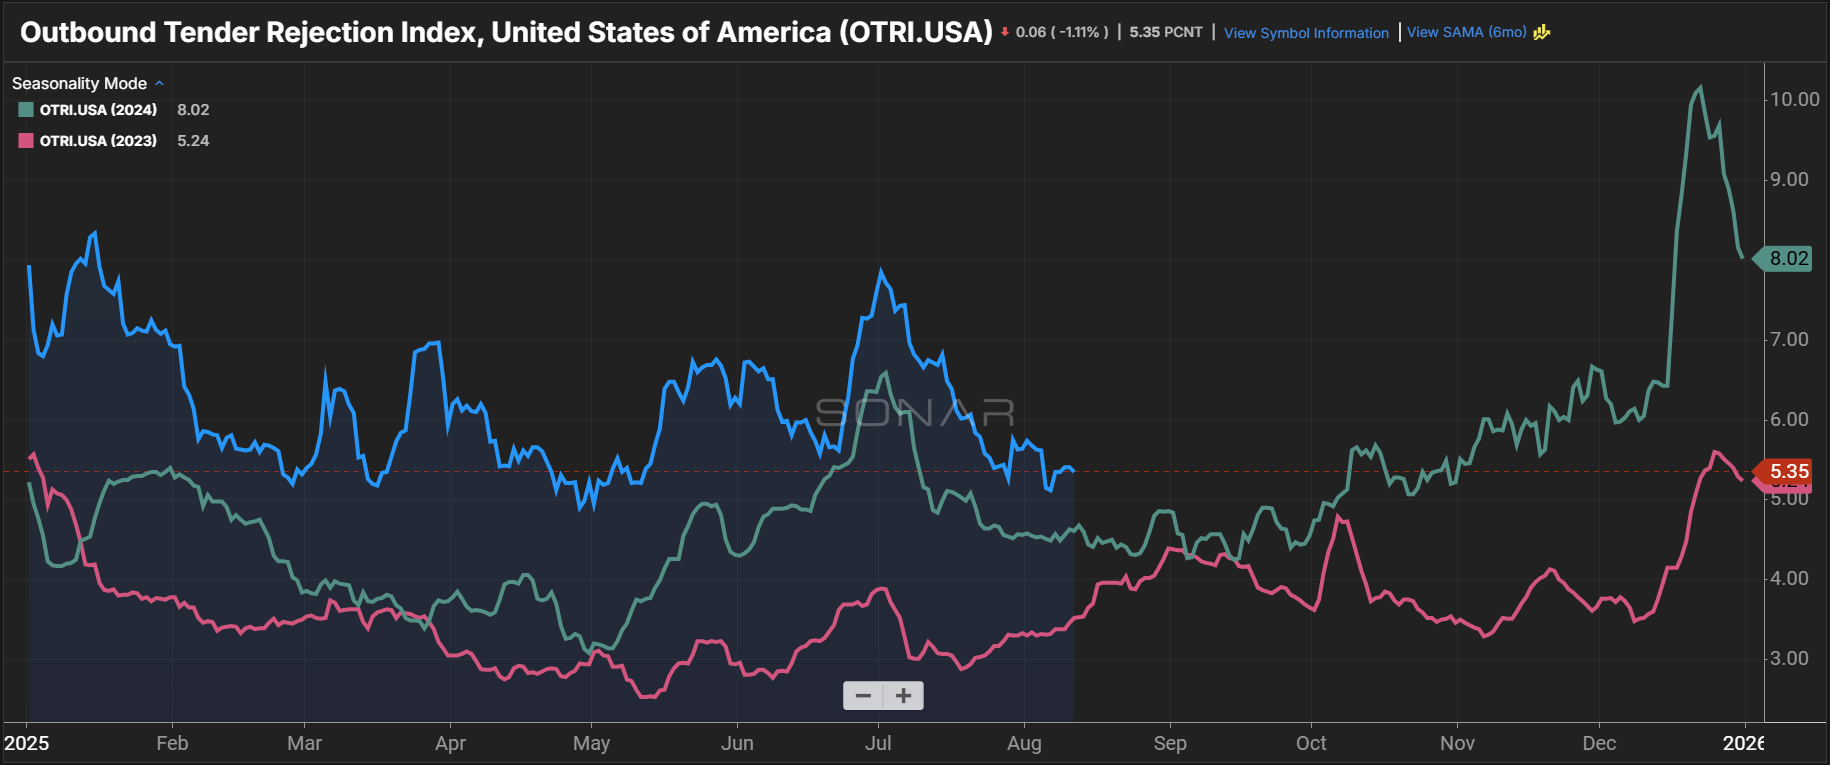
Outbound Tender Reject Index, SONAR
Chart Notes
Tender rejections follow historical trends in July: Rejections eased in line with expectations after the July 4 holiday peak. The brief holiday volatility suggests the market could see similarly short-lived swings through the rest of the year, starting with Labor Day.
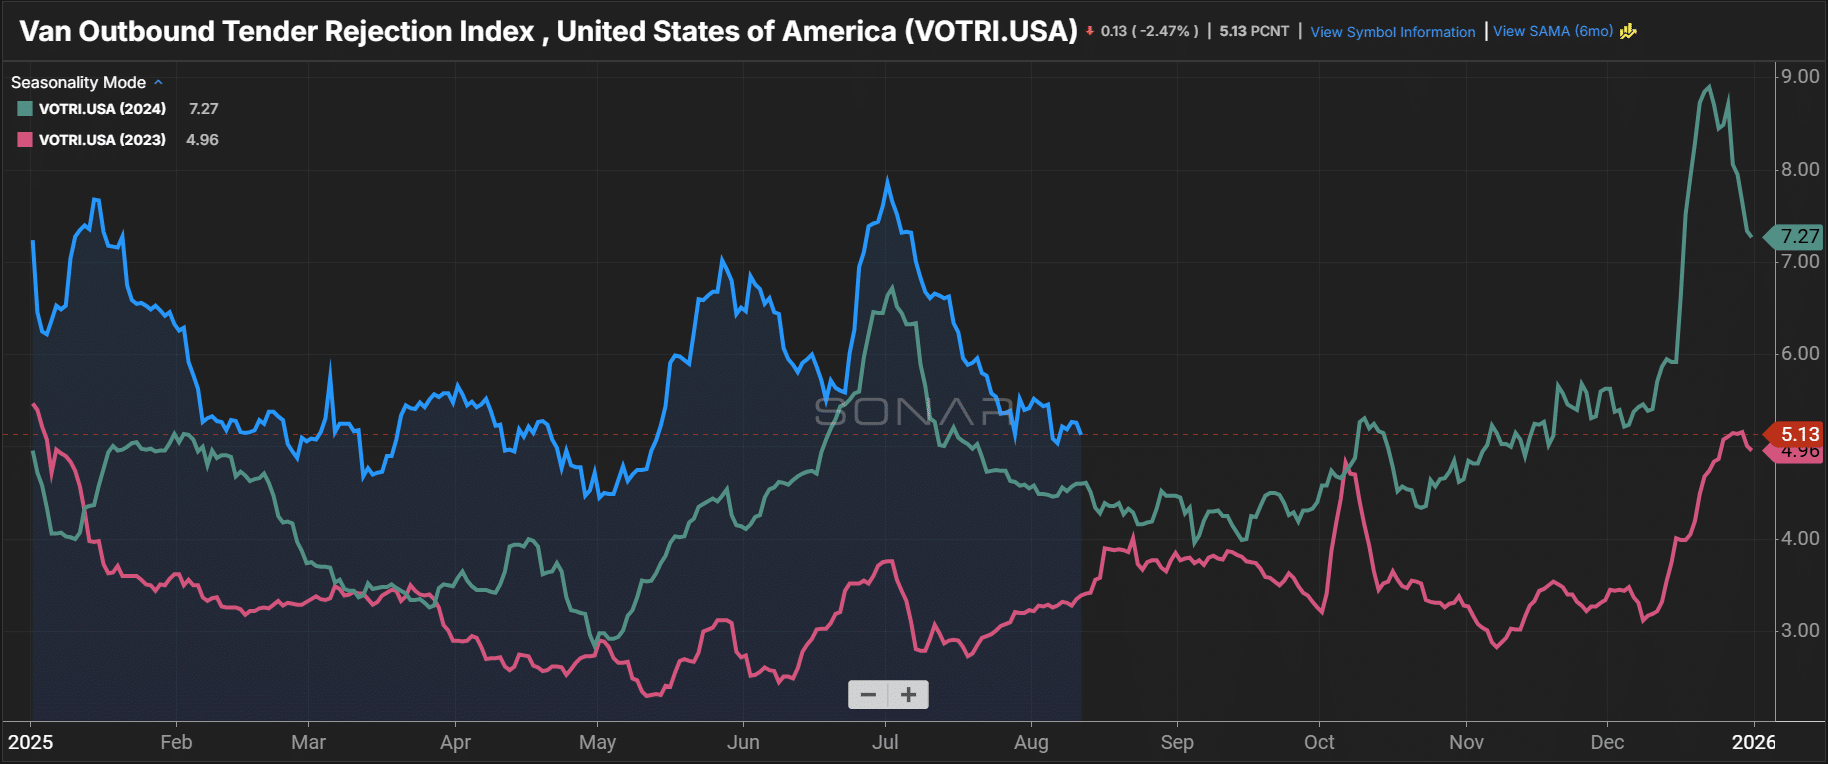
Van Outbound Tender Rejection Index, SONAR
Chart Notes
Dry van rejections elevated in 2025: Rejection rate trends point to relatively stable conditions through the fall. In past years, Labor Day effects on dry van rates have been short-lived, and a brief pocket of tightness is expected again around the holiday weekend.
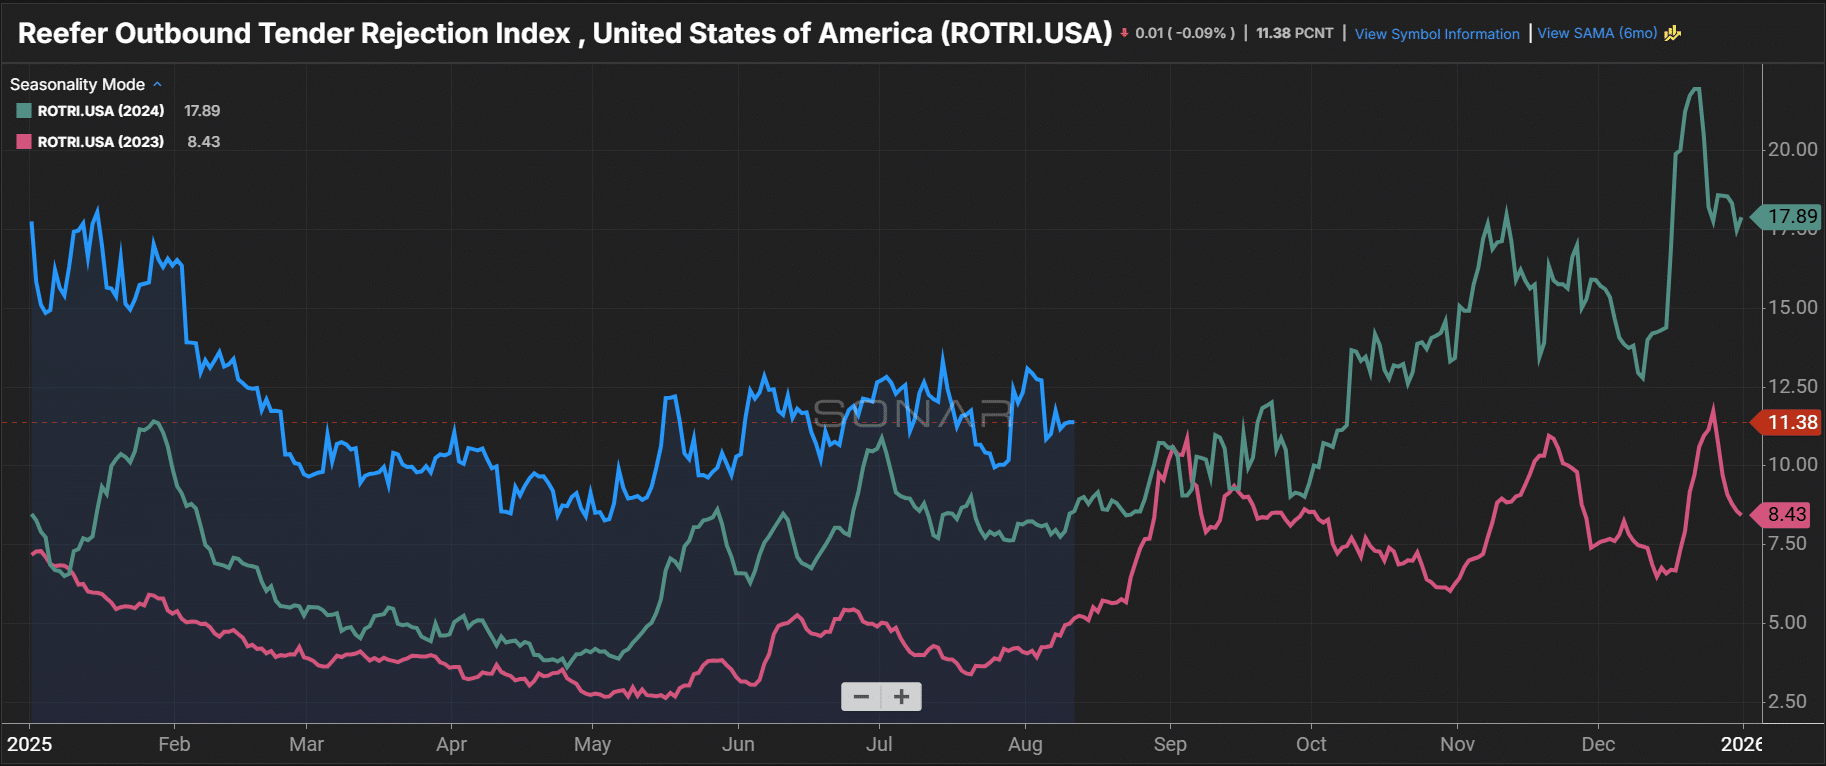
Reefer Outbound Tender Rejection Index, SONAR
Chart Notes
Reefer tender acceptance more at risk around Labor Day: Increased food and beverage demand tied to the holiday is expected to create challenges in the week leading up to Labor Day. Seasonal pressure is typically most acute in the Upper Midwest, where reefer capacity tightens this time of year.
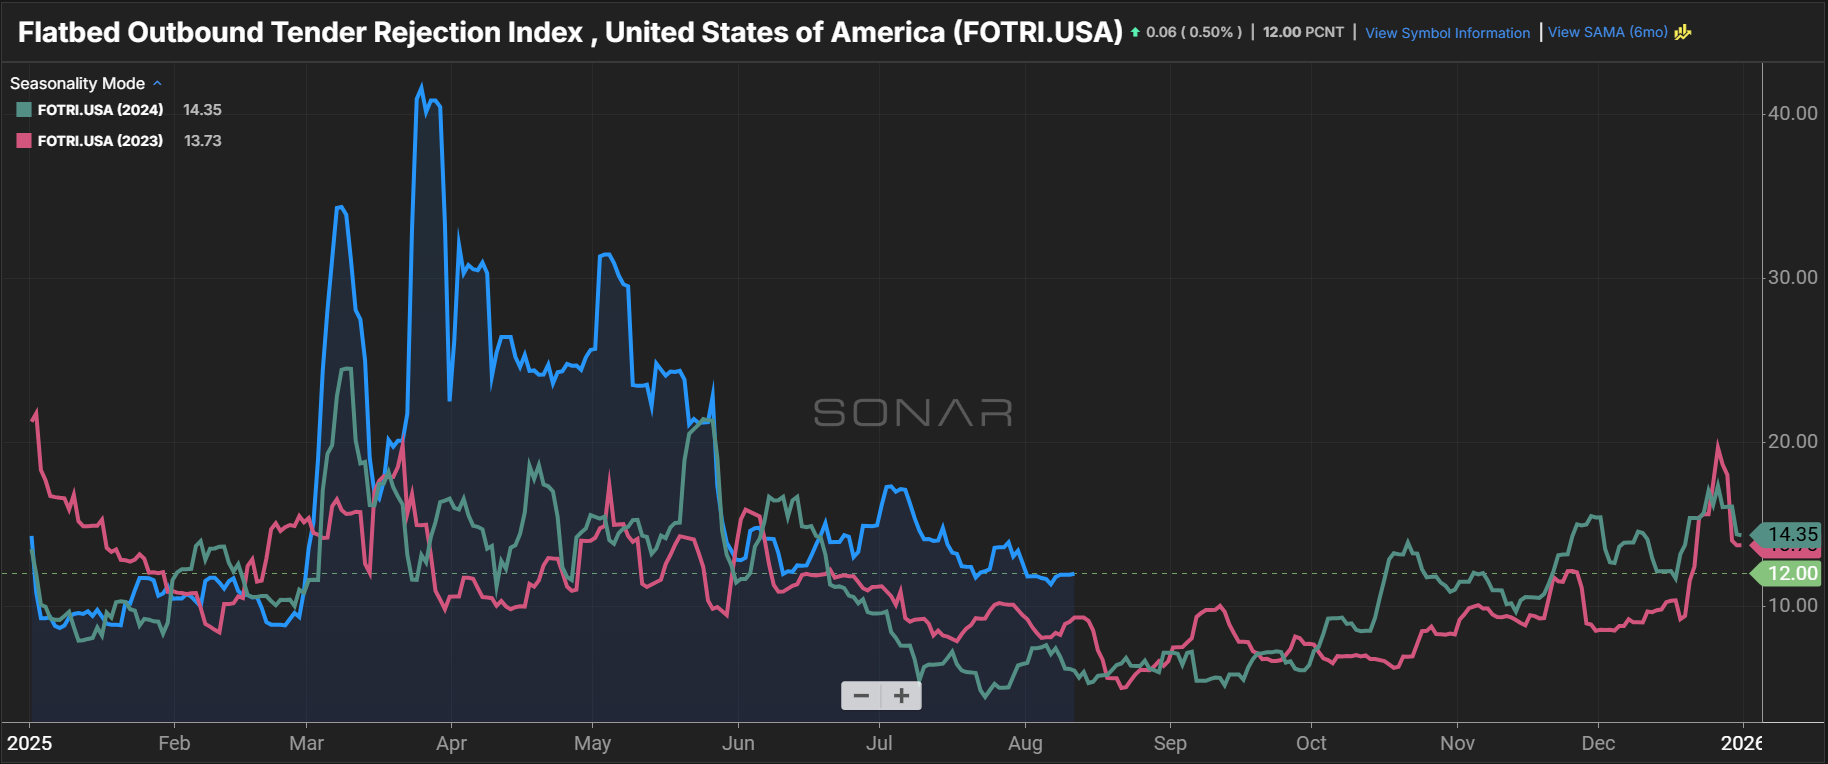
Flatbed Outbound Tender Rejection Index, SONAR
Chart Notes
Flatbed rejection rates trend closer to 2023 and 2024 levels in early August: Early-year volatility has faded, giving way to more stable conditions in recent months. Flatbed capacity has normalized and is now trending closer to prior-year levels.
Van Load-to-Truck Ratios
Reefer Load-to-Truck Ratio
Chart Notes
Dry van and reefer ratios spike in July: DAT reported a 19.9% month-over-month increase in spot load postings and a 30% decrease in spot truck postings, pushing load-to-truck ratios higher for dry van and reefer equipment.
Flatbed Load-to-Truck Ratios
Chart Notes
Flatbed load-to-truck ratios ease but remain elevated: Flatbed conditions softened from May through July after significant tightening early in 2025, but DAT reports capacity remains tighter than in prior years.
Morgan Stanley Dry Van ONLY Truckload Freight Index
Chart Notes
Morgan Stanley Index shows elevated seasonality across equipment types in July: Van, reefer and flatbed indices all trended lower through June but rebounded in early July on stronger spot demand.
Morgan Stanley Reefer Truckload Freight Index
Morgan Stanley Flatbed Truckload Freight Index
Carrier Revocations, New Carriers & Net Change in Carrier Population, FTR
Chart Notes
Carrier population grows for third time in four months: The carrier count rose by nearly 316 in July as entry and exit levels held near recent averages. The total remains about 89,000 higher than immediately before the pandemic, a 35% increase.
Class 8 Tractor Net Orders, ACT Research
Chart Notes
Tractor orders continue to show weakness: Class 8 orders rebounded slightly to 6,000 units in July, still well below the level needed to sustain fleet replacement. Recent manufacturer price hikes tied to 25% to 50% tariffs on steel and aluminum have added several thousand dollars to the cost of each truck.
Monthly Change in Trucking Jobs, FRED Economic Data
Chart Notes
Employment improves: Recent swings highlight both the challenges and opportunities created by the trade war and its downstream effects on trucking. An Arrive survey of carriers found a range of factors shaping today’s environment, including fleet size, equipment age, technology adoption, geographic footprint and industry concentration.
Active Truck Utilization, FTR
Chart Notes
Truck utilization forecast remains steady: FTR’s July outlook was unchanged but still projects some softening later this year, with upside risk if capacity exits accelerate.
U.S. Class 8 Tractors Backlog & Backlog/Build Ratio, ACT Research
Chart Notes
Backlog-to-build ratio falls: Class 8 backlogs dropped by about 7,800 units in July, lowering the backlog-to-build ratio from 4.3 months to 4.0 months.
For-Hire Driver Availability Index, ACT Research
Chart Notes
Driver availability tightens: June marked the first tightening in driver availability after 37 months of softening in ACT Research’s Driver Availability Index, which tightened 3.0 points from May. The tightening is mostly due to drivers leaving the market and driving schools closing amid tough market conditions.
For-Hire Trucking Survey: Supply-Demand Balance, ACT Research
Chart Notes
Demand weakness expected to drive softer market balance: ACT reports that weakening economic activity and declining imports will continue to weigh on freight volumes. In turn, capacity is expected to contract, keeping the market at or near equilibrium.
Truckload Rates
Looking Back
Spot rates spiked briefly around the Fourth of July but quickly fell back, with all three major equipment types trending down as August began. The spot-to-contract rate gap remained wide, and rail’s absorption of much of the July import surge further limited upward pressure on truckload rates.
Looking Ahead
Rates should follow typical seasonal patterns through late summer. A modest Labor Day bump is expected, particularly in reefer markets, but any disruption will likely be short-lived. Outside of that, rates across all equipment types are expected to remain flat to down as soft demand and gradual capacity attrition persist.
View Related Data
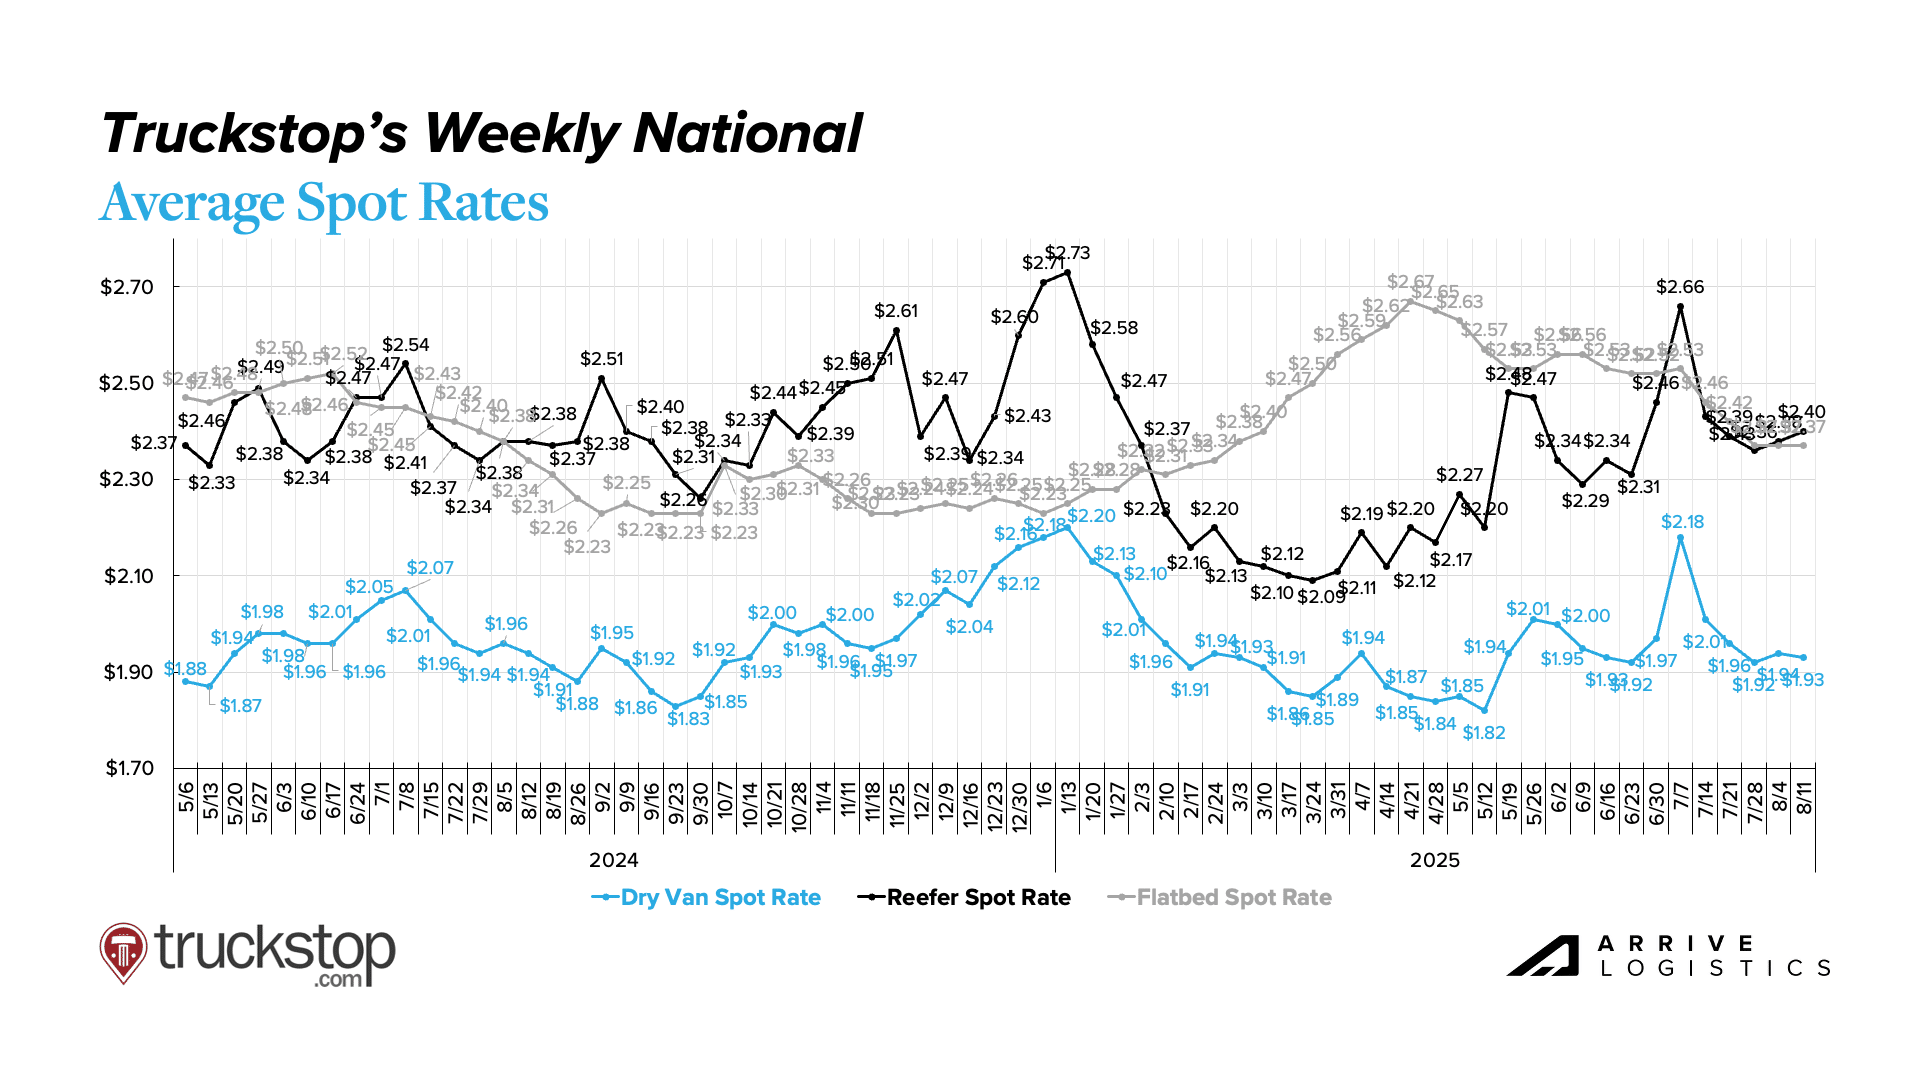
Truckstop Weekly National Average Spot Rates
Chart Notes
Rates return to floor: Van and reefer rates fell back to roughly flat year-over-year after a brief surge in early July. Slight upticks are expected in both equipment types at the end of the month ahead of Labor Day.
DAT Monthly Rate Trends
Chart Notes
Van and reefer rates ease after July 4 increase: All-in dry van rates rose $0.04 per mile and reefer rates climbed $0.05 in July. Rates have since begun trending lower in the first half of August with seasonal softening in the market.
Flatbed rates decline: Flatbed pricing is softening as the season winds down. After holding steady for three straight months at $2.57 all-in per mile, rates fell $0.02 in July and have continued easing in early August.
DAT Fuel Trends
Chart Notes
Diesel prices trend up: Prices climbed from May lows on stronger seasonal demand in June, July and August. The U.S. Energy Information Administration’s latest forecast calls for modest increases but overall stability.
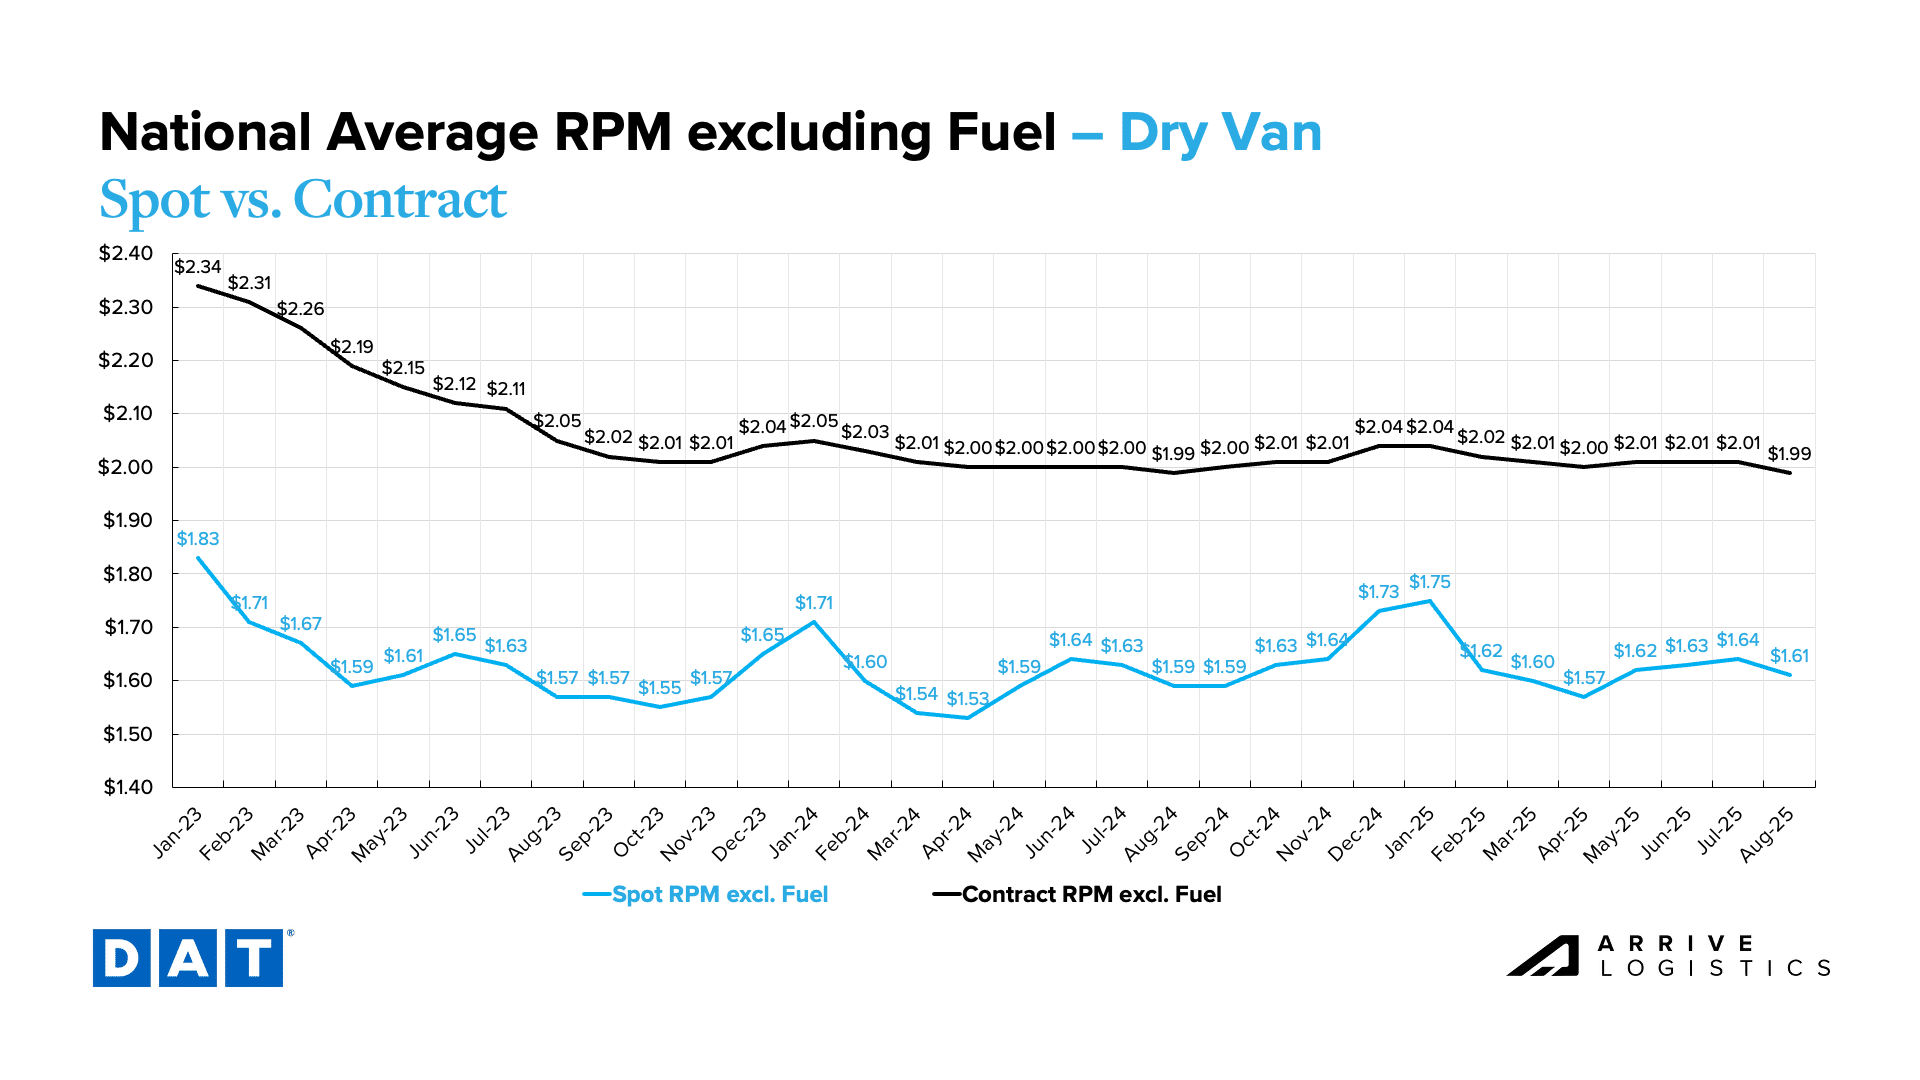
DAT Dry Van National Average RPM Spot vs. Contract
Chart Notes
Rates fade in early August: Rates have returned to a floor after seasonal pressures in July. Spot linehaul rates fell from $1.64 per mile in July to $1.61 month-to-date in August 2025. Year-over-year, rates were up 0.6% from $1.63 in July 2024 and are currently up 1.3% from August 2024 levels.
Spot-contract gap holding steady: The dry van spot-contract gap has hovered between $0.37 and $0.43 per mile over the past six months and sits at $0.38 in mid-August. A smaller gap suggests greater market sensitivity to disruption, though the current reading still signals limited risk of sustained volatility.
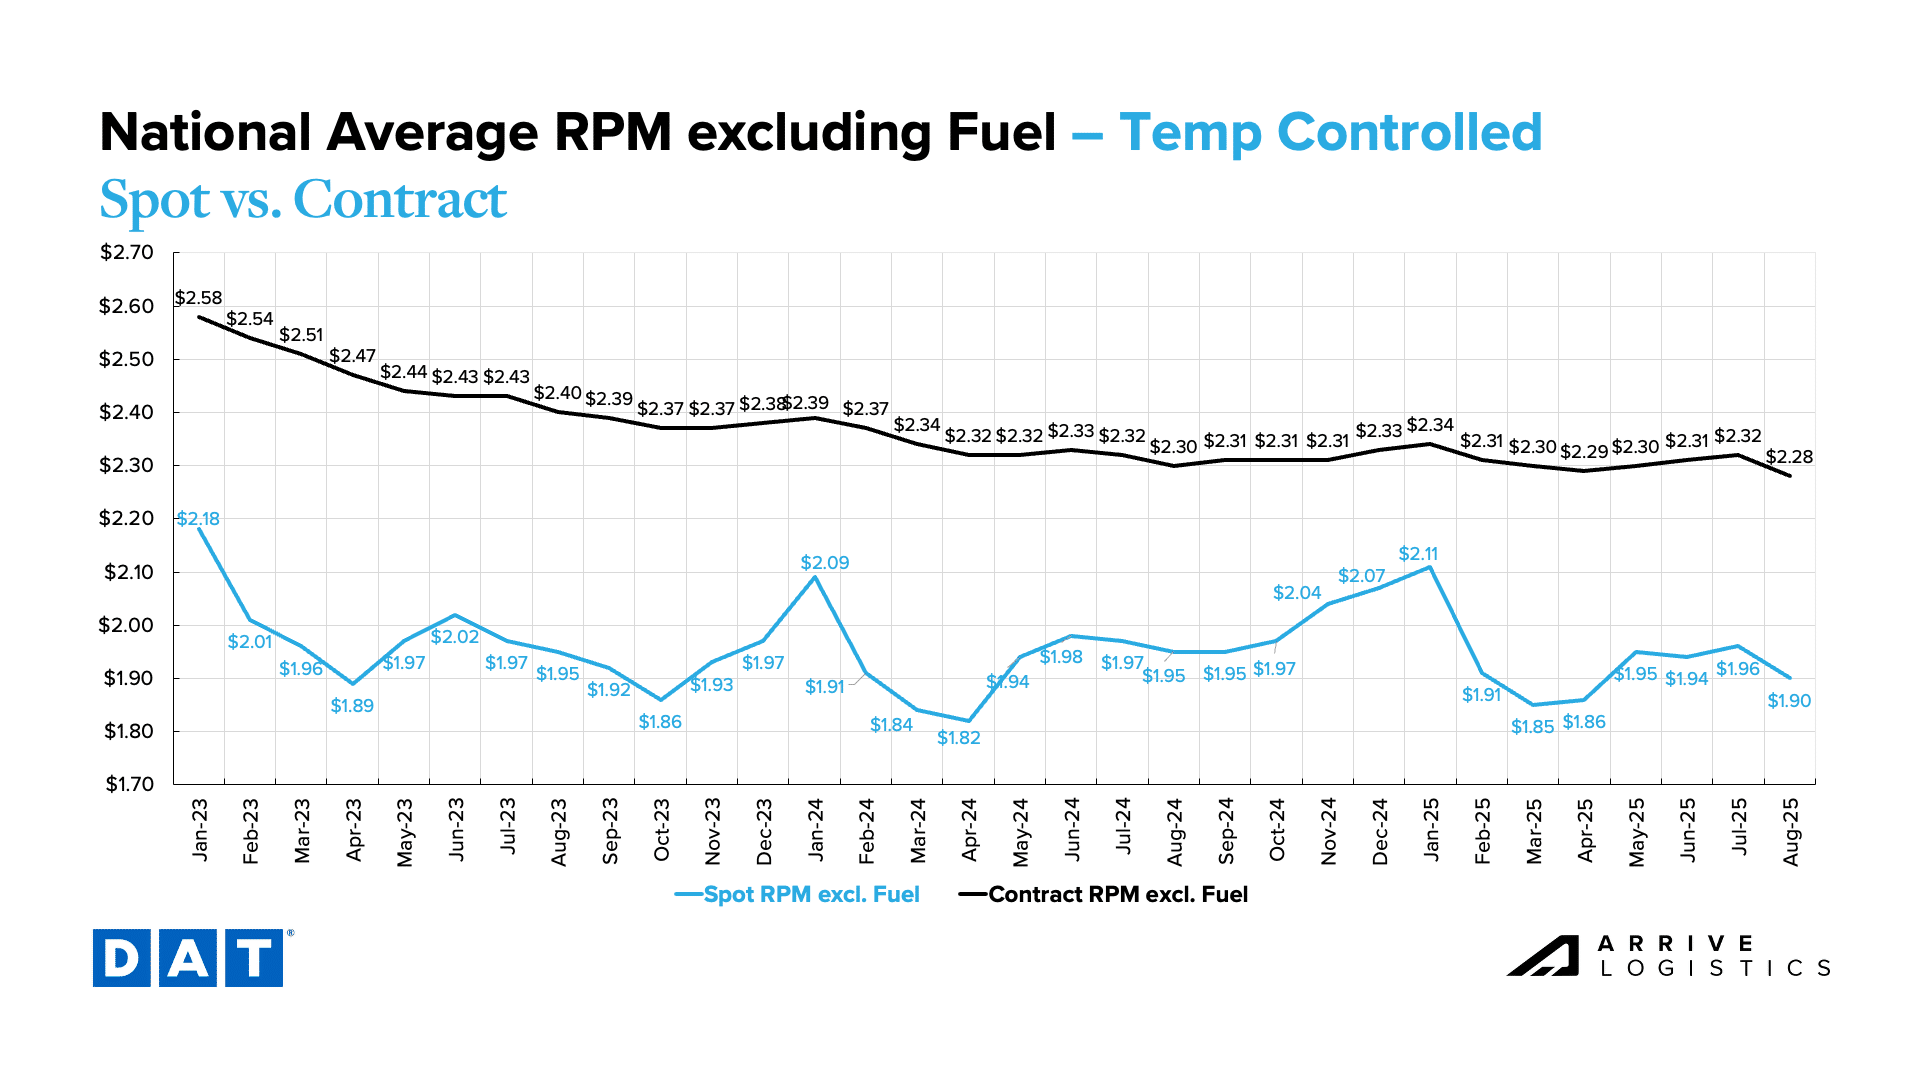
DAT Temp Controlled National Average RPM Spot vs. Contract
Chart Notes
Reefer linehaul rates fade in August: Spot linehaul rates rose from $1.94 per mile in June to $1.96 in July 2025. Year-over-year, rates were down 0.5% from $1.97 in July 2024 and are currently down 1.5% from August 2024 levels.
Reefer spot-contract gap holds steady: The reefer spot-contract gap has held between $0.35 and $0.37 per mile over the past four months and sits at $0.37 in August. While a smaller gap typically signals greater market sensitivity to disruption, current levels still suggest limited risk of sustained volatility.
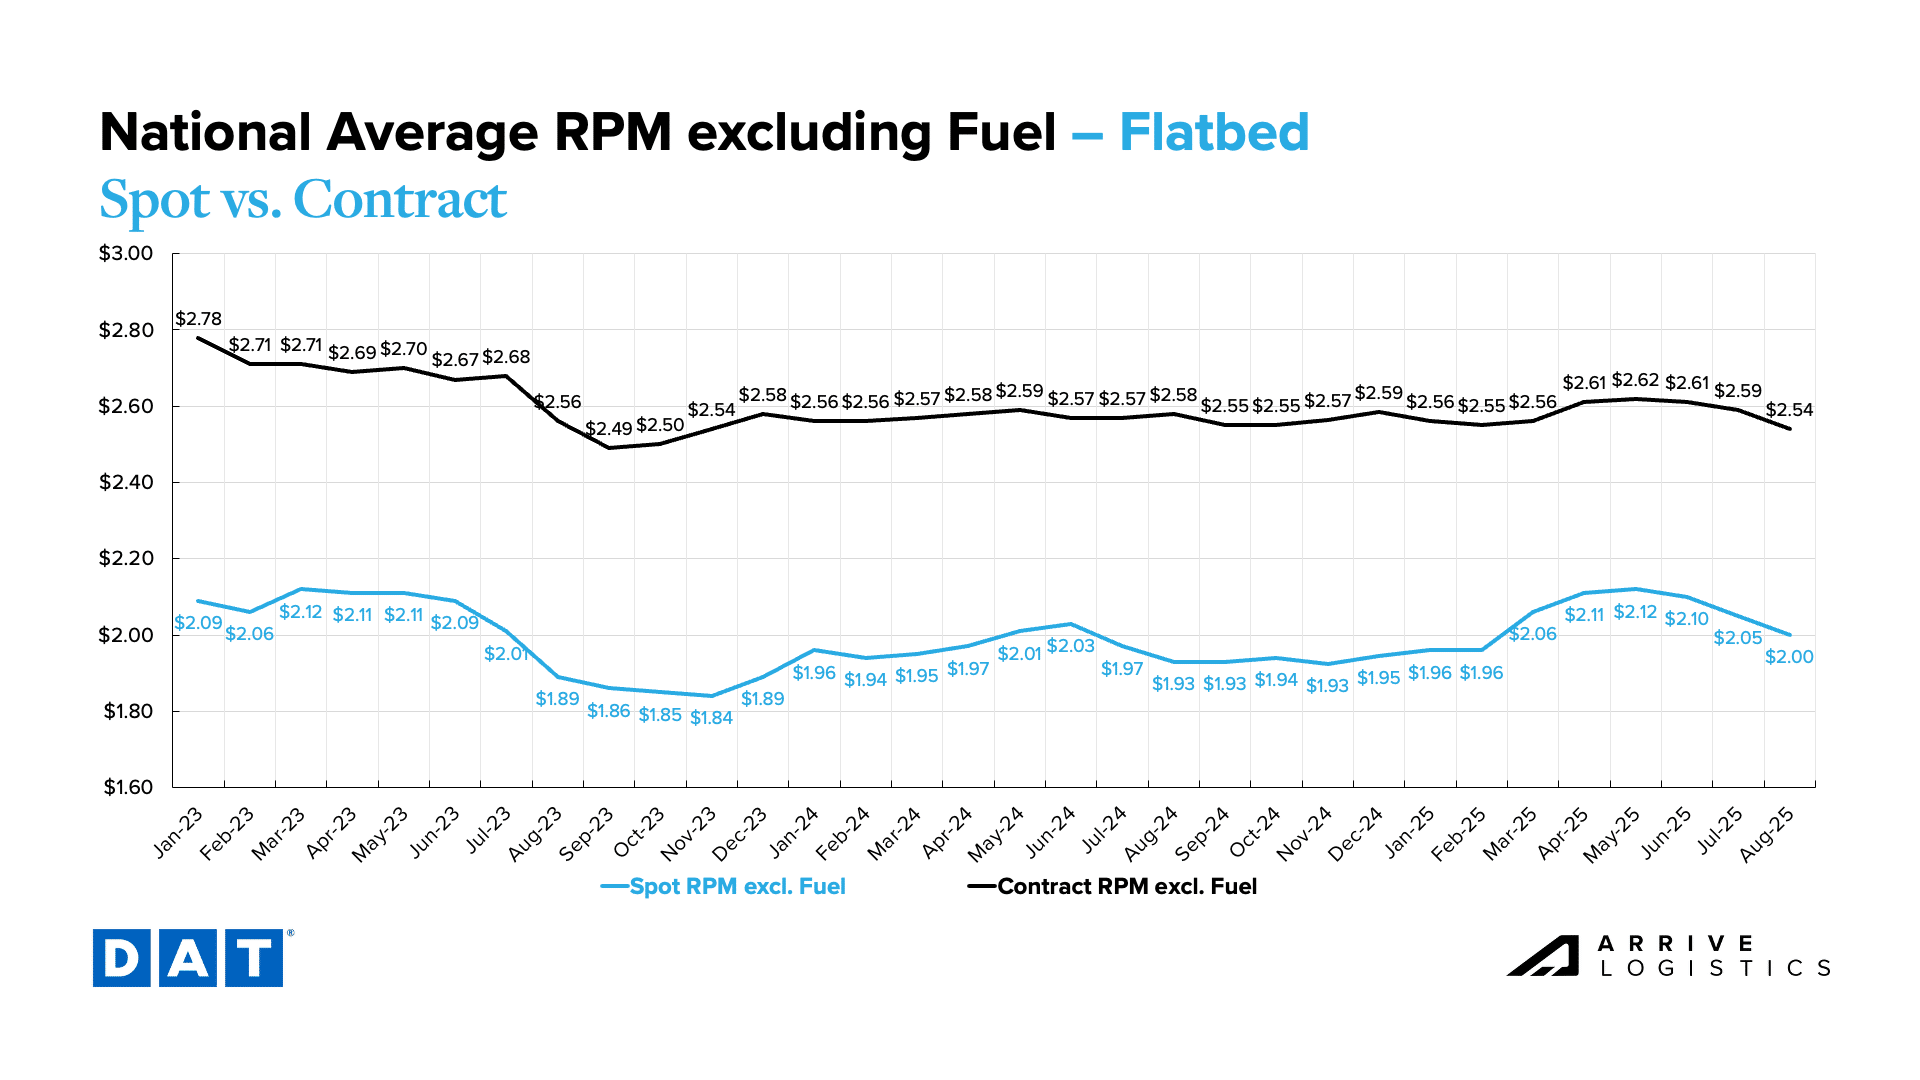
DAT Flatbed National Average RPM Spot vs. Contract
Chart Notes
Flatbed linehaul rates show stable year-over-year growth: After strong early-season gains, flatbed spot linehaul rates have leveled off in the summer months. Rates rose 3.4% in June, 4.1% in July and are up 3.6% in August.
Economic Conditions
Looking Back
Inflation held steady in July, signaling minimal impact from tariffs on prices so far. The flat reading has analysts split on its implications for potential interest rate cuts at the Fed’s September meeting. While some investors are pricing in a cut, others expect the Fed to wait for critical jobs data before making a move. Bank of America reported consumer spending rose 1.8% year-over-year — the highest growth rate since January — with gains across both goods and services.
Looking Ahead
Consumer health should support freight demand in the near term, though higher tariffs may not impact prices until early next year as retailers adjust to new inventory. A meaningful shift in interest rates could also strengthen the housing outlook for 2026.
View Related Data
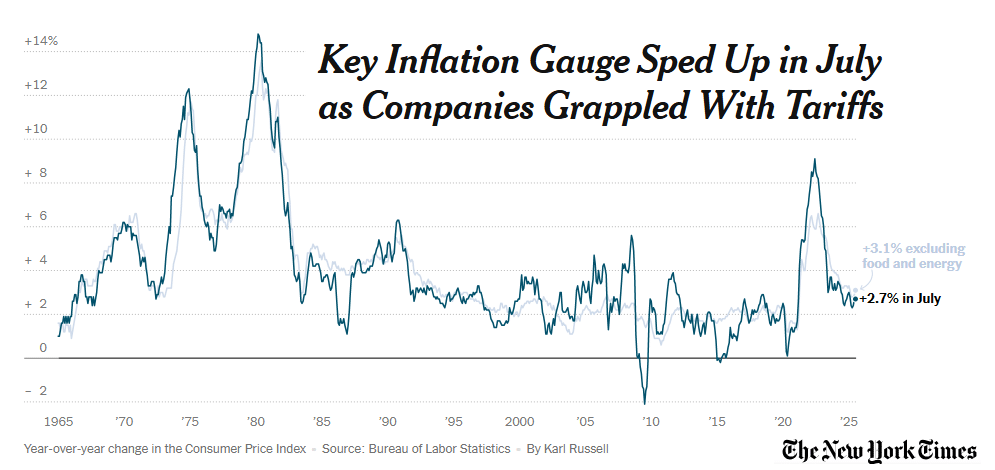
Consumer Price Index, New York Times
Chart Notes
Inflation accelerates in June: Overall inflation was unchanged, but core inflation — which excludes food and energy — rose 3.1% year-over-year. The July reading was relatively stable, up 0.2% month-over-month, though some analysts say it could increase the likelihood of a September rate cut given a weakening labor market.
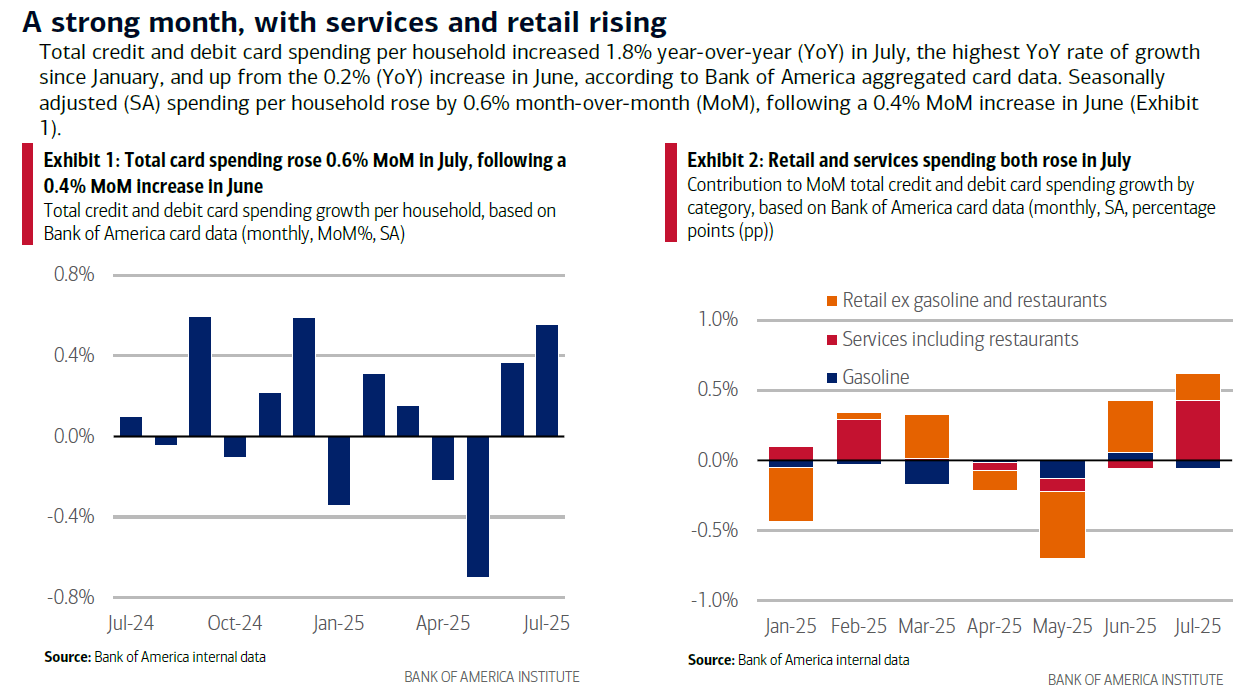
Bank of America Total Card Spending, Bank of America Consumer Checkpoints
Chart Notes
Increase in consumer spending in July: Bank of America reported household spending rose 1.8% year-over-year in July, up from 0.2% growth in June. With inflation steady at 2.7%, the gain marked a true increase in spending from June to July, with broad-based growth across goods and services.
Employment Situation – July 2025, U.S. Bureau of Labor Statistics
Chart Notes
Unemployment little changed, payrolls increase: The unemployment rate has held between 4.0% and 4.2% since June 2024 and was little changed from June to July 2025. A stable labor market typically supports consumer spending, a key driver of freight demand.
Navigate the freight market with confidence.
Get this free report delivered straight to your inbox every month.
Matt Pyatt is the Chief Executive Officer of Arrive Logistics. He co-founded Arrive with President Eric Dunigan in 2014 after building his career at Command Transportation. As CEO, he is responsible for overseeing the company’s financial health, strategic vision and culture, as well as building a scalable leadership team to support Arrive’s growth.
Subscribe to receive freight market updates
"*" indicates required fields
Subscribe to receive freight market updates
Quick Apply
"*" indicates required fields
Arrive Carrier Requirements
Please have the following info ready to complete registration
MC, MX, DOT, or state reg #
Tax ID & W9 info
Cert of Insurance: $100k cargo, $1M Auto, & $1M commercial general liability coverage
Freight fraud continues to impact our industry. We encourage shippers and carriers to reach out to Arrive immediately if there is ever a shipment in question that may be subject to fraud (including fictitious actors and websites). Arrive will not ask you to pay upfront for any dedicated lane or committed capacity program. If the offer you are receiving sounds too good to be true or unrealistic, it may be fraud.Arrive Logistics recommends verifying all communications come from our registered email domain is @arrivelogistics.com and notes that access via VPN or Proxy is prohibited on Arrive systems. Our 24/7 phone number is 888-861-0650 and our leadership team can also be reached at feedback@arrivelogistics.com.
Use of Cookies
We use cookies to enhance your browsing experience, serve personalized ads or content, and analyze site traffic. By continuing to use this website, you acknowledge and consent to our use of cookies as detailed in our privacy policy.
Get Access to the Shipper Portal
Current Customers
Already shipping with Arrive?
Connect with your representative to get access to your ARRIVEnow Shipper Portal. Can’t connect with your rep? Use this form to reach out.
New Customers
Not shipping with Arrive yet?
If you’re not an Arrive customer, please join our network to access the portal.
Scott Sandager is the Chief Administrative Officer at Arrive Logistics. He joined Arrive in 2018, bringing over 14 years of logistics and brokerage experience, with expertise in project and change management, organizational design, talent development and customer satisfaction. Scott previously held many diverse roles of increasing responsibility with AFN, a Chicago-based freight brokerage.
Eric Dunigan, President & Co-Founder
Eric Dunigan is the President of Arrive Logistics. He began his career at Command Transportation before co-founding Arrive with Matt Pyatt in 2014. As president, he is responsible for driving revenue and growth, as well as leading the Strategic Partnerships team — a veteran group of supply chain experts who work with Arrive’s customers to reimagine their shipping strategy.
Start shipping with Arrive
"*" indicates required fields
David Spencer, VP of Market Intelligence
David Spencer is the Vice President of Market Intelligence at Arrive Logistics. David joined Arrive in 2017 after spending six years at AFN focused on business intelligence. His department provides critical market data and expert analysis to internal teams and publishes monthly market updates for shippers and carriers under the Arrive Insights banner.
Andrew Clarke, Board Chair, Arrive Logistics and Global Critical Logistics
Andrew Clarke is Board Chairman for Global Critical and DCLI, Inc., and a board member for Arrive Logistics and Element Fleet Management Corp. His 20 years of global transportation and logistics experience include time as CFO of C.H. Robinson, CEO of Panther Expedited Services, Inc. and SVP and CFO roles at Forward Air Corporation.
Dean Croke, Principal Analyst at DAT Freight and Analytics
Dean Croke is a Market Analyst at DAT Solutions, where he focuses on freight market intelligence and data analytics. His 35 years of experience with data analytics, transportation, supply chain management, mining and insurance risk management include time as co-founder of FleetRisk Advisors and in a number of other high-level roles with FreightWaves, Spireon, Lancer Insurance, Omnitracs Analytics (formerly Qualcomm) and more.
Asanka Jayasuriya, CTO and Partner at 8VC
Asanka Jayasuriya is the CTO at 8VC. He is an accomplished engineering and product leader with 20+ years of experience in the cloud. He has a strong background in enterprise SaaS, PLG products, infrastructure, and security. Notably, he served as CTO and SVP of Engineering at SailPoint, leading their successful transition to the cloud and successful exit event. He also held senior leadership roles at InVision, Atlassian, and Amazon, driving growth, operational excellence, and innovation. At 8VC, Asanka works with the entrepreneurs and leaders in our portfolio as a virtual CTO supporting their growth.
Chad Eichelberger, President at Reliance Partners
Chad Eichelberger is the President of Reliance Partners. Since 2015, he’s leveraged his extensive experience in risk management, compliance, best practices and contracts to lead the company’s logistics and truck insurance strategy and operations. Chad was previously the President of Access America Transport, where he led the company from $8M to over $600M in revenue.
Barry Conlon, CEO & Founder at Overhaul
Barry Conlon is the CEO and founder of Overhaul, the global leader in active supply chain risk management and intelligence. With a remarkable career spanning over 30 years in supply chain security, he is widely regarded as a trailblazer in modern-day supply chain security standards and best practices.
Tim Denoyer, VP and Senior Analyst at ACT Research
As VP and Senior Analyst at ACT Research, Tim analyzes commercial vehicle demand and alternative powertrain development (i.e. electrification), and authors the ACT Freight Forecast, U.S. Rate and Volume Outlook. He previously spent fifteen years in equity research focused primarily on the transportation, machinery, and automotive industries, and co-founded leading equity research firm Wolfe Research.