Q4 kicked off with a supply shake-up following the announcement of new non-domiciled CDL regulation. While the potential for sudden tightness and sharp rate increases had the market on edge initially, recent tender rejection and rate trends suggest the worst of the disruption has already passed and that lingering impacts will not persist.
That said, as we move into the back half of October, tender rejection trends are showing tightness outside of typical seasonal patterns. The Diwali holiday and recent driver exits are the likely culprits, but if the trend persists into November, it will be worth watching for signs of a broader disruption.
For now, capacity tightness remains a regional story rather than a national trend. However, if it spreads to additional regions, that would signal the recent capacity crunch may be more than just a short-term blip.
Assuming recent volatility fades in the coming weeks, Q4 market conditions will likely be defined by stable demand and balanced to slightly contracting supply. Typical seasonal patterns should bring temperature-controlled tightness ahead of Thanksgiving and Christmas as food and beverage shipments pick up, and dry van tightness in the later weeks of both November and December as peak retail season coincides with drivers taking time off around the holidays.
On the demand side, consumers are still spending amid labor market challenges, but inflation and higher borrowing costs will continue to weigh on durable goods volumes. Additional tariff threats are also creating further uncertainty, as limited visibility into the timing or scope of potential changes makes it challenging to anticipate how these factors will impact future freight volumes. These variables, plus the fact that most retail imports were already pulled forward earlier in the year, suggest a muted holiday peak season could be on the horizon.
On the supply side, persistently weak equipment orders — along with any long-term impacts from recent or future regulatory shifts — will make capacity increasingly vulnerable to disruption once demand picks back up.
David Spencer
VP of Market Intelligence
Key Takeaways
Demand indicators illustrated inconsistent trends, with contract volumes down and spot volumes up year-over-year.
New FMCSA regulations on non-domiciled CDL drivers, combined with increased enforcement, led to a sudden surge in capacity exits and early Q4 rate volatility.
Low equipment orders persisted through September, reducing the tractor population and keeping overall capacity at risk.
Import volumes remain challenged after fading from a summer rally. New tariff threats with China have increased pressure on importers, putting Q4 retail demand at risk.
Spot rates rose unexpectedly in October — an atypical trend, especially with demand indicators pointing to weaker levels.
A resilient economy and steady spending are helping stabilize freight demand, but tariff-driven price hikes have yet to fully reach shoppers and thus remain the most significant risk to consumer-driven demand in the back half of this year and early next.
The government shutdown has delayed inflation and labor market data releases, but indications point to no meaningful change from prior reports as consumer spending held up well in September.
Truckload Demand
Looking Back
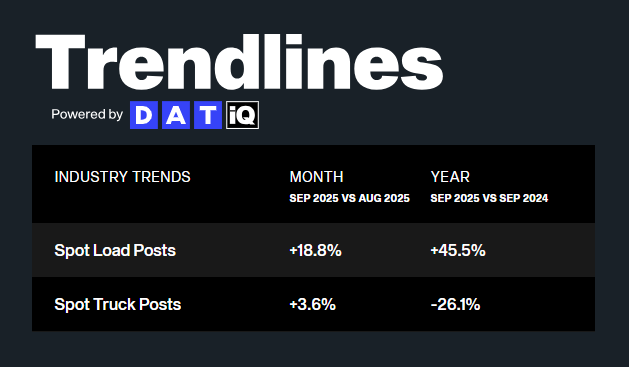
Demand indicators showed some unusual trends in September. FreightWaves reported accepted contract volumes were down roughly 18% year-over-year, while DAT showed spot load posts up 45% over the same period. Cass reflected a 5.4% year-over-year decline in total shipments, but its truckload component remained slightly positive. These trends would typically point to a market undergoing more disruption, but rate volatility was kept to a minimum throughout the month.
Looking Ahead
Through the rest of this year, demand is likely to remain soft with muted seasonal spikes around the holidays. Meanwhile, labor market challenges, inflation, interest rates and tariff policy all remain risks to near-term volumes and meaningful barriers to a broader demand recovery. However, if recent tender rejection trends persist, spot volumes could take off, particularly as we get closer to the holidays.
View Related Data
Contract Load Accepted Volume, SONAR
Chart Notes
Accepted contract volumes dip again in September and early October: FreightWaves SONAR data shows accepted contract load volumes are down nearly 18% year-over-year in the back half of September and the start of October.
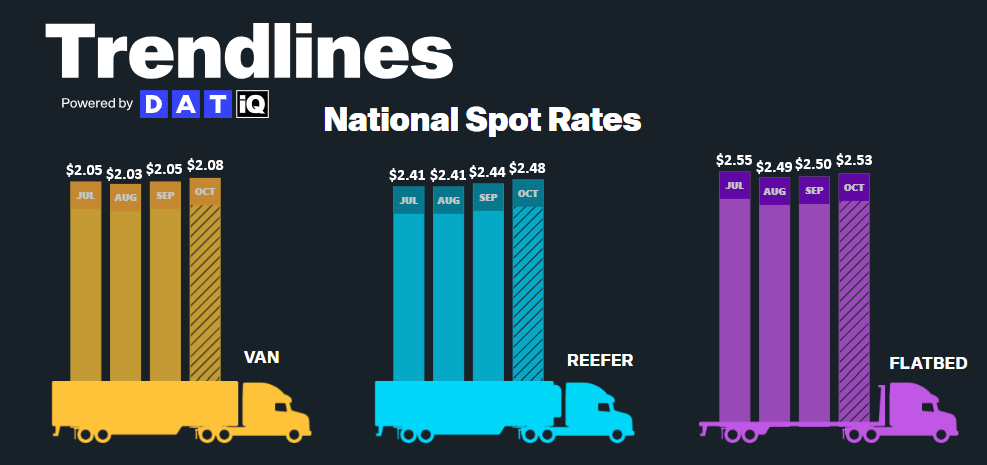
DAT Trendlines
Chart Notes
Spot demand continues to increase, keeping load-to-truck ratios high in September: DAT data shows total spot volumes climbed to 45.5% year-over-year. Load-to-truck ratios remained elevated across all equipment types month-over-month, with flatbed leading the charge at a 27% increase in postings, followed by a 12% increase in van postings and a 6% increase in reefer postings.
Cass Freight Index Report – September 2025
Chart Notes
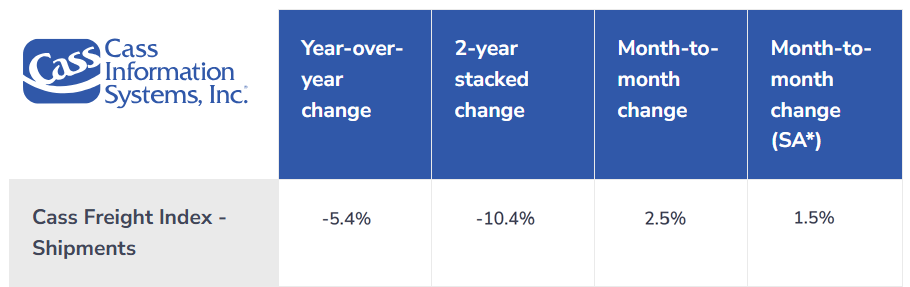
Cass Freight Index negative, but TL component positive: Cass reported volumes were down 5.4% year-over-year despite a 1.5% seasonally adjusted increase month-over-month in September. Despite the decline, Cass also noted that truckload volumes were actually up from 2024 for the second straight month.
Cass Freight Index Shipments Forecast – September 2025
Chart Notes
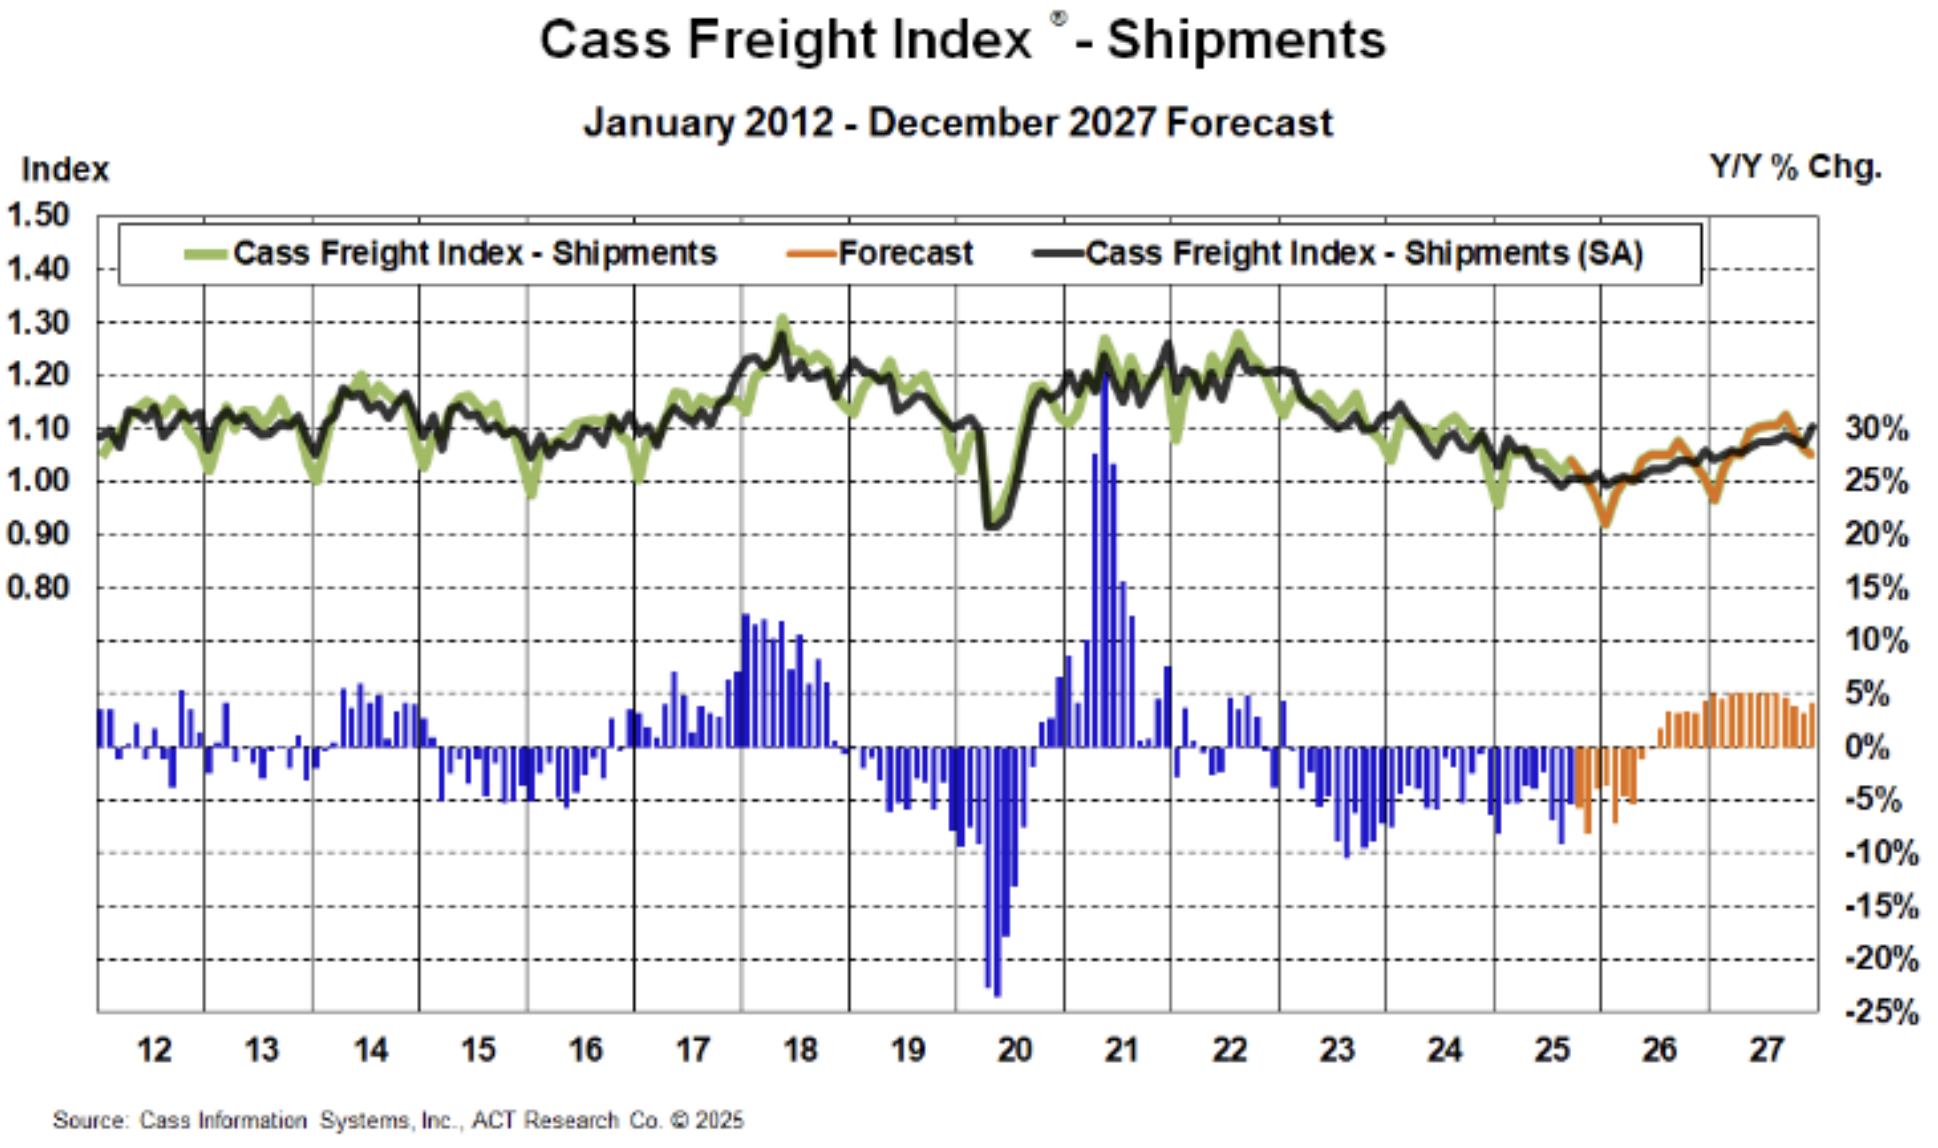
Goods inflation to weigh on freight demand: Cass and ACT believe pre-tariff shipping boosts will lead to pullbacks in shipment volumes in the coming months, and growing inflation could dampen consumer spending, further limiting volumes.
Descartes U.S. Container Import Volume
Chart Notes
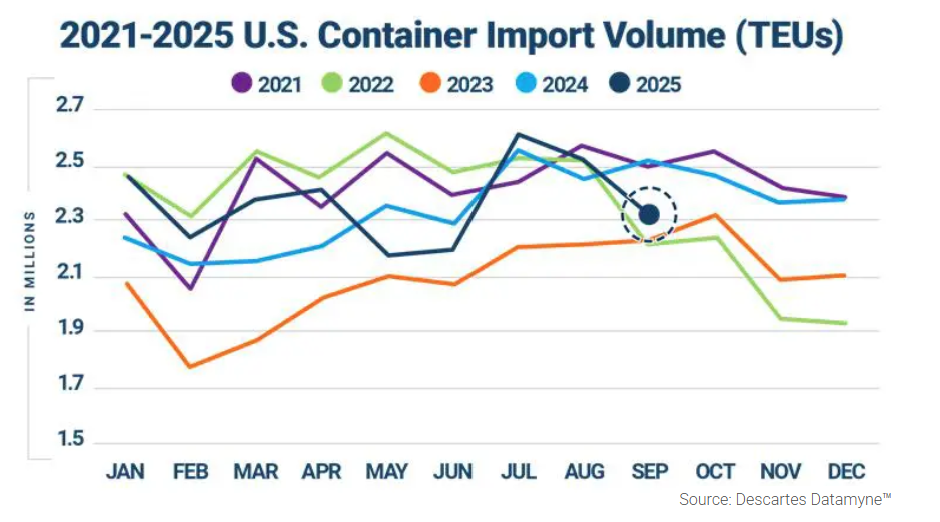
Import orders pull back in September after a short-lived recovery period: Descartes data shows imports fell 8.4% month-over-month after back-to-back months of elevated levels in July and August. This pullback could be indicative of sensitivity to the uncertain tariff environment.
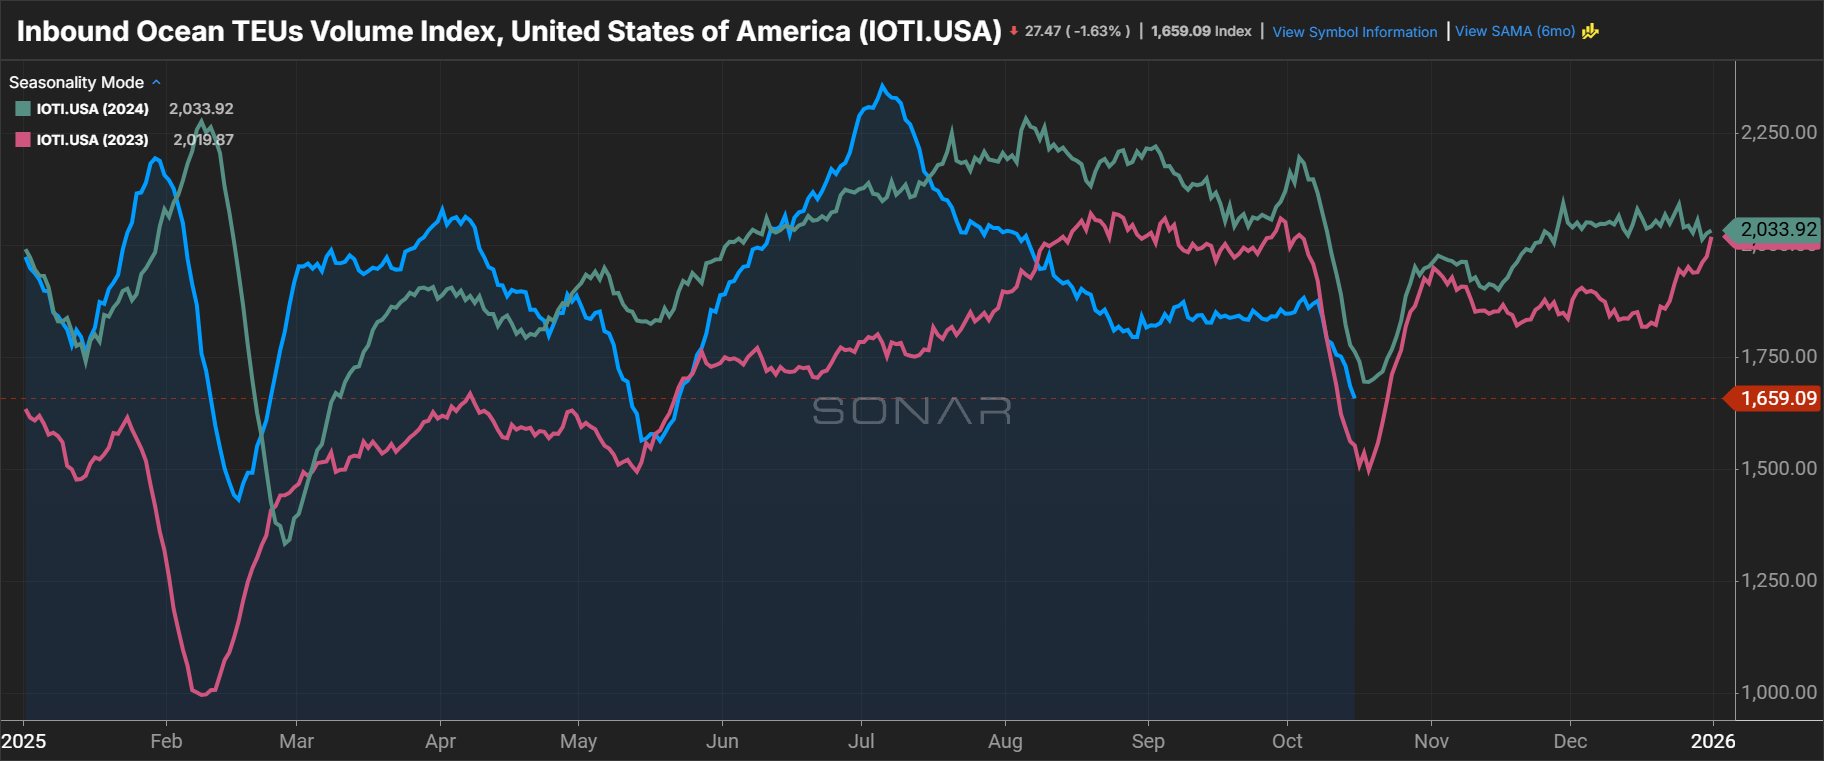
Inbound Ocean TEUs Volume Index, SONAR
Chart Notes
Declining TEU bookings signal muted import-related demand in Q4: SONAR data shows import order volumes have been trending down 10%–15% year-over-year over the past month. The June and July pull-forward led to a rapid August decline and stability below historical levels in September.
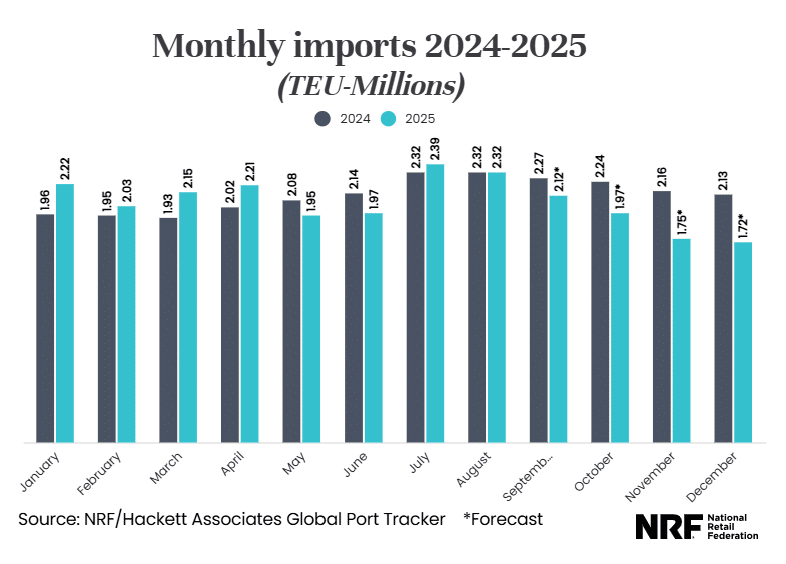
Monthly Imports, National Retail Federation
Chart Notes
Retail import forecast signals muted Q4: The National Retail Federation forecasts volume will continue to fall month-over-month through the end of 2025, trailing 2024 levels significantly. The early pull-forward of inventory has allowed retailers to be prepared in advance of the upcoming holiday season.
Total Outbound Rail Container Volume, SONAR
Chart Notes
September rail and truckload volumes decline in line with import trends: While both outbound rail and over-the-road capacity were utilized to absorb elevated imports from the summer push, volumes are now declining, signaling slowing demand in the region as the import boom fades.
Manufacturing at a Glance, Manufacturing ISM
Chart Notes
Manufacturing contraction continues: The ISM Manufacturing Index fell for the seventh straight month. After a small uptick in new orders in August, they declined 2.5 points in September.
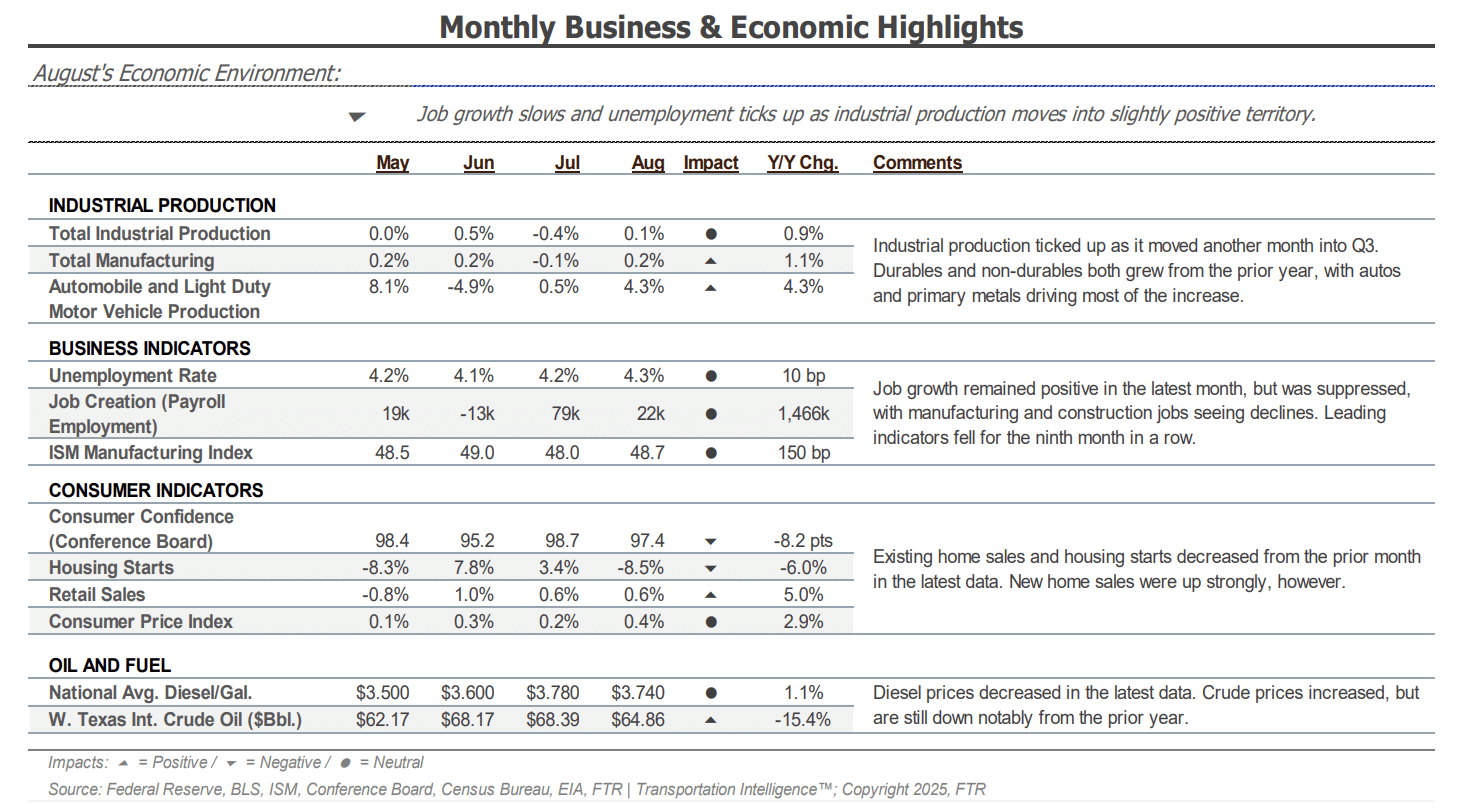
Monthly Business & Economic Highlights, FTR
Chart Notes
Freight indicators mixed in August: FTR reported that freight indicators were mostly holding steady and, in some cases, growing significantly; however, labor market concerns countered the other positive indicators.
Truckload Supply
Looking Back
Supply contracted again in September as fleet sizes continued to shrink and equipment orders remained below replacement levels despite a notable month-over-month increase. Tender rejections also rose on a regional basis amid the CDL regulation-related disruption late in the month.
2025 has seen private fleets give back market share to for-hire carriers, presumably as investment in fleet growth slows. This is working to prop up for-hire demand and keep a portion of drivers in their seats amid persistently soft freight volumes and elevated operating costs. Together, these trends point to a supply side that is slowly tightening but still able to service current demand.
Looking Ahead
Capacity is expected to remain stable or contract slightly through the end of the year — but if low equipment orders persist amid a shrinking fleet base and aging equipment pool, available capacity will become increasingly vulnerable to future demand shocks.
View Related Data
Outbound Tender Reject Index, SONAR
Chart Notes
Rejections spike outside traditional seasonal pattern: While the pattern is still limited to certain regions, a rejection rate increase in mid-October is unusual. The belief is that this is likely due to a combination of the upcoming Diwali holiday and lingering effects of the recent non-domiciled CDL regulations.
Van Outbound Tender Rejection Index, SONAR
Chart Notes
Dry van seeing the largest increase as of late: Outbound volumes from the Midwest, Southwest and certain Mountain regions are driving up the national average late in October. While this trend is expected to normalize in early November, if it persists, van spot rates could see significant volatility around the holidays.
Reefer Outbound Tender Rejection Index, SONAR
Chart Notes
Reefer tender rejections elevated early in Q4: Increased food and beverage demand tied to the holidays will add to what is already a challenging capacity environment for temp-controlled equipment in the coming months.
Flatbed Outbound Tender Rejection Index, SONAR
Chart Notes
Flatbed rejection rates stable in September and October: Early-year volatility has faded, giving way to more stable conditions in recent months. Flatbed capacity has normalized and is now trending at or below prior-year levels.
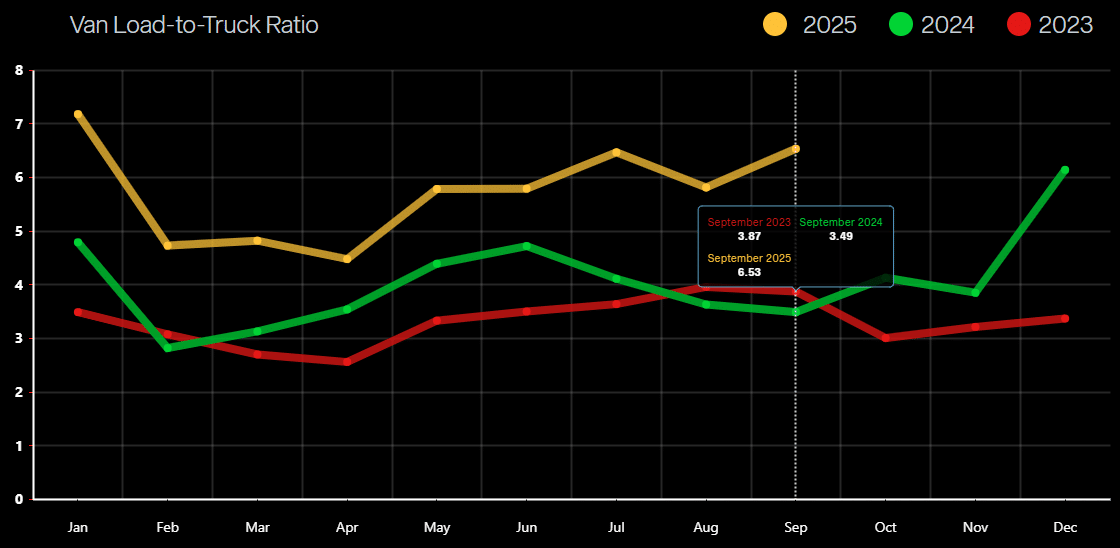
Van Load-to-Truck Ratios
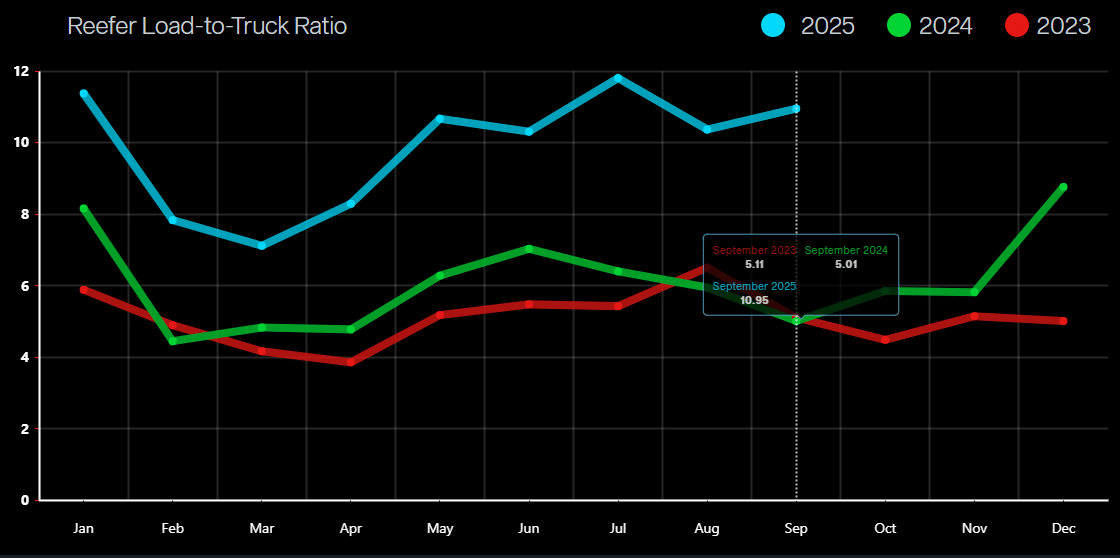
Reefer Load-to-Truck Ratio
Chart Notes
Dry van and reefer ratios both tick upward in September: DAT reported month-over-month increases in load-to-truck ratios for both equipment types. The dry van load-to-truck ratio rose 12% month-over-month, and the reefer load-to-truck ratio increased 6%.
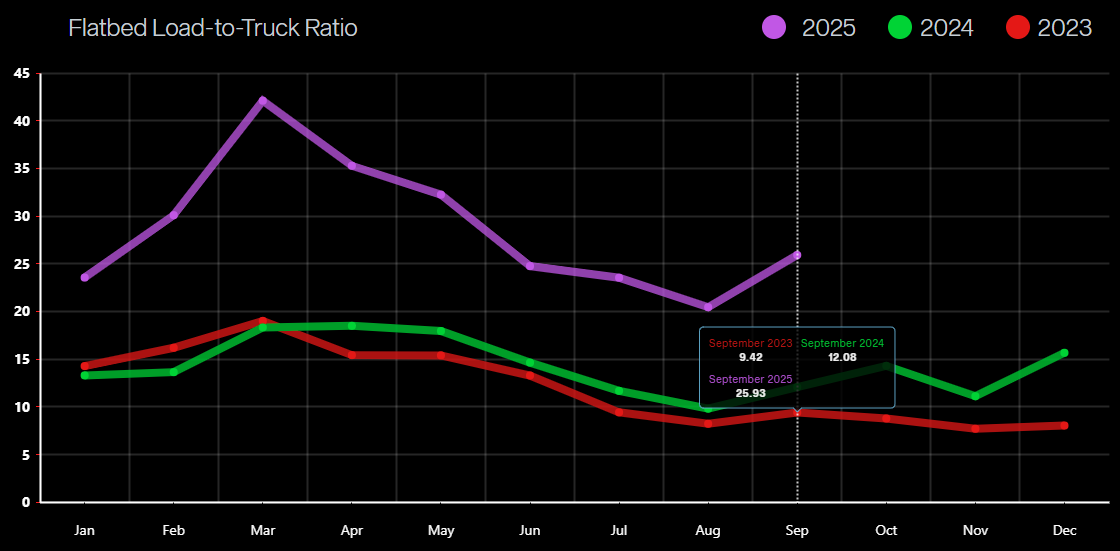
Flatbed Load-to-Truck Ratios
Chart Notes
Flatbed load-to-truck ratios tighten: The load-to-truck ratio for flatbed is up 27% month-over-month after five consecutive months of softening.
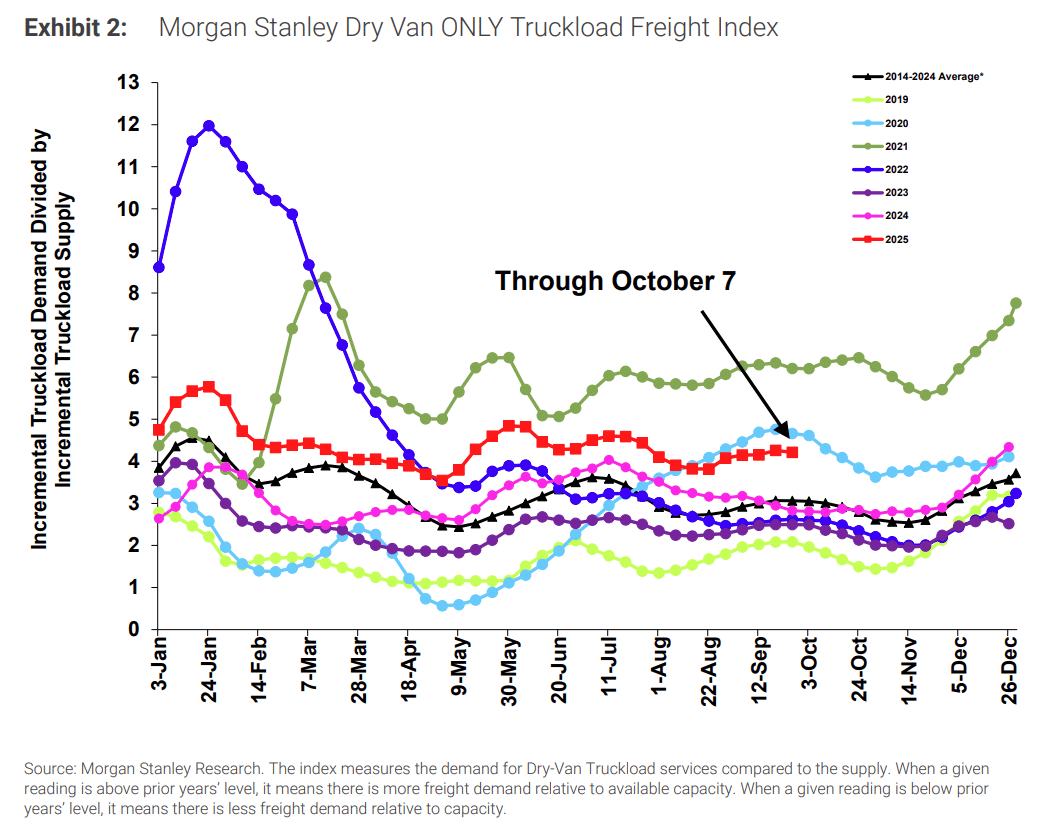
Morgan Stanley Dry Van ONLY Truckload Freight Index
Chart Notes
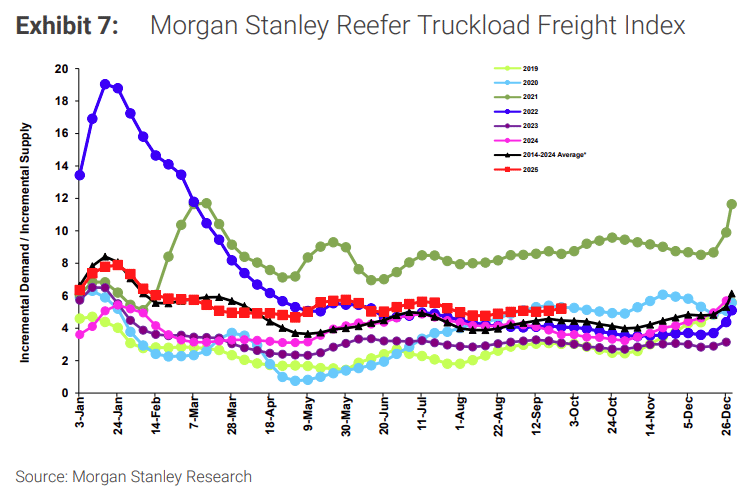
Morgan Stanley Index shows elevated seasonality across van and reefer in September: Van and reefer indices trended above historical levels, while flatbed conditions appeared softer in the most recent report.
Morgan Stanley Reefer Truckload Freight Index
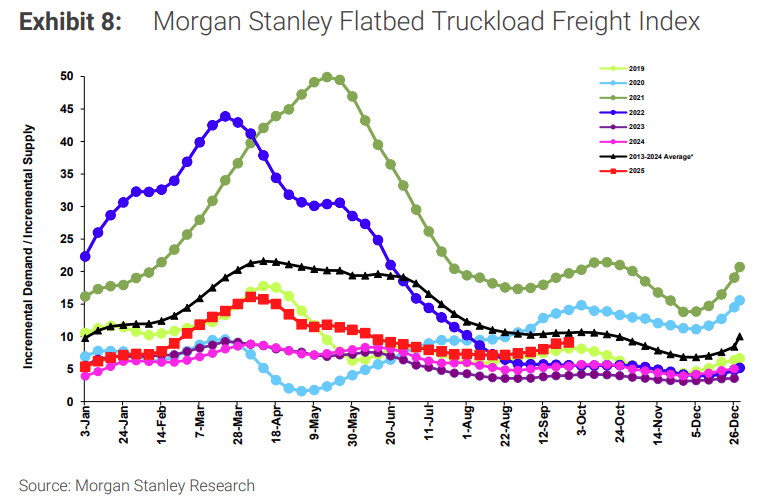
Morgan Stanley Flatbed Truckload Freight Index
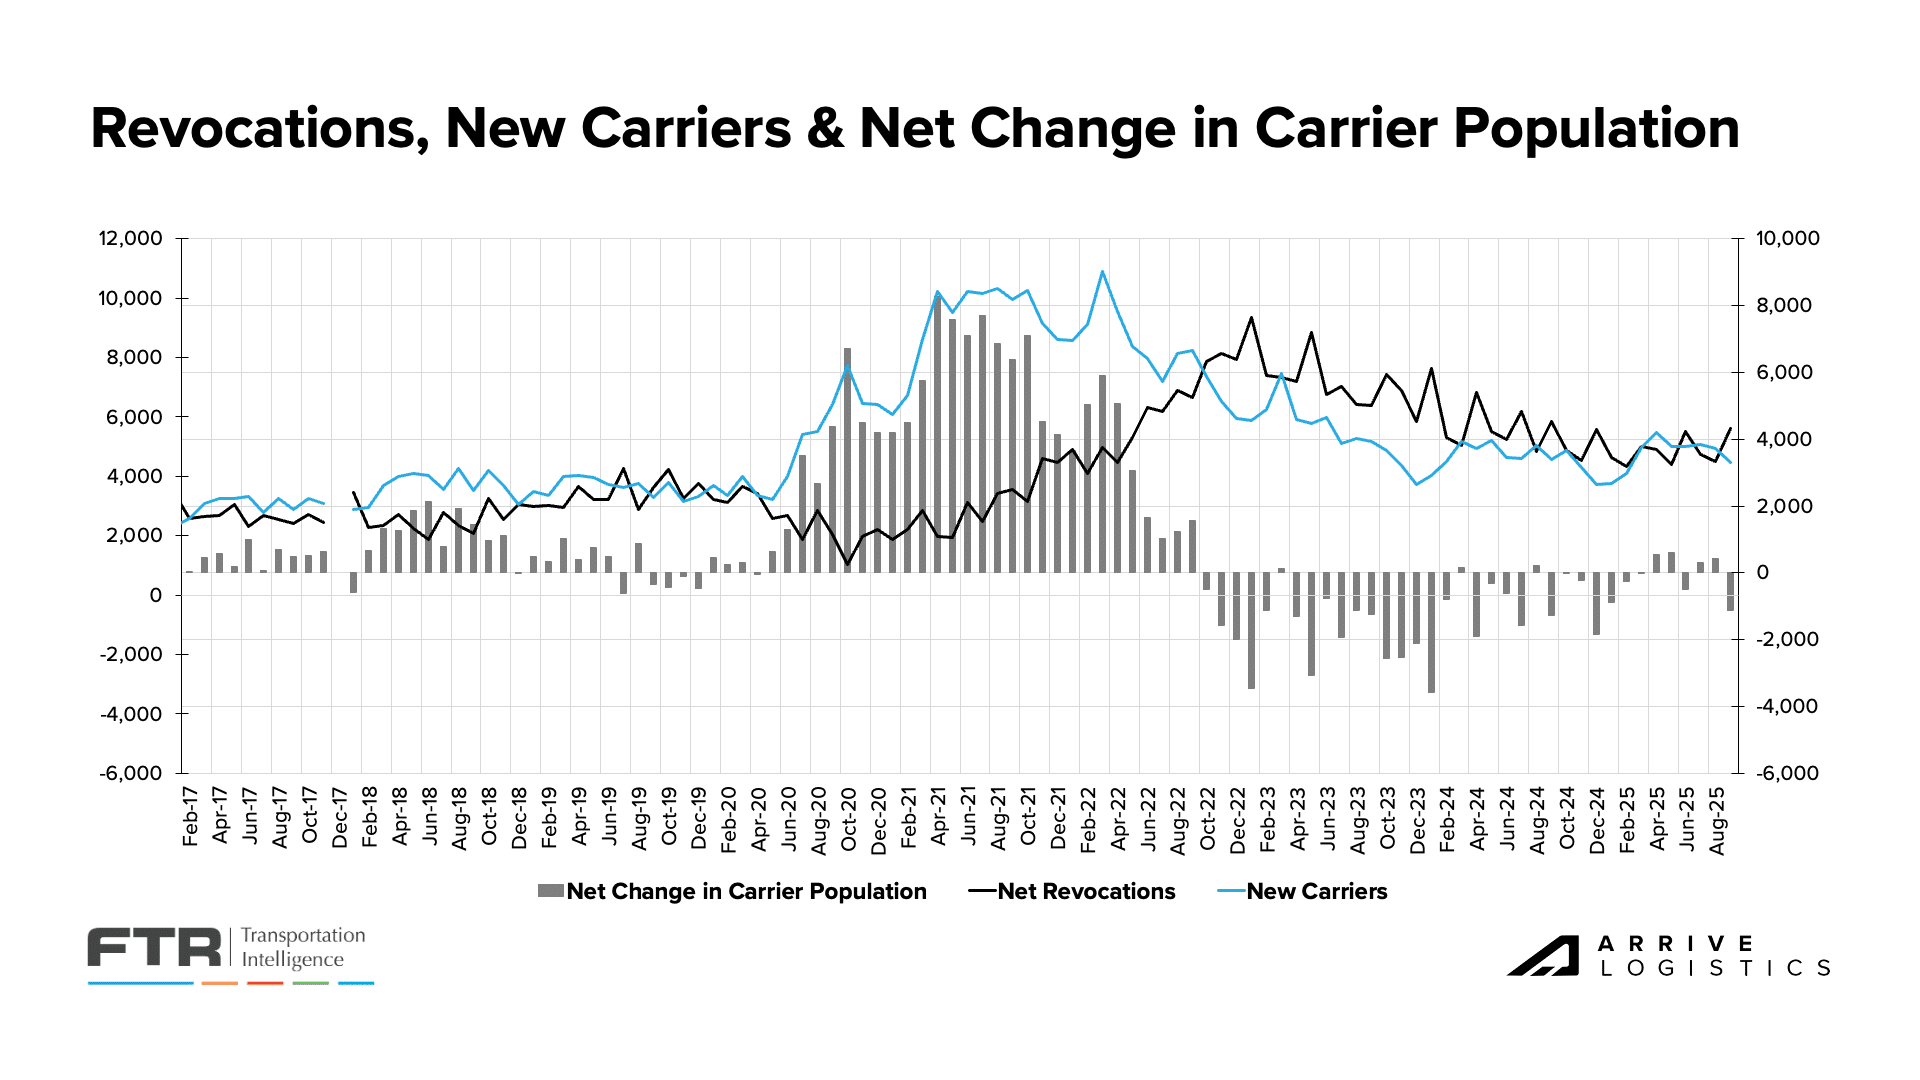
Carrier Revocations, New Carriers & Net Change in Carrier Population, FTR
Chart Notes
Carrier population shrinks in September: A decrease of 1,133 carriers in September was just the second decline in the last six months. The five Mondays in the month likely contributed, given that the FMCSA processes most revocations on Mondays.
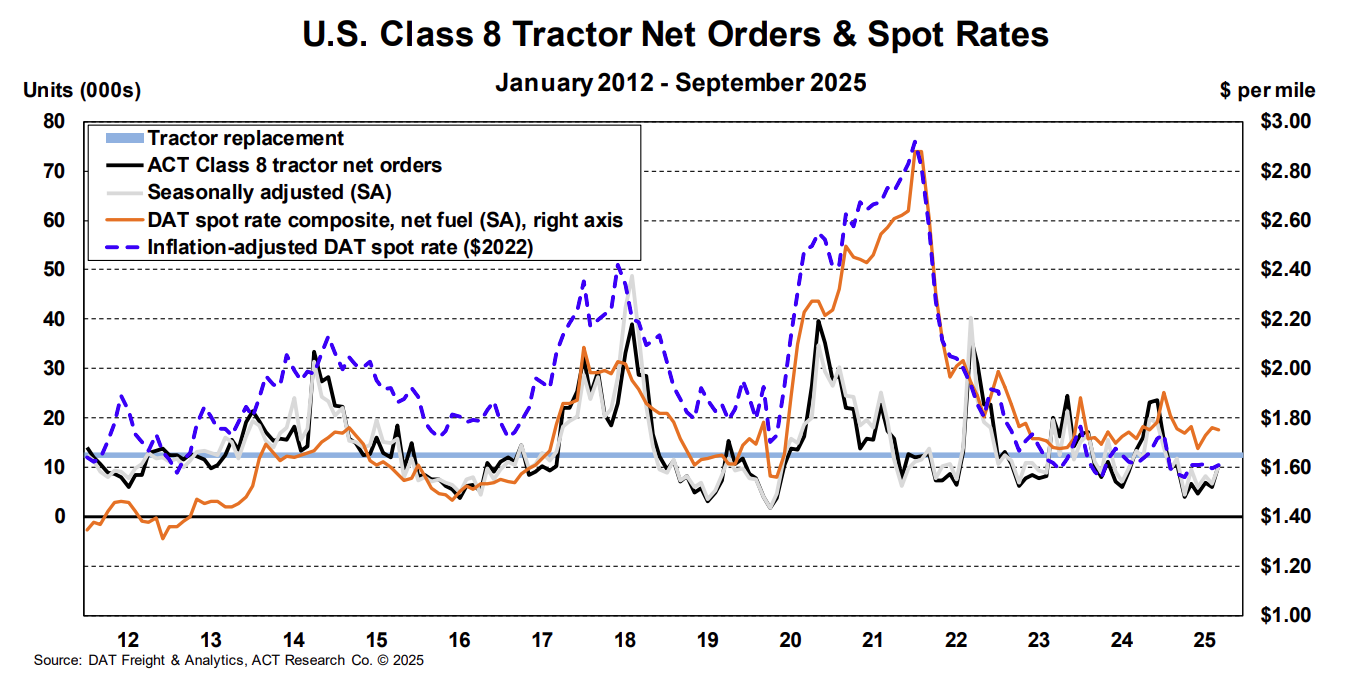
Class 8 Tractor Net Orders, ACT Research
Chart Notes
Tractor orders continue to show weakness: Class 8 orders increased to more than 10,000 units in September, but that remains below the level needed to sustain fleet replacement. Recent manufacturer price hikes tied to 25%–50% tariffs on steel and aluminum have added several thousand dollars to the cost of each truck.
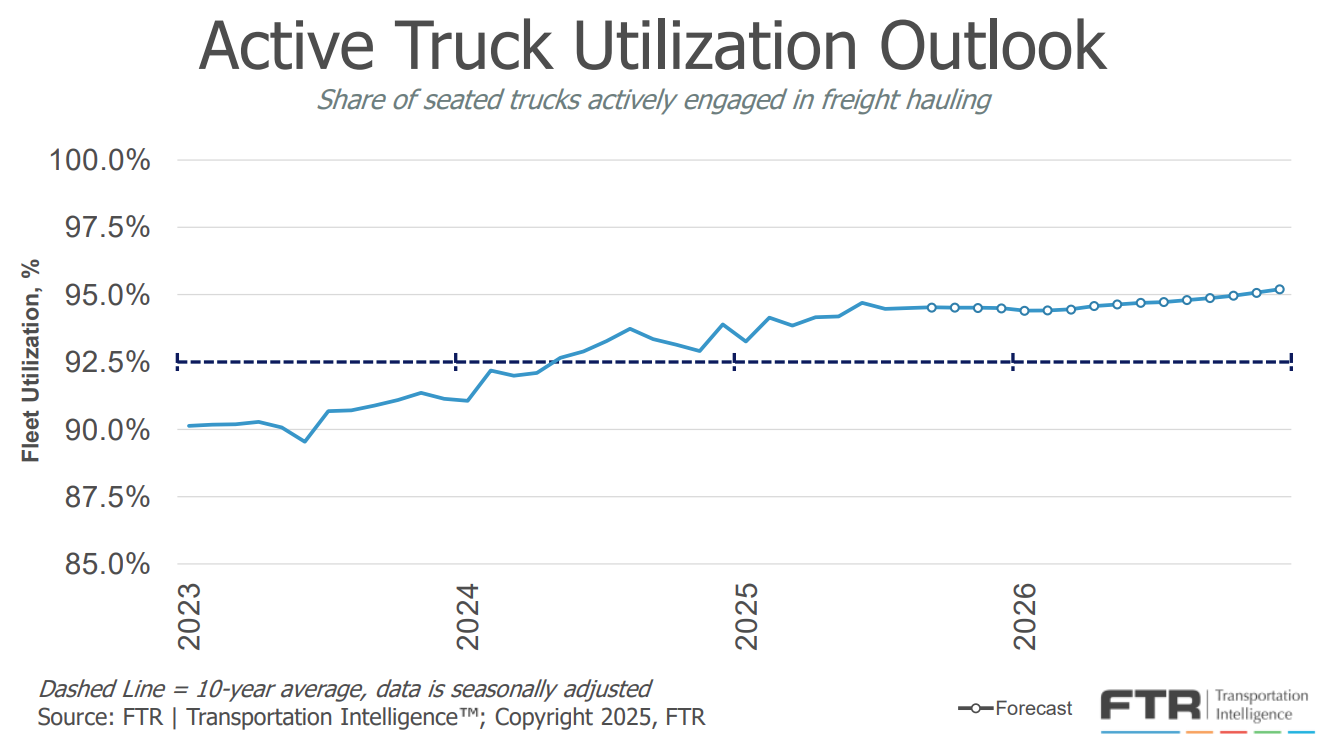
Active Truck Utilization, FTR
Chart Notes
Truck utilization forecast adjusts upward: FTR’s outlook ticked up above recent projections, largely due to recent revisions in trucking job estimates.
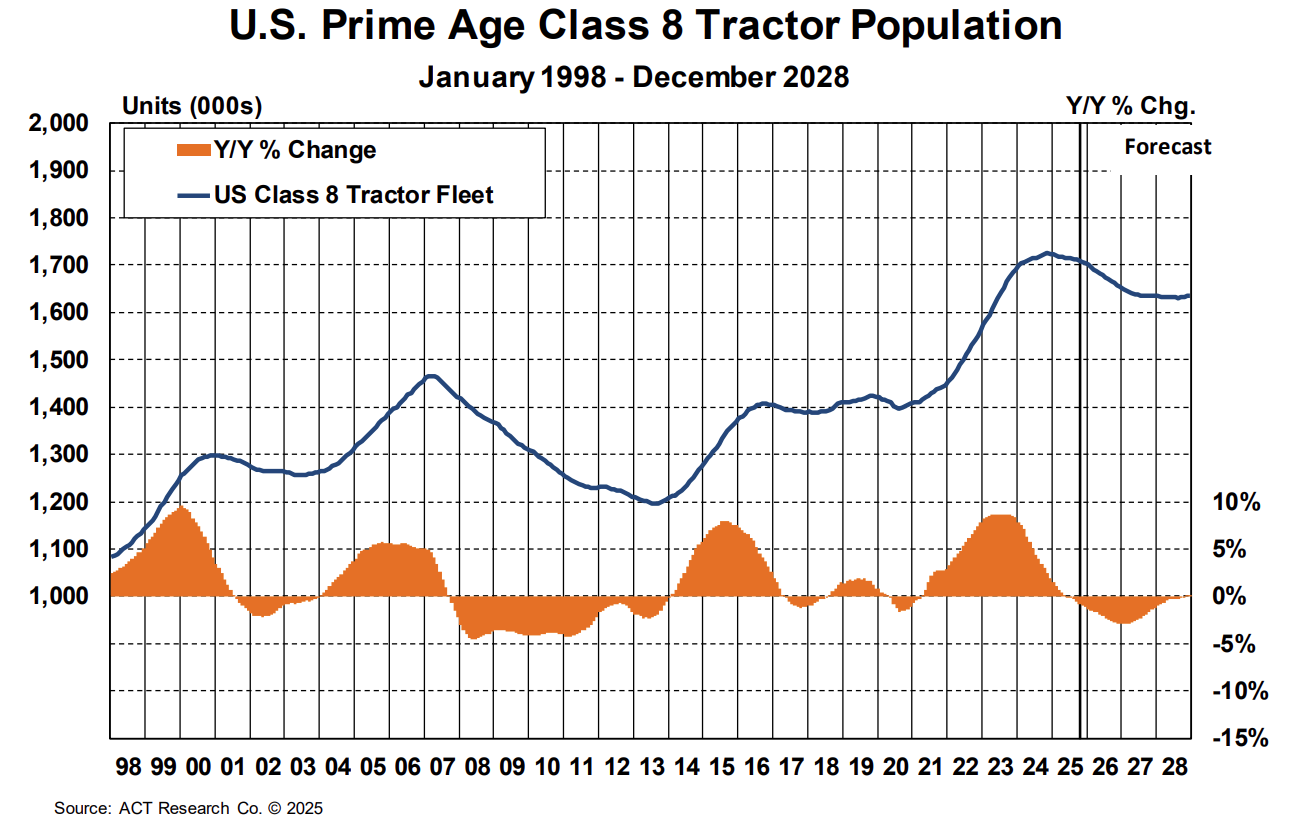
U.S. Prime Age Class 8 Tractor Population, ACT Research
Chart Notes
Tractor growth remains negative for the second straight month after four years of growth: Class 8 tractor counts fell 0.8% year-over-year, with an additional 2.9% decline expected in 2026 and 1.2% in 2027.
For-Hire Driver Availability Index, ACT Research
Chart Notes
Driver availability neutral: ACT Research’s Driver Availability Index showed neither loosening nor tightening, coming in at 50.0 in the most recent report. Fleets are not yet struggling, but the availability of quality drivers remains a challenge.
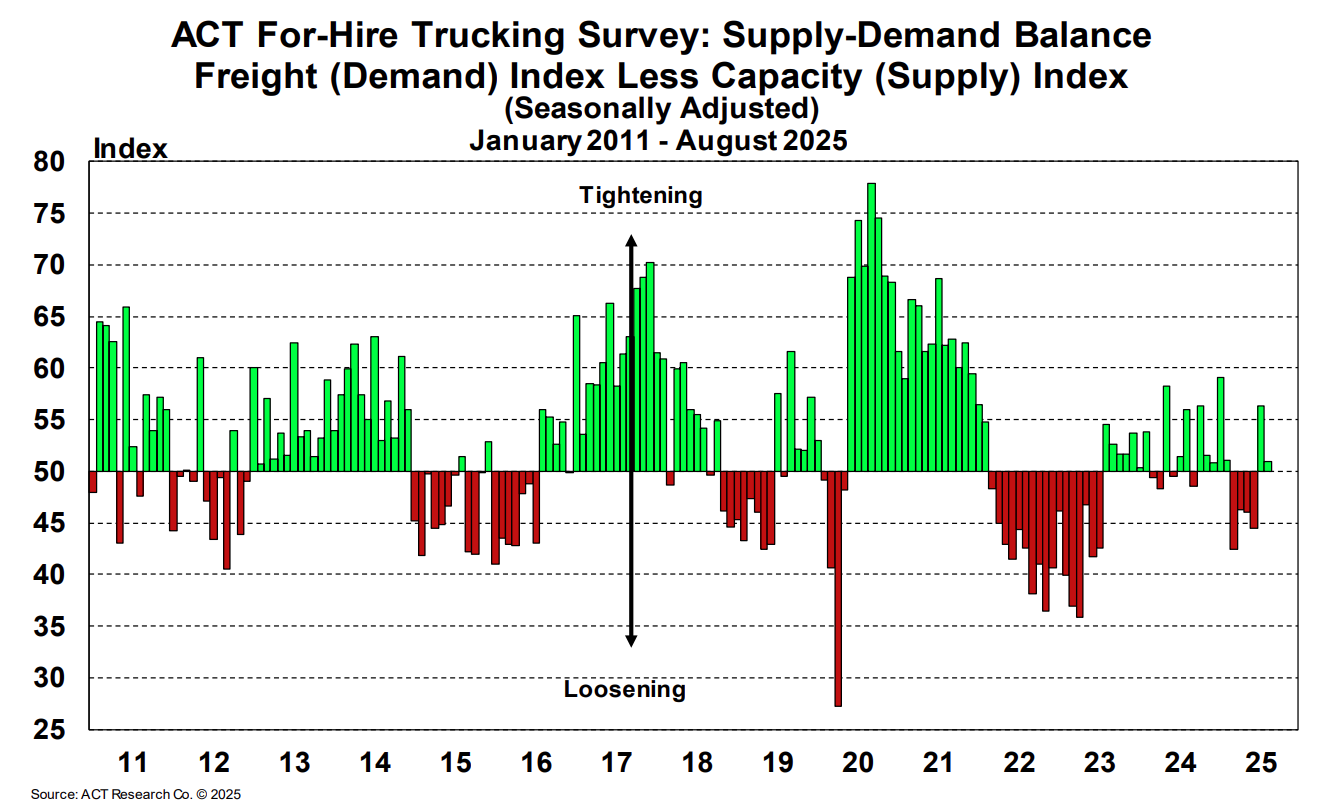
For-Hire Trucking Survey: Supply-Demand Balance, ACT Research
Chart Notes
Demand weakness expected to drive softer market balance: ACT reports that weakening economic activity and declining imports will continue to weigh on freight volumes. As a result, capacity is expected to contract, keeping the market at or near equilibrium.
Truckload Rates
Looking Back
Rates followed typical seasonal patterns through September, with van and reefer markets both spiking around Labor Day before easing through the rest of the month. A brief rate bump also hit the market at the end of September and into early October, driven by disruption surrounding the non-domiciled CDL regulation.
Looking Ahead
Aside from the typical disruptive periods in Q4, rates are expected to follow normal seasonal trends through the remainder of the year. Recent trends in mid-October point to a potential unseasonal disruption, but normalization in early November is expected after Diwali and end-of-month pressures fade.
View Related Data
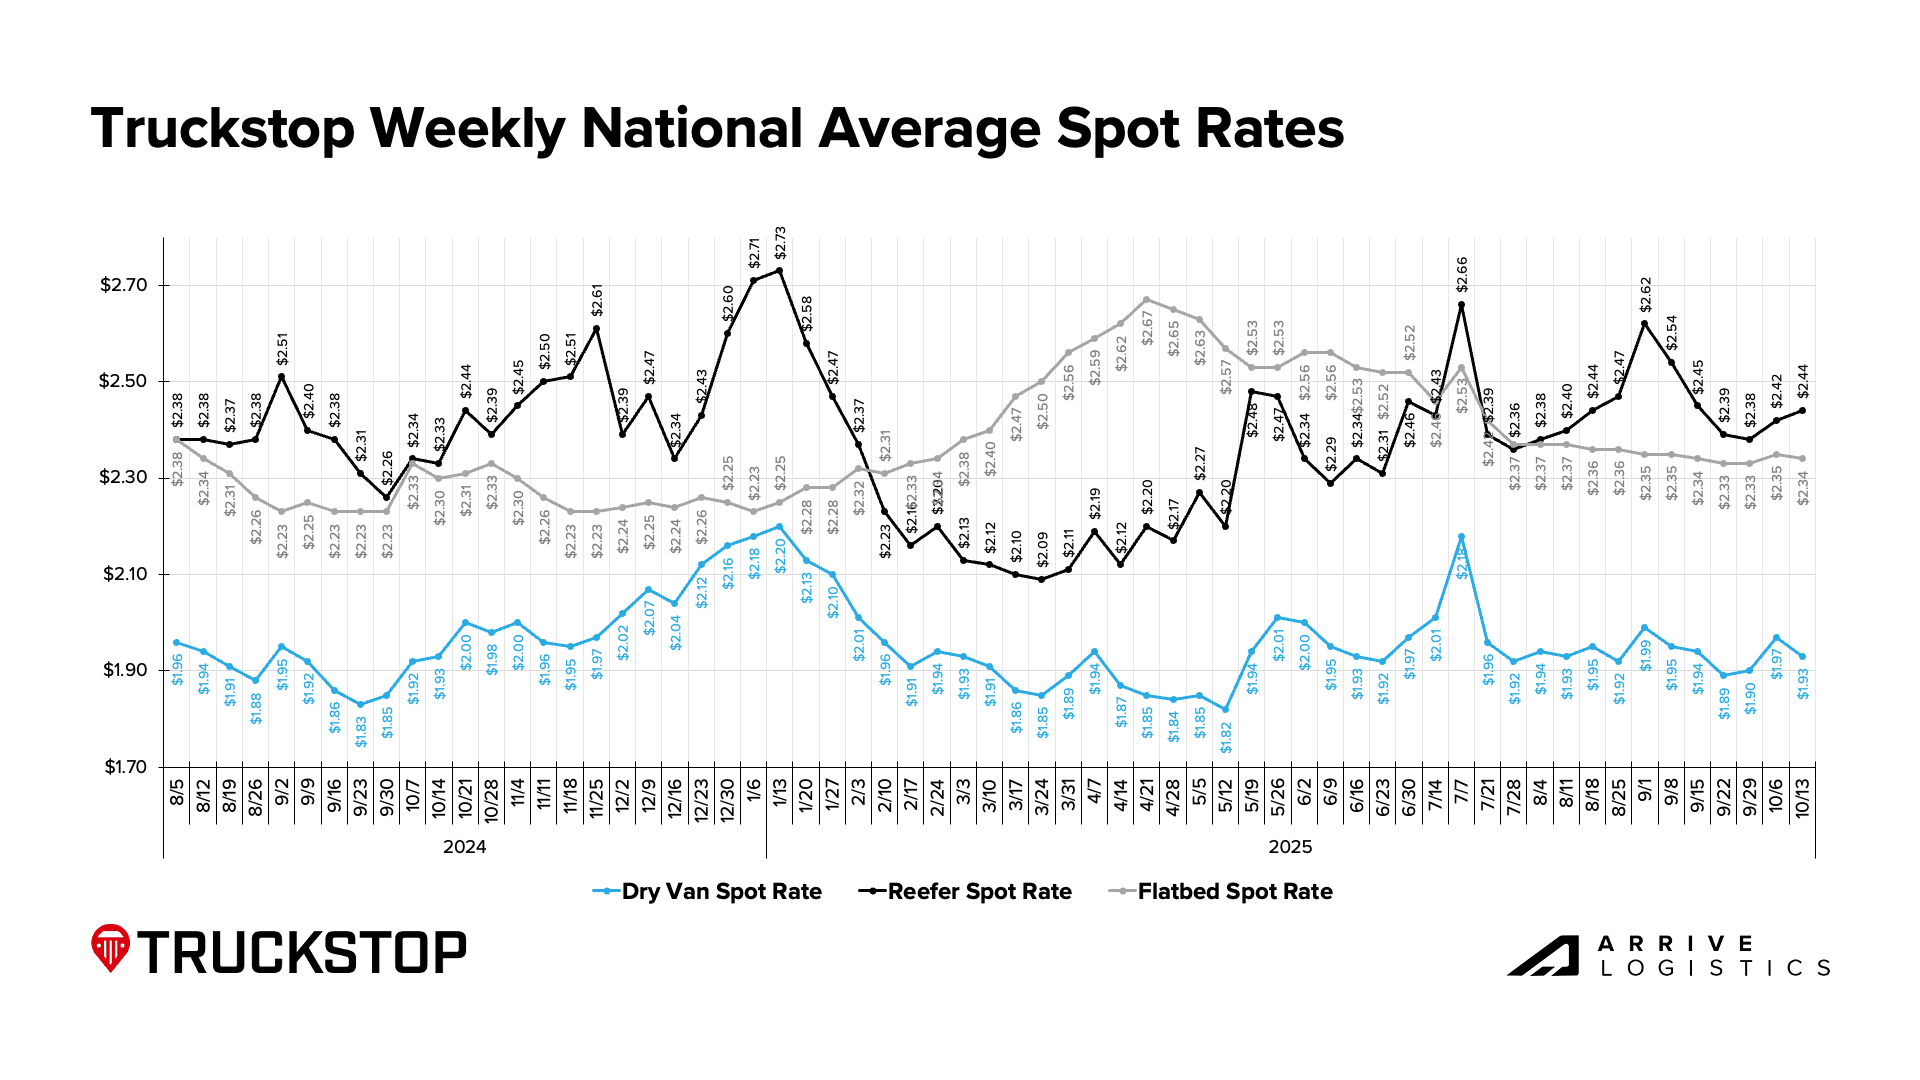
Truckstop Weekly National Average Spot Rates
Chart Notes
Rates pick up in October after late September slide: Recent market pressures created some upward movement in October after rates eased throughout September. Rates trended mostly upward across van and reefer equipment in Q4 last year, and seasonal volatility is likely again this year.
DAT Monthly Rate Trends
Chart Notes
Rates up across all equipment types in October: All-in rates have climbed in September and October, month-to-date, across all three equipment types.
DAT Fuel Trends
Chart Notes
Diesel prices stable: Prices have stayed in a tight range over the past few months, keeping fuel costs steady. The U.S. Energy Information Administration’s latest forecast calls for modest increases but overall stability.
DAT Dry Van National Average RPM Spot vs. Contract
Chart Notes
Spot-contract gap holding steady: The dry van spot-contract gap has hovered between $0.37 and $0.43 per mile over the past eight months but currently sits at $0.33 in mid-October after spot rate increases in the first half of the month. A smaller gap suggests greater market sensitivity to disruption, though the current reading still signals limited risk of sustained volatility.
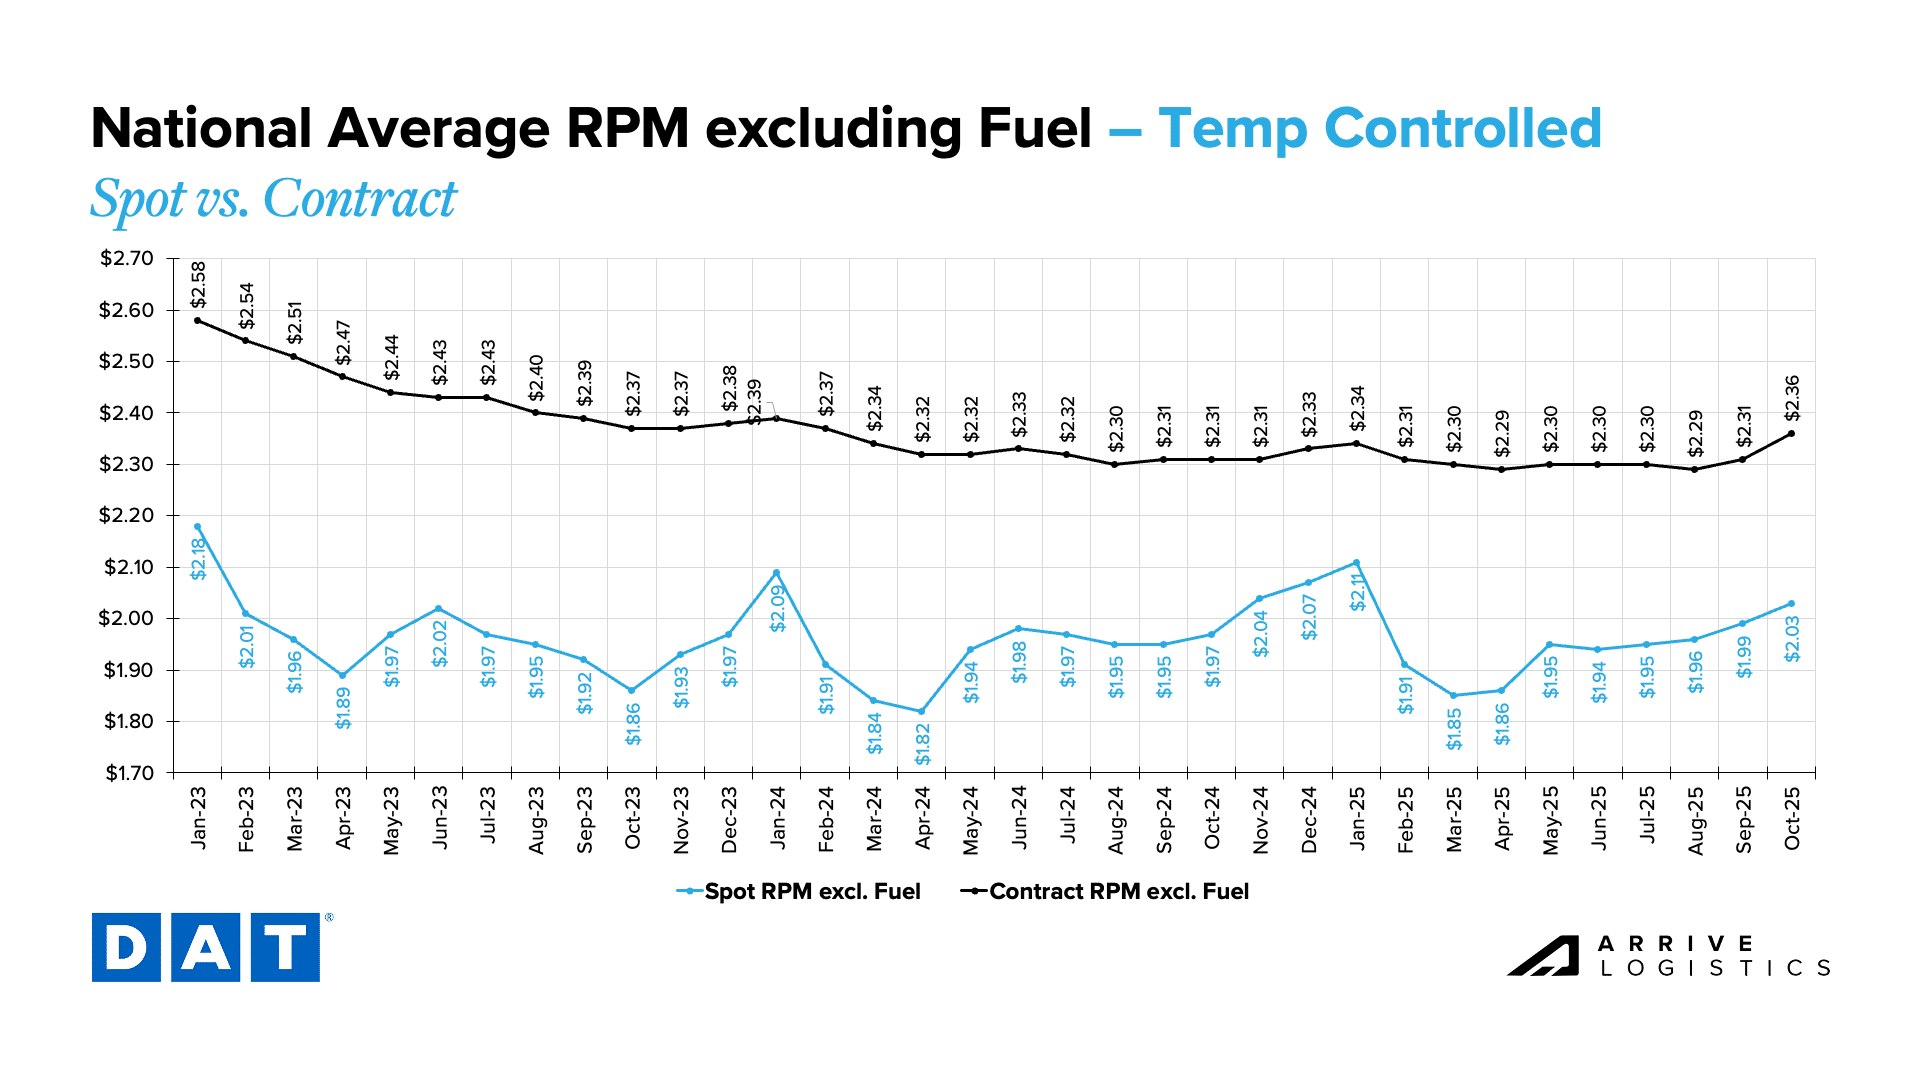
DAT Temp Controlled National Average RPM Spot vs. Contract
Chart Notes
Reefer spot-contract gap holds steady: The reefer spot-contract gap has held between $0.32 and $0.36 per mile over the past six months and sits at $0.33 in October. While a smaller gap typically signals greater market sensitivity to disruption, current levels still suggest limited risk of sustained volatility.
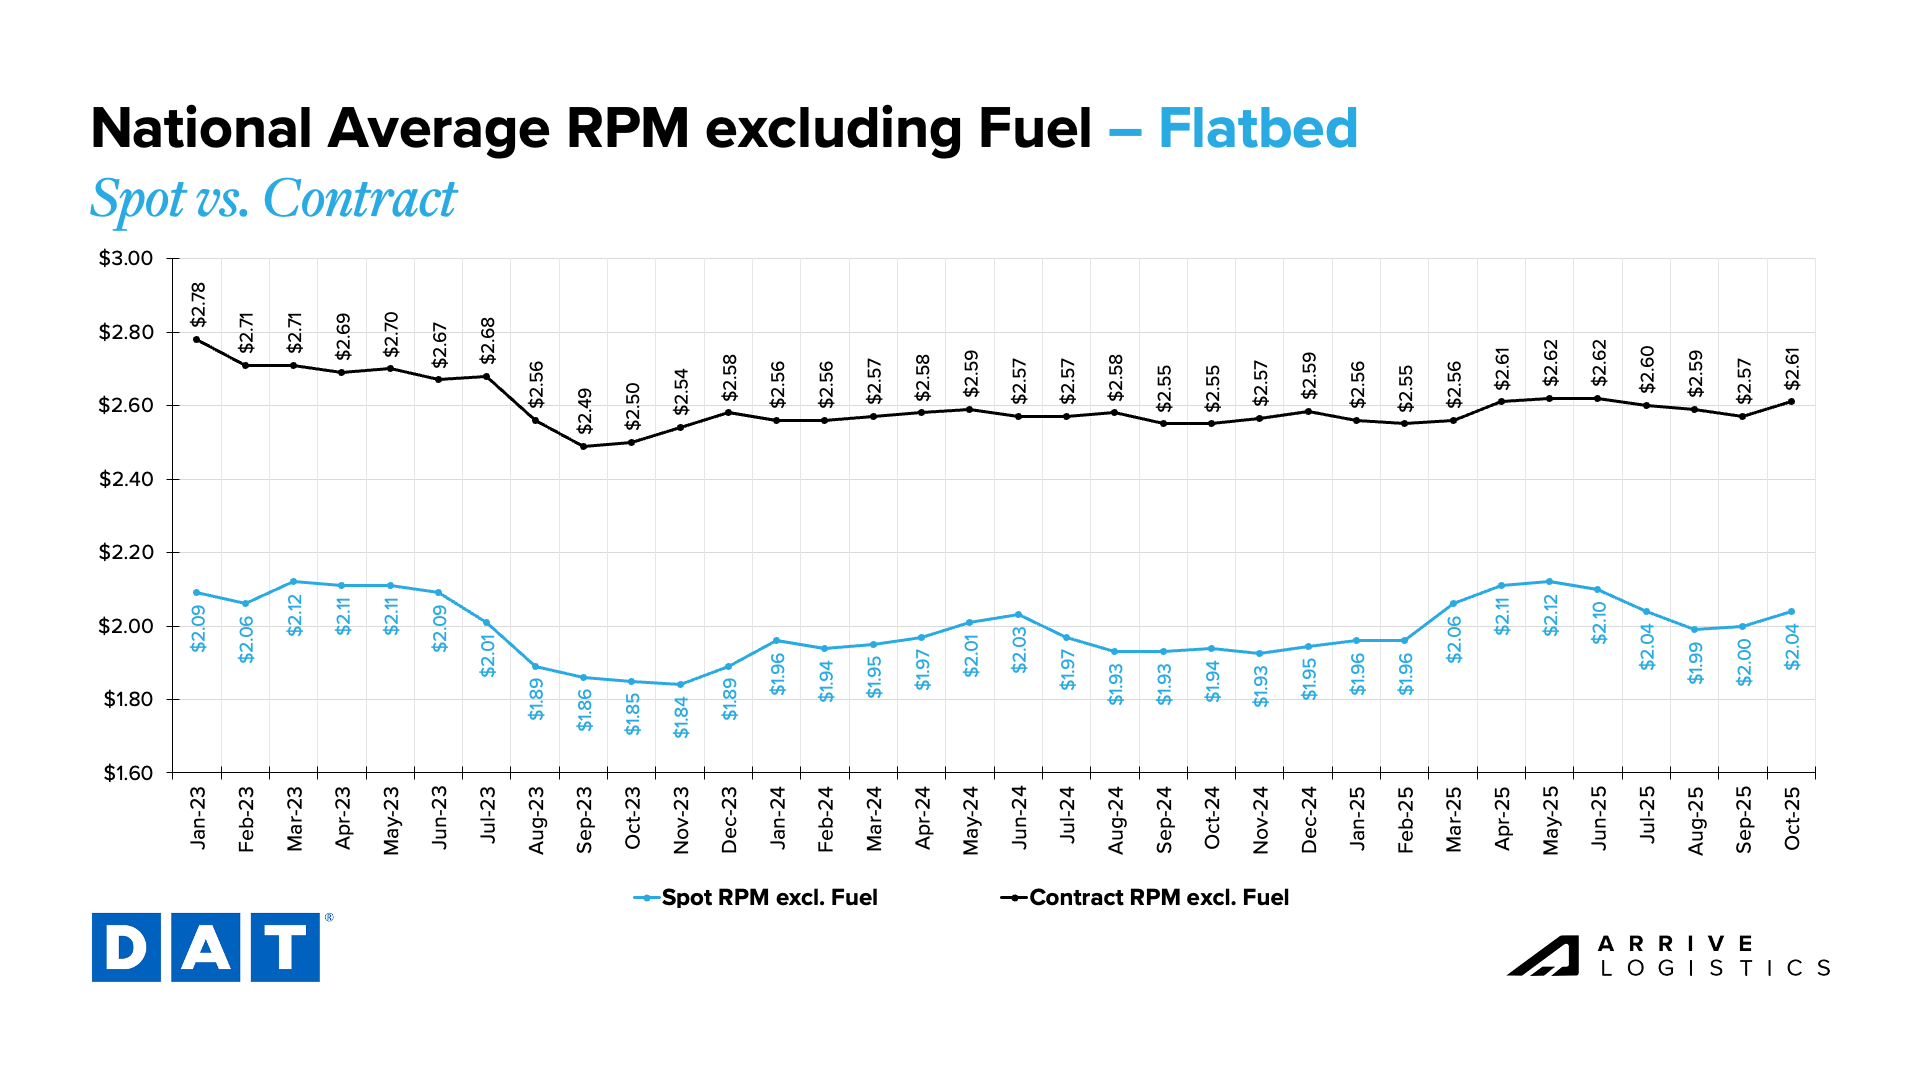
DAT Flatbed National Average RPM Spot vs. Contract
Chart Notes
Flatbed linehaul rates show stable year-over-year growth: After strong early-season gains, flatbed spot linehaul rates leveled off in the summer months. Rates rose 3.1% in August, 3.6% in September and are up 5.2% in October.
Economic Conditions
Looking Back
Consumer spending held steady in September, and while the latest CPI reading has yet to be released, it’s expected to remain within recent ranges. With that, and without new labor data available at the time of writing, the broader economic picture remains largely unchanged from last month.
Looking Ahead
Economic conditions should help keep freight volumes at or near current levels. However, interest rates, inflation and labor uncertainty remain risks. Further rate cuts would help stimulate housing and durable goods demand, which in turn would greatly benefit freight volumes.
View Related Data
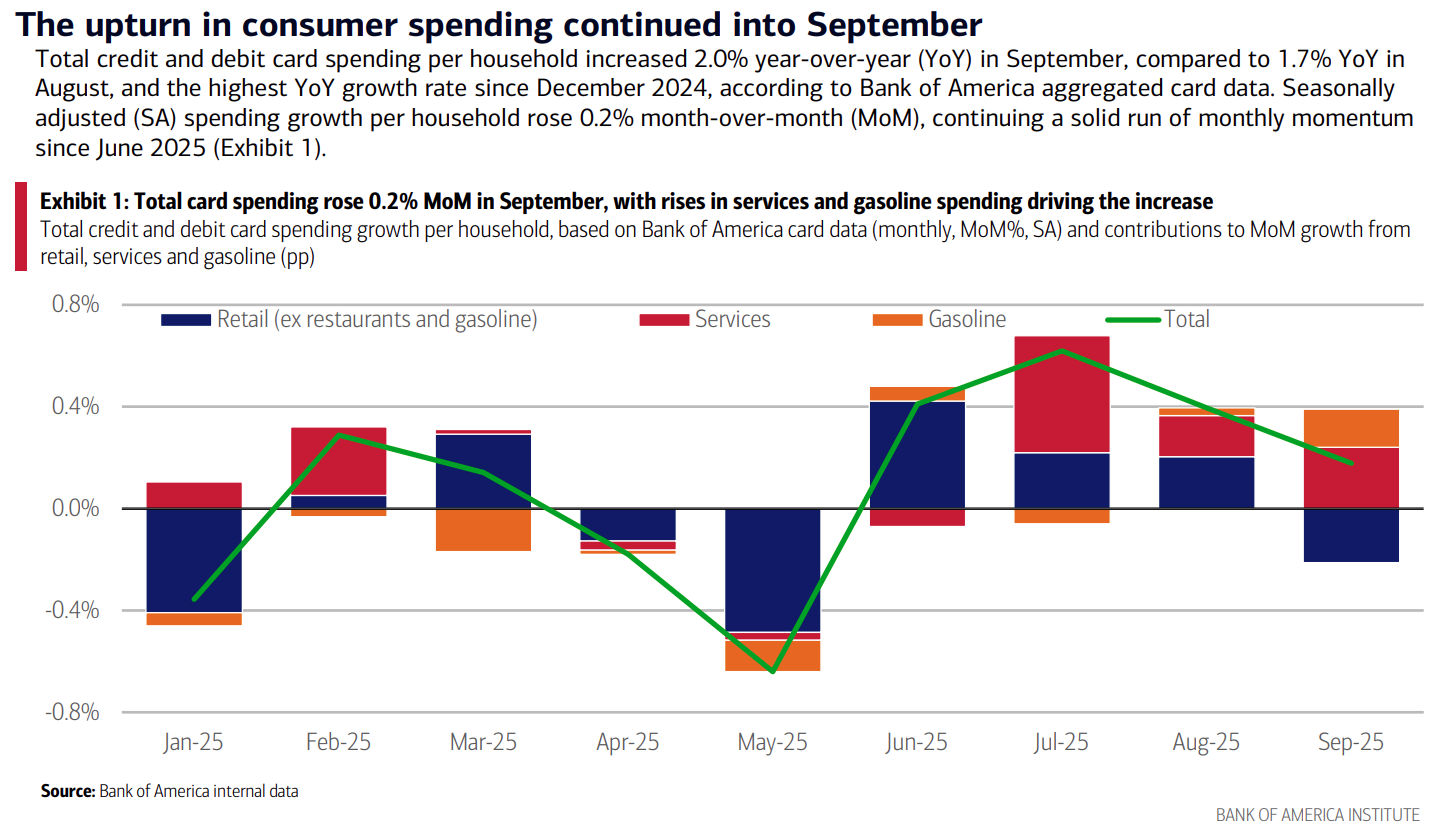
Bank of America Total Card Spending, Bank of America Consumer Checkpoints
Chart Notes
Increase in consumer spending in September: Bank of America reported household spending rose 2.0% year-over-year in September, consistent with 1.8% growth in July and 1.7% in August. Gains were broad-based, though retail spending took a slight step back.
Navigate the freight market with confidence.
Get this free report delivered straight to your inbox every month.