Need Help
close button

How can we help?

Select One:
Arrive Insights™

February 2026 Freight Market Update

Table of Contents

Market Memo

From the Desk of David Spencer

Winter Storm Fern slammed much of the country just as freight market conditions began to settle in mid-January, causing major disruptions that sent tender rejections higher and pushed spot rates to multi-year highs through month-end. That volatility stretched into early February as more snow and frigid temperatures hit the Southeast, Carolinas, Mid-Atlantic and parts of the Northeast.

Similar storms in recent years did not generate nearly this level of volatility, particularly in February, when demand typically softens and weather-related disruptions subside relatively quickly. While the worst of the storm’s impact has now passed, it’s clear the market is rapidly approaching a tipping point.

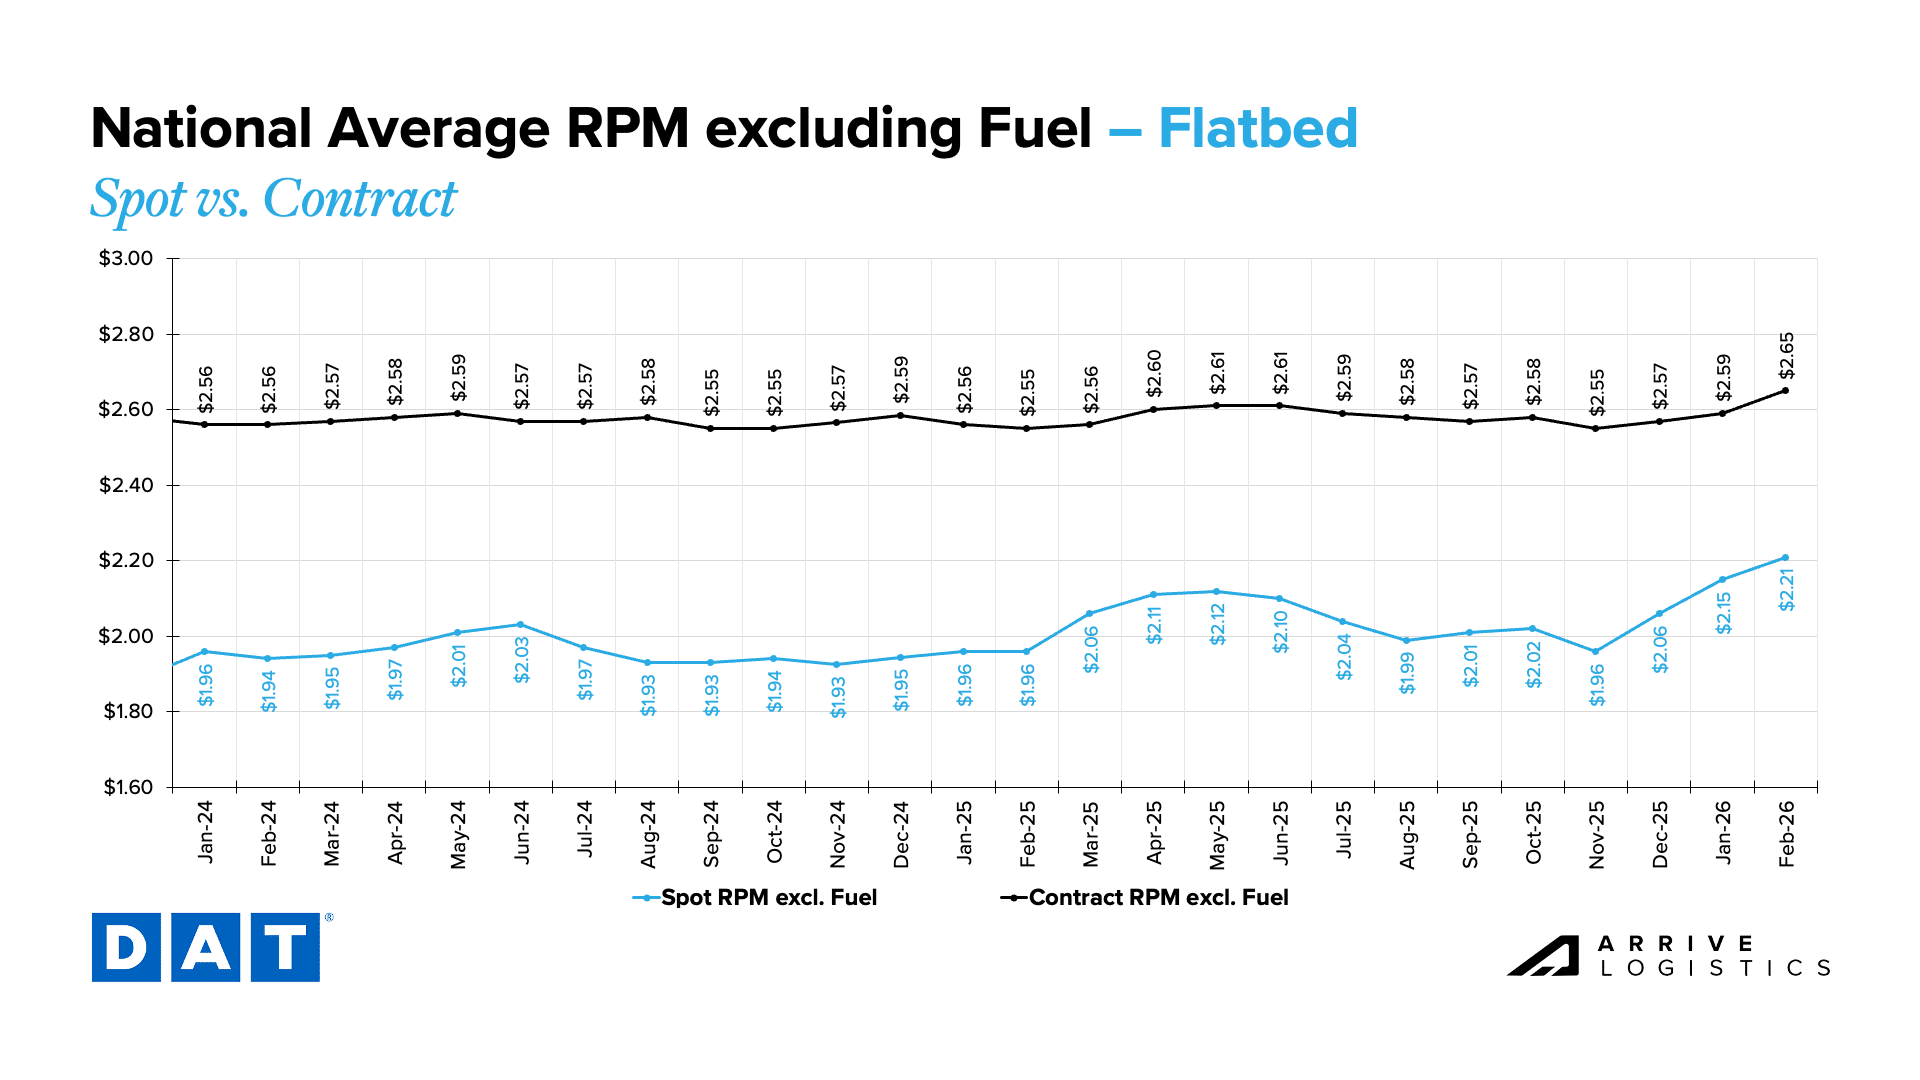
As of mid-month, spot rates across van, reefer and flatbed remain meaningfully elevated on a year-over-year basis, with some still sitting at or above contract levels. Even with volumes down year-over-year, supply is showing significant cracks as high operating costs, ongoing trucking employment declines and regulatory enforcement continue to reduce the driver count and shrink available capacity.

Looking ahead, spot rates will likely ease as the dust continues to settle in the coming weeks. However, even with a steeper-than-expected decline, they will enter the second quarter up significantly on a year-over-year basis. The longer spot rates remain elevated, the higher the floor for the year is set ahead of periods of increased seasonal demand. 

In turn, pressure on contract rates will increase and routing guide challenges will become more common as the year progresses. This trend will likely first materialize when produce season ramps up in March, and how the market responds will offer insight into what to expect during the stretch from DOT Week in May through the peak summer shipping season in June and July.

If the last few months are any indication, shippers should prepare for some of the most volatile conditions in several years. While this is unlikely to match the scale of disruption seen during the pandemic, a sustained period of spot rate inflation should now be expected, along with the challenges that typically accompany those environments.

For more data and insights on the key trends to watch as this transition unfolds, read on.

Arrive Logistics VP of Market Intelligence David Spencer Headshot
David Spencer
VP of Market Intelligence

Key Takeaways

  • Winter Storm Fern triggered a lasting disruption to contract routing guides, reigniting spot rate volatility that had begun to ease ahead of the storm.
  • The disruption primarily affected the eastern half of the country, although effects were felt nationwide.
  • Demand indicators remain weak, but recent disruptions have driven a surge in spot activity.
  • Capacity attrition has improved the supply-demand balance, increasing volatility during disruptions.
  • Despite a temporary administrative stay on new FMCSA rules for non-domiciled CDL drivers, the regulatory environment remains a significant risk to capacity. Illegally issued licenses also continue to be revoked amid ongoing audits of state agencies, carriers and driving schools.
  • Equipment orders remained elevated in January as fleets gained more clarity around EPA emissions regulations. Near-record average fleet ages could support truckload rate increases as the tractor population declines and equipment costs rise.
  • Import volumes remain challenged compared to recent years but are strong relative to historical averages, with January ranking as the fourth highest on record.
  • The ISM Manufacturing Index expanded in January for the first time in 12 months, with new orders up 9.7 percentage points from December, the highest reading since February 2022.
  • Surging spot demand pushed rates higher in late January and early February as winter storms created extended capacity disruptions and significant replenishment demand. While recent trends point to easing pressure in most regions, the Midwest remains severely constrained.
  • A resilient economy and steady spending are helping stabilize freight demand, but lagging inflationary pressures remain the largest risk to consumer-driven demand in 2026.

Truckload Demand

Looking Back

Tender rejections and spot market activity surged as Winter Storm Fern struck in late January, while contract volumes remained down year-over-year, reflecting persistently soft demand outside seasonal disruption. Imports declined year-over-year, but steady ordering helped keep levels above historical averages for the month. Manufacturing returned to expansion for the first time in nearly a year as the share of the sector in contraction fell significantly from December. Consumer spending also showed continued strength.

Looking Ahead

Demand will likely level out through late Q1 before building again ahead of produce season and the summer months. The recent improvement in manufacturing is notable, particularly given how broad the contraction was in December. However, a similar one-month expansion last year was followed by renewed contraction, making it too early to determine whether this shift indicates the start of a sustained recovery.

Contract Load Accepted Volume, SONAR

Chart Notes
  • Accepted contract volumes remain depressed: FreightWaves SONAR data shows accepted contract volumes are down 11% year-over-year, continuing to closely follow seasonal patterns at lower levels compared with prior years.

DAT Trendlines

Chart Notes
  • Spot market activity remains elevated: DAT data shows both month-over-month and year-over-year increases in January spot demand, as winter weather disrupted routing guides and drove more volume to the spot market.

Cass Freight Index Report – January 2026

Chart Notes
  • Cass Freight Index shows weather-driven weakness: Cass reported volumes were down 7.1% year-over-year following a 2.0% seasonally adjusted drop in January, with analysts saying the slowdown could lead to a February rebound.

Cass Freight Index Shipments Forecast – January 2026

Chart Notes
  • Potential green shoots stem from planned data center spending: Cass and ACT analysts said the $610 billion in capex the top four tech firms plan for 2026, up 70% year-over-year, should help lift “cyclically low” freight demand, with further upside based on the recent on the IEEPA tariff ruling.

Descartes U.S. Container Import Volume

Chart Notes
  • Steady imports illustrate a more normalized trade environment: Although volumes were down 6.8% year-over-year, Descartes analysts said this was the fourth strongest January on record, a sign importers are becoming more accustomed to trade policy uncertainty.

Inbound Ocean TEUs Volume Index, SONAR

Chart Notes
  • Import orders remain below prior year levels: SONAR data shows orders continued to follow seasonal trends through early Q1 but were still down more than 15% year-over-year ahead of the annual Chinese New Year dip.

Manufacturing at a Glance, Manufacturing ISM

Chart Notes
  • Manufacturing expansion stuns in January: The ISM Manufacturing Index expanded for the first time in 12 months, with new orders at 57.1, up 9.7 percentage points from December’s seasonally adjusted figure and the highest reading since February 2022. Just 20% of the sector’s GDP contracted, down significantly from 85% in December.

Truckload Supply

Looking Back

Winter Storm Fern drove sharp increases in tender rejections and spot market activity at a time when market conditions typically begin to soften. Recent trucking employment data showed a significant downward revision, indicating that at least some portion of the ongoing disruption is tied to increased sensitivity from significant capacity reductions over the past few years. Outside seasonal disruptions, high operating costs and increased regulatory enforcement continued to constrain capacity early in 2026.

Looking Ahead

Capacity conditions should continue to ease in the near term as volatility and spot demand subsides. However, given the market’s response to this latest disruption and the aforementioned risks, supply pressure could increase again as early as the spring produce season. 

Outbound Tender Reject Index, SONAR

Chart Notes
  • Rejections experienced an atypical spike in late January: SONAR data shows rejection rates reached a multi-year high of 13.76% in early February after Winter Storm Fern. Although weather drove the spike, capacity appears to be back in equilibrium and highly sensitive to disruptions.

Van Outbound Tender Rejection Index, SONAR

Chart Notes
  • Dry van rejections stable near 14%: Van rejections climbed to the highest levels since March 2022 after Winter Storm Fern and show no signs of fading by mid-February, keeping spot demand and rates elevated.

Reefer Outbound Tender Rejection Index, SONAR

Chart Notes
  • Reefer tender rejections peak: Reefer rejections hit 23.25% following Winter Storm Fern. They remain above 22% in mid-February but are softening as storm-related replenishment volumes subside.

Flatbed Outbound Tender Rejection Index, SONAR

Chart Notes
  • Flatbed tightness likely to persist: Winter Storm Fern accelerated flatbed rejections — they remain near 30% ahead of the construction and lawn and garden season.

Van Load-to-Truck Ratios

Reefer Load-to-Truck Ratio

Chart Notes
  • Equipment ratios continue to rise: Weather-related disruptions pushed dry van and reefer ratios sharply higher in January as spot postings increased year-over-year for the 14th straight month. February postings are trending near double February 2025 levels, with dry van ratios up 14.6% year-over-year and reefer ratios up 58.9% year-over-year.

Flatbed Load-to-Truck Ratios

Chart Notes
  • Flatbed load-to-truck ratio moving upward: The flatbed load-to-truck ratio increased 47.3% month-over-month and 72.0% year-over-year in February, largely driven by higher tender rejections.

Morgan Stanley Dry Van ONLY Truckload Freight Index

Chart Notes
  • Morgan Stanley Index shows elevated seasonality across modes: Indices spiked in January and continue to show tighter conditions than at any point outside the pandemic disruption. Tightening when historical trends typically point to easing signals the market is more sensitive to disruptions like severe weather.

Morgan Stanley Reefer Truckload Freight Index

Morgan Stanley Flatbed Truckload Freight Index

Carrier Revocations, New Carriers & Net Change in Carrier Population, FTR

Chart Notes
  • Carrier population remains steady in January: After a spike driven largely by a calendar-related distortion in December, FTR analysts said January revocations normalized to October and November levels.

Class 8 Tractor Net Orders, ACT Research

Chart Notes
  • Tractor orders remain strong: ACT data shows Class 8 orders were up 19% year-over-year in January, indicating a healthy spot rate environment and greater clarity on emission regulations will likely support stronger ordering patterns in 2026.

Active Truck Utilization, FTR

Chart Notes
  • Truck utilization strengthens: FTR’s near-term outlook calls for utilization to exceed 97% by Q2. Analysts said the forecast faces risks in both directions depending on freight volumes and driver capacity in the coming months.

Monthly Change in Trucking Jobs, FRED Economic Data

  • Employment revisions show significant declines: Revisions in this month’s jobs report show employment was more than 50,000 jobs lower than previously reported. Current levels align with late 2017, down almost 4% from pre-pandemic levels (Feb. 2020) and more than 125,000 jobs from the pandemic peak. This data helps explain the market’s increased sensitivity to disruptions in recent months.

U.S. Prime Age Class 8 Tractor Population, ACT Research

Chart Notes
  • Orders surge should temper tractor population decline: Class 8 tractor counts are down 1.5% year-over-year. While higher sales should slow the decline, fleet counts are still expected to fall 1.2% through 2026 and a further 1.6% in 2027.

For-Hire Driver Availability Index, ACT Research

Chart Notes
  • Driver availability softens: ACT reported driver availability improved in December. However, recent anecdotal feedback from Arrive’s carrier network points to increased hiring challenges.

For-Hire Trucking Survey: Supply-Demand Balance, ACT Research

Chart Notes
  • Winter storms drive tightness: ACT says higher volumes amid balanced capacity tightened conditions in December and January as seasonal factors and winter storms took hold. The outlook remains complex, with upside and downside risks to supply and demand.

Enforcement Data – SONAR

  • ELP violations remain elevated as out-of-service violations stabilize: Overall violations and out-of-service violations remain near peak levels but do not appear to be accelerating or decelerating. This paints a picture of a more gradual capacity decline that is unlikely to be consequential on its own. However, any additional capacity exits in a market at or near equilibrium will continue to increase the market’s sensitivity to disruptive events.

Enforcement Data – FTR

  • ELP enforcement ramps up: ELP enforcement totals more than 12,000 unique OOS Violations since June 2025: Total violations are greater than 47,000 since enforcement ramped up in June last year, resulting in more than 13,000 out of service violations on more than 12,000 unique VINs. A relatively small portion of the driver population.

Truckload Rates

Looking Back

Van, reefer and flatbed spot rates rose sharply in late January as Winter Storm Fern set in. The rally carried into February, and while indicators suggest it may now be leveling off, spot rates remain meaningfully elevated year-over-year. The spot-contract gap has narrowed considerably across modes, with the van spread down to just a few cents and reefer above contract rates, signaling growing pressure on contract pricing.

Looking Ahead

Even with a steep near-term decline, spot pricing will likely continue to post double-digit growth above 2025 levels through the remainder of 2026. Persistently elevated rates at this point in the year will set a higher floor moving forward, so as seasonal demand builds through the spring and summer, added tightness will push spot rates higher and increase pressure on contract pricing.

Truckstop Weekly National Average Spot Rates

Chart Notes
  • Weekly van and reefer rates fall, flatbed climbs: Van and reefer rates spiked amid Winter Storm Fern, but the latest weekly data shows slight easing. Meanwhile, flatbed rates are climbing in line with Q1 2025 growth trends.

DAT Monthly Rate Trends

Chart Notes
  • Monthly spot rates increase across all modes: National average spot rates rose in January and early February. While winter weather largely drove the volatility, the market’s response indicated increased sensitivity to disruption.

DAT Fuel Trends

Chart Notes
  • Diesel rebounds: Prices have increased in recent weeks but remain below most levels seen in the second half of 2025.

DAT Dry Van National Average RPM Spot vs. Contract

Chart Notes
  • Spot-contract gap narrows in February: The dry van spot-contract gap reached a nearly four-year low of $0.16 per mile in January and sits at $0.10 per mile in February, signaling increased vulnerability to future disruptions.

DAT Temp Controlled National Average RPM Spot vs. Contract

Chart Notes
  • Reefer spot-contract gap turns negative: The reefer spot-contract gap hovered between $0.33 and $0.36 per mile from May to September but has since narrowed to $0.00 in January and -$0.07 in February amid a weather-related spike. As replenishment demand fades, rates will likely ease in line with typical seasonal patterns but remain elevated year-over-year.

DAT Flatbed National Average RPM Spot vs. Contract

Chart Notes

  • Flatbed growth accelerates: Flatbed spot linehaul rates showed strong year-over-year growth of 9.7% in January. They are up 12.8% month-to-date in February and continue to gain upward momentum.

Economic Conditions

Looking Back

Manufacturing expanded in January, signaling a shift in business investment, particularly related to data centers. On the consumer side, spending remained resilient beyond the holiday season, growing modestly year-over-year. Labor market growth exceeded expectations, supporting continued spending in the near term.

Looking Ahead

While housing-related demand remains a drag on freight volumes, increases in manufacturing could support growth, especially against weak comps in the back half of the year. The ruling on tariffs means some short term potential for increased import activity, however uncertainty with the use of other tariff strategies could mean additional challenges down the road. Lagging inflation remains the key downside risk for freight demand, while consumer strength, interest rate cuts and potential government stimulus ahead of the midterm elections present additional upside risks.

Bank of America Total Card Spending, Bank of America Consumer Checkpoints

Chart Notes
  • Consumer spending starts strong: Bank of America said household spending rose 2.6% year-over-year in January, the largest increase since February 2024. That strength should continue to support stable freight volumes.

The Employment Situation – January 2026

  • Employment exceeds expectations in January: The Bureau of Labor Statistics reported an increase of 130,000 jobs in January, but job creation did slow in 2025. The unemployment rate rose slightly from 4.0% in January 2025 to 4.3% in January 2026. Labor market stability should support relatively steady consumer spending and related freight demand.

Canadian Market Update

Looking Back

After winter storms wreaked havoc on the Canadian market in January, backlogged freight demand continued to consume outbound capacity and drive a surge in spot demand that pushed Canada-to-U.S. rates higher. Inbound Canadian capacity has normalized as outbound volumes remain high, but tightening U.S. conditions are also pushing northbound rates higher. Seasonal driver time off further constrained supply on lanes in both directions.

Looking Ahead

Tighter inbound conditions are expected to return as weather-related disruptions fade. In the wake of the tariff ruling, a potential surge in cross-border activity is likely, particularly on southbound lanes, as importers rush to move products ahead of potential new tariff measures. However, elevated trade tensions with the U.S. could continue to limit exports from Canada in the longer term. Capacity will remain tight through winter’s end, while continued regulatory enforcement affecting drivers and driver pools will likely reduce supply further and push rates higher as the year progresses.

Canadian Spot Market – Freight Index

Chart Notes
  • Load postings surge: Loadlink data shows momentum that began in November carried into January, with postings up 33% month-over-month and 6% year-over-year.

Canada – Cross-Border Volume vs. Intra-Canada Volume

  • Cross-border share increases, volumes expand: Cross-border load volumes gained additional market share, rising from 60% of total load postings in December to 65% in January. This was driven by a 38% increase in southbound lane volumes and a 90% increase in northbound lane volumes. Intra-Canada volume share fell 5% but still experienced a 61% increase in cross-border shipments month-over-month.

Truck Crossings OB Canada

  • Canada-to-U.S. truck crossings decline amid winter weather: In what is typically a rebound month following seasonal slowdowns in December, truck crossings from Canada to the U.S. dipped 6.7% month-over-month and 6.9% year-over-year in January.

US & Canada Dry Van Truckload Spot Rates

  • Winter weather drives rate volatility: Rates across all lanes increased in January as seasonal tightness, driver time off and winter weather constrained capacity.

Canadian Spot Market – Truck Index

  • Declines in truck postings align with tighter capacity conditions: Truck postings declined in January as the spot market heated up and truck availability tightened. Loadlink reported truck postings were down 12% month-over-month and 11% year-over-year in January.

Outbound Tender Rejection Index

  • Outbound tender rejections spike: Outbound tender rejections climbed as weather conditions worsened in January. Backlogs are still being worked through but conditions are expected to normalize in the coming weeks. 

Inbound Tender Rejection Index

  • Inbound tender rejections follow a similar tightening pattern: Inbound tender rejections spiked in line with outbound rejections in January, causing upward rate pressure on an already constrained shipping lane.

Canada Prime Age Class 8 Tractor Population

  • Tractor population contraction continues: The total tractor count is down 3.0% year-over-year in February and is expected to fall another 2.8% in 2026, according to ACT Research. Ongoing declines increase market vulnerability as capacity tightens through the year.

Canadian Diesel Price per Liter

  • Canadian diesel prices rise: Canadian diesel prices soared to the highest levels since March 2025 in February.

Navigate the freight market
with confidence.

Get this free report delivered straight to your inbox every month.

Start shipping with Arrive

"*" indicates required fields

This field is hidden when viewing the form

Matt Pyatt, Chief Executive Officer

Matt Pyatt is the Chief Executive Officer of Arrive Logistics. He co-founded Arrive with President Eric Dunigan in 2014 after building his career at Command Transportation. As CEO, he is responsible for overseeing the company’s financial health, strategic vision and culture, as well as building a scalable leadership team to support Arrive’s growth.

Subscribe to receive freight market updates

"*" indicates required fields


Subscribe to receive freight market updates

Quick Apply

"*" indicates required fields

Max. file size: 50 MB.

Arrive Carrier Requirements

Please have the following info ready to complete registration

  • MC, MX, DOT, or state reg #
  • Tax ID & W9 info
  • Cert of Insurance: $100k cargo, $1M Auto, & $1M commercial general liability coverage
  • Active Common or Contract Authority (365+ days)
  • Safety Rating of at least Satisfactory (or None)

Fraud Prevention

Freight fraud continues to impact our industry. We encourage shippers and carriers to reach out to Arrive immediately if there is ever a shipment in question that may be subject to fraud (including fictitious actors and websites). Arrive will not ask you to pay upfront for any dedicated lane or committed capacity program. If the offer you are receiving sounds too good to be true or unrealistic, it may be fraud. Arrive Logistics recommends verifying all communications come from our registered email domain is @arrivelogistics.com and notes that access via VPN or Proxy is prohibited on Arrive systems. Our 24/7 phone number is 888-861-0650 and our leadership team can also be reached at feedback@arrivelogistics.com.

Use of Cookies

We use cookies to enhance your browsing experience, serve personalized ads or content, and analyze site traffic. By continuing to use this website, you acknowledge and consent to our use of cookies as detailed in our privacy policy.

Get Access to the Shipper Portal

Current Customers

Already shipping with Arrive?

Connect with your representative to get access to your ARRIVEnow Shipper Portal. Can’t connect with your rep? Use this form to reach out.

New Customers

Not shipping with Arrive yet?

If you’re not an Arrive customer, please join our network to access the portal.

Carrier Scorecard Feedback

Contact Us

"*" indicates required fields

Scott Sandager,
Chief Administrative Officer 

Scott Sandager is the Chief Administrative Officer at Arrive Logistics. He joined Arrive in 2018, bringing over 14 years of logistics and brokerage experience, with expertise in project and change management, organizational design, talent development and customer satisfaction. Scott previously held many diverse roles of increasing responsibility with AFN, a Chicago-based freight brokerage.

Eric Dunigan,
President & Co-Founder

Eric Dunigan is the President of Arrive Logistics. He began his career at Command Transportation before co-founding Arrive with Matt Pyatt in 2014. As president, he is responsible for driving revenue and growth, as well as leading the Strategic Partnerships team — a veteran group of supply chain experts who work with Arrive’s customers to reimagine their shipping strategy.

Start shipping with Arrive

"*" indicates required fields

This field is hidden when viewing the form
Arrive Logistics VP of Market Intelligence David Spencer Headshot

David Spencer,
VP of Market Intelligence

David Spencer is the Vice President of Market Intelligence at Arrive Logistics. David joined Arrive in 2017 after spending six years at AFN focused on business intelligence. His department provides critical market data and expert analysis to internal teams and publishes monthly market updates for shippers and carriers under the Arrive Insights banner.

Andrew Clarke, Board Chair,
Arrive Logistics and Global Critical Logistics

Andrew Clarke is Board Chairman for Global Critical and DCLI, Inc., and a board member for Arrive Logistics and Element Fleet Management Corp. His 20 years of global transportation and logistics experience include time as CFO of C.H. Robinson, CEO of Panther Expedited Services, Inc. and SVP and CFO roles at Forward Air Corporation.

Dean Croke,
Principal Analyst
at DAT Freight and Analytics

Dean Croke is a Market Analyst at DAT Solutions, where he focuses on freight market intelligence and data analytics. His 35 years of experience with data analytics, transportation, supply chain management, mining and insurance risk management include time as co-founder of FleetRisk Advisors and in a number of other high-level roles with FreightWaves, Spireon, Lancer Insurance, Omnitracs Analytics (formerly Qualcomm) and more.

Asanka Jayasuriya,
CTO and Partner at 8VC

Asanka Jayasuriya is the CTO at 8VC. He is an accomplished engineering and product leader with 20+ years of experience in the cloud. He has a strong background in enterprise SaaS, PLG products, infrastructure, and security. Notably, he served as CTO and SVP of Engineering at SailPoint, leading their successful transition to the cloud and successful exit event. He also held senior leadership roles at InVision, Atlassian, and Amazon, driving growth, operational excellence, and innovation. At 8VC, Asanka works with the entrepreneurs and leaders in our portfolio as a virtual CTO supporting their growth.

Chad Eichelberger,
President at Reliance Partners

Chad Eichelberger is the President of Reliance Partners. Since 2015, he’s leveraged his extensive experience in risk management, compliance, best practices and contracts to lead the company’s logistics and truck insurance strategy and operations. Chad was previously the President of Access America Transport, where he led the company from $8M to over $600M in revenue.

Barry Conlon,
CEO & Founder at Overhaul

Barry Conlon is the CEO and founder of Overhaul, the global leader in active supply chain risk management and intelligence. With a remarkable career spanning over 30 years in supply chain security, he is widely regarded as a trailblazer in modern-day supply chain security standards and best practices.

Tim Denoyer,
VP and Senior Analyst at ACT Research

As VP and Senior Analyst at ACT Research, Tim analyzes commercial vehicle demand and alternative powertrain development (i.e. electrification), and authors the ACT Freight Forecast, U.S. Rate and Volume Outlook. He previously spent fifteen years in equity research focused primarily on the transportation, machinery, and automotive industries, and co-founded leading equity research firm Wolfe Research.

Request Arrive's SOC 2 Report

Download February 2026 Freight Market Update

Download this Report

"*" indicates required fields

Add me to the monthly distribution

function custom_enqueue_script() { ?>