


The Morgan Stanley Dry Van Freight Index is another measure of relative supply; the higher the index, the tighter the market conditions. The black line with triangle markers on the chart provides a great view of what directional trends would be in line with normal seasonality based on historical data dating back to 2007.
Like other truckload supply measures, normal seasonal trends typically indicate softening throughout April before tightening begins in mid-May. This year’s data illustrated flat to decreasing tightness as the month progressed, which mirrors tender rejection and load-to-truck data and provides further evidence that capacity is abundant relative to demand. Normal seasonality would lead us to believe that conditions could begin to tighten as we approach the start of summer peak season in the coming weeks.
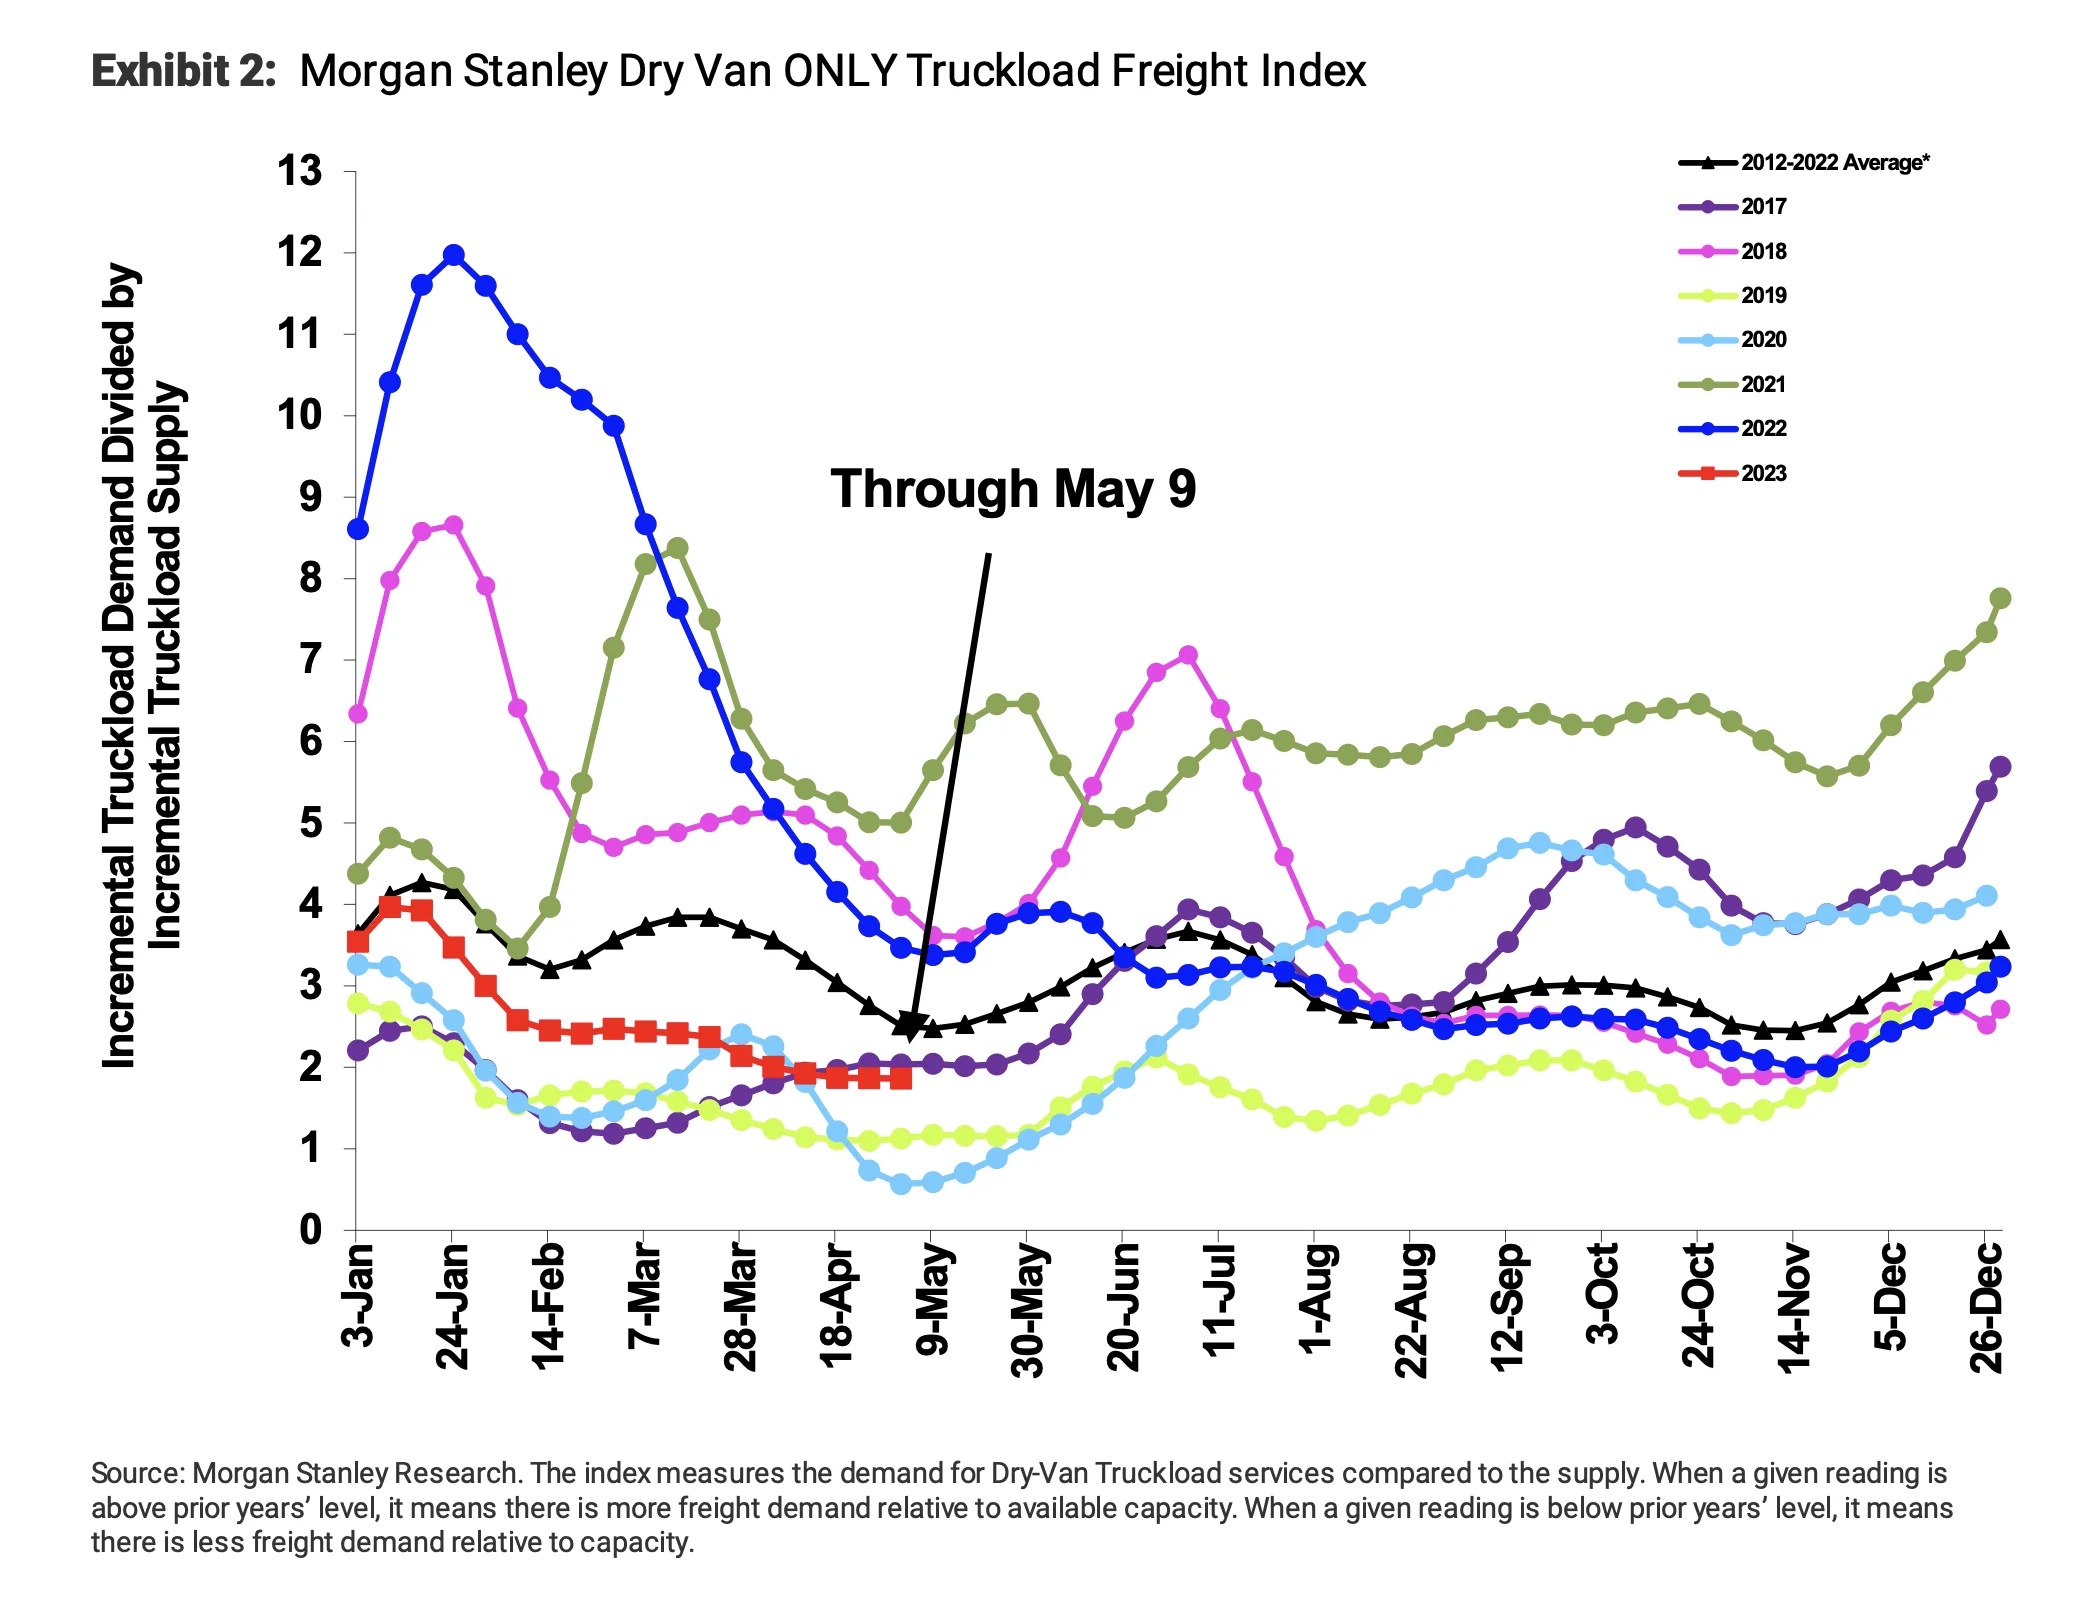 Figure 1: Morgan Stanley Dry Van Truckload Freight Index
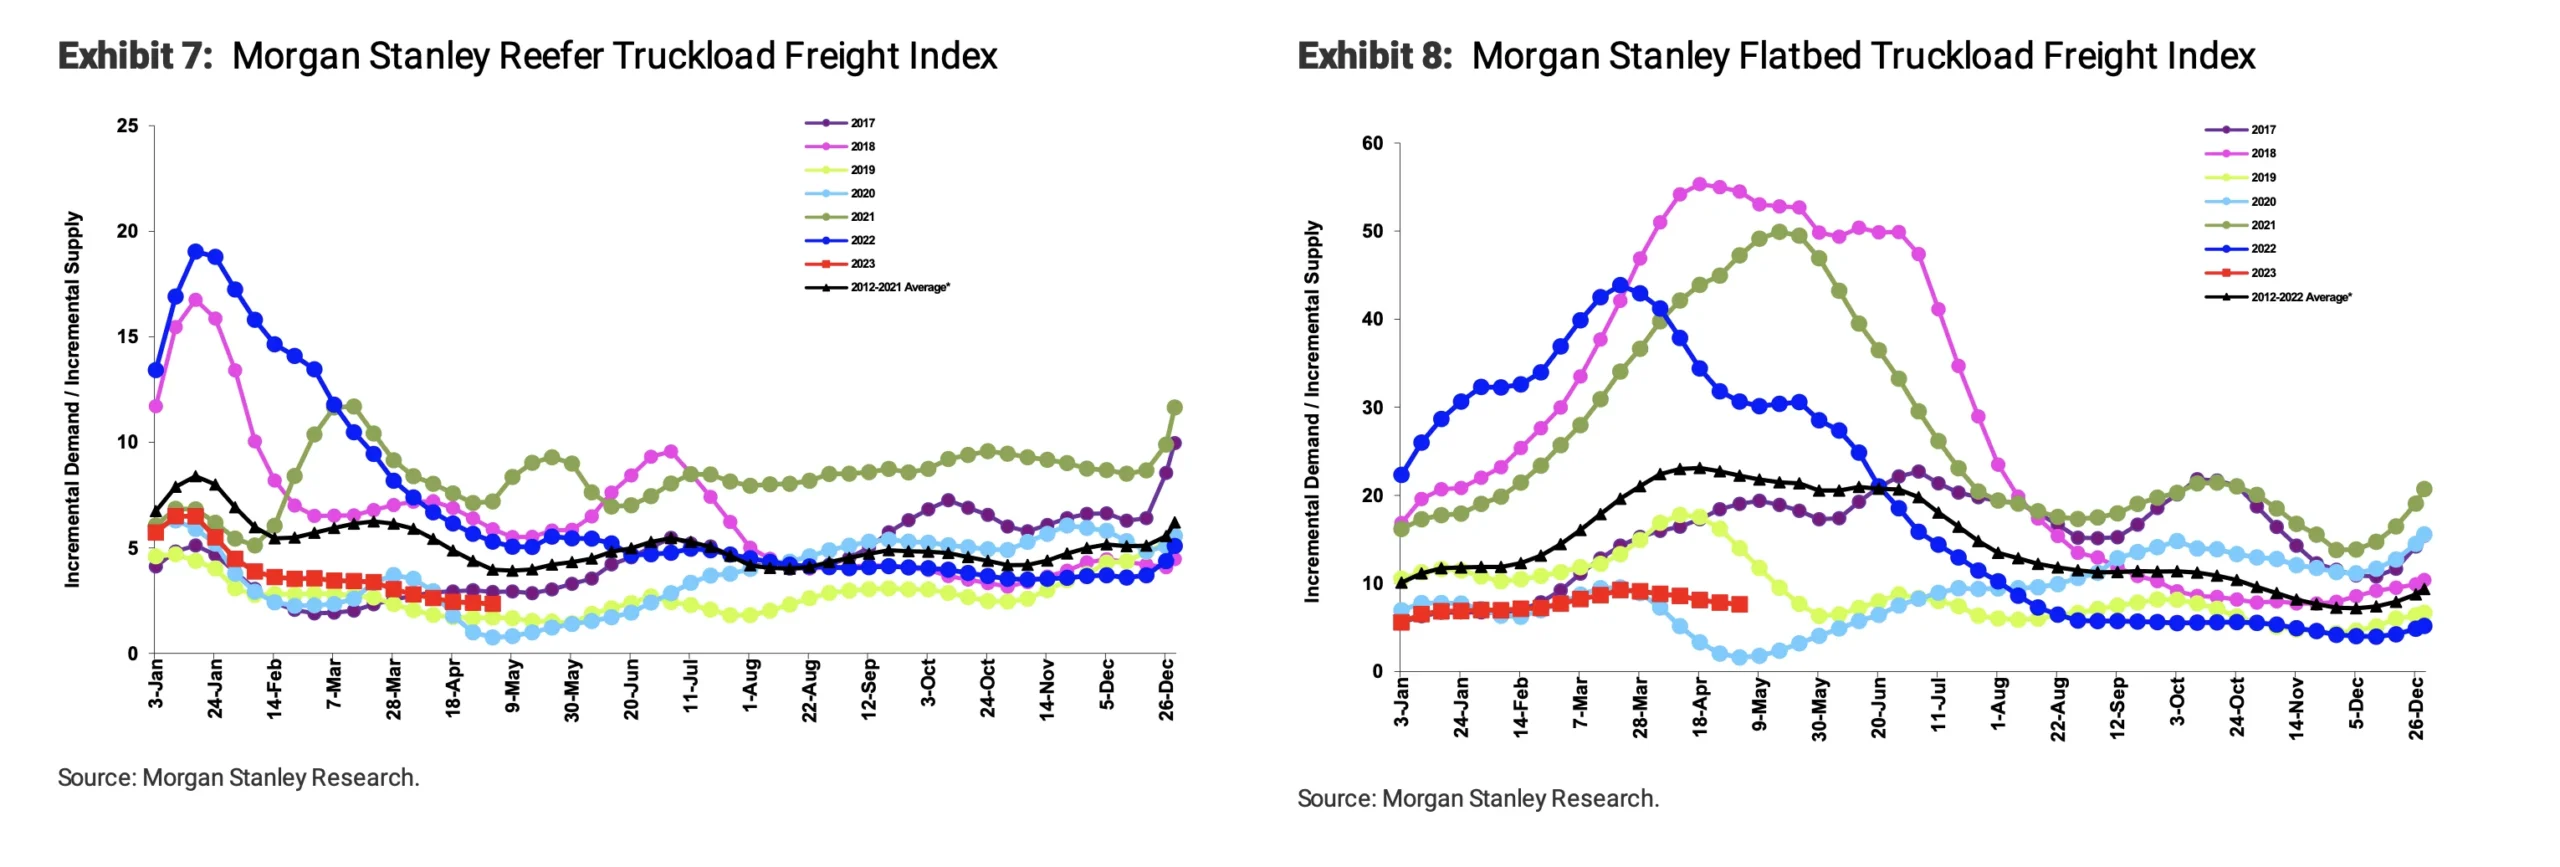 Figures 2 & 3: Morgan Stanley Reefer and Flatbed Truckload Freight Indices
ACT’s For-Hire Index of Supply and Demand represents overall market sentiment. The March index was 41.7, up from 40.1 in February, marking the 13th consecutive reading showing loosening conditions. However, there are signs that volume is beginning to exceed capacity, indicating that we may soon enter a phase of normalization.
 Figure 4: ACT For-Hire Trucking Survey
Softening demand in April exacerbated the already-oversupplied market. While certain pockets or regions could experience seasonal spot rate volatility, it is unlikely to impact tender acceptance and service for shippers, as carriers continue to show a strong interest in and ability to support current contractual freight demand.
The Sonar Outbound Tender Reject Index (OTRI) measures the rate at which carriers reject the freight they are contractually required to take. The rate remained relatively flat month-over-month, decreasing from a 3.1% high in April to a 2.53% low in May, indicating routing guide compliance on contractual freight continued to improve for shippers. Meanwhile, reefer tender rejections aligned with van rejections, easing throughout the month.
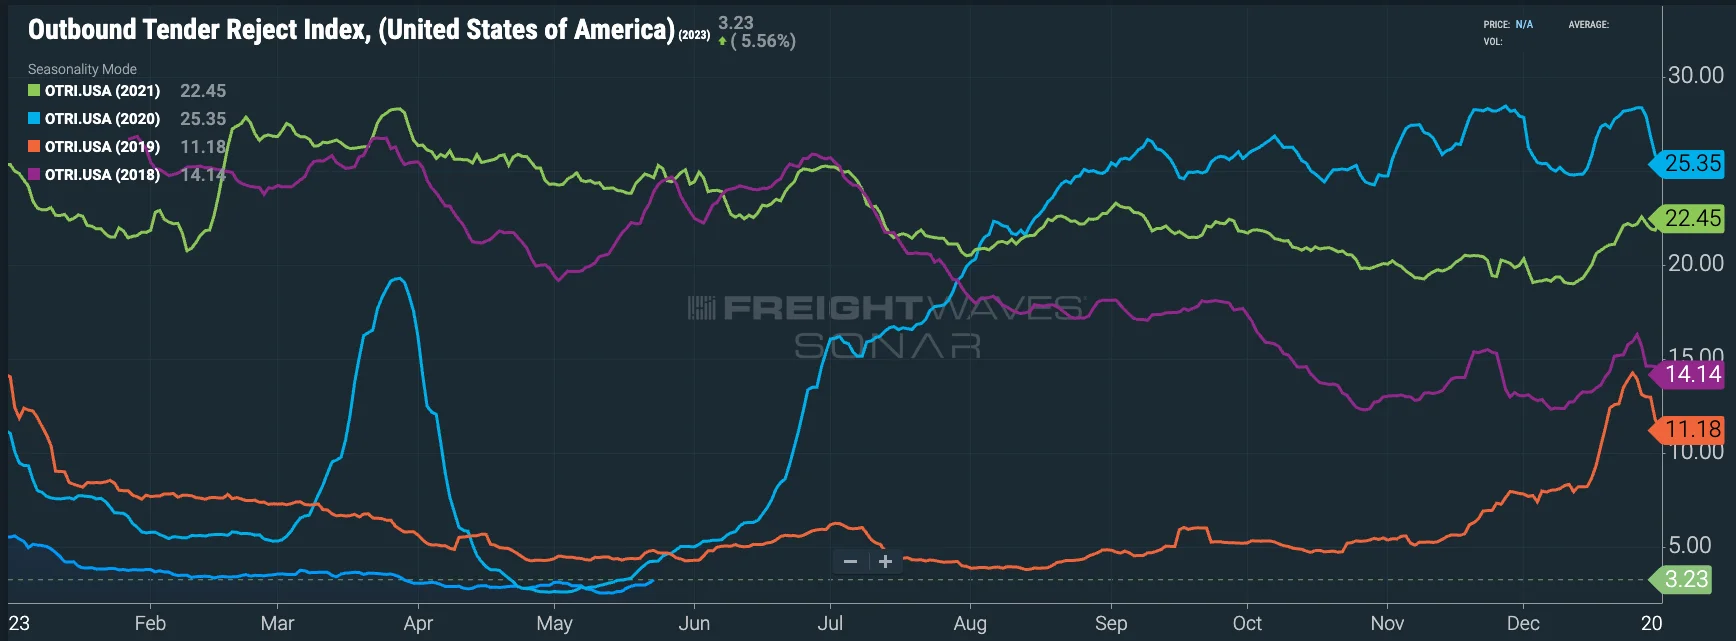 Figure 5: Outbound Tender Reject Index (SONAR)
According to Sonar’s Contract Load Accepted Volume Index (CLAV), volumes are still down year-over-year. There was a significant increase during the second half of April and into early May before the recent pullback. Trends for this index seem to be in line with what we experienced in 2019. Based on seasonality, we expect volumes to rise after Memorial Day and remain elevated through June ahead of the July 4th holiday.
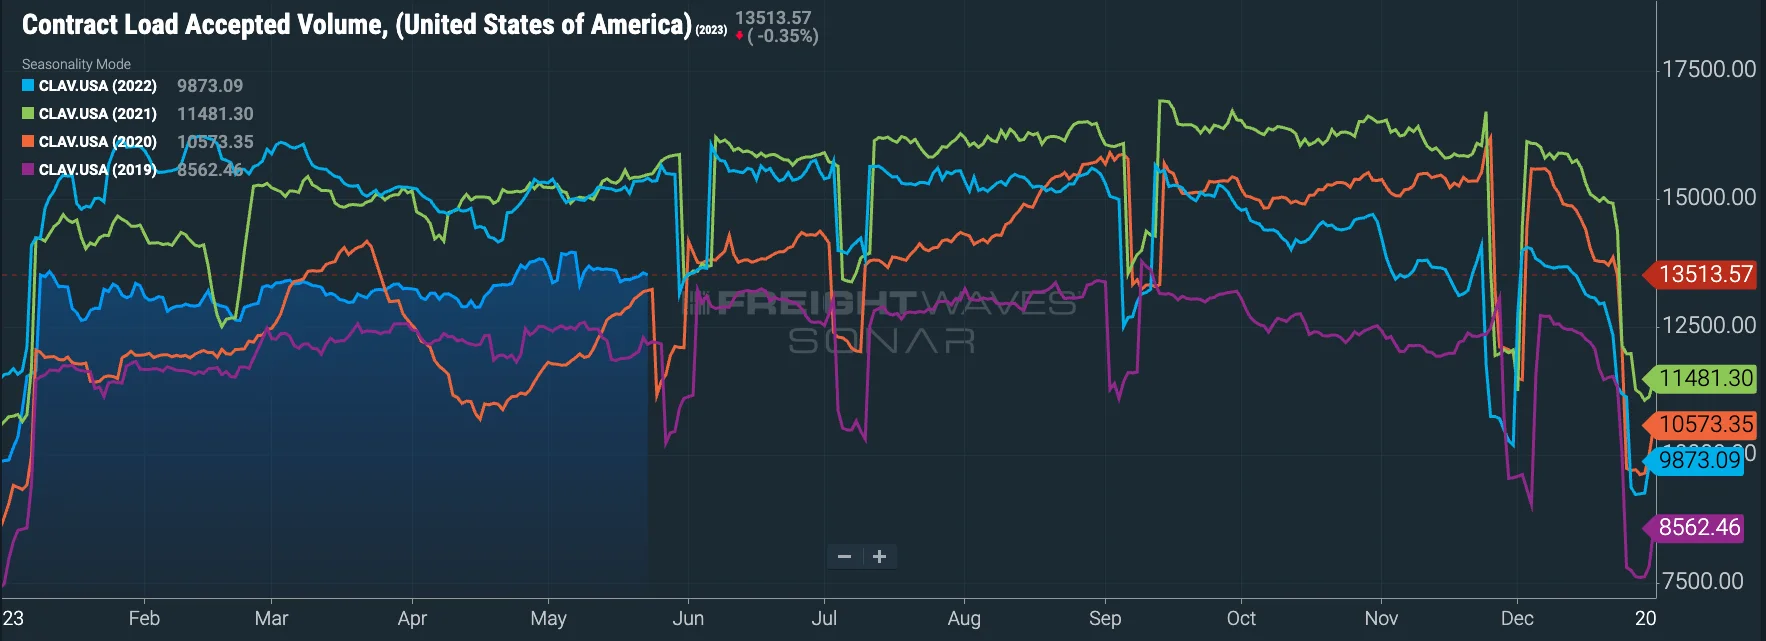 Figure 6: Contract Load Accepted Volume (SONAR)
The DAT Load-to-Truck Ratio measures the total number of loads relative to the total number of trucks posted on their spot board. April data was inconsistent with typical seasonal pressures: The Dry Van Load-to-Truck Ratio was down 7.4% month-over-month and 45% year-over-year, and the Reefer Load-to-Truck Ratio was down 11.2% month-over-month and 57% year-over-year.
 Figure 7: DAT Trendlines, National Load-To-Truck Ratio
 Figure 8: DAT Van Load-To-Truck Ratio
 Figure 9: DAT Reefer Load-To-Truck Ratio
Carrier population trends are a good indicator of where we are in the normalization process. Nearly 230,000 new carriers entered the market between June 2020 and September 2022, creating a net change of just under 130,000 for the same period. That phase was followed by five consecutive months of population decline, which hadn’t happened since the Great Recession. While March data showed a small carrier population increase, trends realigned with expectations in April, with net revocations outpacing new carriers by over 1,200.
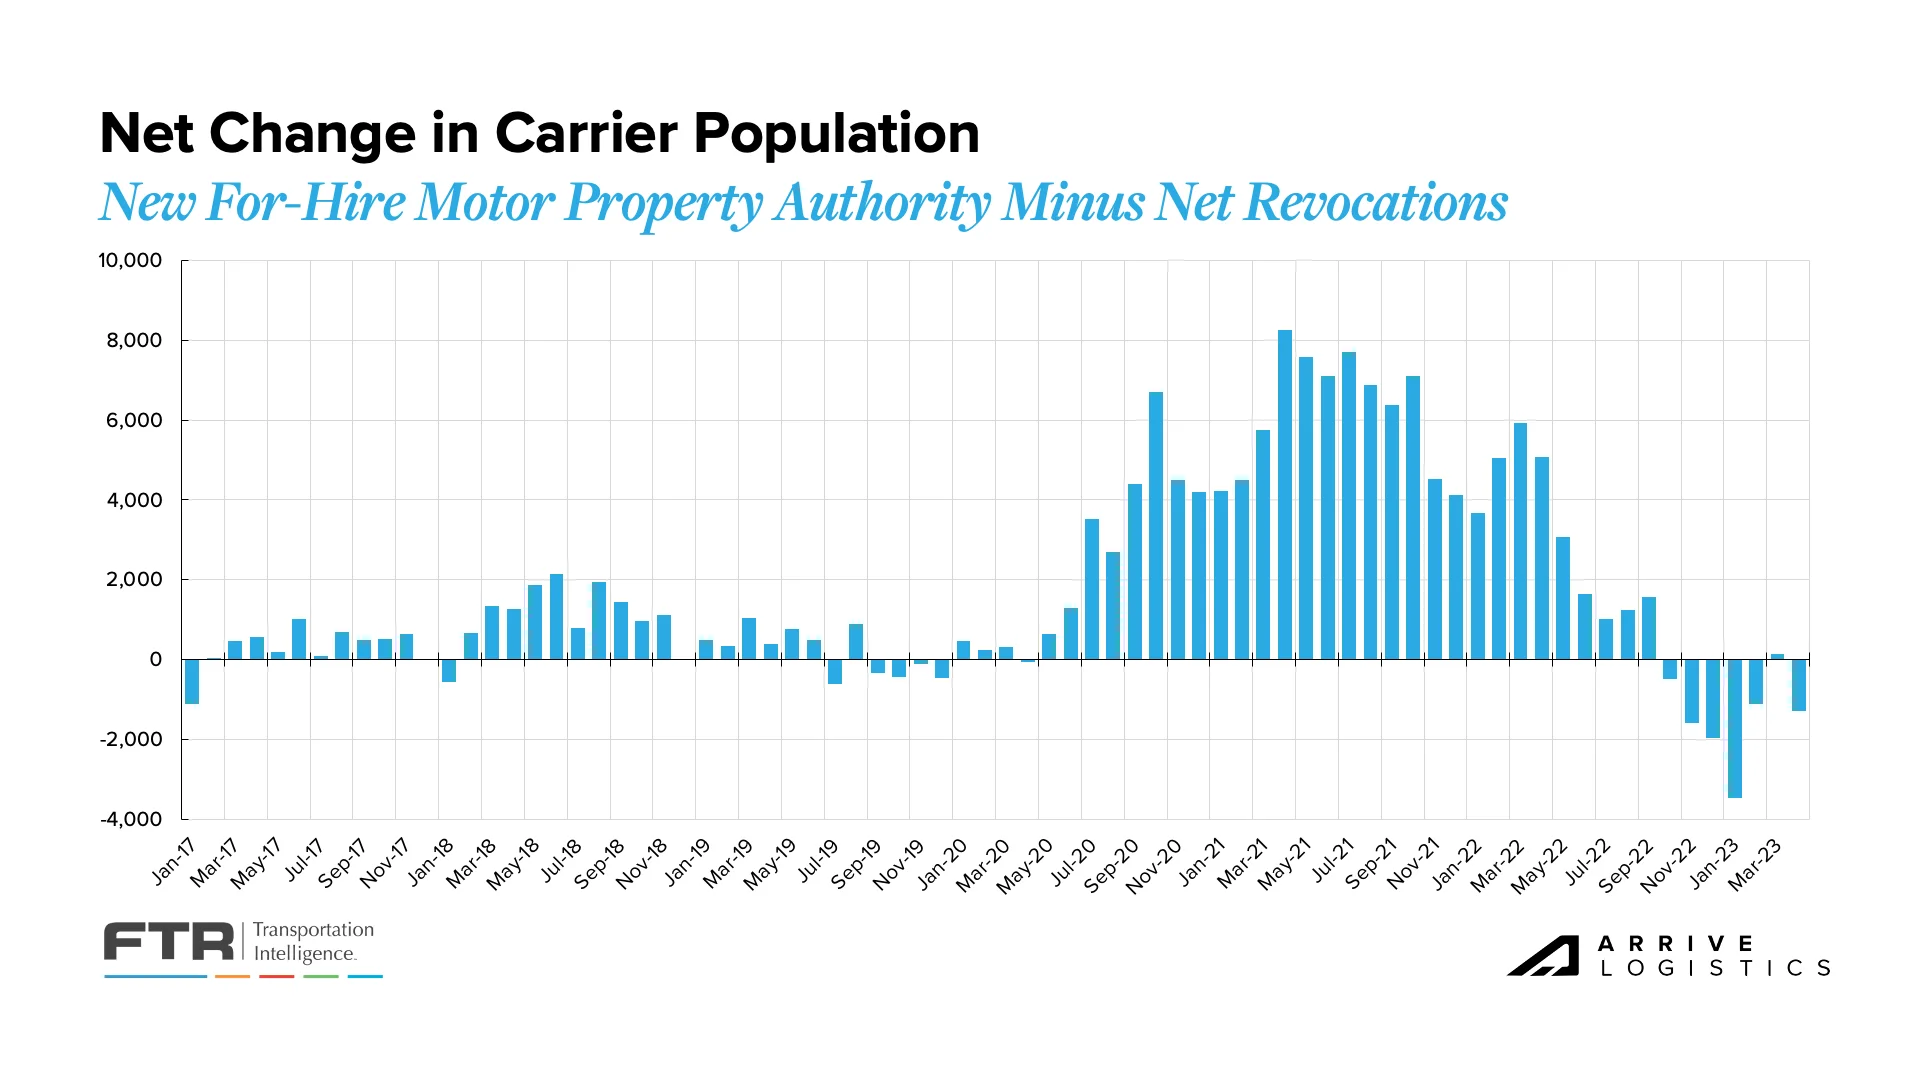 Figure 10: Net Change in Carrier Population: FTR Analysis of FMCSA Data
According to ACT Research, the most recent Class 8 Tractor Backlog reading fell by 10,500 units in March. The overall backlog dropped to 145,000 as production continued to outpace new orders. Meanwhile, the backlog-to-build ratio fell from 9.1 months in February to 7.7 months in March. April data has not yet been released, but we expect a month-over-month decline similar to what we saw in March as the daily build rate increases.
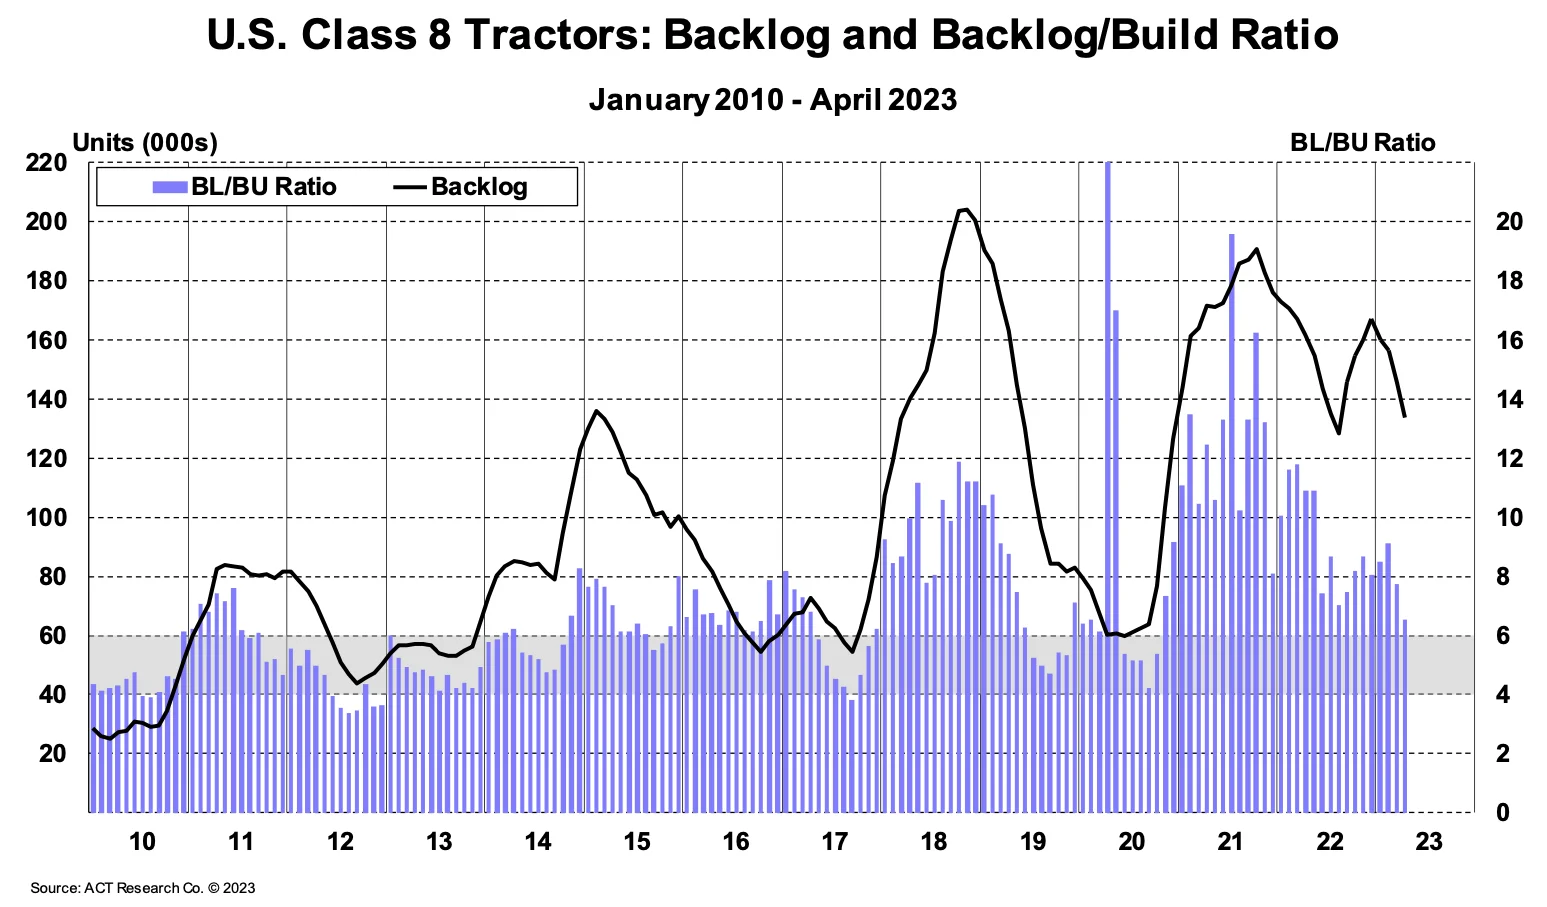 Figure 11: ACT U.S. Class 8 Tractors Backlog
According to FTR, month-over-month new Class 8 Truck orders dropped 28.7% to 12,050 in April, continuing the declines observed in six of the last seven months. Although orders are down, they remain largely above pre-pandemic levels. Despite declining orders, backlogs are expected to stay high as production slots are filled past Q3 of 2023.
 Figure 12: New Class 8 Truck Orders: DataSource: FTR
Since November 2021, the ACT For-Hire Capacity Index has recorded 17 straight months of capacity expansion. Month-over-month, capacity grew by 0.6 points to 53.6 in March, supported by improving supply chains and increasing completion of new truck orders. However, it is important to remember that this data consists primarily of larger fleets and may not accurately reflect what’s happening with small and mid-size carriers.
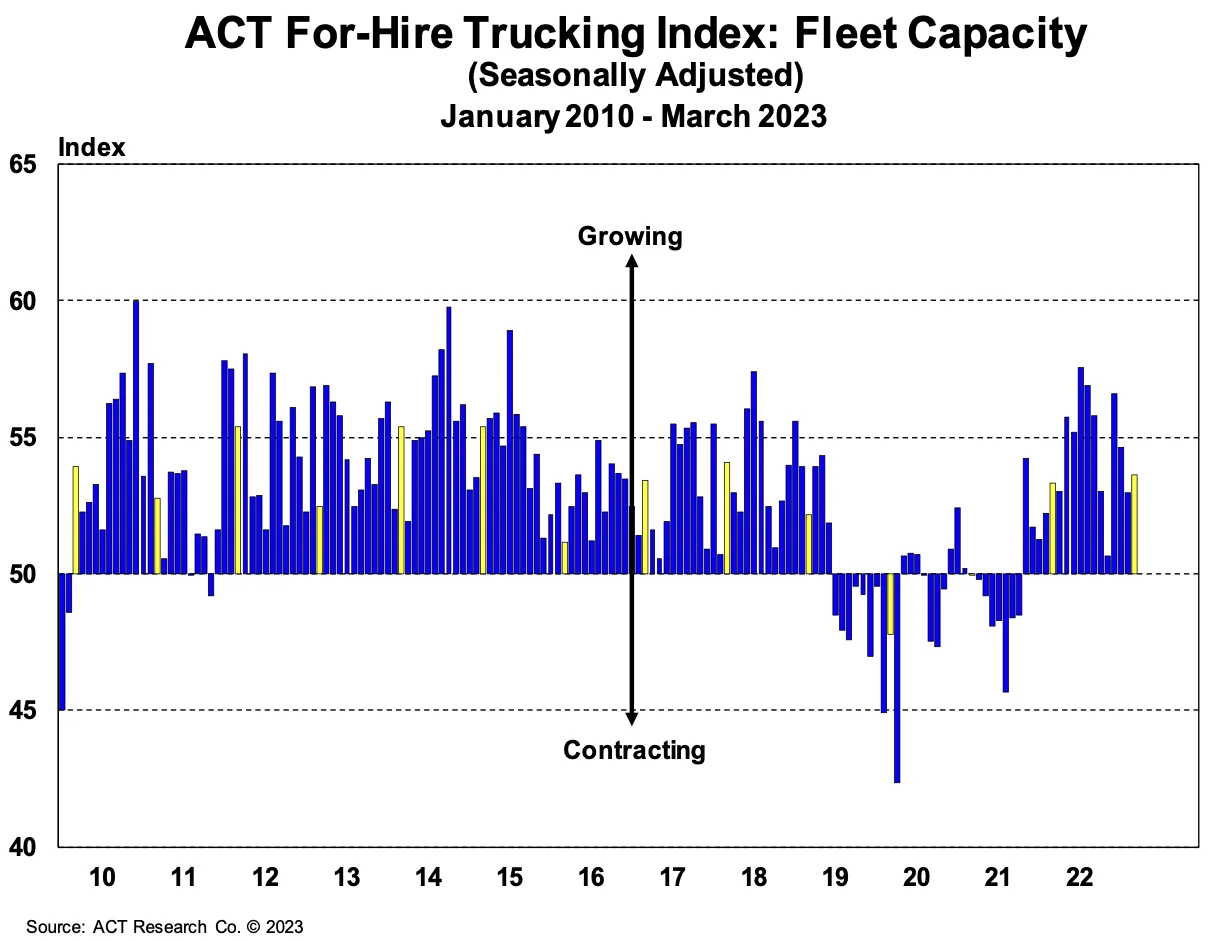 Figure 13: ACT For-Hire Trucking Index: Fleet Capacity
Trucking sector job growth continues to defy expectations amid the declining rate environment. This upward trend is likely driven by owner-operators finally taking company jobs and the need to support increasing demand in areas like non-single-family housing construction and oil and gas drilling.
 Figure 14: FTR’s Monthly Change in Trucking Jobs
Though it may not be reflected in the national market, we expect certain regions and specific equipment types to experience increased volatility as the summer peak season begins. Capacity constraints and increased rate pressure could impact lanes that have otherwise been easy to cover, and seasonal volatility between mid-May and Independence Day will be variable based on lane and equipment type.
At the national level, however, weak demand will continue driving the oversupply of market capacity, resulting in further normalization. Carriers in the spot market are still facing challenging conditions, and revocations of trucking authority remain historically high despite a slight pullback from March to April. Some revocations may be owner-operators taking company jobs with larger asset carriers, while others are carriers exiting the market altogether.
 Figure 14: Net Revocations: FTR Analysis of FMCSA Data
ACT’s Driver Availability Index dropped by four points to 60.7 in March, marking the tenth consecutive reading above 50 — that’s the longest streak in the index’s five-year history and the highest reading ever recorded. However, smaller fleets could be experiencing different trends as owner-operators opt to join larger asset carriers.
We continue to report on retail and manufacturing trends due to their significant impact on domestic freight demand. Recent data indicated a concerning outlook for both sectors. Manufacturing contracted for the sixth consecutive month, while imports declined substantially from the record-setting levels observed a year ago.
The National Retail Federation (NRF) is beginning to change its stance on the retail imports outlook. According to the latest update from its Global Port Tracker, imports are expected to remain below recent levels until inflation rates and inventory surpluses are reduced. Further, the revised forecast now predicts greater import volume declines in the first half of the year compared to a month ago. However, the NRF also acknowledged that recent positive developments in West Coast port labor negotiations are encouraging.
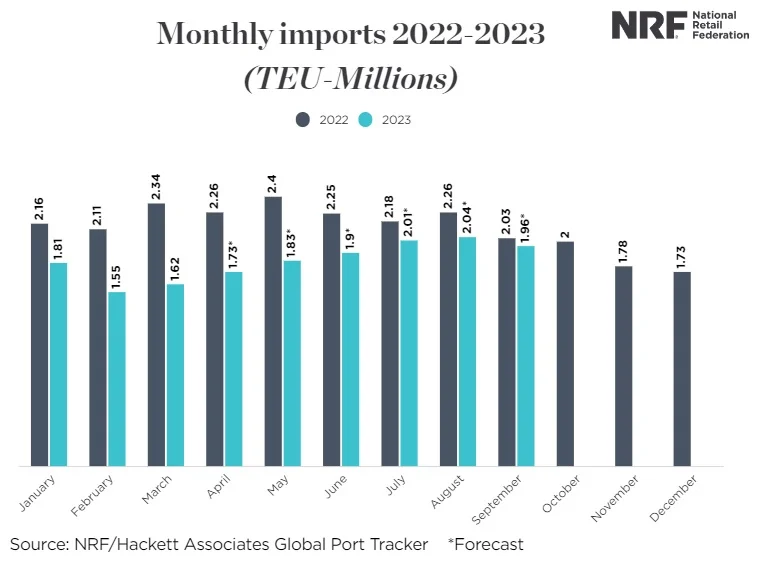 Figure 16: NRF Monthly Imports
The contract versus spot market story stayed mostly consistent in April. Shippers still heavily favored contractual freight, and spot posts contracted by over 20% month-over-month. Rather stagnant volumes coupled with plentiful capacity indicate spot postings will likely stay well below 2022 levels for the near future.
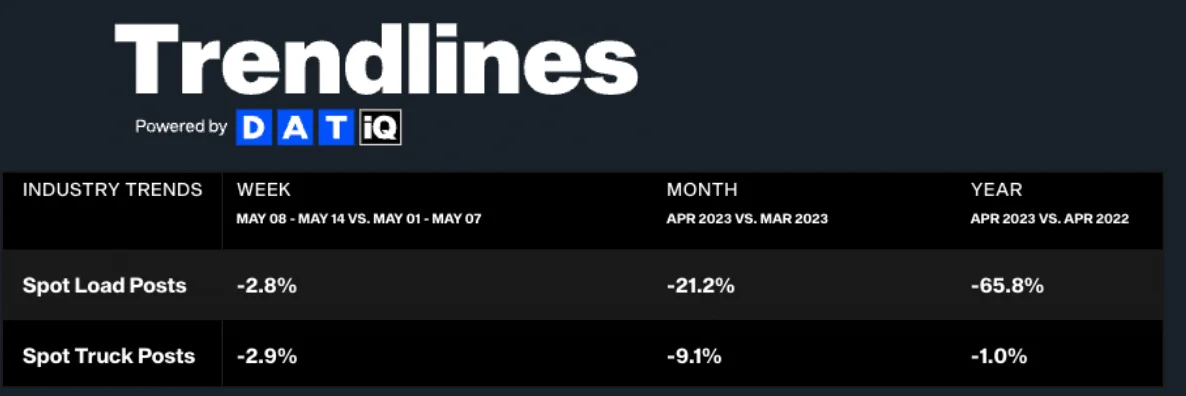 Figure 17: DAT Trendlines
Spot rates continue to fall, now sitting 17% below TL operating costs in early Q2 — this is down from Q1 when the operating loss was 15%. The trend will likely affect owner-operators and carriers with high spot exposure, potentially leading some to close or join larger fleets. As capacity leaves the market, we tend to see a sudden rise in spot rates; however, capacity remains high despite the trend, indicating that conditions could remain loose in the near term.
 Figure 18: ACT Illustrative Spot Operating Margin
Looking at the full scope of business for public carriers, 2022 margins remained strong but experienced notable declines from the previous years. As rates continue to fall in 2023, the gap between revenue and cost per mile will continue to shrink, meaning margins for these large carriers could also drop. However, fuel prices continue to fall, which ultimately decreases costs and could help strengthen margins for all carriers.
 Figure 19: ACT Revenue/Mile vs. Cost/Mile (Publicly Traded Carriers)
Early April linehaul data shows van and reefer spot rates trending downward while flatbed spot rates are rising. Reefer contract rates are the only equipment type seeing increases so far month to date, as both van and flatbed contract rates show relatively flat growth on a month-over-month basis.
The spot-contract van rate spread decreased by 1 cent from April to May. Despite the slight decrease, downward pressure on contract rates should continue for the foreseeable future, even if the market experiences some seasonal pressures in the back half of the second quarter.
All-in dry van spot rates are down 24.5% year-over-year, while linehaul spot rates are down 19.8%. All-in dry van contract rates are down 19.8% year-over-year, and linehaul contract rates are down 14.8%. Spot linehaul rates are down by just 1-cent from April to May so far, indicating that we may have reached the bottom. Contract linehaul rates are down 2-cents from April, continuing its steady decline.
 Figure 20: DAT Dry Van National Average RPM Spot vs. Contract
 Figure 21: Truckstop Weekly National Average Spot Rates
Reefer spot linehaul rates are beginning to deviate from the van rate pattern early in the month, while contract rates show a sizable decline from April. If this holds, it will result in a meaningful decline in the reefer spot-to-contract rate spread, which moved from $0.58 in April to $0.52 per mile in May. The most likely scenario as the month continues is increasing reefer spot rates as the produce season ramps up.
Down 12.3% year-over-year, the current reefer contract rate is $2.43 per mile, excluding fuel, while the current reefer spot rate is down nearly 16.2% year-over-year to $1.91 per mile, excluding fuel. Though the year-over-year trend is significant, we have likely passed peak year-over-year deflationary pressures.
 Figure 22: DAT Temp Control National Average RPM Spot vs. Contract
Spot flatbed rates increased by $0.01 in early May, excluding fuel, while contract rates appear to have returned to February levels. Spot rates landed at $2.11 and contract at $2.74, excluding fuel.
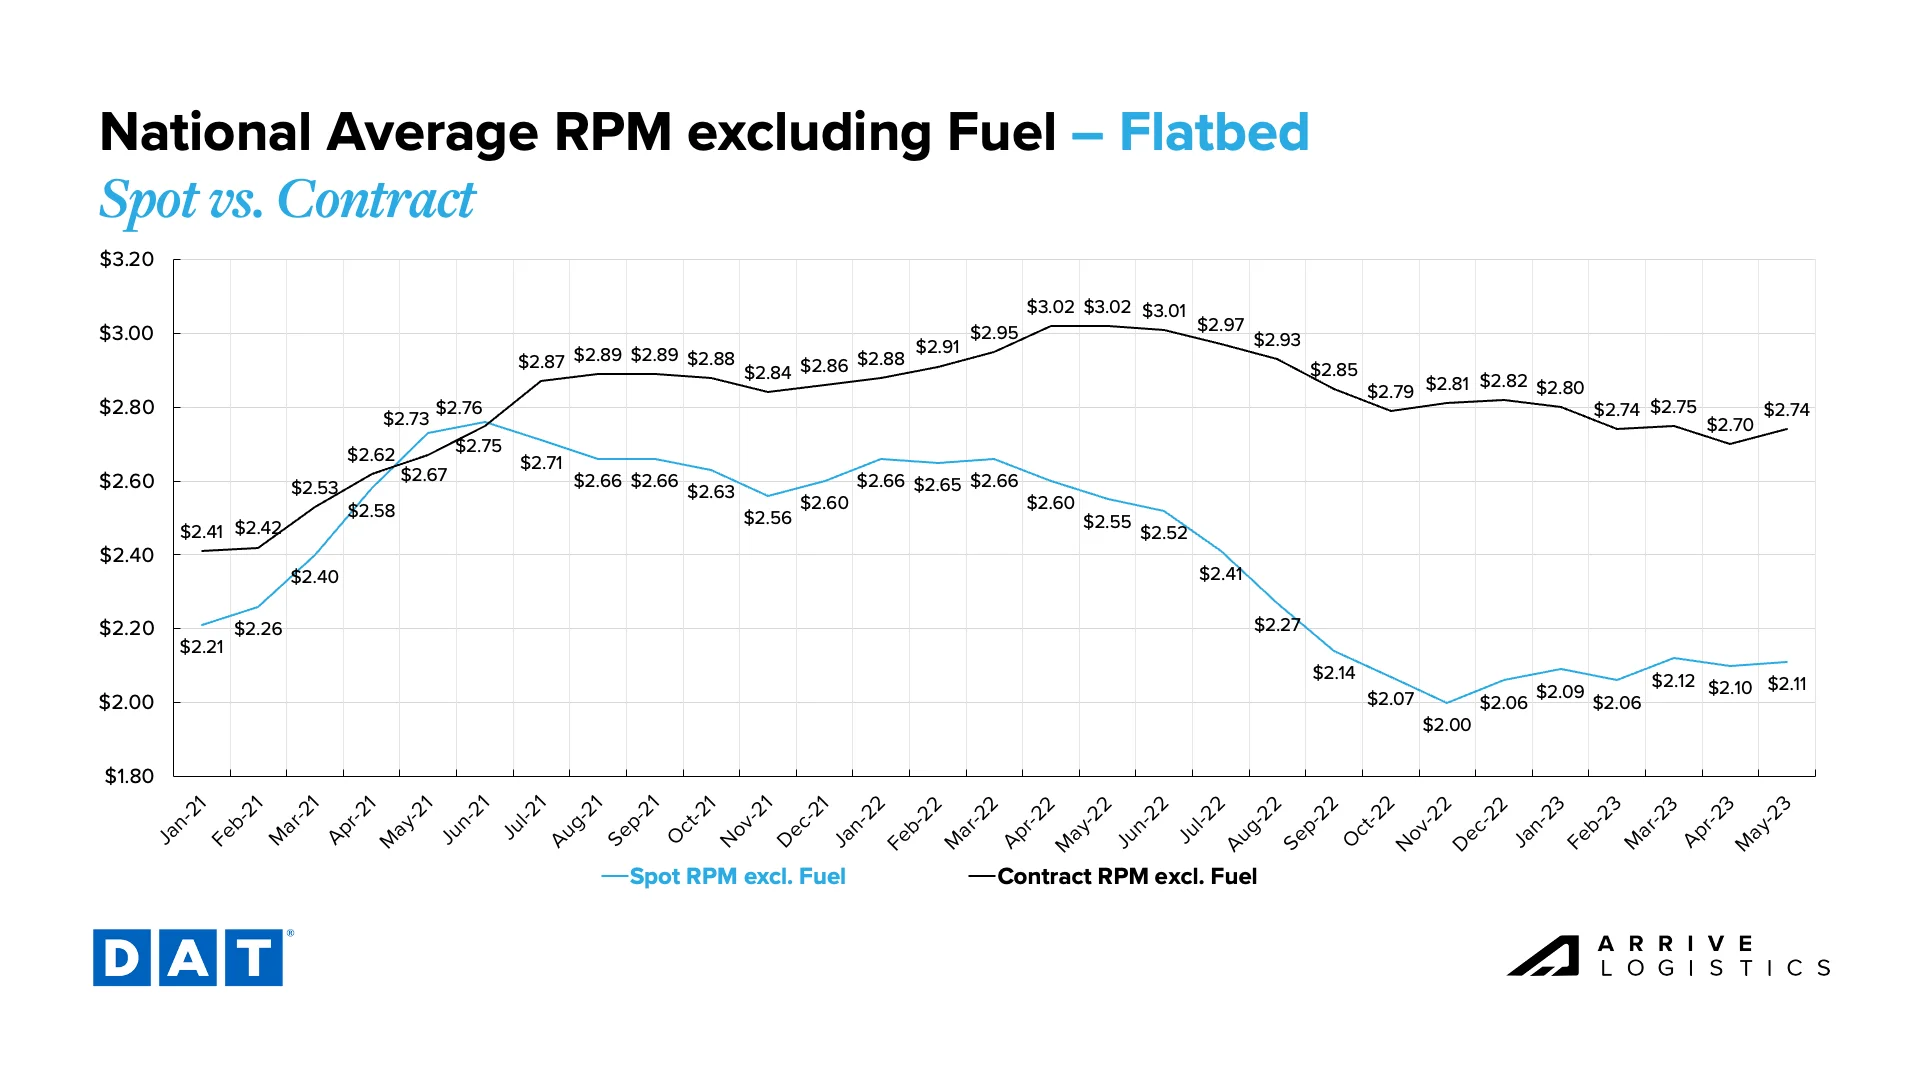 Figure 23: DAT Flatbed National Average RPM Spot vs. Contract
It is important to be aware of rate movement as market conditions shift heading into the 100 days of summer. According to DAT data, the largest week-over-week van rate increase observed was for loads out of Flagstaff, AZ, with the average rate per mile jumping by 53 cents to $2.03. West Virginia also had two markets in the top five, with Huntington and Charleston experiencing rate increases. This data only includes linehaul rates for lanes greater than 500 miles, thus ignoring short-haul volatility.
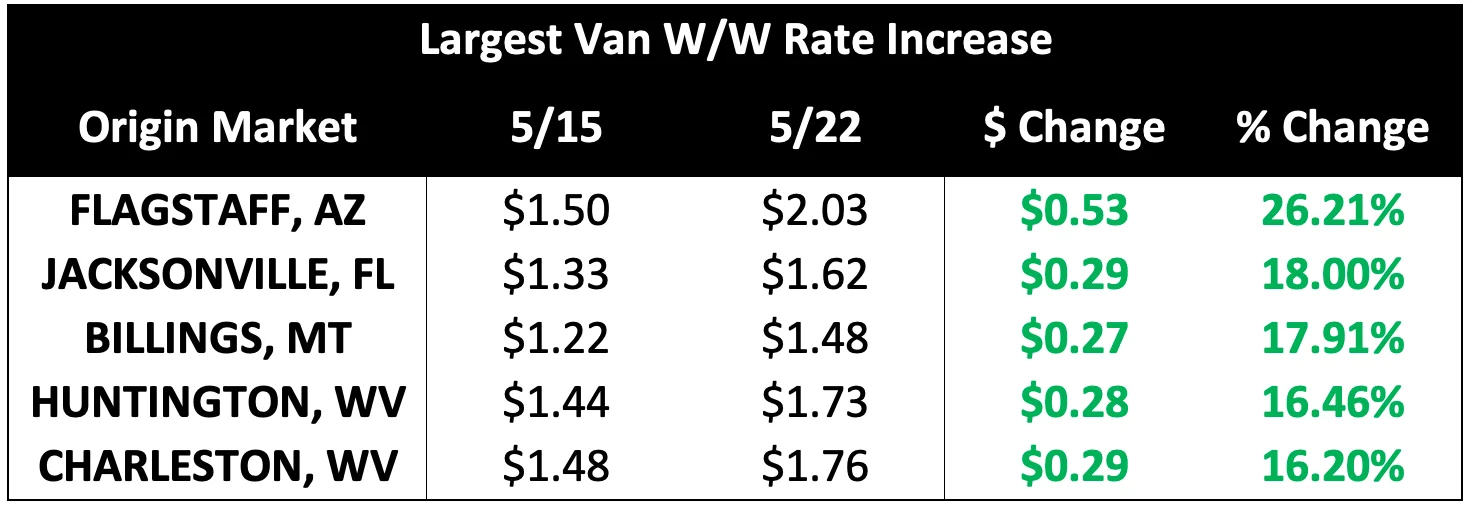 Figure 24: Largest Van W/W Rate Increases
Looking at the largest week-over-week declines for dry van, the load rate out of Missoula, Montana, dropped by over 15% to $1.03 per mile. Rates out of Saginaw, Michigan, experienced a 10-cent decrease but remained above the national average.
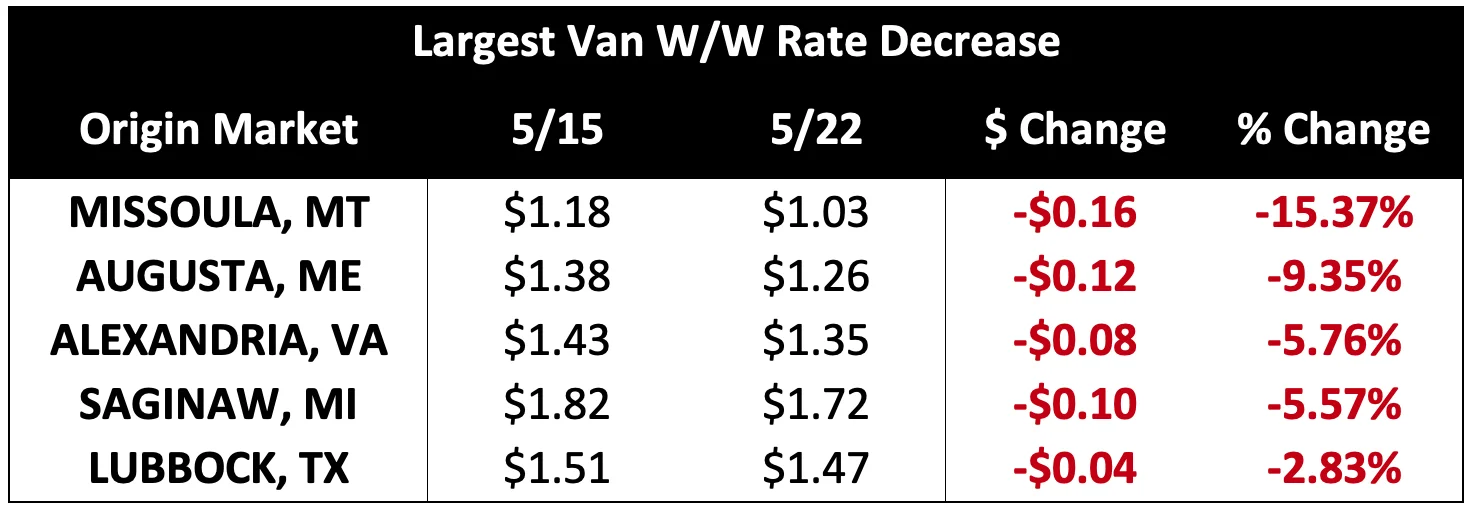 Figure 25: Largest Van W/W Rate Decreases
The largest week-over-week rate movers affirmed that reefer rates tend to be more volatile than dry van rates. At $.62 per mile, loads out of Hutchinson, Kansas, experienced the largest rate increase. The top five rate movers all saw increases of over 20%.
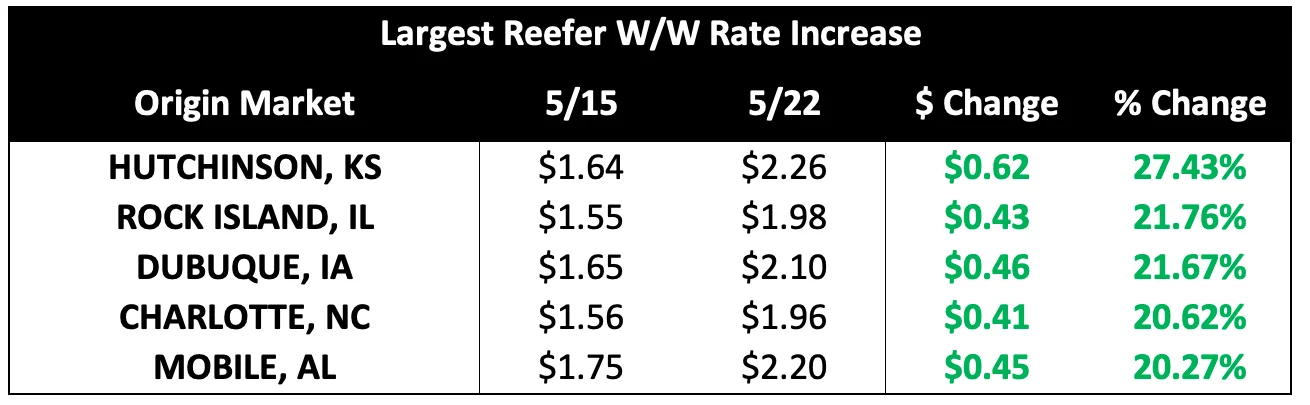 Figure 26: Largest Reefer W/W Rate Increases
The largest week-over-week reefer rate decrease occurred in Norfolk, Virginia, where rates dropped by nearly 35% to $1.41/mile. Rates out of Alexandria, Virginia and Greenville, South Carolina, also experienced significant decreases, indicating that East Coast conditions may be loosening again.
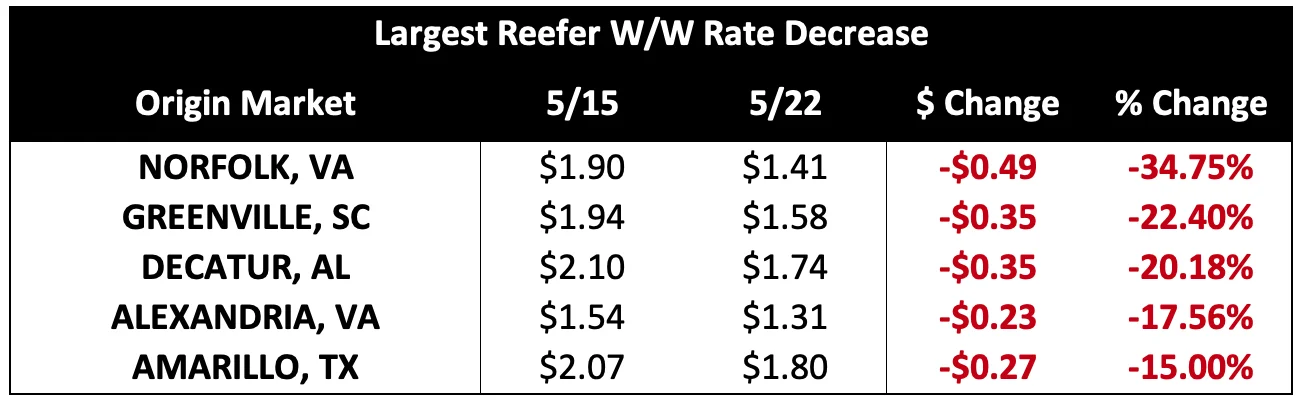 Figure 27: Largest Reefer W/W Rate Decreases
May CPI data showed slowing inflation for the tenth consecutive month in April, falling to 4.9% year-over-year growth (5.5% excluding food and energy). Rising shelter costs remained a key driver, accounting for about a third of the index. This month, the shelter index increased 8.1% year-over-year, accounting for >60% of the total core inflation increase.
Overall, inflation has declined meaningfully in some areas while continuing to rise in others. A few notable increases include rent and automotive-related costs such as used vehicle prices, gas, and insurance. With the Fed still intent on driving down inflation to the 2% range, continued action is likely with the next opportunity to raise rates. Speculators indicate another rate hike of 25 basis points is the most probable scenario.
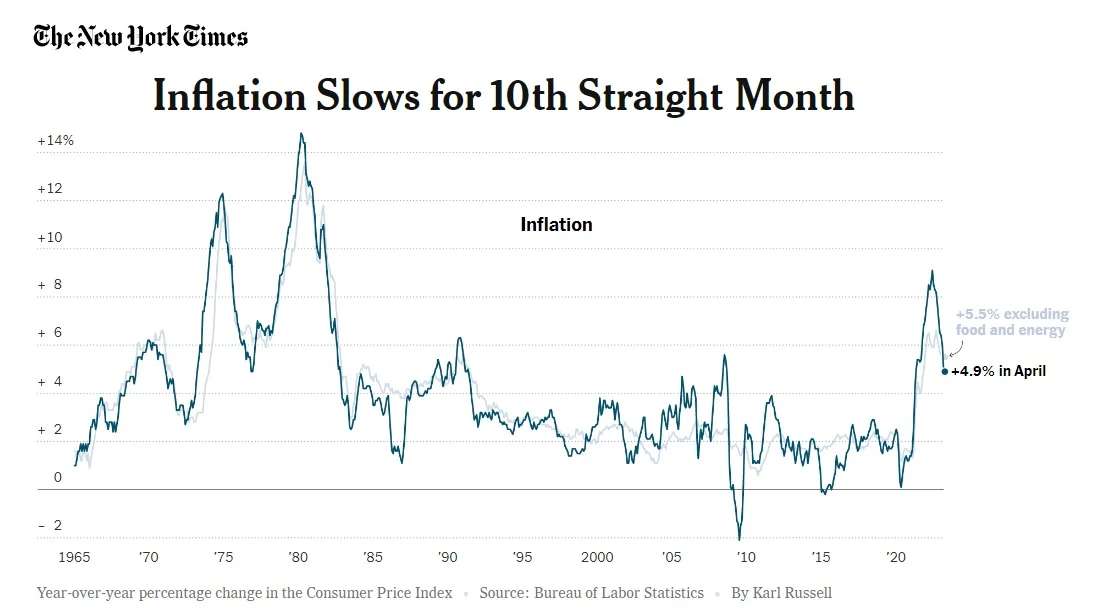 Figure 28: New York Times Inflation Data
Fuel prices are still falling and are now down 30.3% year-over-year. The national diesel average has declined for 15 of the last 16 weeks and currently sits at $3.88/mile. As global crude prices drop further, fuel will likely follow in the near term.
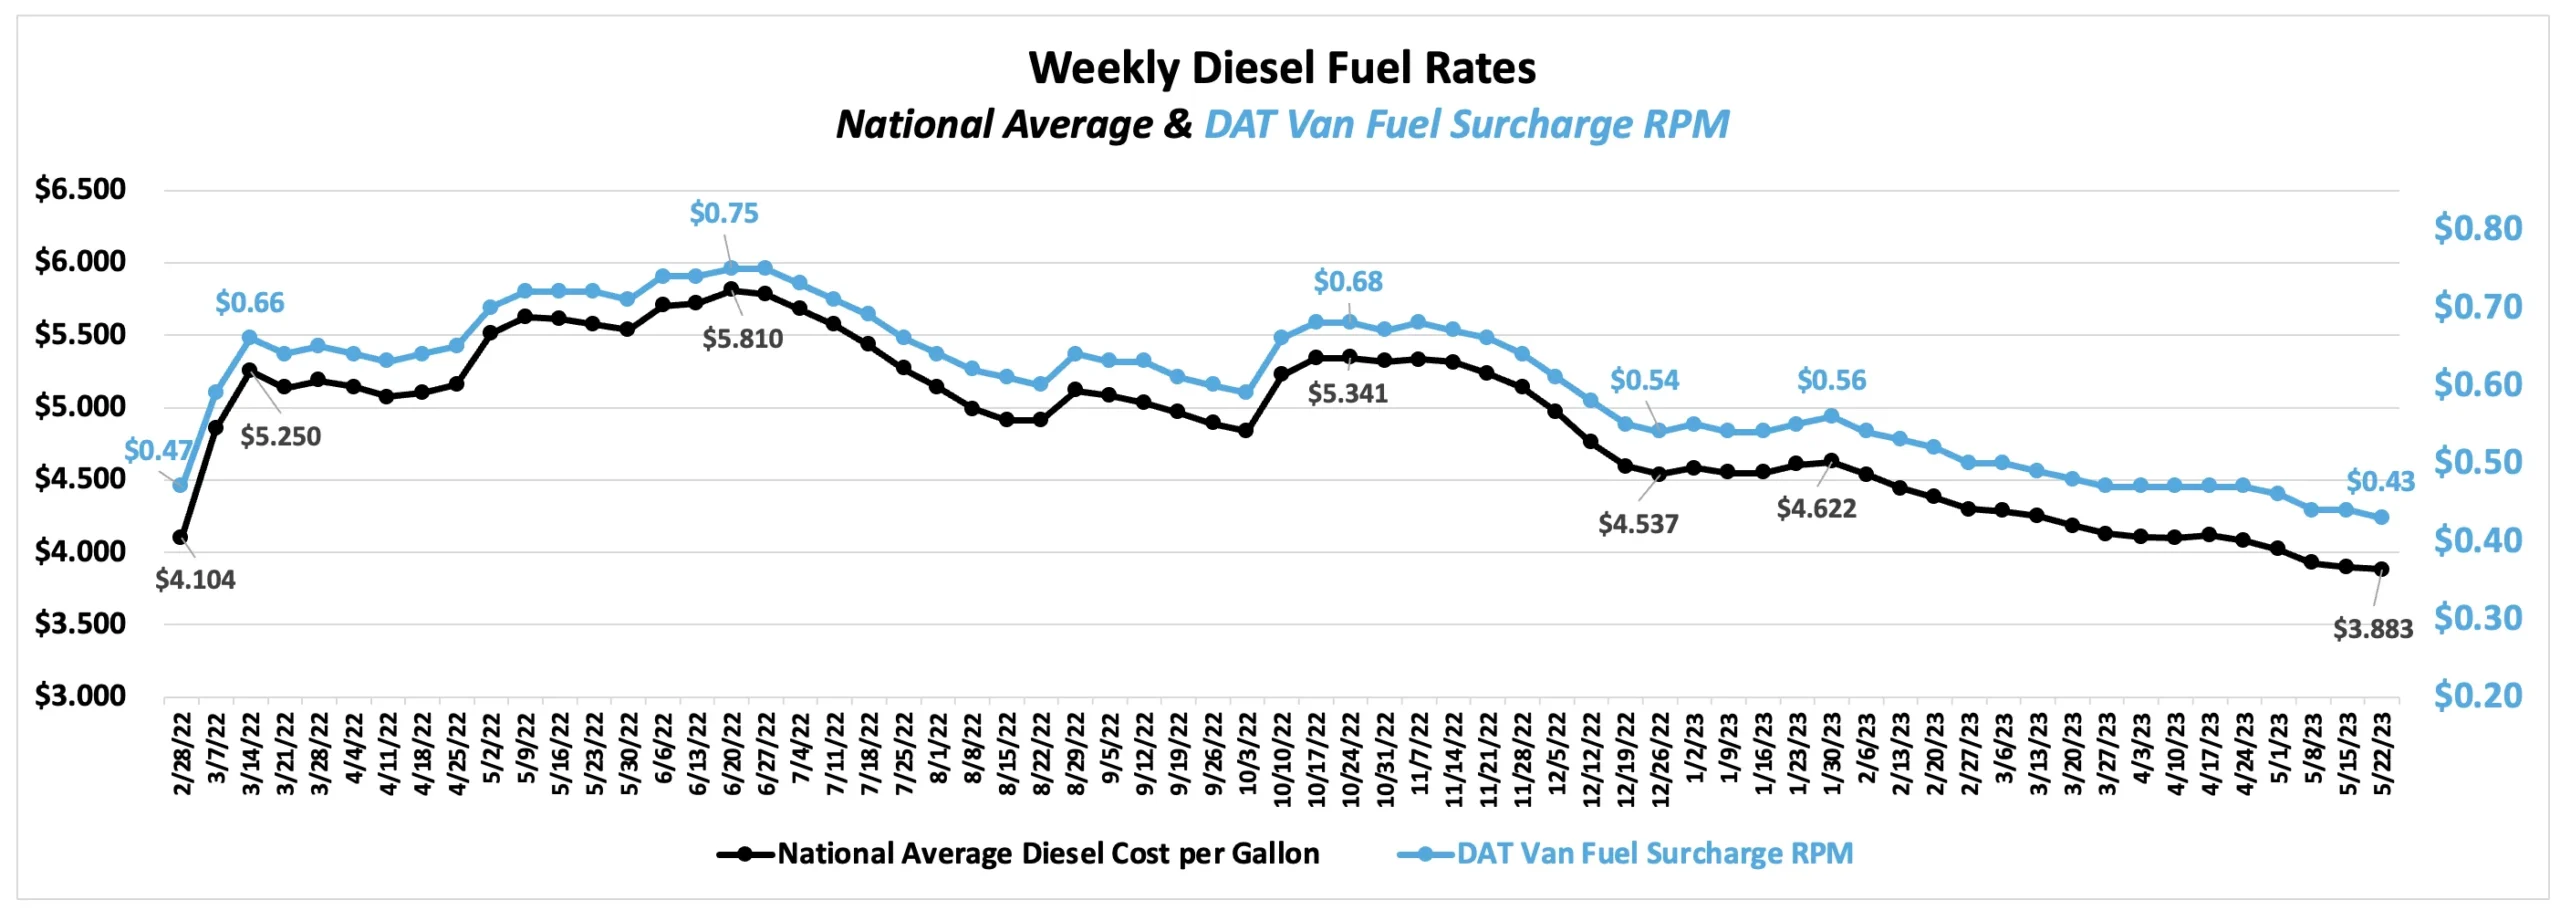 Figure 29: National Average Diesel Rates & DAT Fuel Surcharge RPM
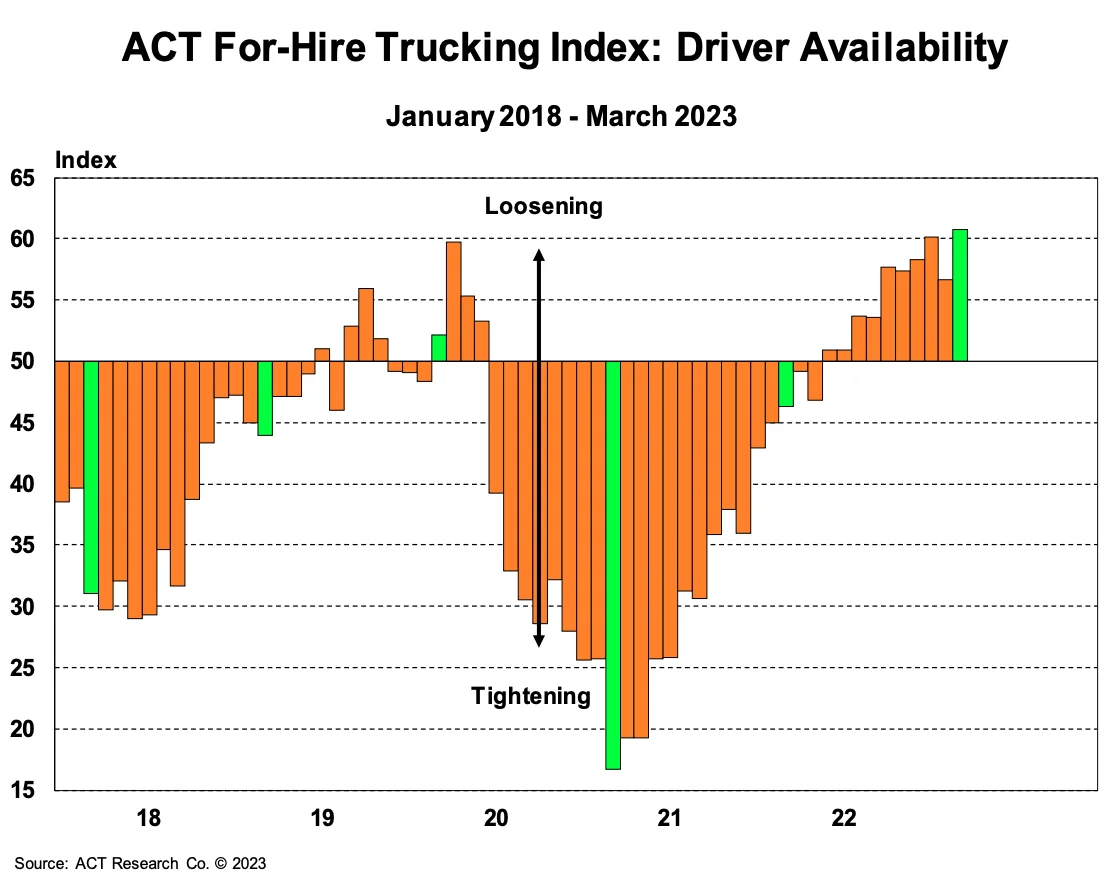 Figure 15: