


The Morgan Stanley Dry Van Freight Index is another measure of relative supply; the higher the index, the tighter the market conditions. The black line with triangle markers on the chart provides a great view of what directional trends would be in line with normal seasonality based on historical data dating back to 2007.
Market conditions remained relatively flat in March. The slight uptick in the Morgan Stanley reading differed from the 10-year trend, which typically shows softening conditions during this time of year. Conditions will likely remain relatively flat ahead of the 100 Days of Summer and start to tighten as produce and other in-demand summer products hit the roads.
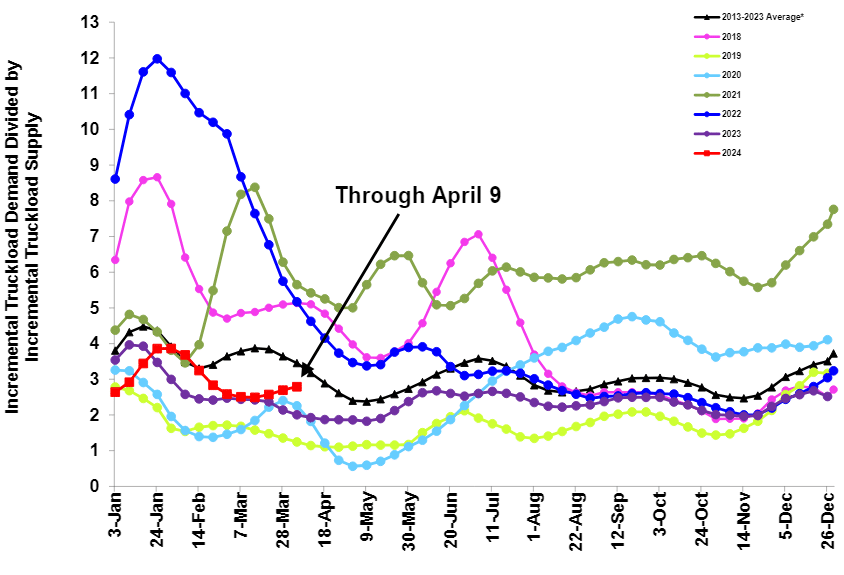 Figure 1: Morgan Stanley Dry Van Truckload Freight Index
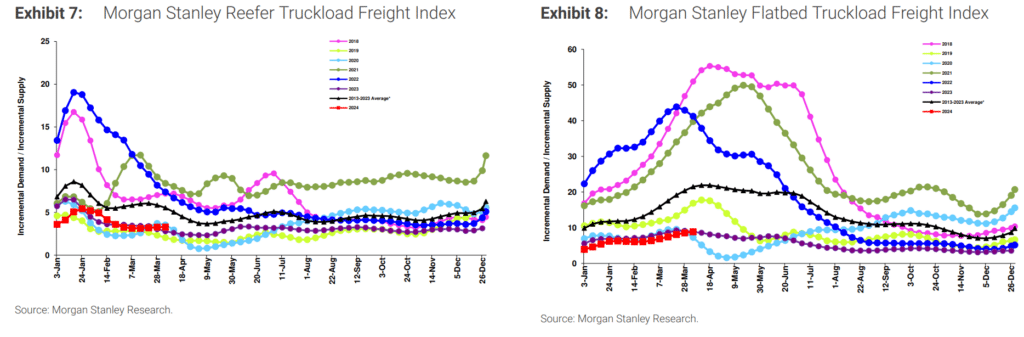 Figures 2 & 3: Morgan Stanley Reefer and Flatbed Truckload Freight Indices
The most recent (February) ACT Supply-Demand Index reading was 53.5, up from 50.2 in January. February’s reading marks seven straight months of tightening conditions, driven primarily by capacity declines and slight volume increases. The streak indicates the market is trending toward equilibrium as the capacity correction continues.
 Figure 4: ACT For-Hire Trucking Survey
Soft demand amid a surplus of capacity continues to elongate the downcycle. The Sonar Outbound Tender Reject Index (OTRI), which measures the rate at which carriers reject freight they are contractually required to take, has hovered around 5% since early March. While rejection levels today are slightly higher than during this time last year, they are still significantly lower than in 2021 and 2022 and will likely remain stable as the 100 Days of Summer approaches. Van tender rejections have been below 4% for the past few months and remain slightly higher than in early April. Reefer tender rejections are also flat, hanging just above 4%.
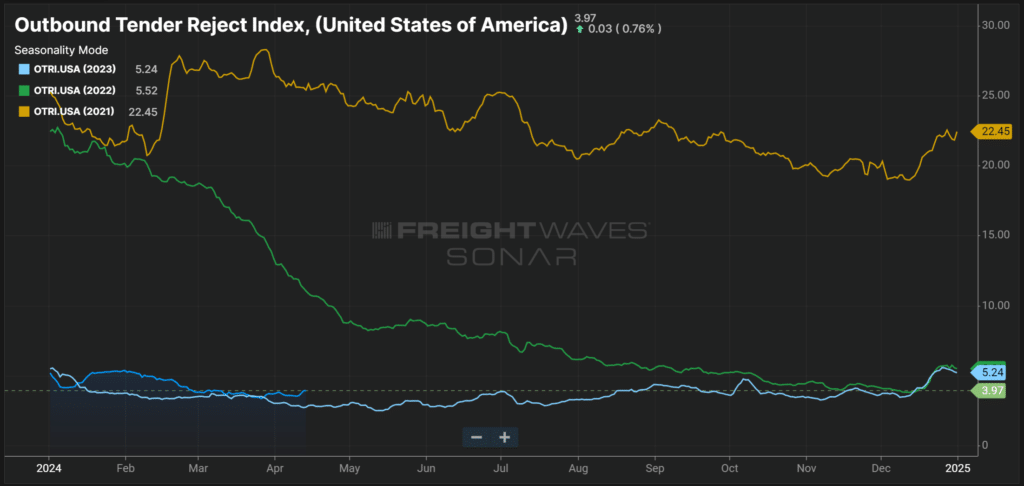 Figure 5: Outbound Tender Reject Index (SONAR)
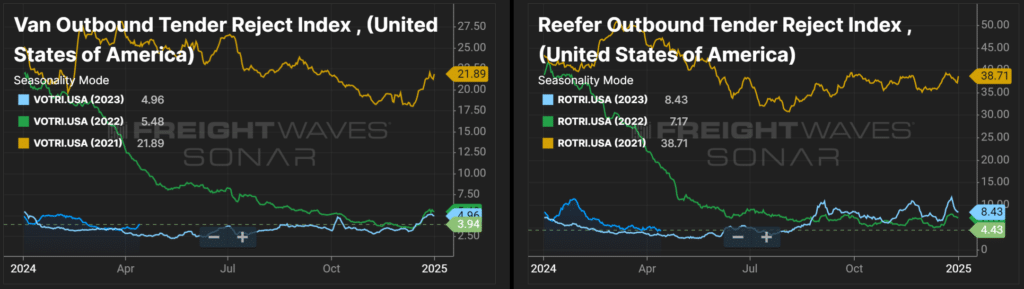 Figures 6 & 7: Van & Reefer Outbound Tender Reject Indices
The DAT Load-to-Truck Ratio measures the total number of loads relative to the total number of trucks posted on their spot board. It rose slightly to 3.13 on the van side in March, just slightly above the same period in 2023. Reefer data revealed a similar trend, with the March ratio landing just north of the 2023 reading at 4.83.
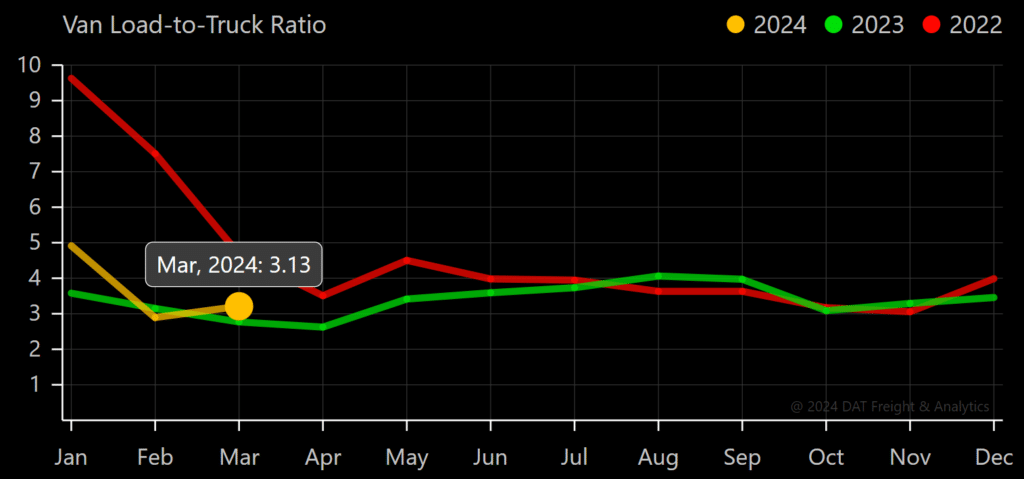 Figure 8: DAT Van Load-to-Truck Ratio
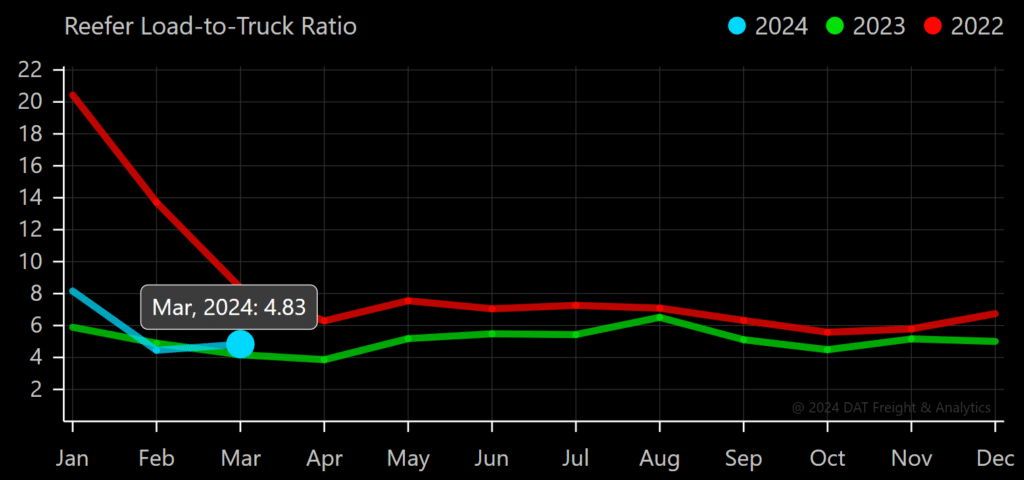 Figure 9: DAT Reefer Load-to-Truck Ratio
According to ACT Research, new Class 8 truck orders declined from over 17,000 in February to 10,000 in March. While this seems relatively significant, it aligns with typical seasonality. New truck production remains strong as backlogs continued to decline in March.
 Figure 10: ACT Research U.S. Class 8 Tractor Net Orders & Spot Rates
According to the latest report (February), net revocations fell to nearly 5,300 in February, marking the lowest number since April 2022. Though somewhat surprising as rates continue to reach new cycle lows, the volatility in December and January likely helped carriers keep their wheels turning. The number of new carrier entrants also increased in February, meaning the overall population decreased by just 800 carriers.
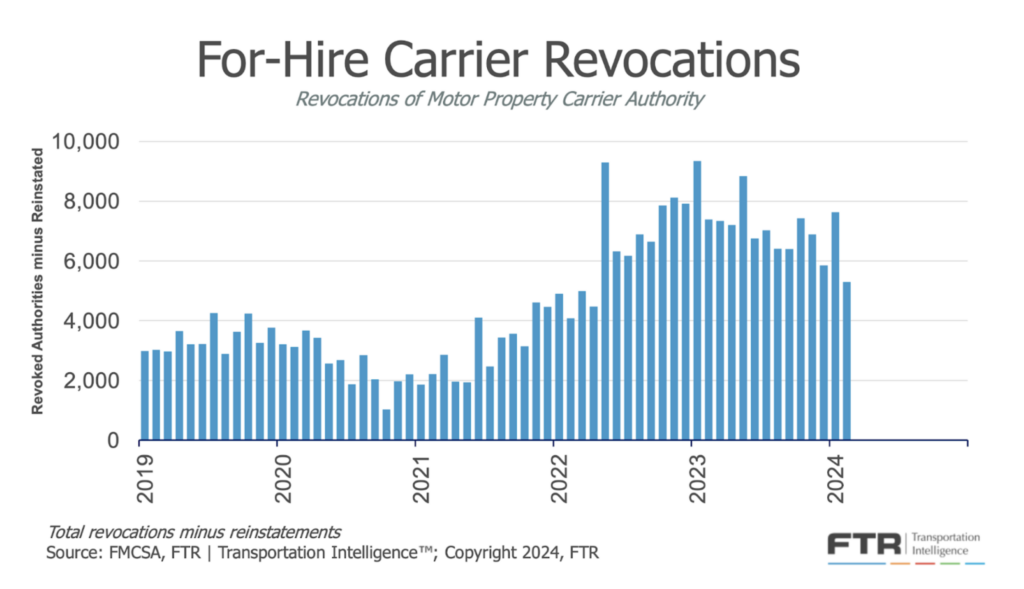 Figure 11: FTR For-Hire Carrier Revocations
FTR reported 26,000 new orders in January — an increase of 10.3% month-over-month and more than 44% year-over-year — indicating that some carriers are trying to maintain or expand their fleets.
February order estimates were around 25,700, a 2.4% month-over-month decrease but an 18.2% year-over-year increase. This trend likely points to the financial strength of larger carriers and private fleets’ ongoing investment in growth.
While order levels were above the historical average, they did align with seasonal trends. Because freight demand is healthy overall, larger fleets are adding capacity to insource volume back from smaller for-hire fleets and owner-operators.
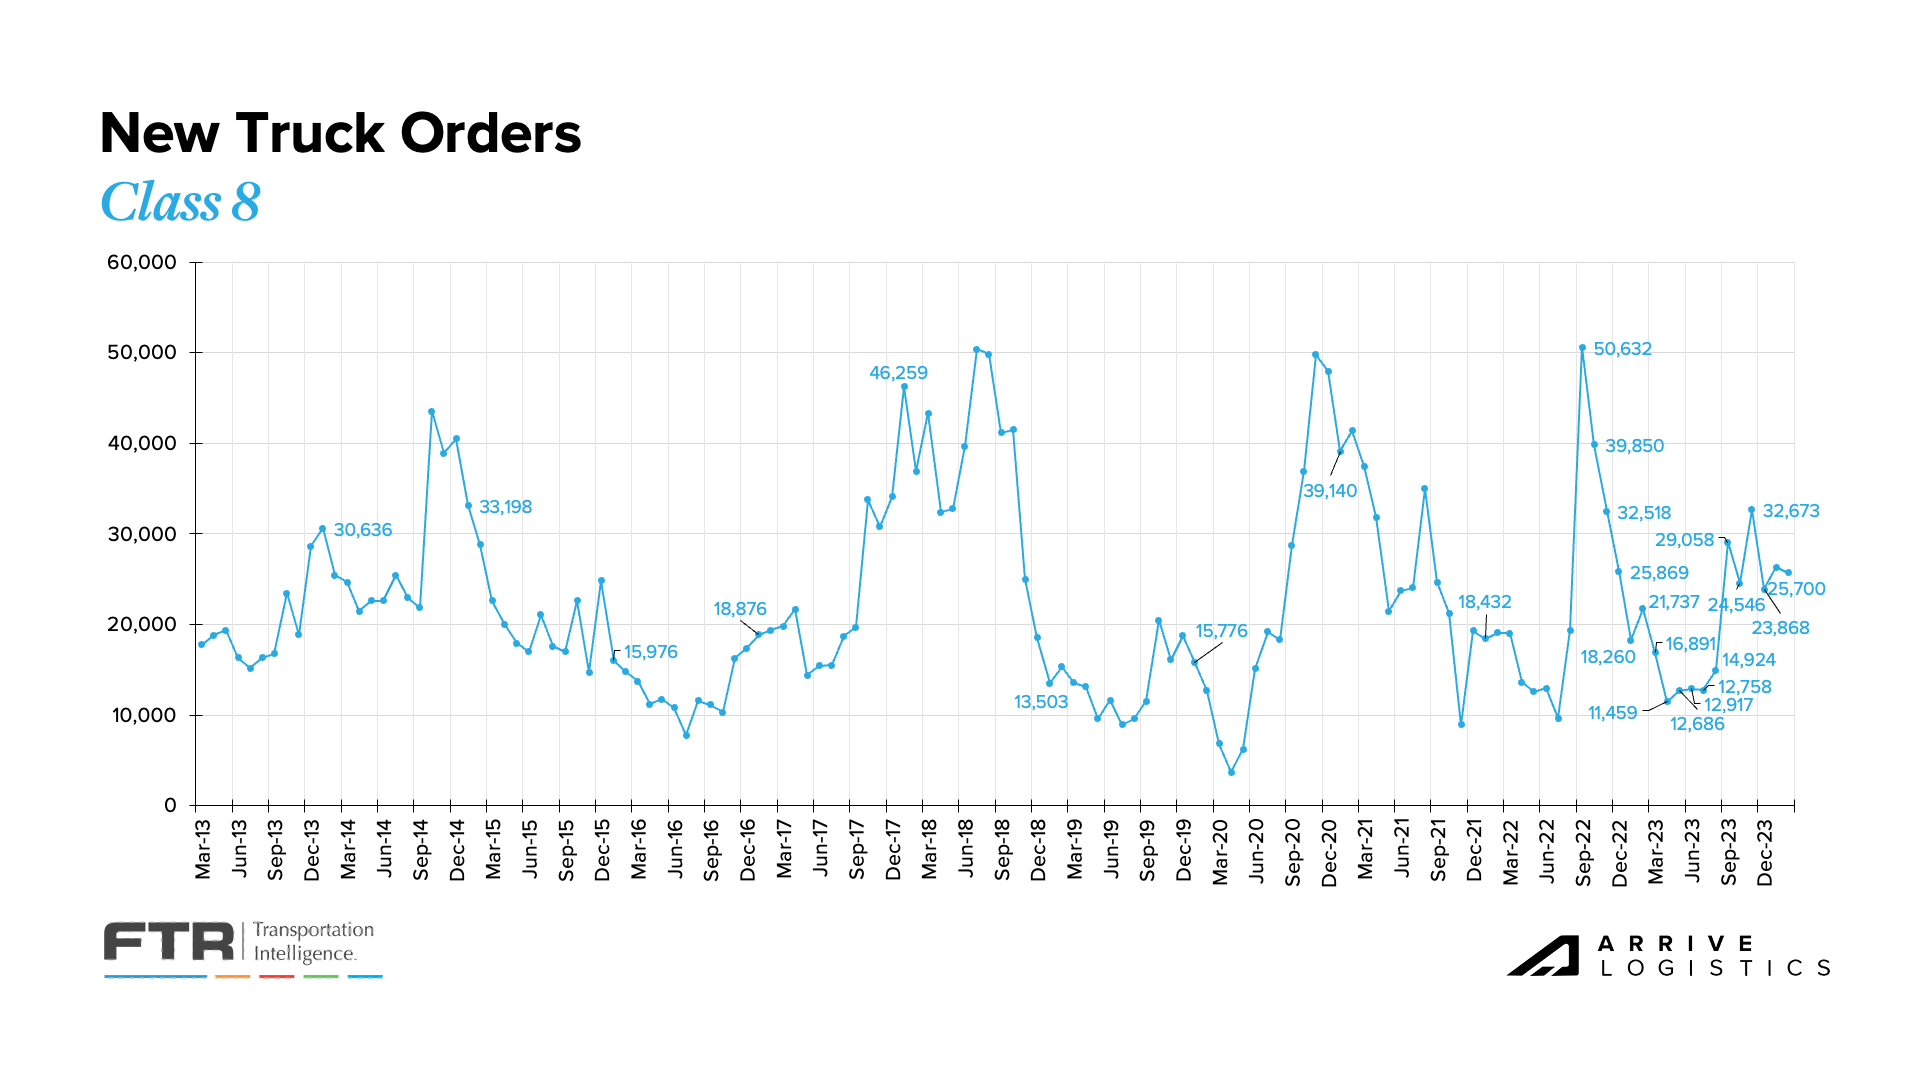 Figure 12: FTR’s New Class 8 Truck Orders
Carrier margins continue to shrink due to falling revenues and high operating expenses. ACT’s “Core Carrier” set shows year-over-year declines for six consecutive quarters. Net margins did rise quarter-over-quarter in Q4 2023 but were still down 2.7% year-over-year. As rates become more volatile in the back half of 2024 and into 2025, the pressure on carriers should ease.
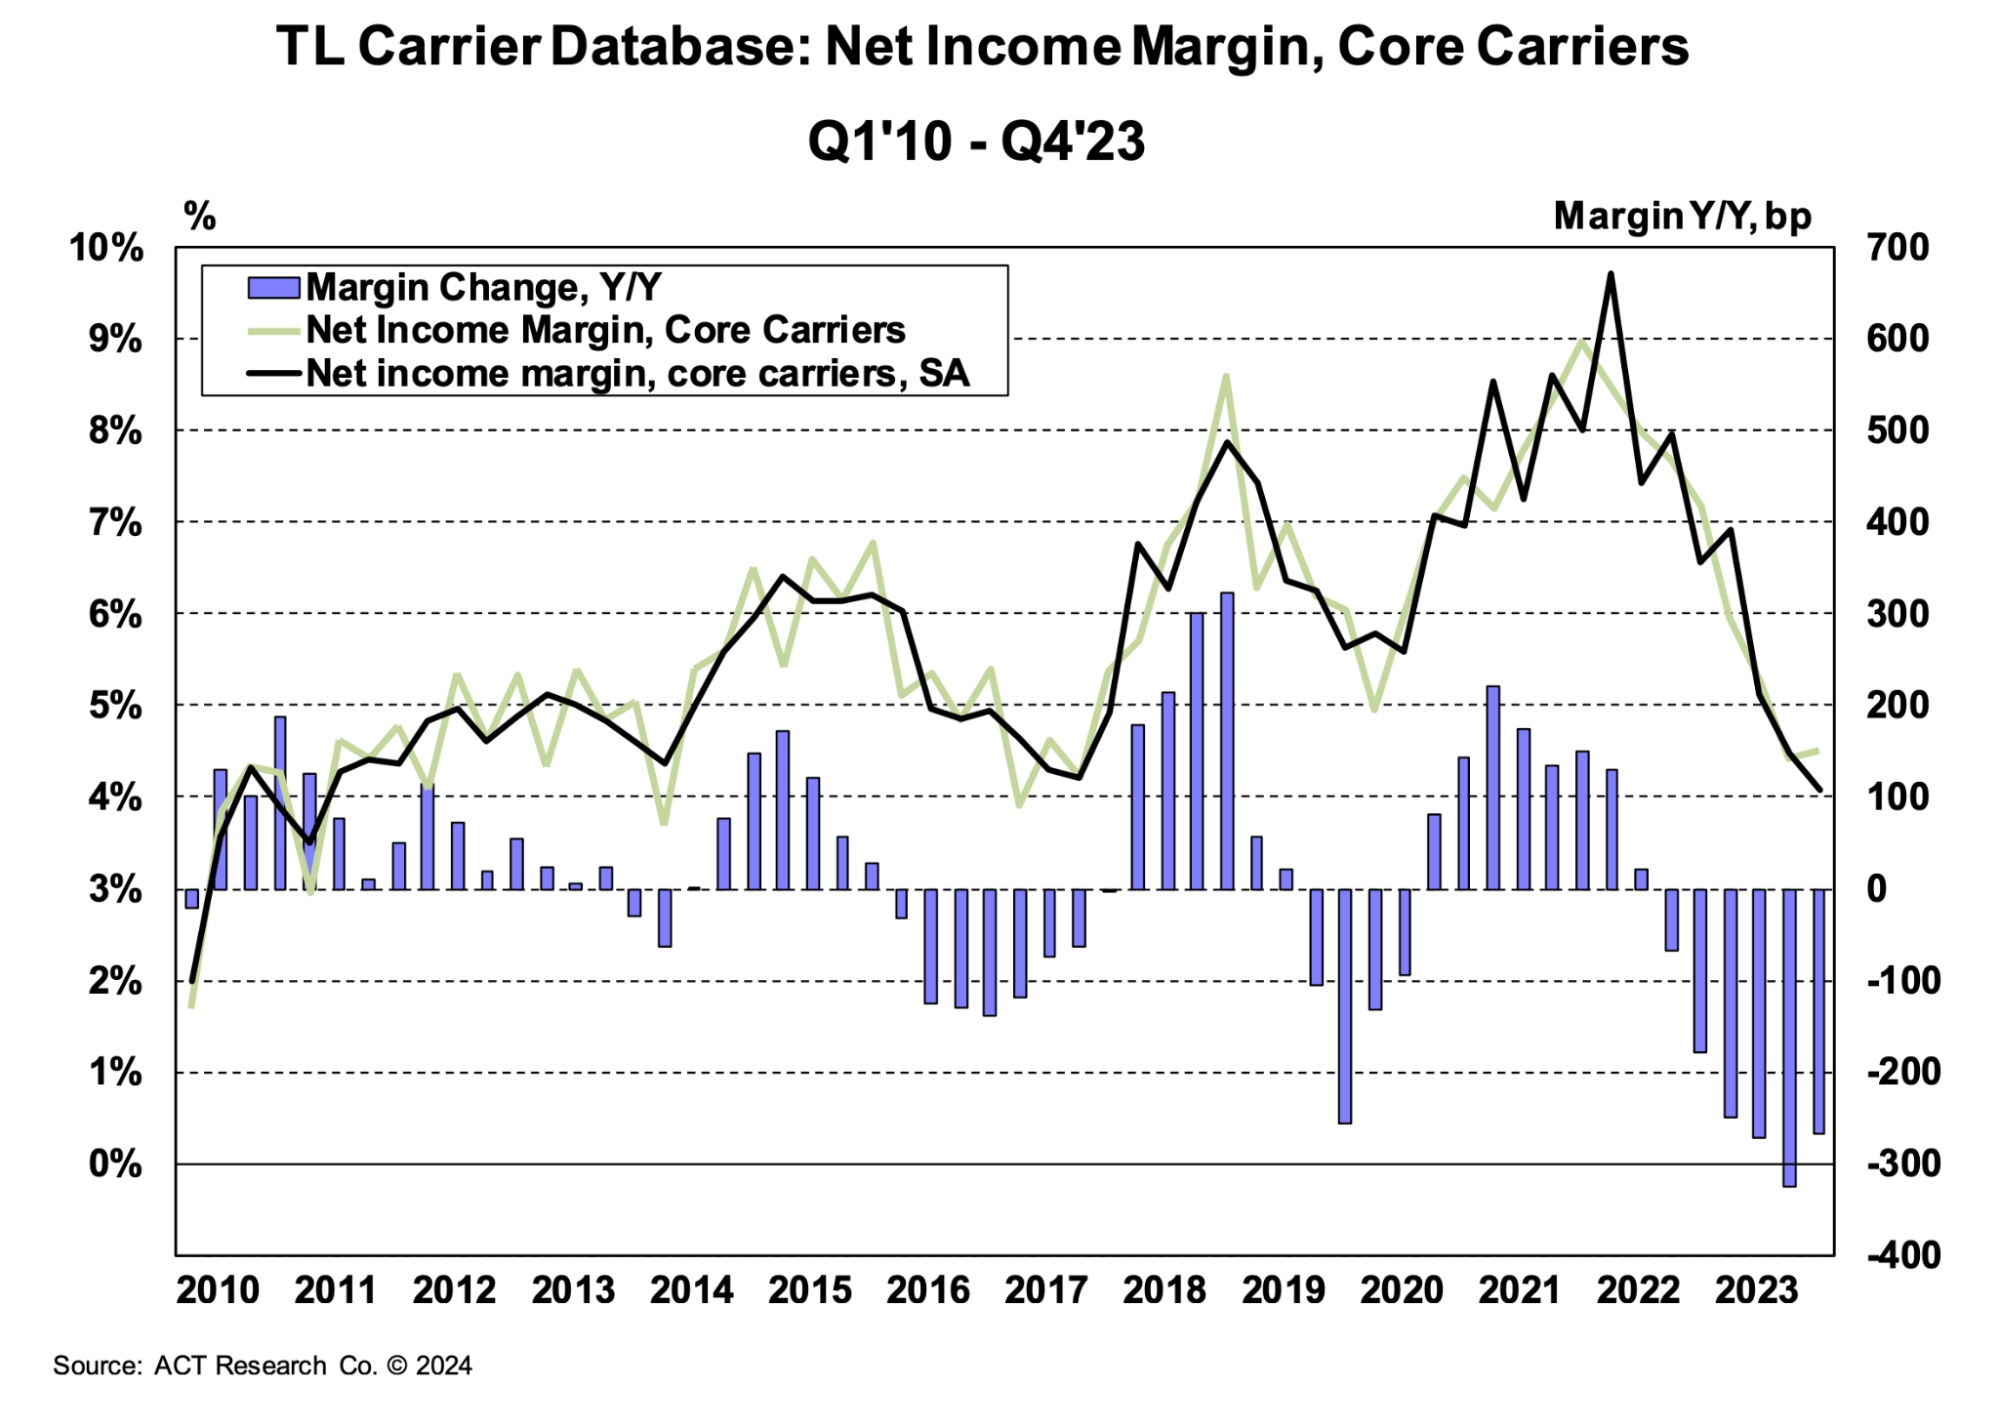 Figure 13: ACT Research, Net Income Margin, Core Carriers
According to ACT Research, the Class 8 backlog-to-build ratio declined from 5.8 months in February to 5.5 in March. Though backlogs shrank for most of last year, they rose by over 10,000 units to nearly 105,000 from October 2023 to March 2024. However, they dropped again by 7,000 units in March 2024, leaving the backlog at around 97,000.
 Figure 14: ACT Research, U.S. Class 8 Tractors: Backlog and Backlog/Build Ratio
The latest (February) ACT Driver Availability Index reading was flat. Volumes remain relatively low, and ACT projects seasonal declines in Q2. As low rates persist, market conditions will likely apply downward pressure on availability as drivers seek more lucrative opportunities, potentially outside the trucking industry.
 Figure 15: ACT For-Hire Trucking Index: Driver Availability
In January, the National Retail Federation (NRF) reported flat imports month-over-month at 1.96 million TEUs. However, this marked a 25% year-over-year increase — the largest projected for at least the first half of the year. Additionally, the NRF predicts that over two million TEUs will soon be imported in one month for the first time since last fall.
The Francis Scott Key Bridge collapse continues to have regional impacts. Shipments have been rerouted to nearby ports such as Newark, NY and Norfolk, VA. The Port of Baltimore handled roughly 48,000 TEUs in January. Despite the bridge collapse and Houthi attacks in the Red Sea, the maritime supply chain remains relatively stable and resilient.
![]() Figure 16: NRF Monthly Imports
Figure 16: NRF Monthly Imports
Conditions in March remained relatively quiet without any major disruptions. Spot load postings increased by 12.3% month-over-month but were down nearly 15% year-over-year. Meanwhile, month-over-month truck postings dropped by 6.1%. These results reflect soft demand conditions.
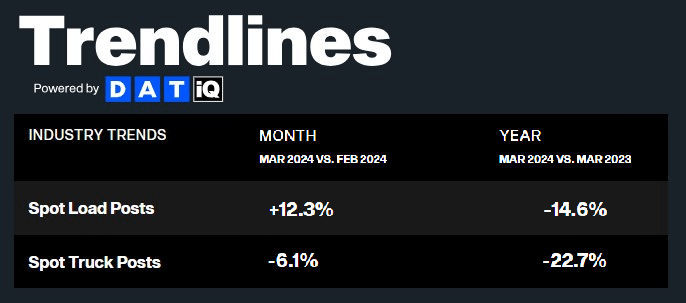 Figure 17: DAT Trendlines
Truckstop’s Weekly National Average Spot Rates provide a detailed view of week-to-week movements and a real-time look into the current environment. Recent readings show that dry van and reefer spot rates are nearing new cycle lows. Dry van spot rates fell to $1.88 per mile, matching the cycle low set in mid-March, and reefer rates were $2.18 per mile, just $0.02 higher than the cycle low reported in early March. Flatbed rates continue to trend upward as construction season gets underway.
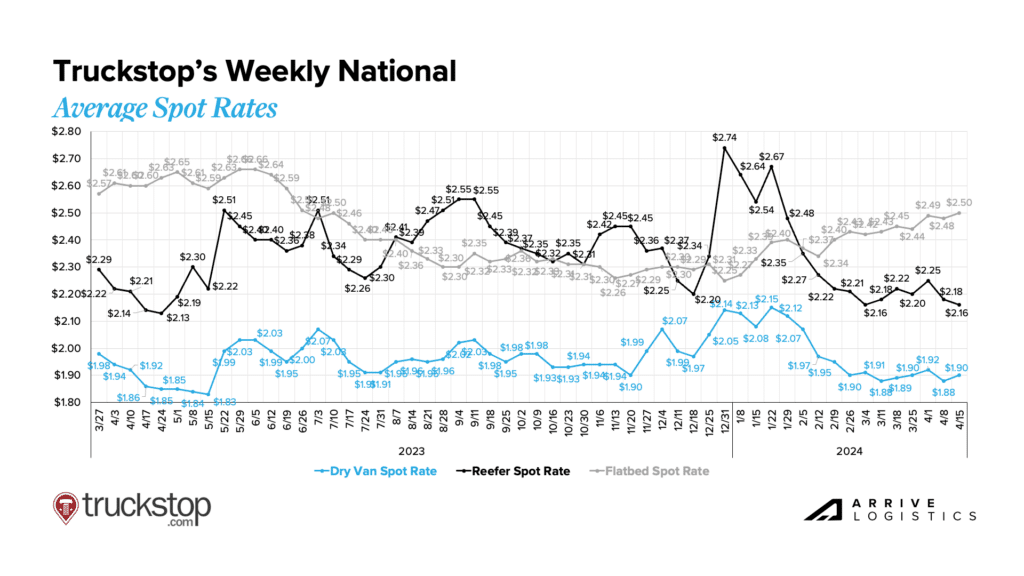 Figure 18: Truckstop Weekly National Spot Rate Average
National diesel prices have leveled out over the past two months, with relatively minimal weekly fluctuation. The average price through the first half of April is $4.02 per gallon, matching the March average. Fuel surcharges have remained relatively steady, but with tensions mounting in the Middle East, there remains a chance for increases in the upcoming months.
 Figure 19: DAT Fuel Trends
DAT data shows dry van spot rates are down year-over-year and well below January 2024 highs. In March, spot rates set a new cycle low of $1.54 per mile, excluding fuel. Early April data shows similar numbers, with the national spot average increasing by $0.01 per mile. National contract rates for dry van have slowly declined as spot rates apply downward pressure. If early April averages remain flat throughout the month, contract rates could reach $2.00 per mile, excluding fuel, a new cycle low.
 Figure 20: DAT Dry Van National Average RPM Spot vs. Contract
Reefer rates continue to trend down. If early April data holds true for the rest of the month, spot and contract rates could reach new cycle lows. Spot rates currently sit at $1.81 per mile, excluding fuel; that’s $0.04 per mile below the prior cycle low of $1.85 per mile set in March. Reefer contract rates have declined by $0.02 per mile to $2.33 per mile in April, excluding fuel. The spot-contract gap also increased to $0.52 per mile.
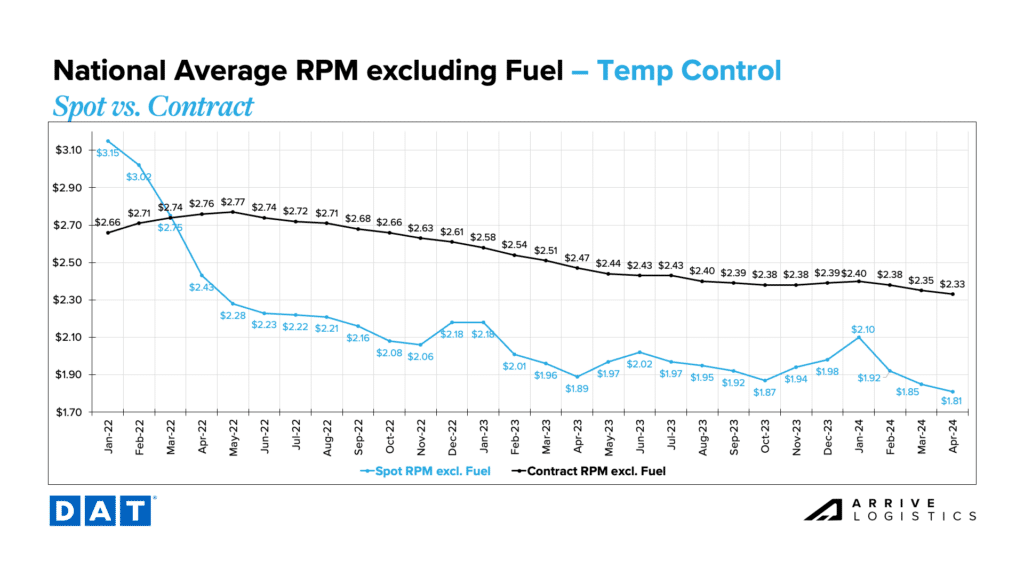 Figure 21: DAT Temp Control National Average RPM Spot vs. Contract
Flatbed rates rose to $1.98 per mile in early April, excluding fuel, the highest since mid-summer 2023. Contract rates also rose to $2.65 per mile, excluding fuel, also the highest since mid-summer last year.
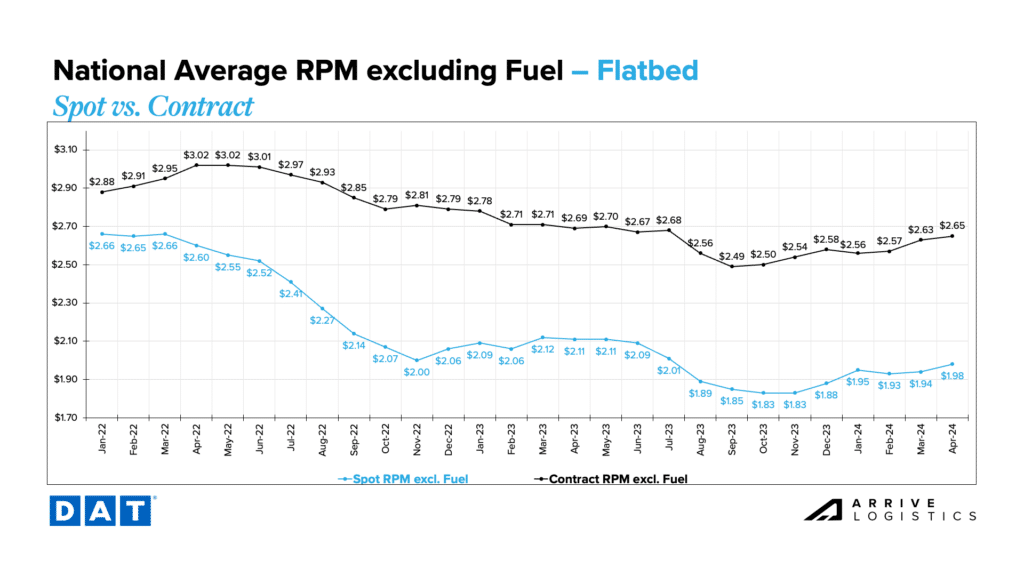 Figure 22: DAT Flatbed National Average RPM Spot vs. Contract
CPI data rose from 3.2% in February to 3.5% in March. Inflation, excluding food and energy, remained at 3.8%. The Fed appears less keen to make cuts in the near term, and there is now a remote chance they won’t cut rates this year, which would mean a significant consumer spending increase is unlikely. Once inflation and interest rates cool, consumer spending should improve and help drive freight demand.
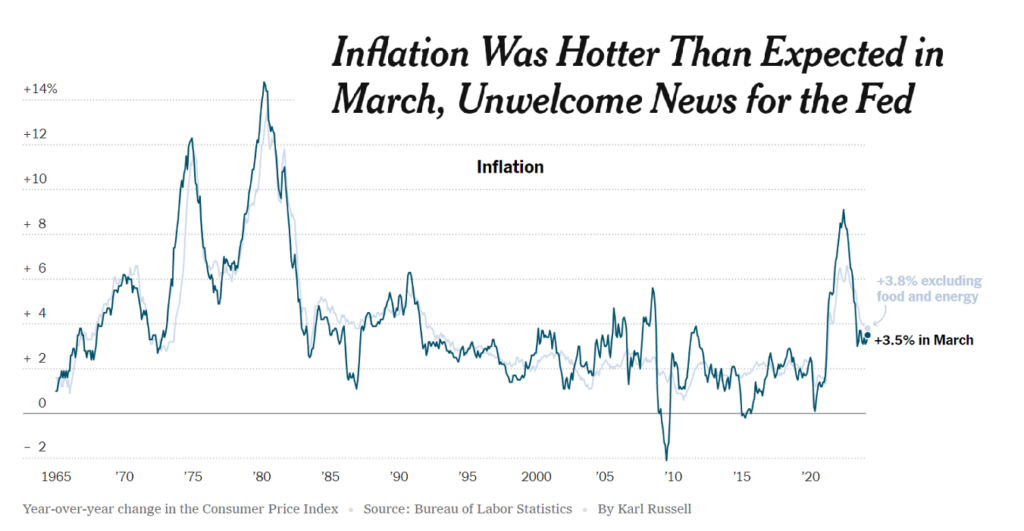 Figure 23: New York Times Inflation Data
Bank of America data showed March card spending increased by 0.3% year-over-year, likely driven by the timing of Easter. However, when removing seasonal factors, March spending declined by 0.7% year-over-year. Despite the slight spending slowdown, consumers remain optimistic thanks to a strong labor market and wages reaching the highest level since early 2023.
 Figure 24: Bank of America, Total Card Spending per Household