


The Morgan Stanley Dry Van Freight Index is another measure of relative supply; the higher the index, the tighter the market conditions. The black line with triangle markers on the chart provides a great view of what directional trends would be in line with normal seasonality based on historical data dating back to 2007.
As expected, conditions have eased following the typical summer peak season tightness. This aligns with the perspective that supply is still largely sufficient to support overall demand.
Historical data points to some potential tightening beginning around Labor Day and lasting through the end of Q3. Given recent tender rejection trends, we anticipate some spot market volatility.
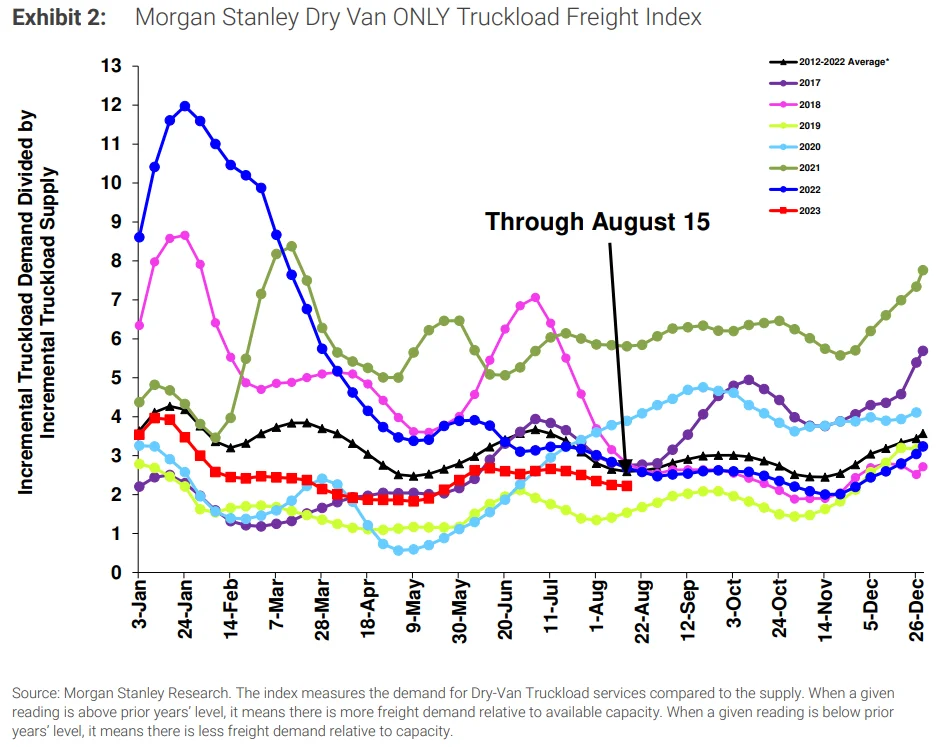 Figure 1: Morgan Stanley Dry Van Truckload Freight Index
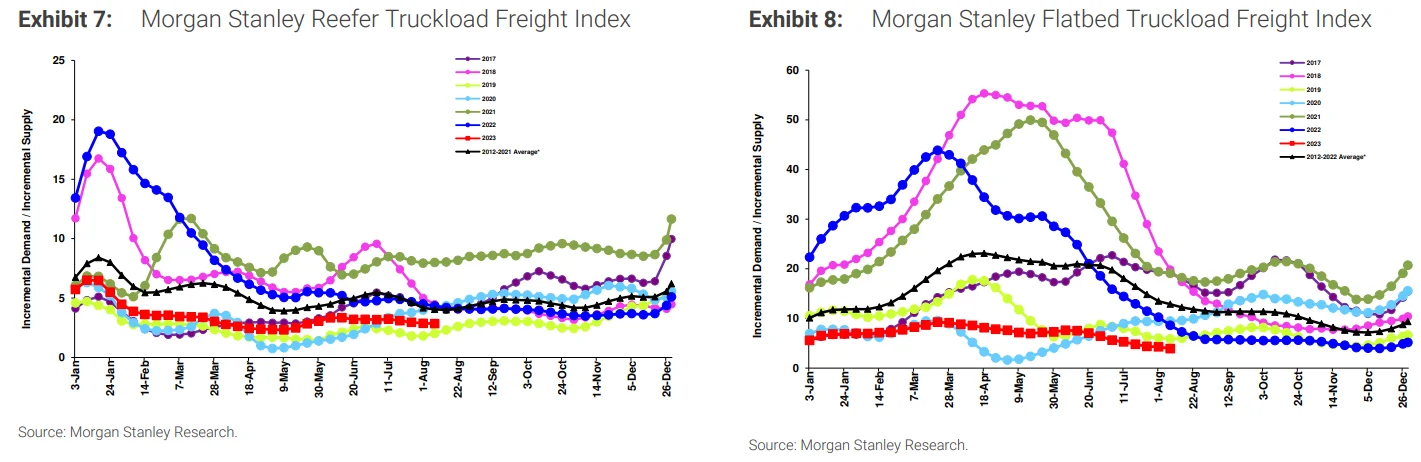 Figures 2 & 3: Morgan Stanley Reefer and Flatbed Truckload Freight Indices
The ACT For-Hire Index of Supply and Demand represents the overall market sentiment. The June reading dropped to 41.2 from 47.2 in May, marking 16 consecutive months of loosening conditions. For context, during the 2015-2016 downcycle, the index showed loosening conditions for 17 out of 19 months. While the current streak is unprecedented, it is hardly surprising considering the tightness that followed the pandemic.
 Figure 4: ACT For-Hire Trucking Survey
As expected, certain pockets and regions experienced some spot rate volatility, but it had little impact on tender acceptance and service for shippers at the national level. This trend demonstrates where we are in the capacity correction cycle — the market is still oversupplied, and further correction is needed before it becomes vulnerable to sustained disruption.
As expected, tender rejections eased following The Fourth of July but have steadily increased in recent weeks, leaving them flat compared to 2019 levels.
The Sonar Outbound Tender Reject Index (OTRI) measures the rate at which carriers reject the freight they are contractually required to take. The numbers fluctuated between a mid-month low of 2.9% and 3.33% by month-end, indicating routing guide compliance on shippers’ contractual freight remained historically high.
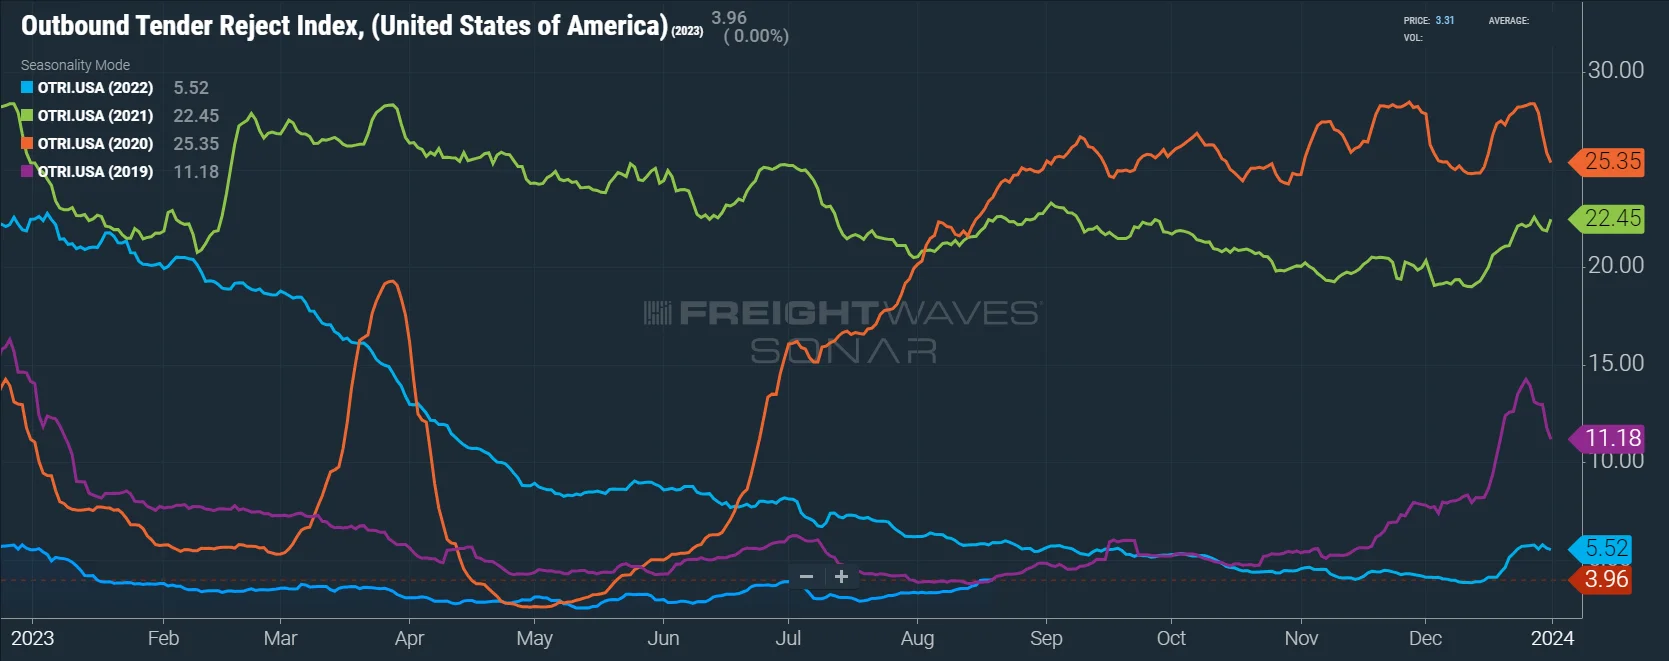 Figure 5: Outbound Tender Reject Index (SONAR)
The FreightWaves SONAR Outbound Tender Volume Index (OTVI), which measures contract tender volumes across all modes, was down 9.2% year-over-year, or 6.4% when measuring accepted volumes after the significant tender rejection rate decline.
Accepted volumes were up 5.7% month-over-month, driven by an 8.4% increase in accepted dry van tenders and a 6% decrease in accepted reefer tenders. Contrary to DAT’s spot data trends and the Cass Shipments Index, the data points to a month-over-month pickup in contractual volumes. However, the 6.4% year-over-year volume reduction is in line with Cass.
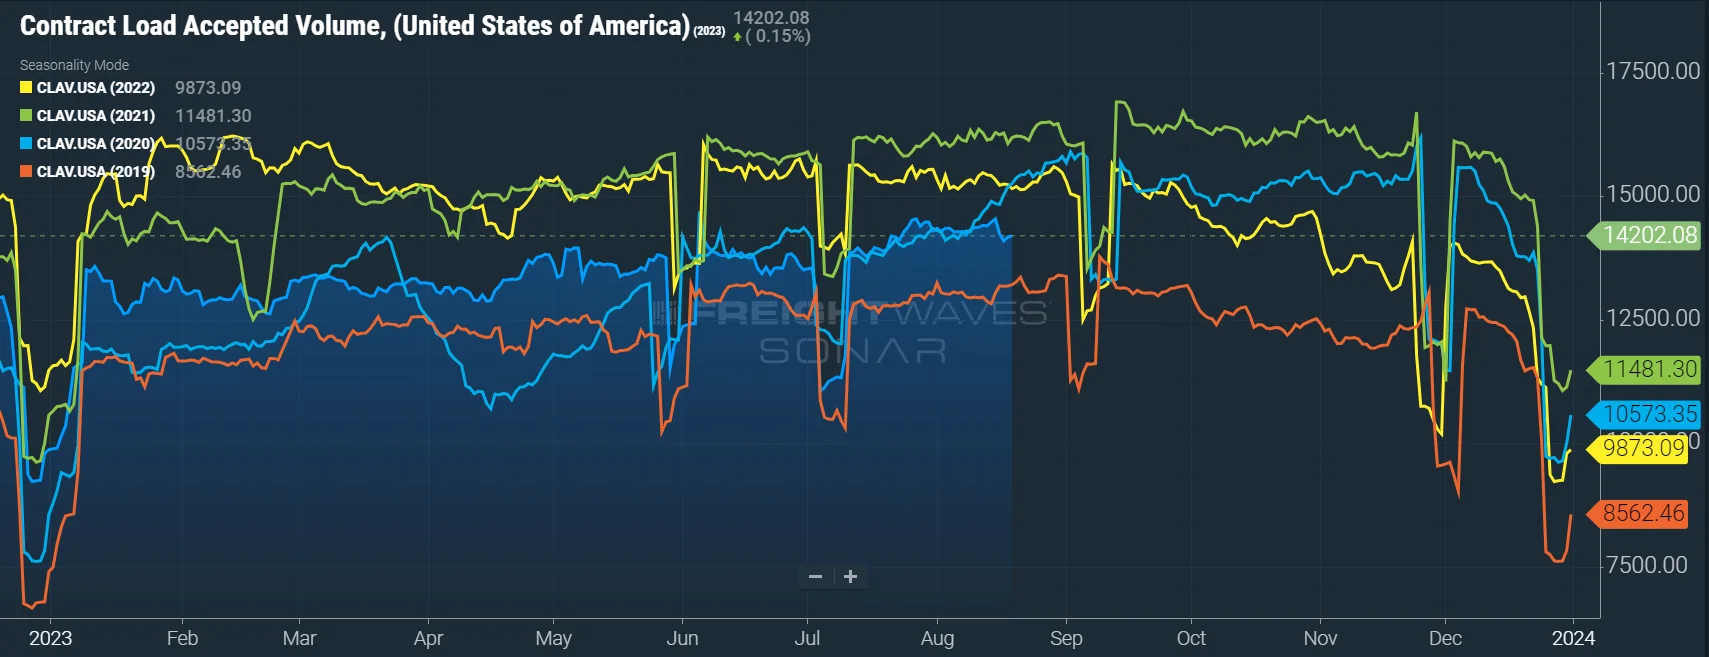 Figure 6: Contract Load Accepted Volume (SONAR)
The DAT Load-to-Truck Ratio measures the total number of loads relative to the total number of trucks posted on their spot board. July data showed relatively flat conditions despite declining load posts, indicating truck posts were also down.
The Dry Van Load-to-Truck Ratio was up 2.2% month-over-month but remains down 31.2% year-over-year, whereas the Reefer Load-to-Truck Ratio was up 0.6% month-over-month but down 46.9% year-over-year.
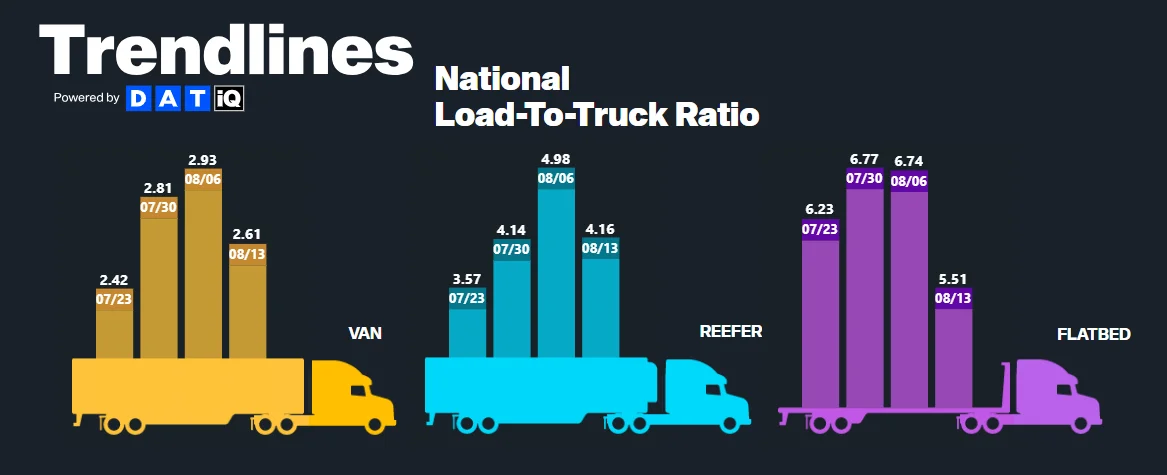 Figure 7: DAT Trendlines, National Load-To-Truck Ratio
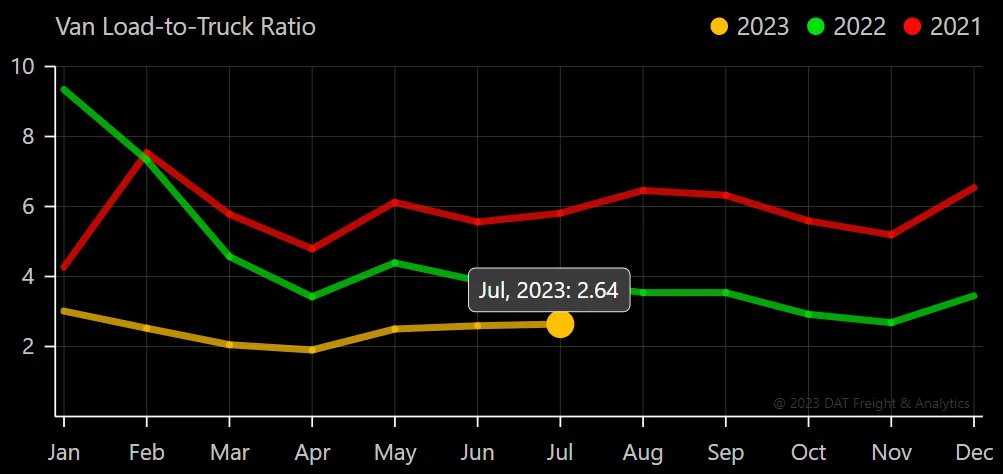 Figure 8: DAT Van Load-To-Truck Ratio
 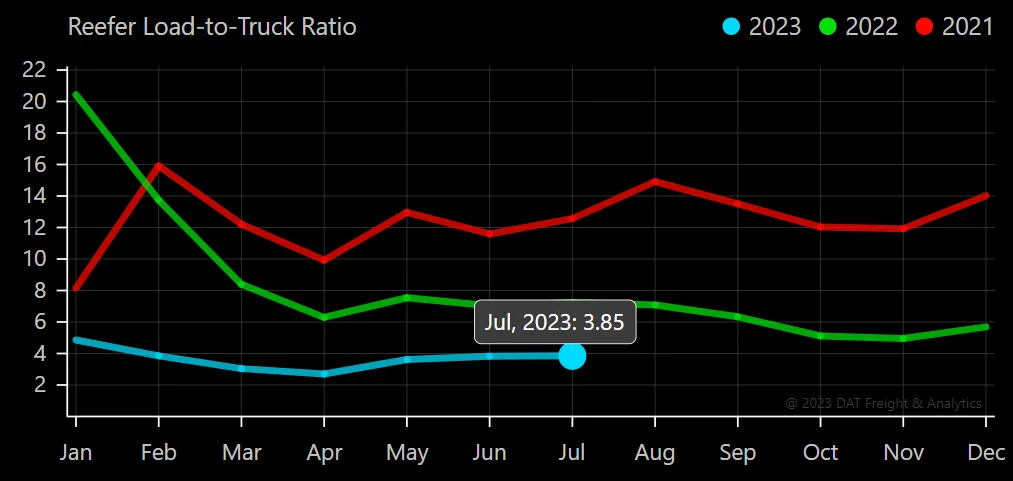 Figure 9: DAT Reefer Load-To-Truck Ratio
A key trend we’re still watching is revocations outpacing new carriers entering the market for nine of the last ten months, reducing the total number of carriers. A significant amount of capacity that entered the market over the last few years remains unutilized, so we expect this disparity to continue for at least the near term.
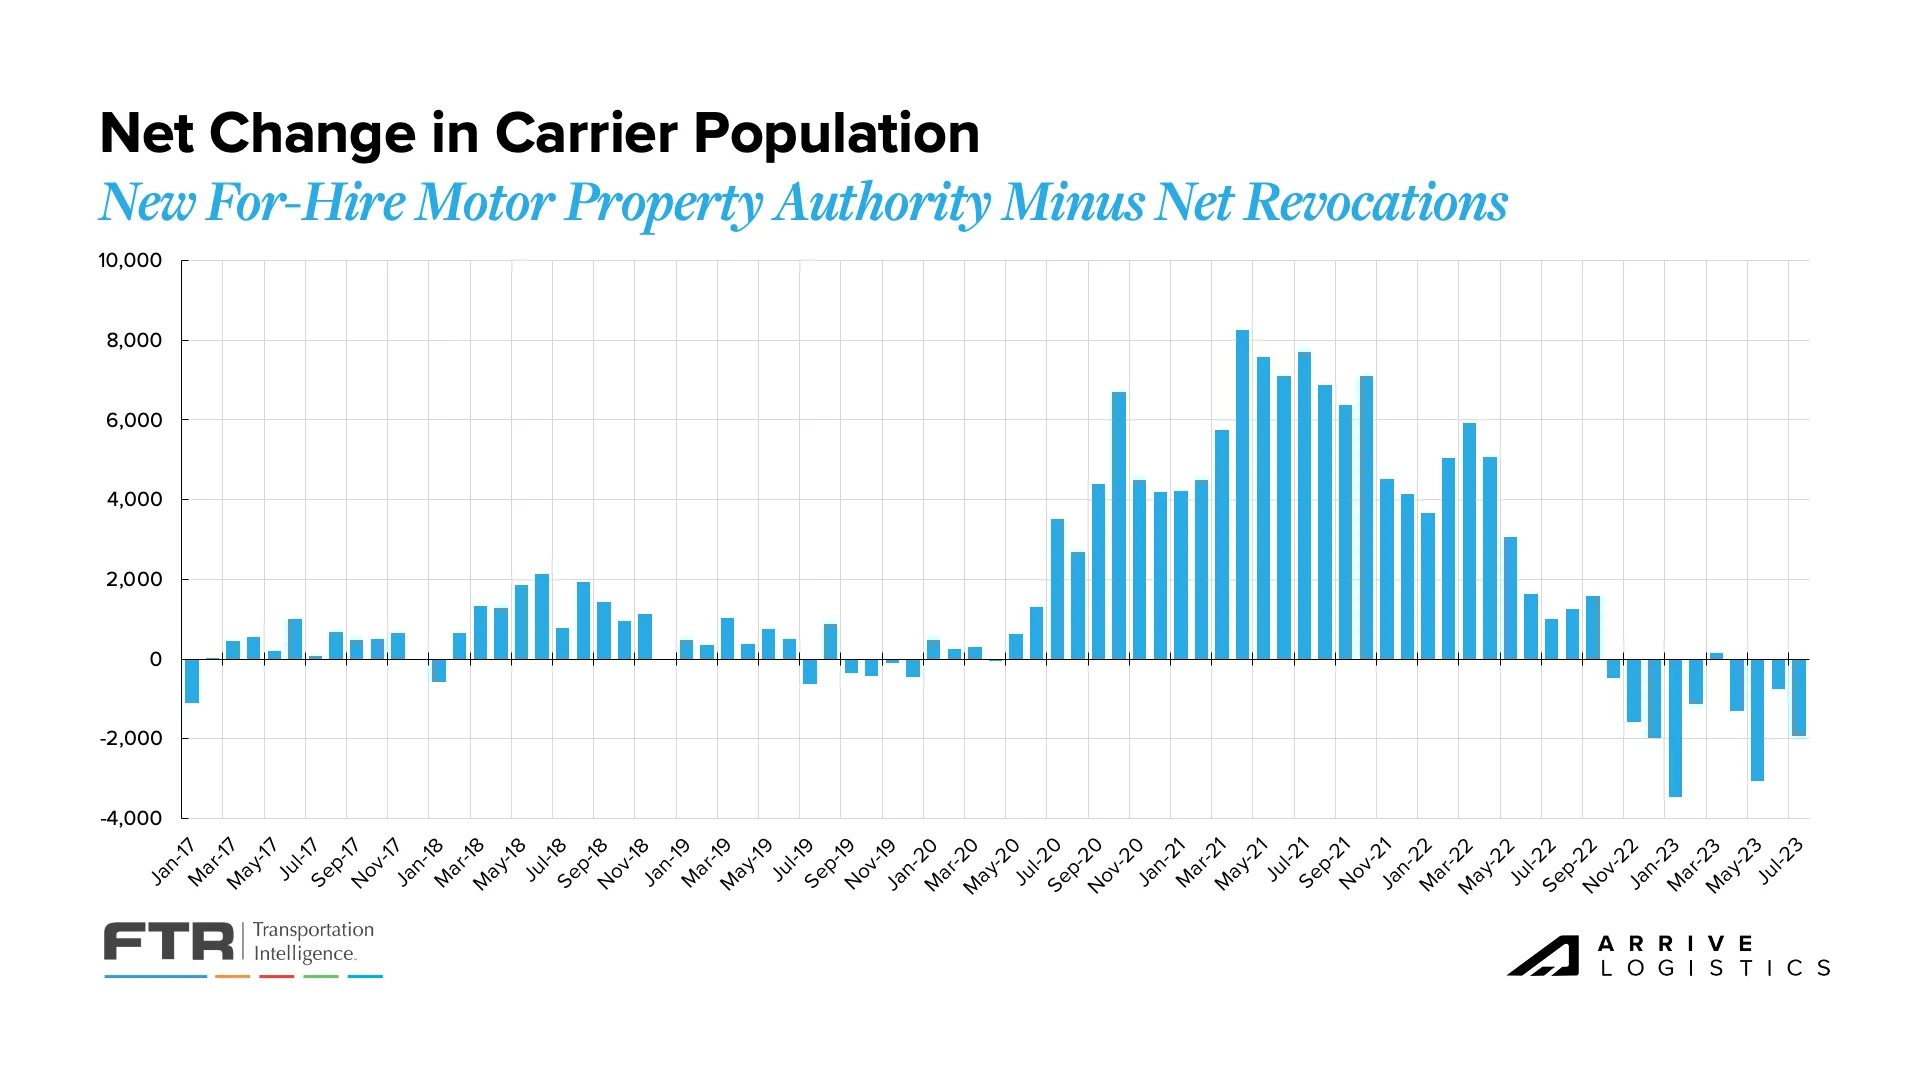 Figure 10: Net Change in Carrier Population: FTR Analysis of FMCSA Data
Preliminary numbers show that the Class 8 Tractor backlog declined by 8,700 units in July. Between March and June of 2023, estimates show the backlog dropped by around 11,000 units per month. Subsequently, the backlog-to-build ratio fell to 5.4 months in July, down from 5.9 months in June. The backlog decline will likely continue in the coming months as production levels outpace orders.
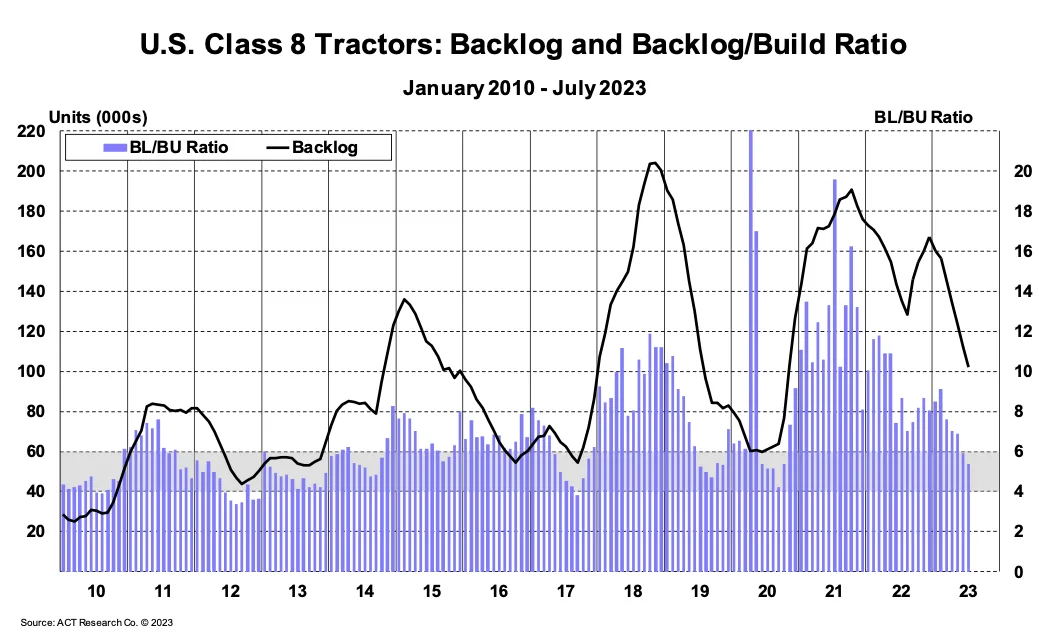 Figure 11: ACT U.S. Class 8 Tractors Backlog
July truck orders exceeded expectations but remained below replacement levels for the fourth straight month. Orders falling below replacements typically point to a soft market, but there is some indication that this is due to full build slots. Regardless, low orders and high production rates are expected to ease backlogs and wait times for future orders.
 Figure 12: New Class 8 Truck Orders: DataSource: FTR
ACT Research’s capacity index jumped to 54.0 in June, indicating that more capacity is entering the market. This trend is largely driven by strong Class 8 Tractor production reducing the backlog. Fleets continue to accept the equipment they ordered, which helps offset the impact of smaller fleets exiting the market due to decreased margins. Manufacturers continue to build at full capacity, meaning overall fleet capacity will likely increase over the next few months.
 Figure 13: ACT For-Hire Trucking Index: Fleet Capacity
The July jobs report released in early August showed trucking jobs declined by 2,900. Further, revised figures from June revealed a decline of 2,000 jobs, in contrast to the previous report, which indicated a decline of only 200 jobs.
Total employment is now at the lowest level since last fall after dropping by nearly 5,000 jobs over the summer. Given the worsening truckload rate environment, the trucking employment plateau observed throughout the first half of 2023 defied expectations. Carriers have been focused on retaining drivers, but the longer current conditions persist, the more likely overall employment is to fall further.
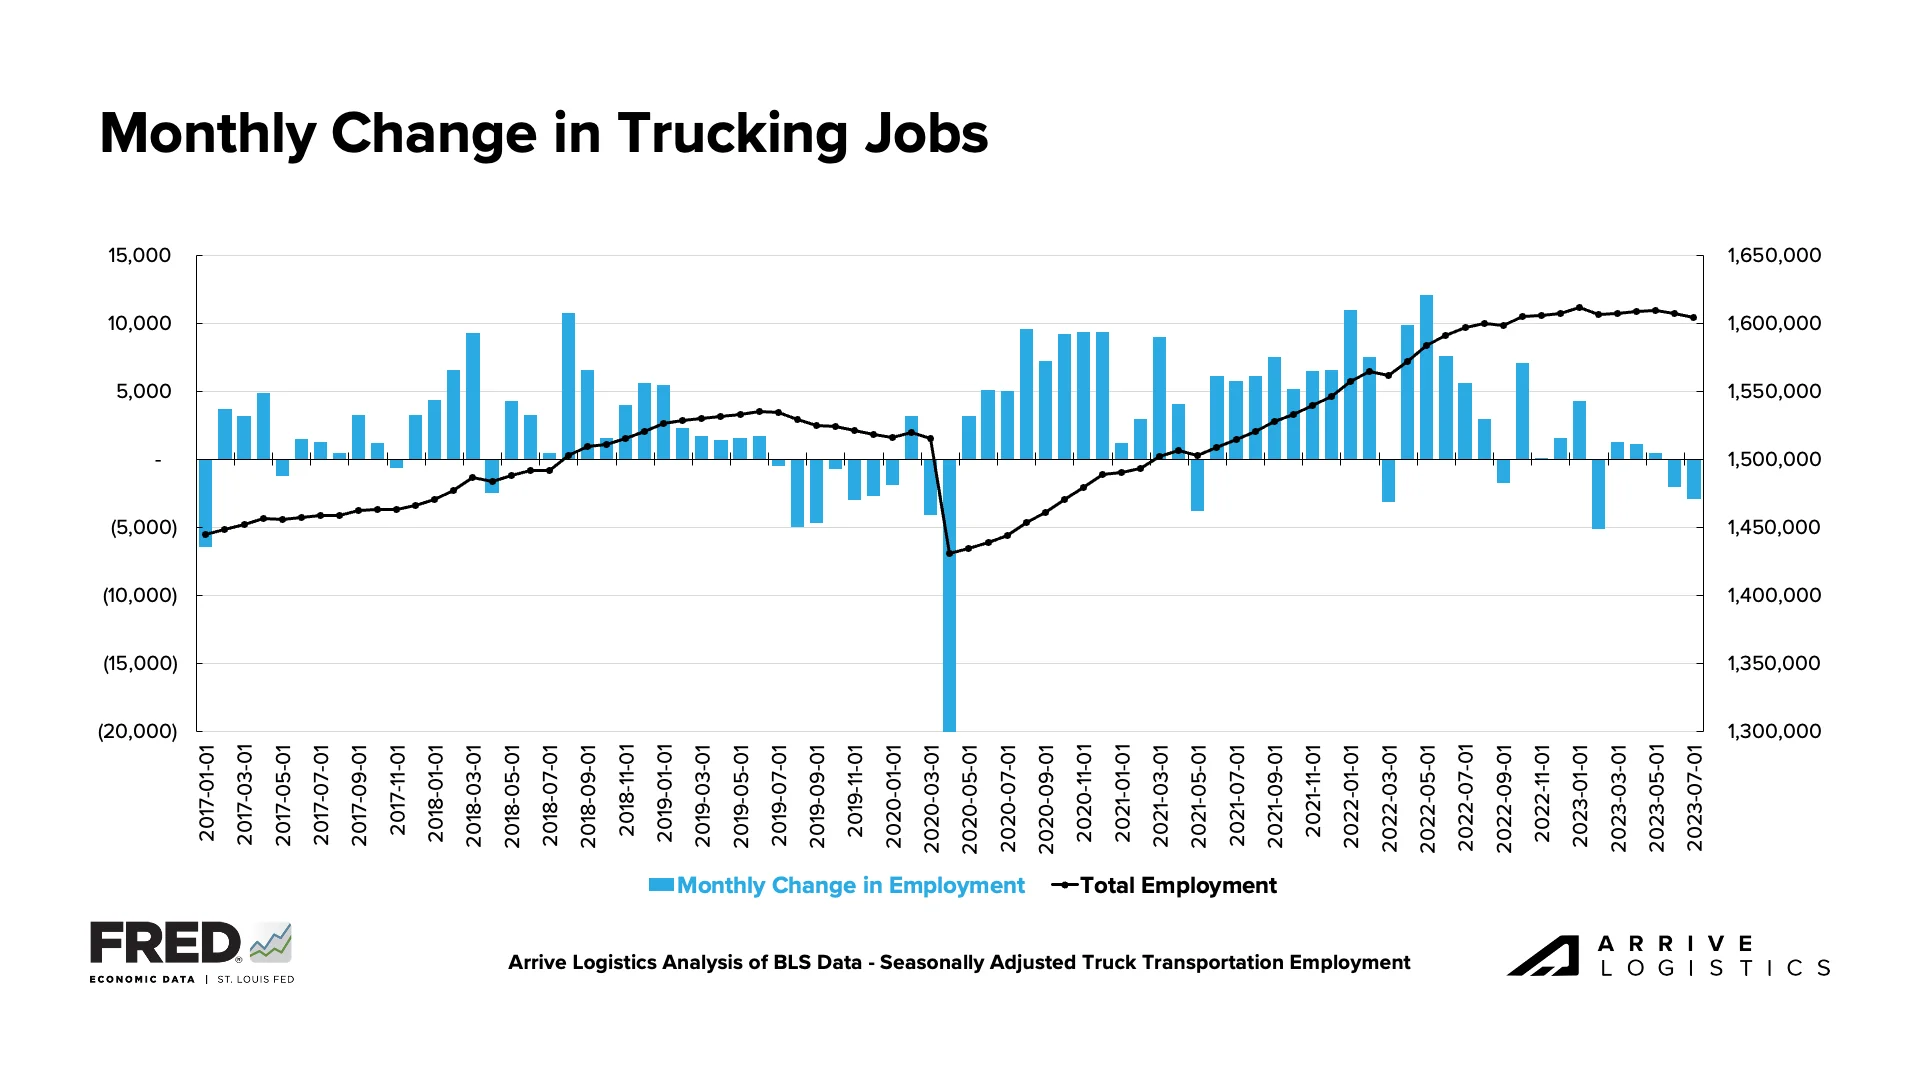 Figure 14: FRED’S Monthly Change in Trucking Jobs
August has been a challenging month for carriers. In addition to the job loss numbers, linehaul spot rates appear to be trending back to the cycle low, and fuel costs have increased, pressuring margins even more than they already were.
Carriers have been patient through the down cycle, but conditions are starting to take a toll, and it is clear that a capacity correction is underway. With only a modest upside to truckload demand on the horizon, carriers will likely see no sustained improvement in overall conditions through the year’s end beyond a few seasonal periods of opportunity. Thus, carrier exits will likely increase in the coming months.
There is a long way to go, as we see from strong contract service numbers, but this trend will inevitably lead to a capacity crunch, as it always does in the market cycle.
Increased operating expenses are the primary culprit causing carriers to close, as overall rates are still high compared to historical (pre-pandemic) levels. This trend continues to drive historically high revocations of authority, with July numbers reaching another top 10 all-time mark for the highest number of carrier exits.
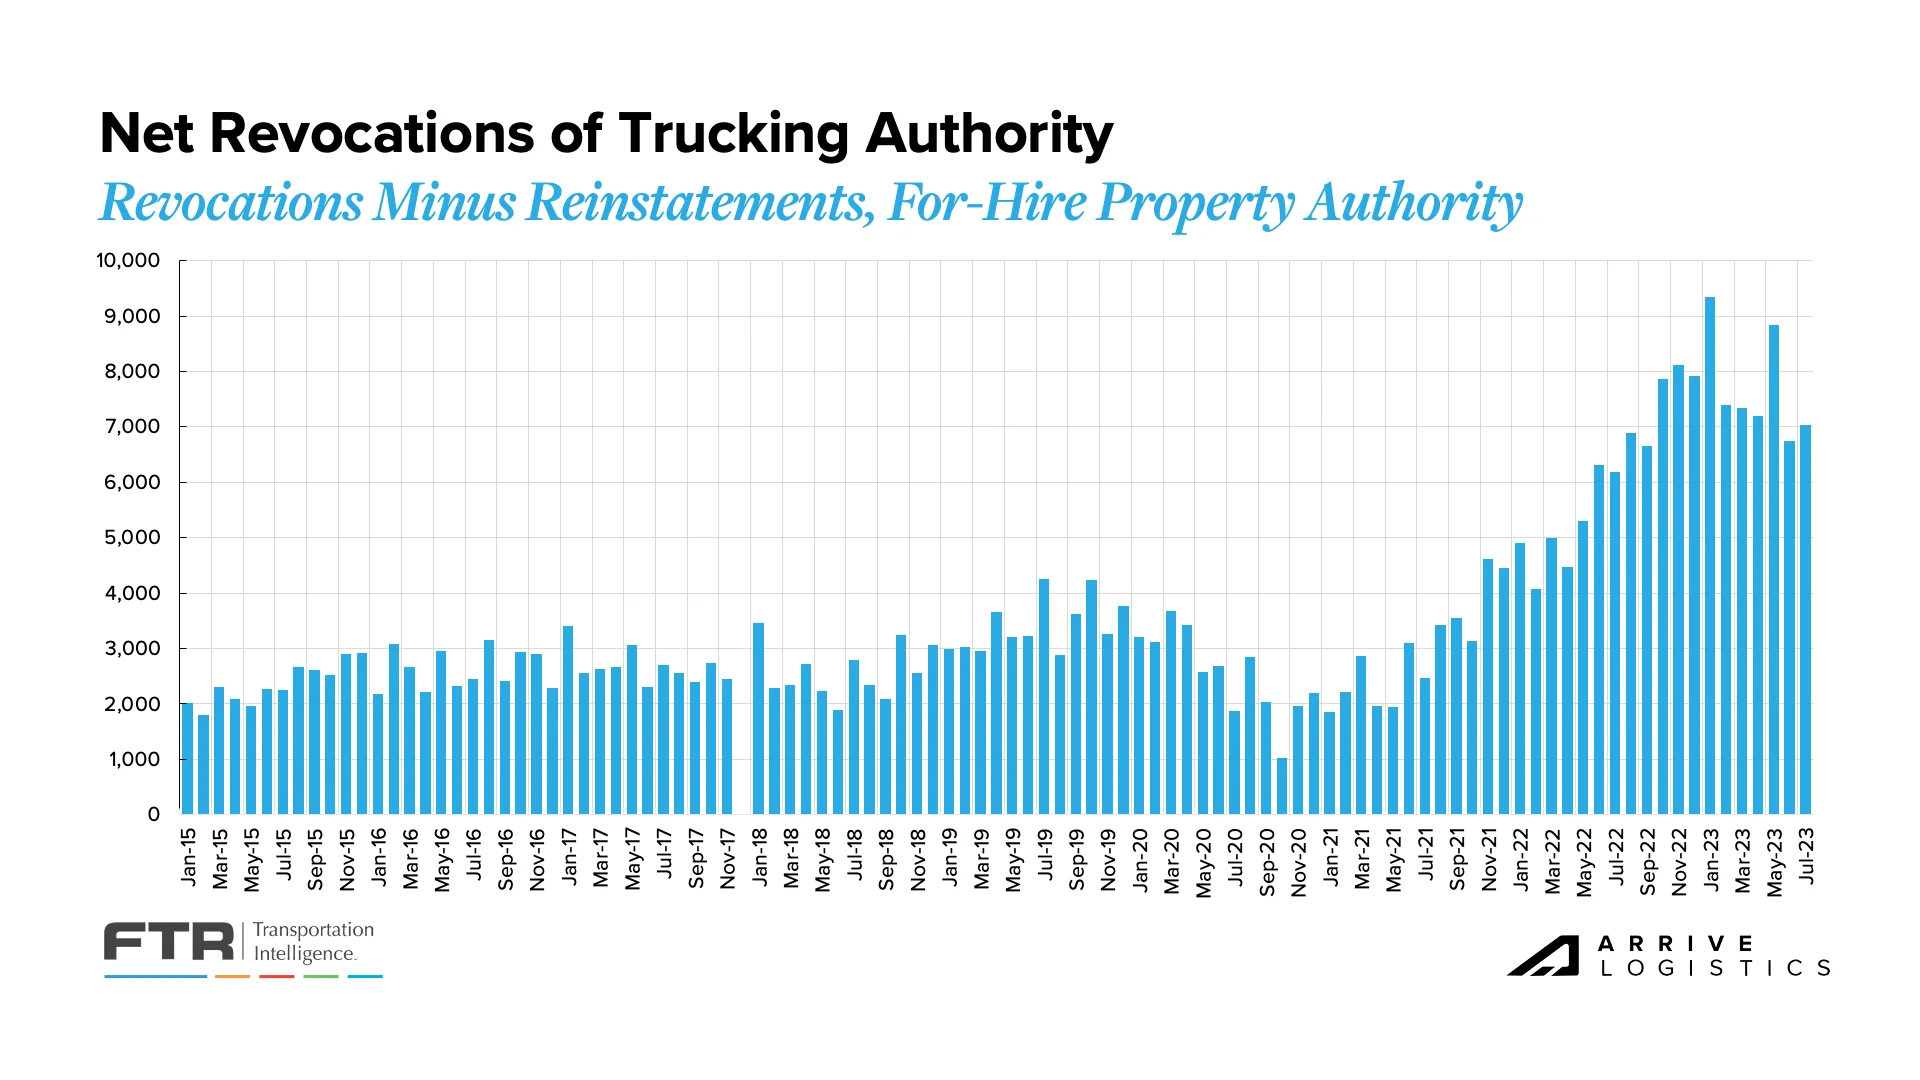 Figure 15: Net Revocations: FTR Analysis of FMCSA Data
The ACT Driver Availability Index dropped by a few points in June after hitting a record high in May but remains elevated at 59.3. However, it is important to note that this data primarily consists of medium- and large-sized fleets.
Smaller fleets and owner-operators are feeling more heat as margins continue to compress and real wages shrink, driving many to join larger fleets or exit the industry altogether. Overall driver availability will likely start to moderate in the near to medium term once the capacity influx slows down.
We continue to report on retail and manufacturing trends due to their significant impact on domestic freight demand. While manufacturing remains a concern after contracting for the ninth straight month in July, August import cargo volumes are on pace to be the highest since last fall.
The National Retail Federation (NRF) recently reported that import cargo volumes at the nation’s major container ports declined by 22% through the first half of 2023 compared to the previous year. August numbers, however, are projected to be the high water mark in 2023, down just 10% year-over-year and the first month since last October to crest 2 million TEU.
Imports are projected to decline steadily through the end of the year but turn positive year-over-year in November. Full-year import volumes are expected to drop 12.8% from 2022 once 2023 is said and done. As destocking continues, import volumes should normalize as retailers begin to place orders in line with stable consumer trends.
![]()
Figure 17: NRF Monthly Imports
Truckload demand slowed in July as the summer peak season wound down. DAT reported the second straight month-over-month spot load decrease as posts dropped by nearly 20% in July after falling by 6.1% in June. On a year-over-year basis, the annual comp’s decline is still an improvement as spot load posts moved from -54% in June to -50.3% in July.
 Figure 18: DAT Trendlines
Spot rates continue to stabilize but remain well below operating costs, leading to the third straight quarter in which public carriers are earning negative margins on spot loads. This trend will likely affect owner-operators and carriers with high spot exposure, potentially leading them to close their business or join larger fleets. Historically, there would be a quick rise in spot rates when this occurs. However, capacity is plentiful despite this trend, indicating that conditions could remain rough in the near future.
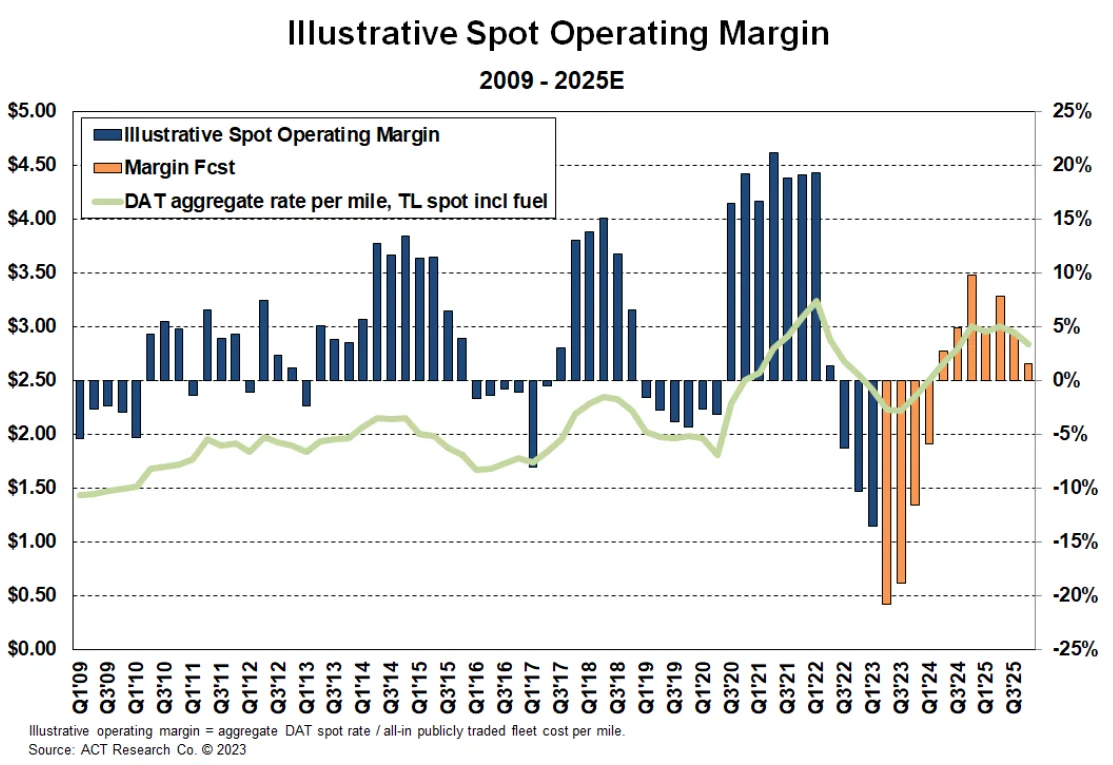 Figure 19: ACT Illustrative Spot Operating Margin
Carriers’ net income margins in Q2 2023 dipped below 5% for the first time since the onset of the pandemic. Q2 was also the fifth straight quarter in which carriers saw a year-over-year margin decline. As we continue to move through this oversupplied market, conditions will likely remain tough in the near term and into early 2024.
 Figure 20: ACT TL Carrier Database – Net Income Margin
When looking at the full scope of public carrier businesses, 2022 margins were strong but notably down from the last two years. As rates fall further in 2023, the revenue per mile and cost per mile gap will continue to shrink, meaning margins for large carriers could do the same. However, fuel prices continue to decline, which ultimately decreases costs and could help support margins for all carriers.
 Figure 21: ACT Revenue/Mile vs. Cost/Mile (Publicly Traded Carriers)
The month-over-month van rate spread bounced back to $0.50 in July after closing at $0.48 in June. This was expected as spot rates fell faster than contract rates following the holiday. However, the expectation is that the gap should continue to close now that spot rates have found a floor and contract rates face ongoing downward pressure.
All-in dry van spot rates are down 17.5% year-over-year in August, while linehaul spot rates are down 16.9%. All-in dry van contract rates are down 17.7% year-over-year, and linehaul contract rates are down 17.3%. We have now seen back-to-back improvements in year-over-year spot and contract rate growth trends, a sign that we are beyond peak deflationary pressures.
 Figure 22: DAT Dry Van National Average RPM Spot vs. Contract
The overall rate market remains steady, with certain regions seeing typical seasonal volatility.
Outbound rates are rising in certain Midwest markets. Rates increased by $0.15 and $0.12 in Duluth, Minnesota and Eau Claire, Wisconsin, respectively. Rates out of Erie, Pennsylvania and Pittsburgh, Pennsylvania, also jumped by more than 4% over the past week.
The largest week-over-week increase overall was in Reno, Nevada, where rates rose by 10% — Hurricane Hillary likely played a role in outbound rates in the region.
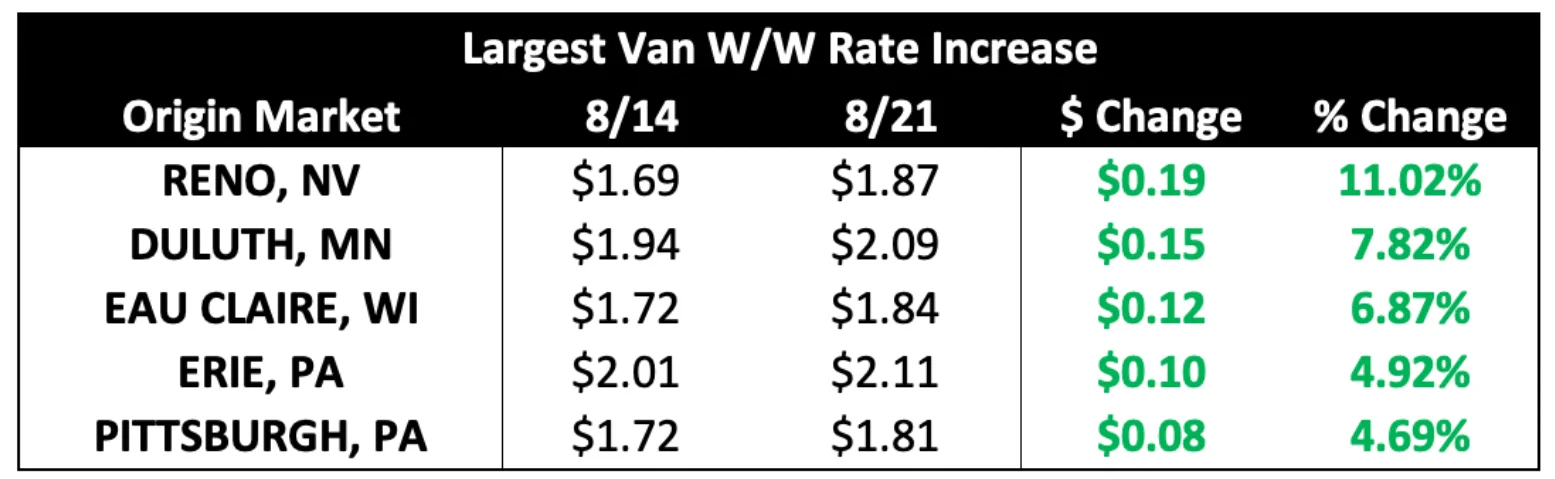 Figure 23: Largest Van W/W Rate Increases
Rates did decline in some regions in the past week, with the largest occurring in Bismarck, North Dakota, where rates dropped by nearly $0.40 per mile. Outbound rates in Albuquerque, New Mexico, Alexandria, Virginia and Missoula, Montana also had double-digit percentage declines.
 Figure 24: Largest Van W/W Rate Decreases
Monthly reefer rate trends followed van trends in July and early August, easing from a June high as the summer peak season faded. After reaching a high of $0.58 in April, the reefer equipment spot-contract rate spread dipped as low as $0.41 when spot rates peaked in June but is back up to $0.46 in early August. Like van trends, the gap should further close now that spot rates have found a floor and contract rates continue to undergo downward pressure.
Down 12.2% year-over-year, the current reefer contract rate is $2.38 per mile, excluding fuel, while the current reefer spot rate is down 13% year-over-year to $1.92 per mile, excluding fuel.
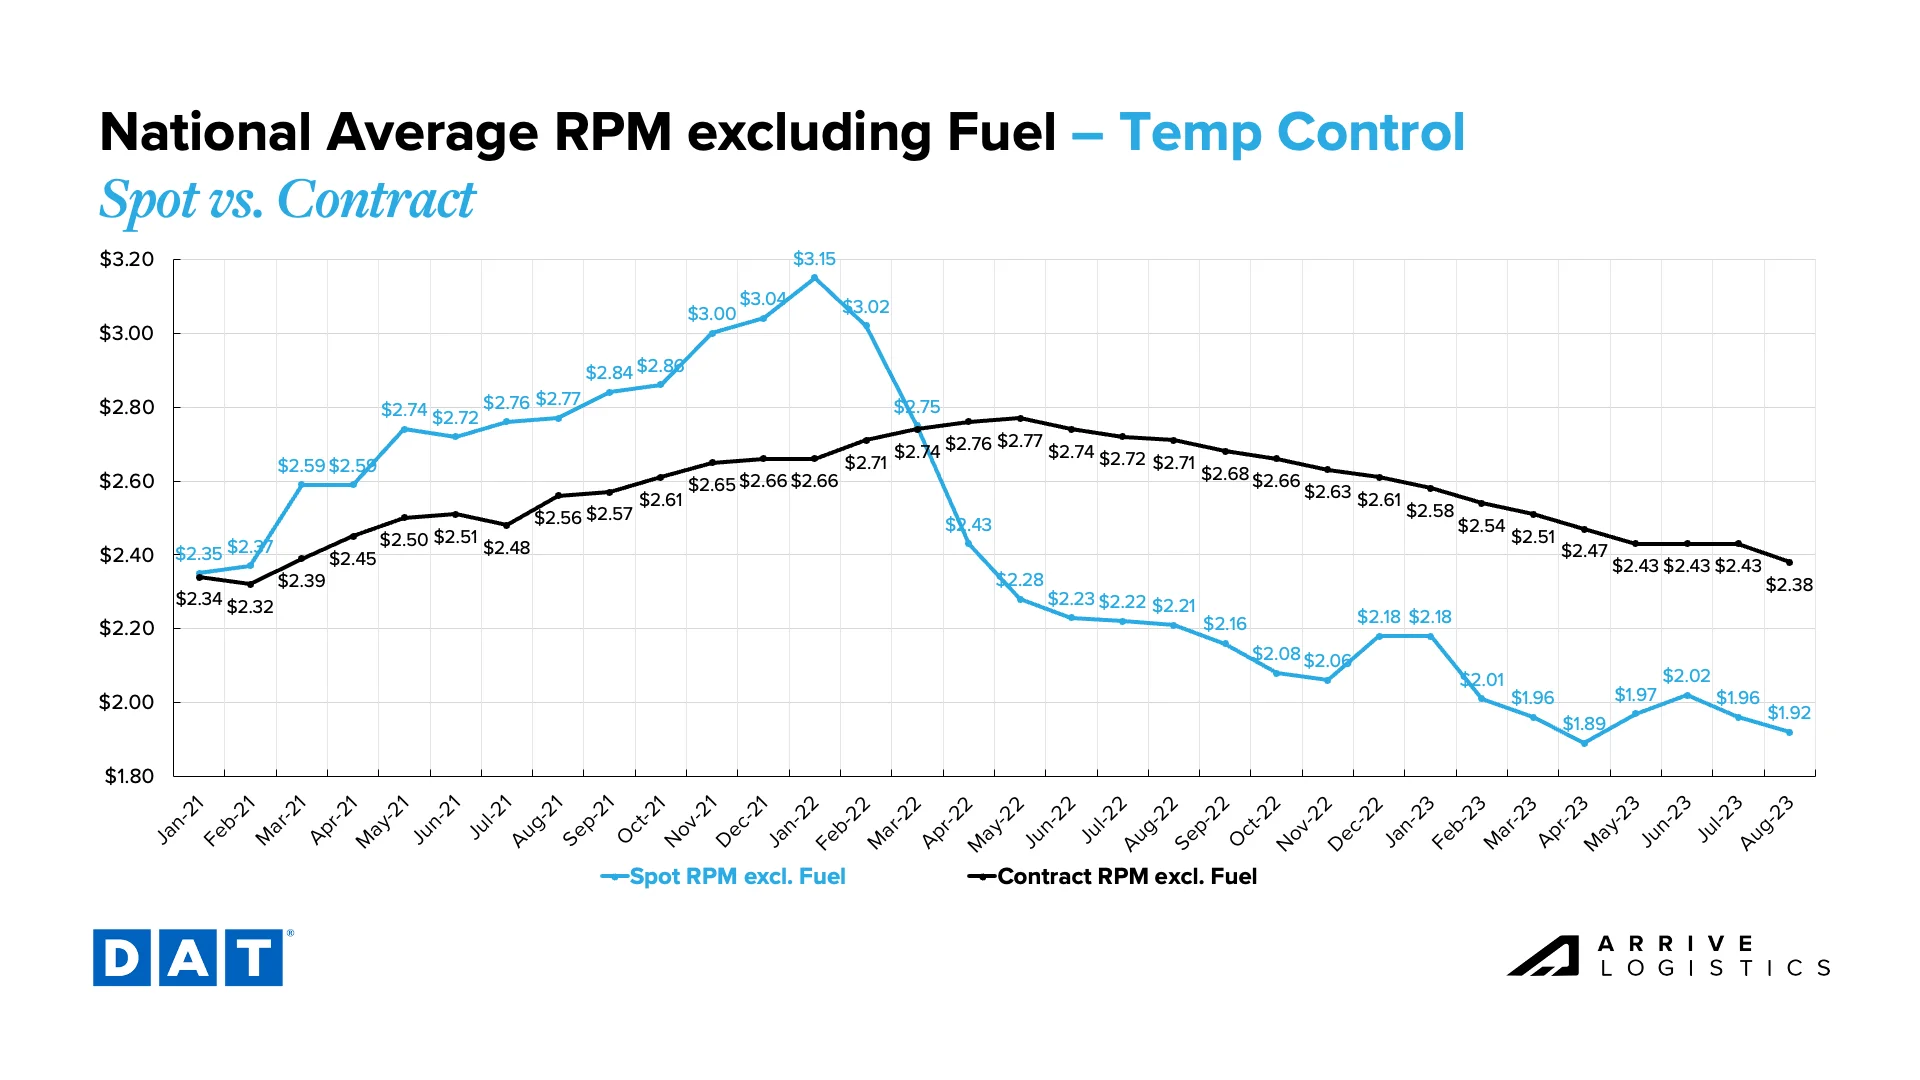 Figure 25: DAT Temp Control National Average RPM Spot vs. Contract
The data for outbound reefer rates shows that some markets experienced major increases over the past week. However, taking some of the readings with a grain of salt is important.
The most relevant callout from these week-over-week numbers is the outbound reefer rate increase from markets in and around Virginia. Roanoke and Alexandria markets had large week-over-week outbound rate increases as produce season continues to pick up and move northward along the East Coast. Rates out of Terre Haute, Indiana, also saw a large increase, likely driven by produce.
 Figure 26: Largest Reefer W/W Rate Increases
As expected, outbound reefer rates have started to drop in some regions. The Southeast’s produce season has started to wrap up and is reflected in the data. Rates out of Savannah, Georgia, Tallahassee, Florida, and Greenville, South Carolina, all had large week-over-week declines.
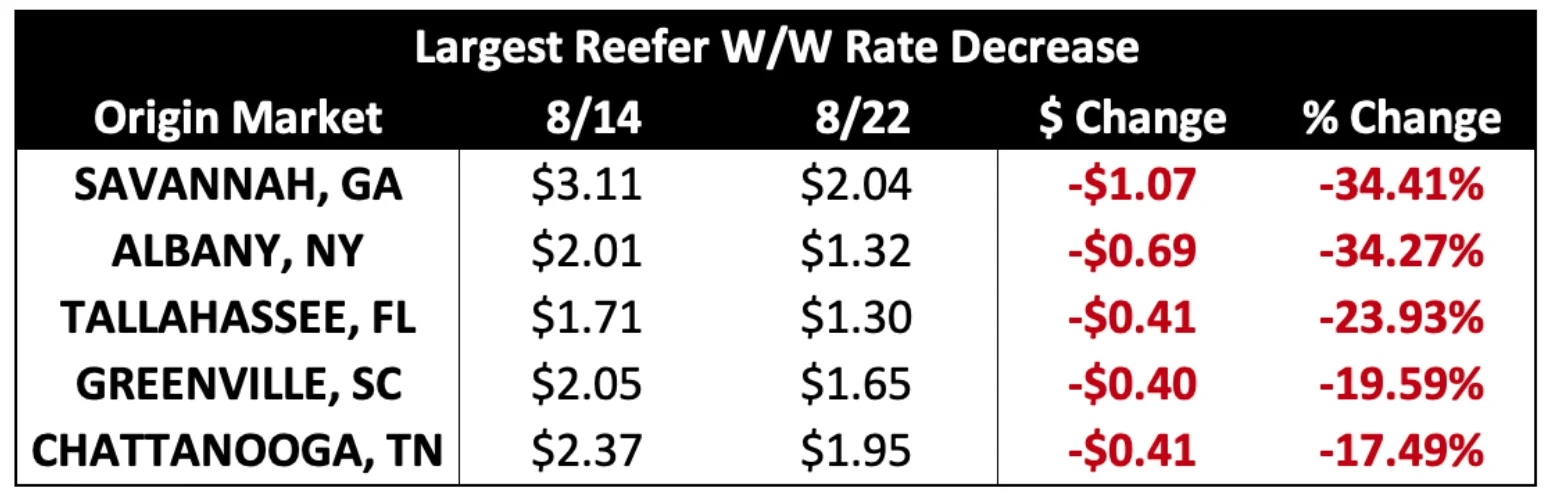 Figure 27: Largest Reefer W/W Rate Decreases
After stabilizing in the first half of 2023, flatbed rates have rapidly declined recently. Despite contract rates falling, the spot-contract gap is still widening and is back to over $0.70 per mile after dipping to a low point of $0.58 in April. In August, spot rates are currently at $1.91 and contract at $2.62 per mile, excluding fuel.
 Figure 28: DAT Flatbed National Average RPM Spot vs. Contract
July CPI data showed that inflation picked back up slightly after slowing for twelve consecutive months, rising to 3.2% year-over-year growth. However, core inflation, which excludes food and energy, fell from 4.8% to 4.7% year-over-year. Some key components continue to see reductions month-to-month, including new and used vehicles and airline fares. The largest single increase was fuel.
When considering what this means for the next decision on interest rates, the data points to plenty of reasons to be optimistic that the Fed will hold off on another rate hike and potentially signals that we are at, or are very close to, the peak for interest rates.
Ultimately, slowing or reversing course on rate hikes positively affects future freight demand. Lower interest rates would almost certainly mean increased housing activity and capital investment in manufacturing, two sectors that contribute meaningfully to freight demand and are currently slumping.
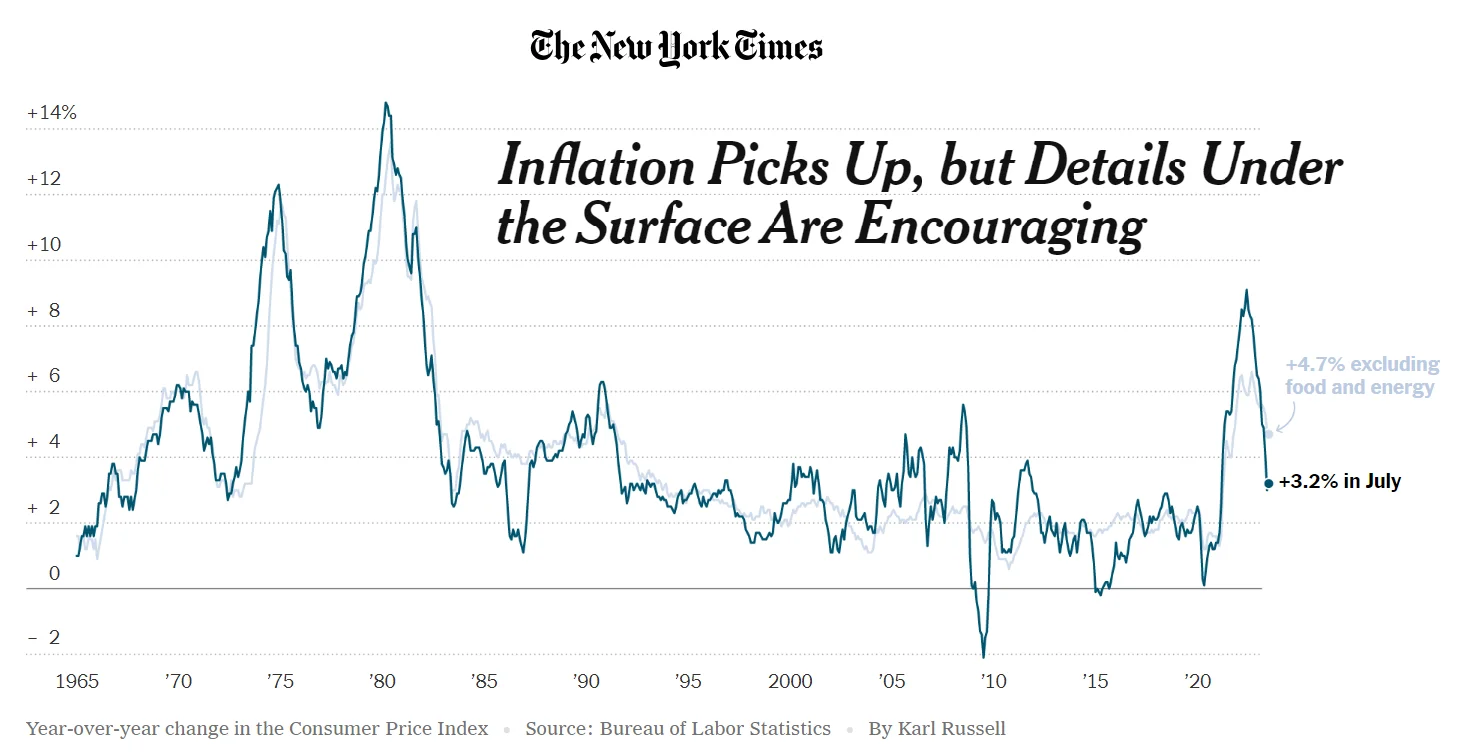 Figure 29: New York Times Inflation Data
Diesel prices have increased sharply following several months of steady declines. An overall production decrease amid record demand caused the abrupt rise in diesel prices. Production cuts in Saudi Arabia and other OPEC countries and extreme heat in the Southern U.S. that prevented local refineries from operating at maximum efficiency were key factors in the supply challenges. While fuel prices did level off during the week of August 14th, they will likely rise again over the next month due to strong demand heading into Labor Day weekend.
 Figure 30: National Average Diesel Rates & DAT Fuel Surcharge RPM


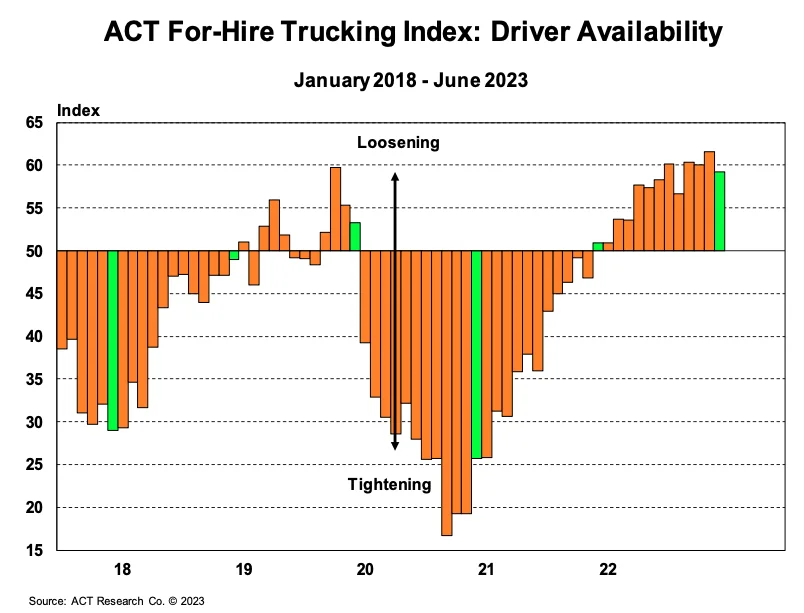 Figure 16: