


The Morgan Stanley Dry Van Freight Index is another measure of relative supply; the higher the index, the tighter the market conditions. The black line with triangle markers on the chart provides a great view of what directional trends would be in line with normal seasonality based on historical data dating back to 2007.
Conditions were relatively stable throughout the first half of November before ticking up in the second half. This was in line with seasonal directional trends but remains below the 10-year average, indicating that supply is still largely sufficient to support current demand.
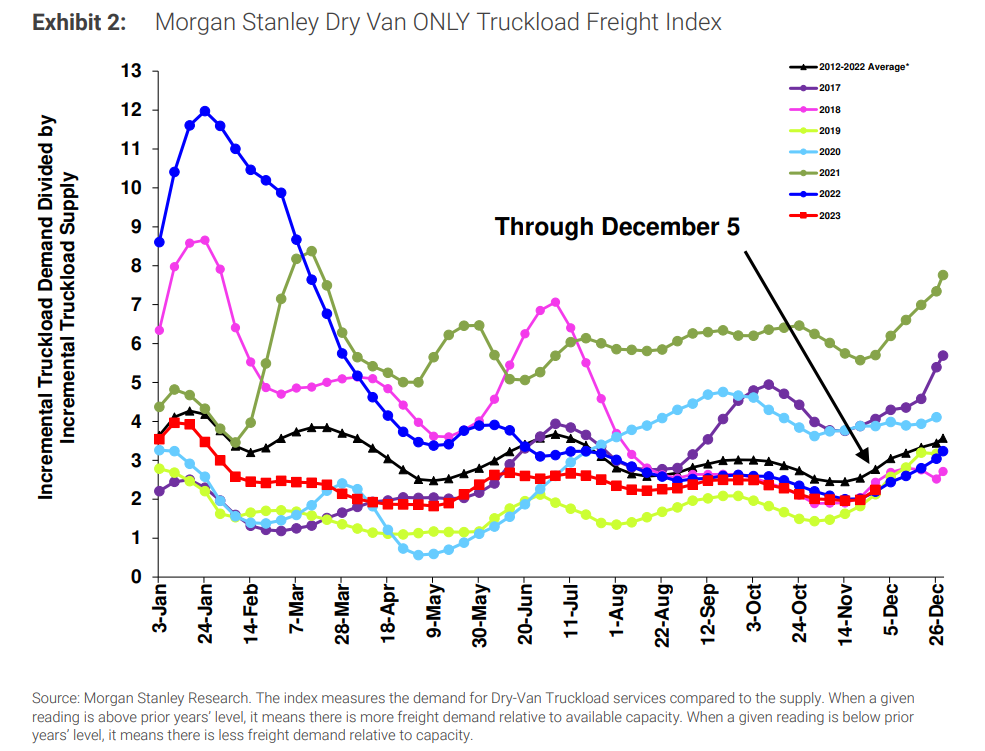
Figure 1: Morgan Stanley Dry Van Truckload Freight Index
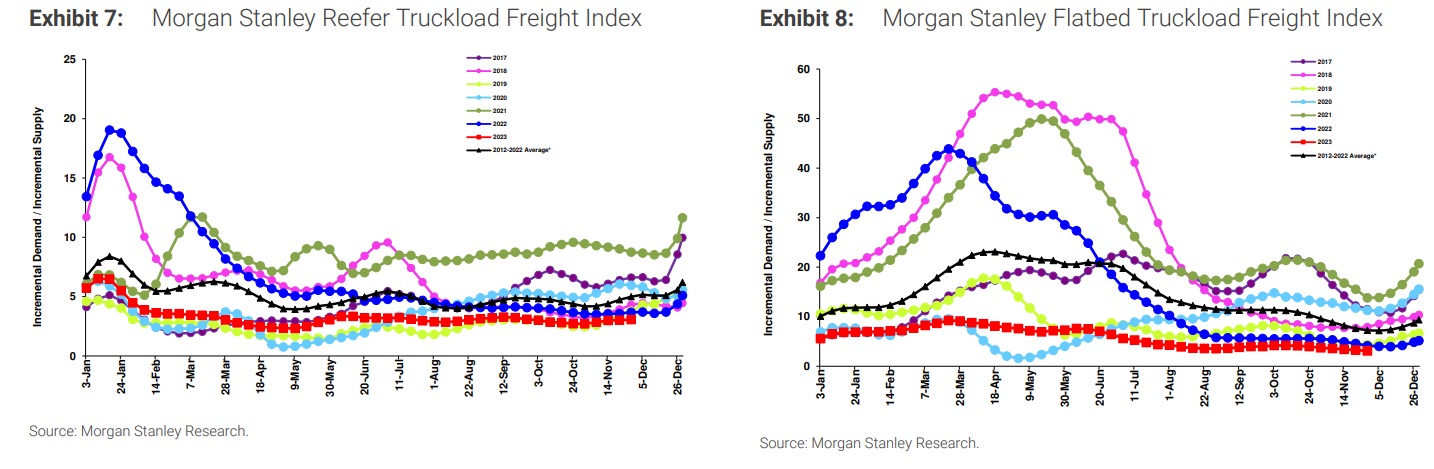 Figures 2 & 3: Morgan Stanley Reefer and Flatbed Truckload Freight Indices
In October, Arrive launched a new survey designed to help our team better understand the carrier experience in today’s market. The questions gauged carriers’ sentiment on various economic indicators and asked for their predictions on how the next 90 days will unfold. When questioned about the state of the market, over 50% of respondents reported that current conditions are relatively loose, and 25% said they are tight or very tight.
Those results changed when looking 90 days down the road — the consensus was market conditions would either look much like they do today or slightly tighter. 40% of respondents believe conditions will still be loose, and over a quarter say we will be experiencing intermediate conditions. 21% of respondents believe we will be in a tight market, while 12% expect very tight conditions.
 Figure 4: Current Market Conditions, Arrive Carrier Market Survey, October 2023
According to ACT’s Supply-Demand Index, conditions have tightened for three consecutive months after being loose for the previous 17 months. The most recent reading was down slightly to 52.4 from 52.8 in September, primarily caused by steady freight demand and capacity exiting the market. It’s important to note that this is only a directional measure, and the overall state of the market remains soft.
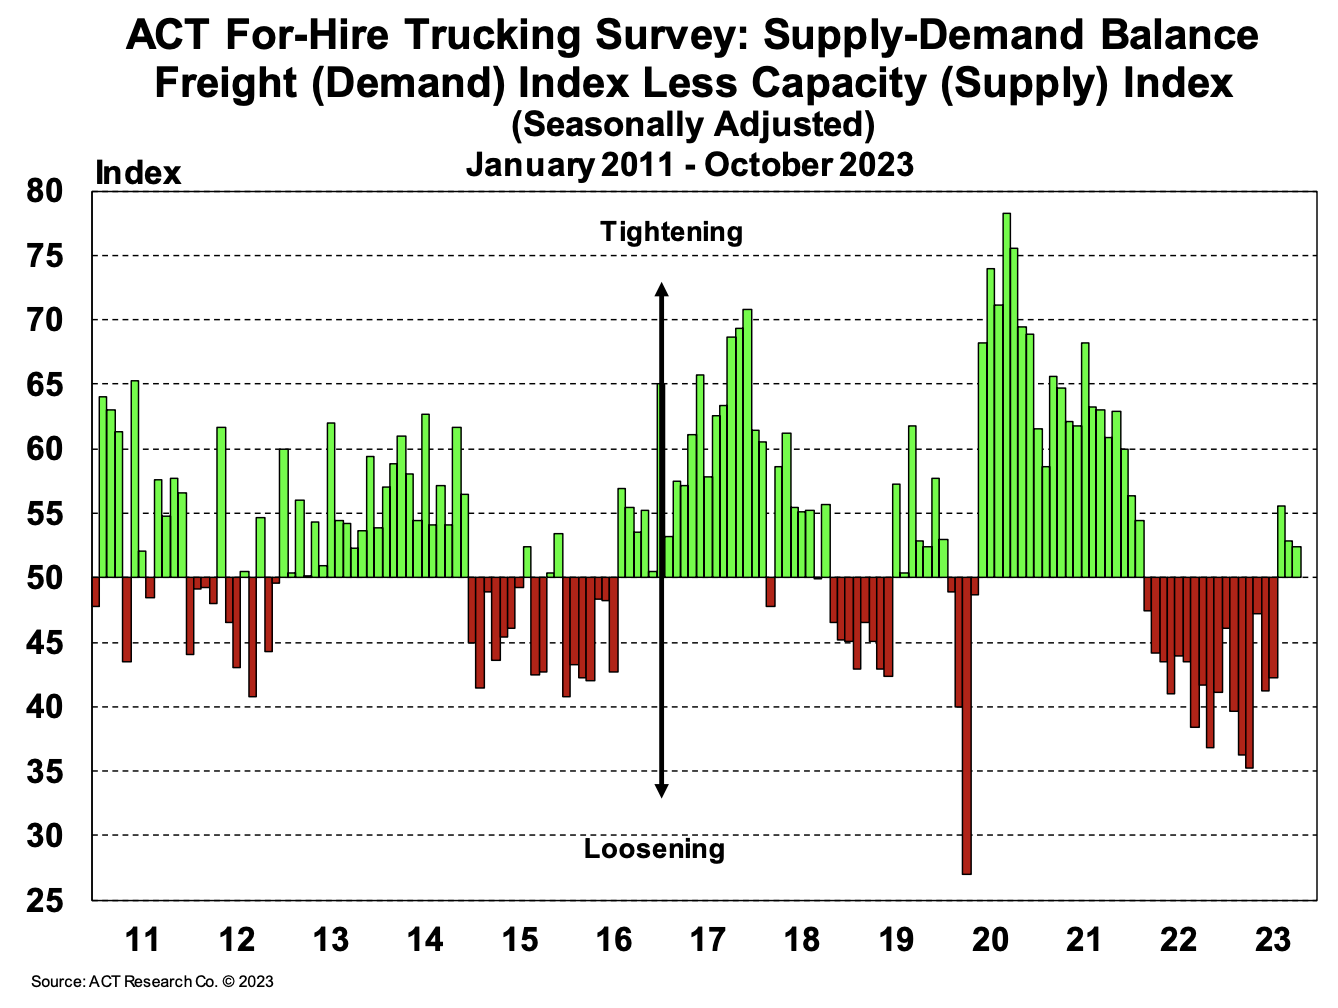 Figure 5: ACT For-Hire Trucking Survey
This holiday season indicates there is sufficient capacity to meet the demand. While there was some tightness around Thanksgiving, it was not as severe as in previous peak seasons. However, regional demand surges may lead to tighter conditions as we approach Christmas and New Year’s. By mid-January, conditions are expected to loosen as demand slows down and drivers return from time off.
Nationally, the dry van side shows softer conditions relative to the past five years. The reefer side saw a tender rejection spike in late November but has since declined after Thanksgiving. Reefer conditions remain relatively loose, though not as loose as last year.
The Sonar Outbound Tender Reject Index (OTRI) measures the rate at which carriers reject freight they are contractually required to take. The index briefly reached 4% around Thanksgiving before dropping below that mark, indicating that shippers’ compliance with routing guides on contractual freight is improving from already high levels. We anticipate some tightening as we approach the second half of the month and enter January of next year.
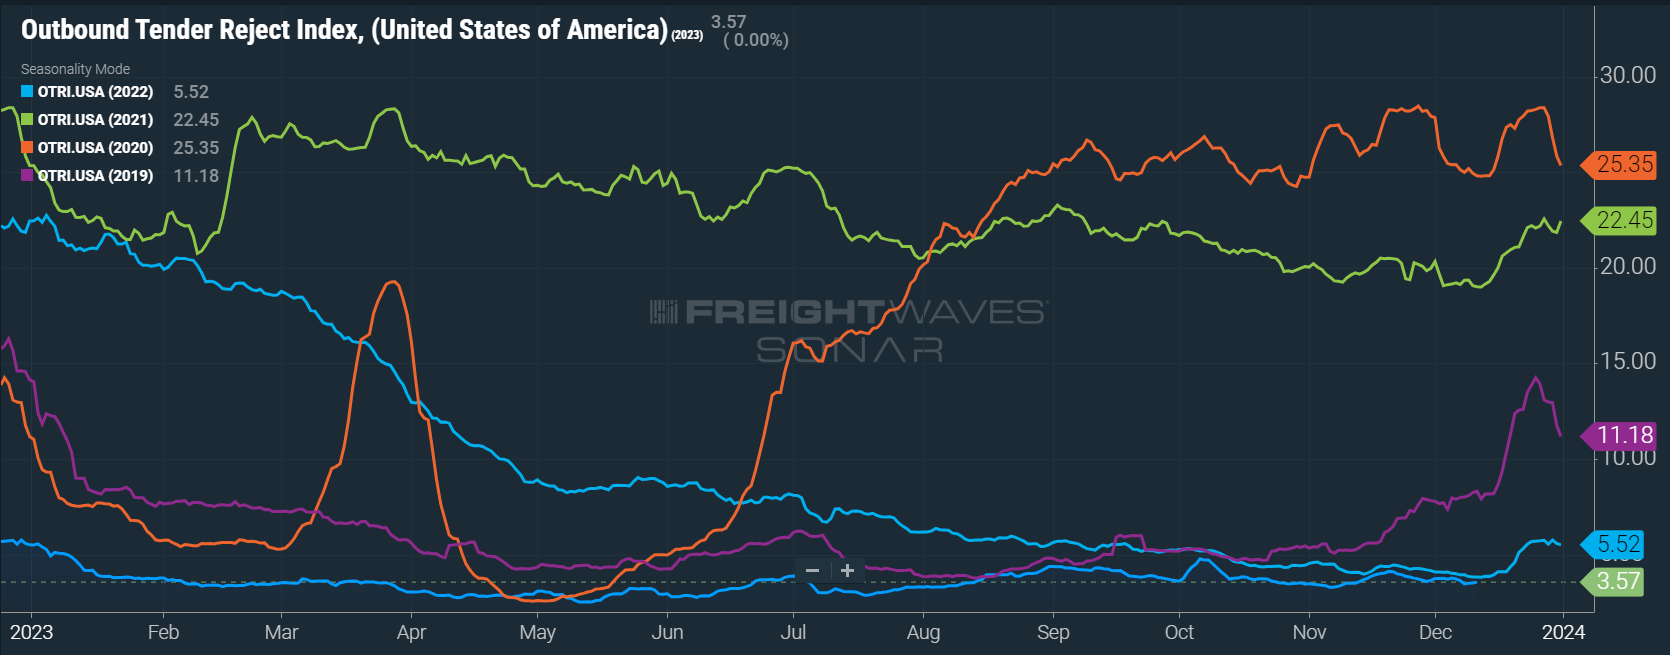 Figure 6: Outbound Tender Reject Index (SONAR)
Tender rejections on the Reefer side continue to follow a similar direction as van but with increased volatility. Reefer rejections briefly spiked to 11% ahead of Thanksgiving before declining and ending the month around 7.7%. The current value of 6.87% indicates better routing guide compliance than in November but tighter conditions than in December 2022.
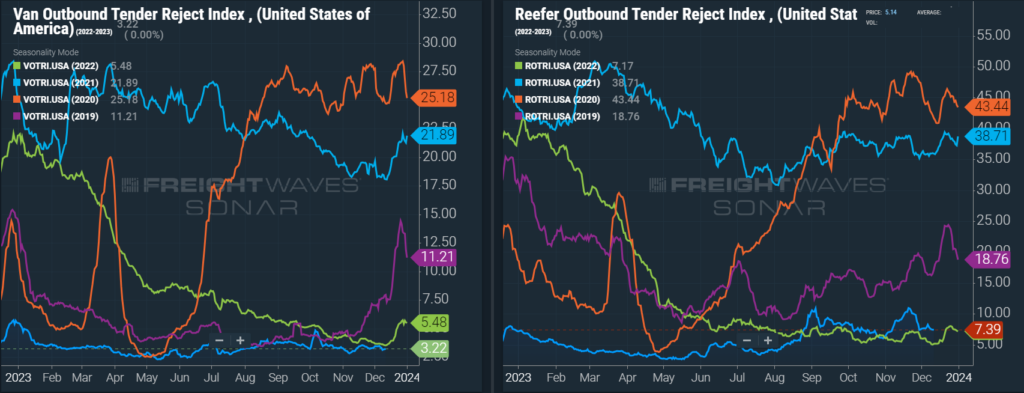 Figures 7 & 8: Van and Reefer Outbound Tender Reject Indices, SONAR
The FreightWaves SONAR Outbound Tender Volume Index (OTVI), which measures contract tender volumes across all modes, was up 9.6% year-over-year, or 10.0% when measuring accepted volumes after the significant tender rejection rate decline.
Accepted volumes were up 11.1% month-over-month as of early December, driven by a 9.9% increase in accepted dry van tenders and a 4.0% increase in accepted reefer tenders. This large jump was relatively unusual for this time of year and can be attributed to flat volumes in October and early November.
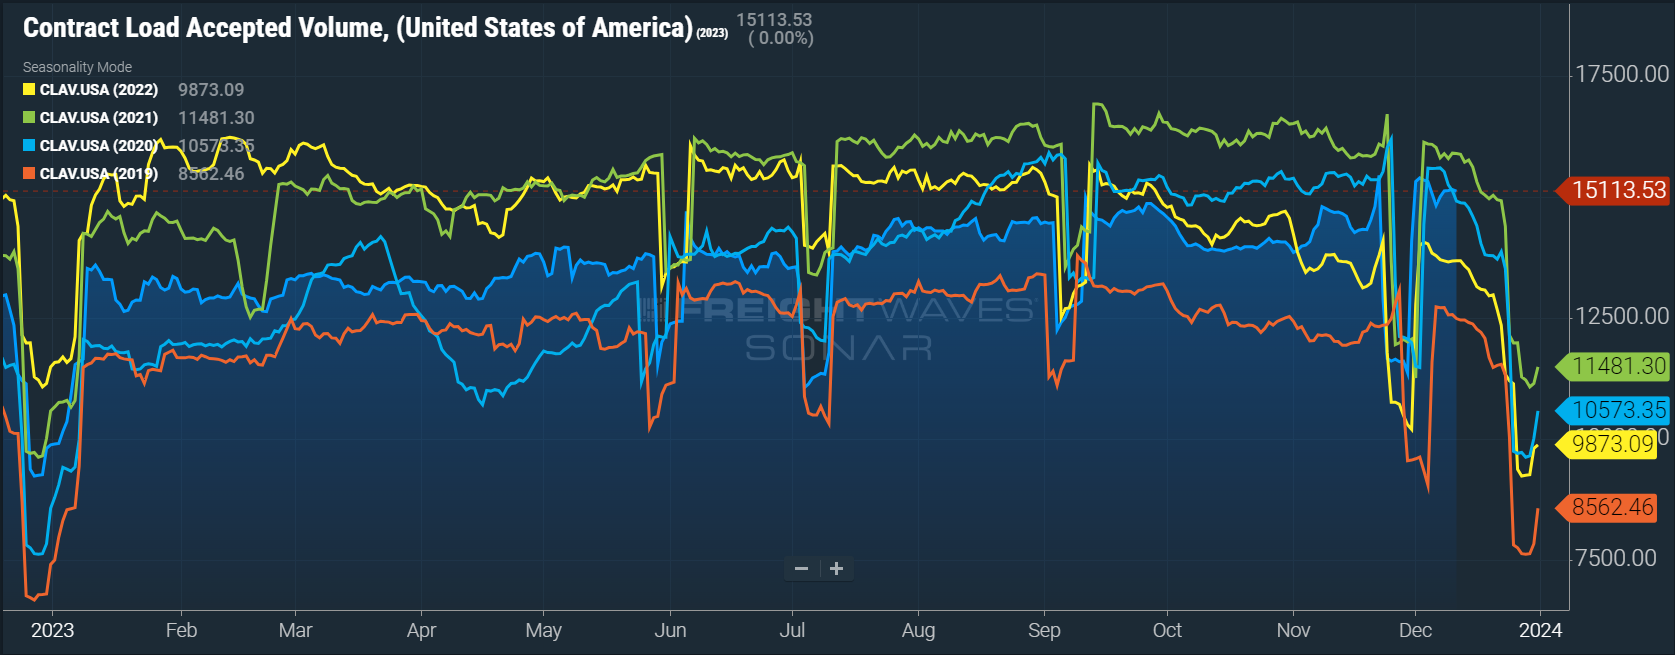 Figure 9: Contract Load Accepted Volume Index, SONAR
The DAT Load-to-Truck Ratio measures the total number of loads relative to the total number of trucks posted on their spot board. Despite a meaningful spot load decrease, November data showed relatively flat conditions on the van side and increased tightness on the reefer side.
The Dry Van Load-to-Truck Ratio ratio was up 0.2% month-over-month but down 21.2% year-over-year. The Reefer Load-to-Truck Ratio in November was up 7.2% month-over-month but down 36% compared to November 2022. These numbers align with what we experienced throughout the month, with van conditions relatively stable and reefer conditions slightly more volatile.
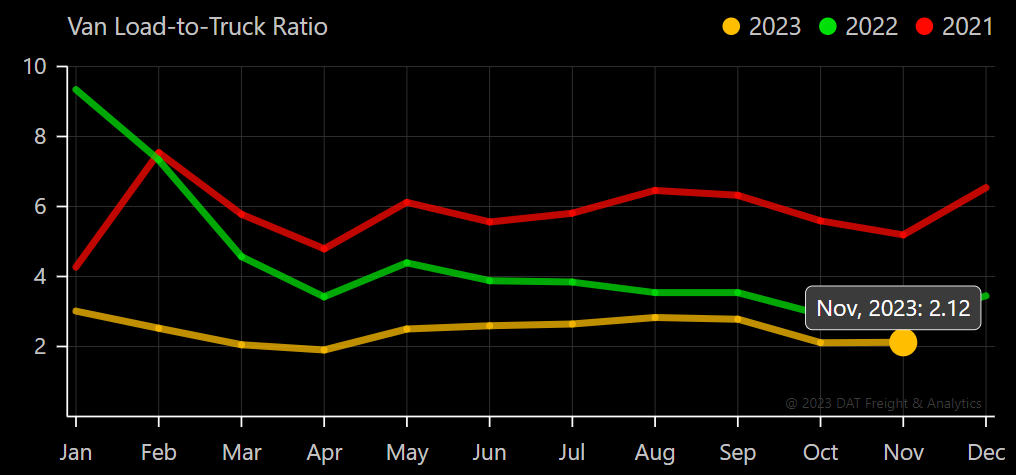 Figure 10: DAT Van Load-To-Truck Ratio
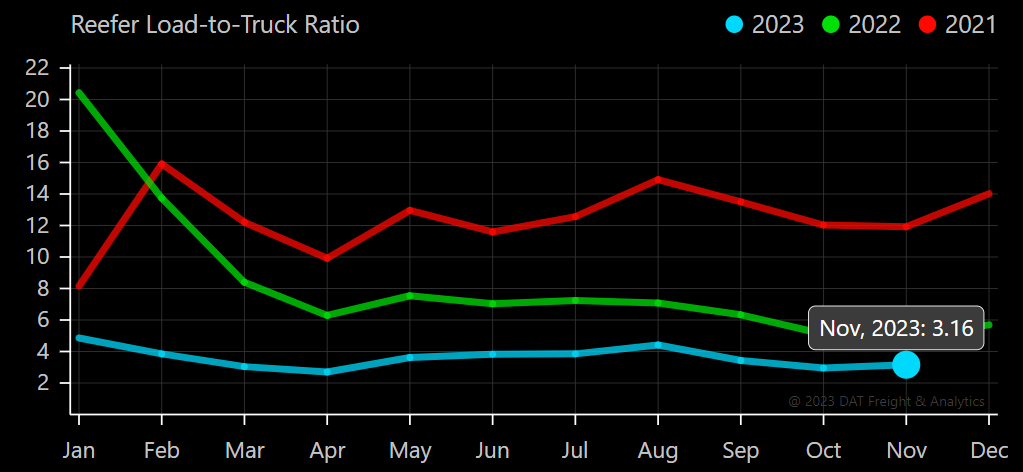 Figure 11: DAT Reefer Load-To-Truck Ratio
Spot rates remain well below where they were at this point a year ago. As a result, carriers with heavy spot exposure continue to see strong margin compression as operating costs stay flat. While recent fuel price declines are providing some relief to carriers, it is not enough to offset the rate drop observed over the past 18 months. Capacity continues to exit the market, but slower than in previous downcycles.
The slow exit rate is largely due to the fact that carriers running mostly contractual freight are still profitable despite market conditions. Smaller carriers and owner-operators are joining larger carriers to avoid complete exposure to the spot market.
Monthly revocations remain below the 2023 peak but well above historical trends. Monthly revocations in November are down from October but above August and September. The high number of revocations led to another month of decline in carrier population, shrinking by over 2,500 carriers.
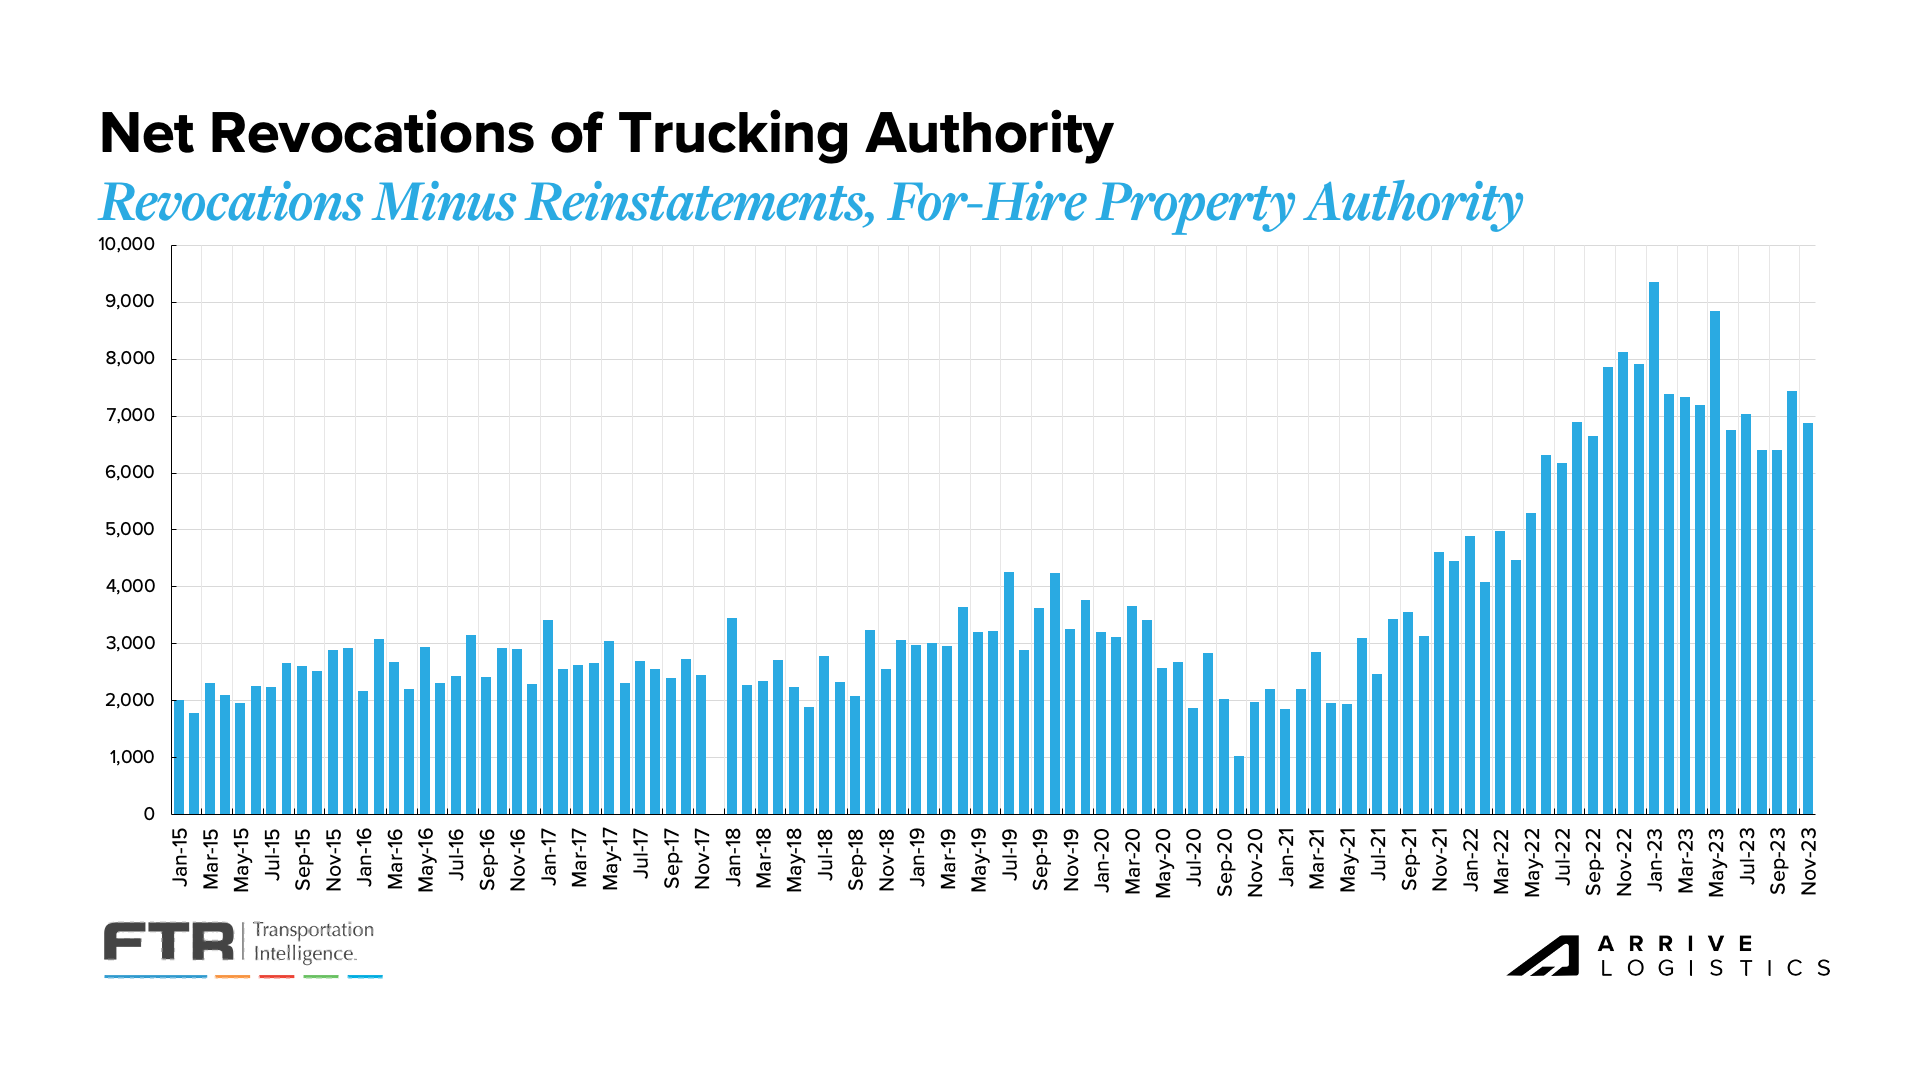 Figure 12: Net Revocations of Trucking Authority: FTR Analysis of FMCSA Data
A key trend we’re still watching is revocations outpacing new carriers entering the market for 13 of the last 14 months, reducing the total number of carriers. A significant amount of capacity that entered the market over the last few years remains under-utilized, so we expect this disparity to continue for at least the near term.
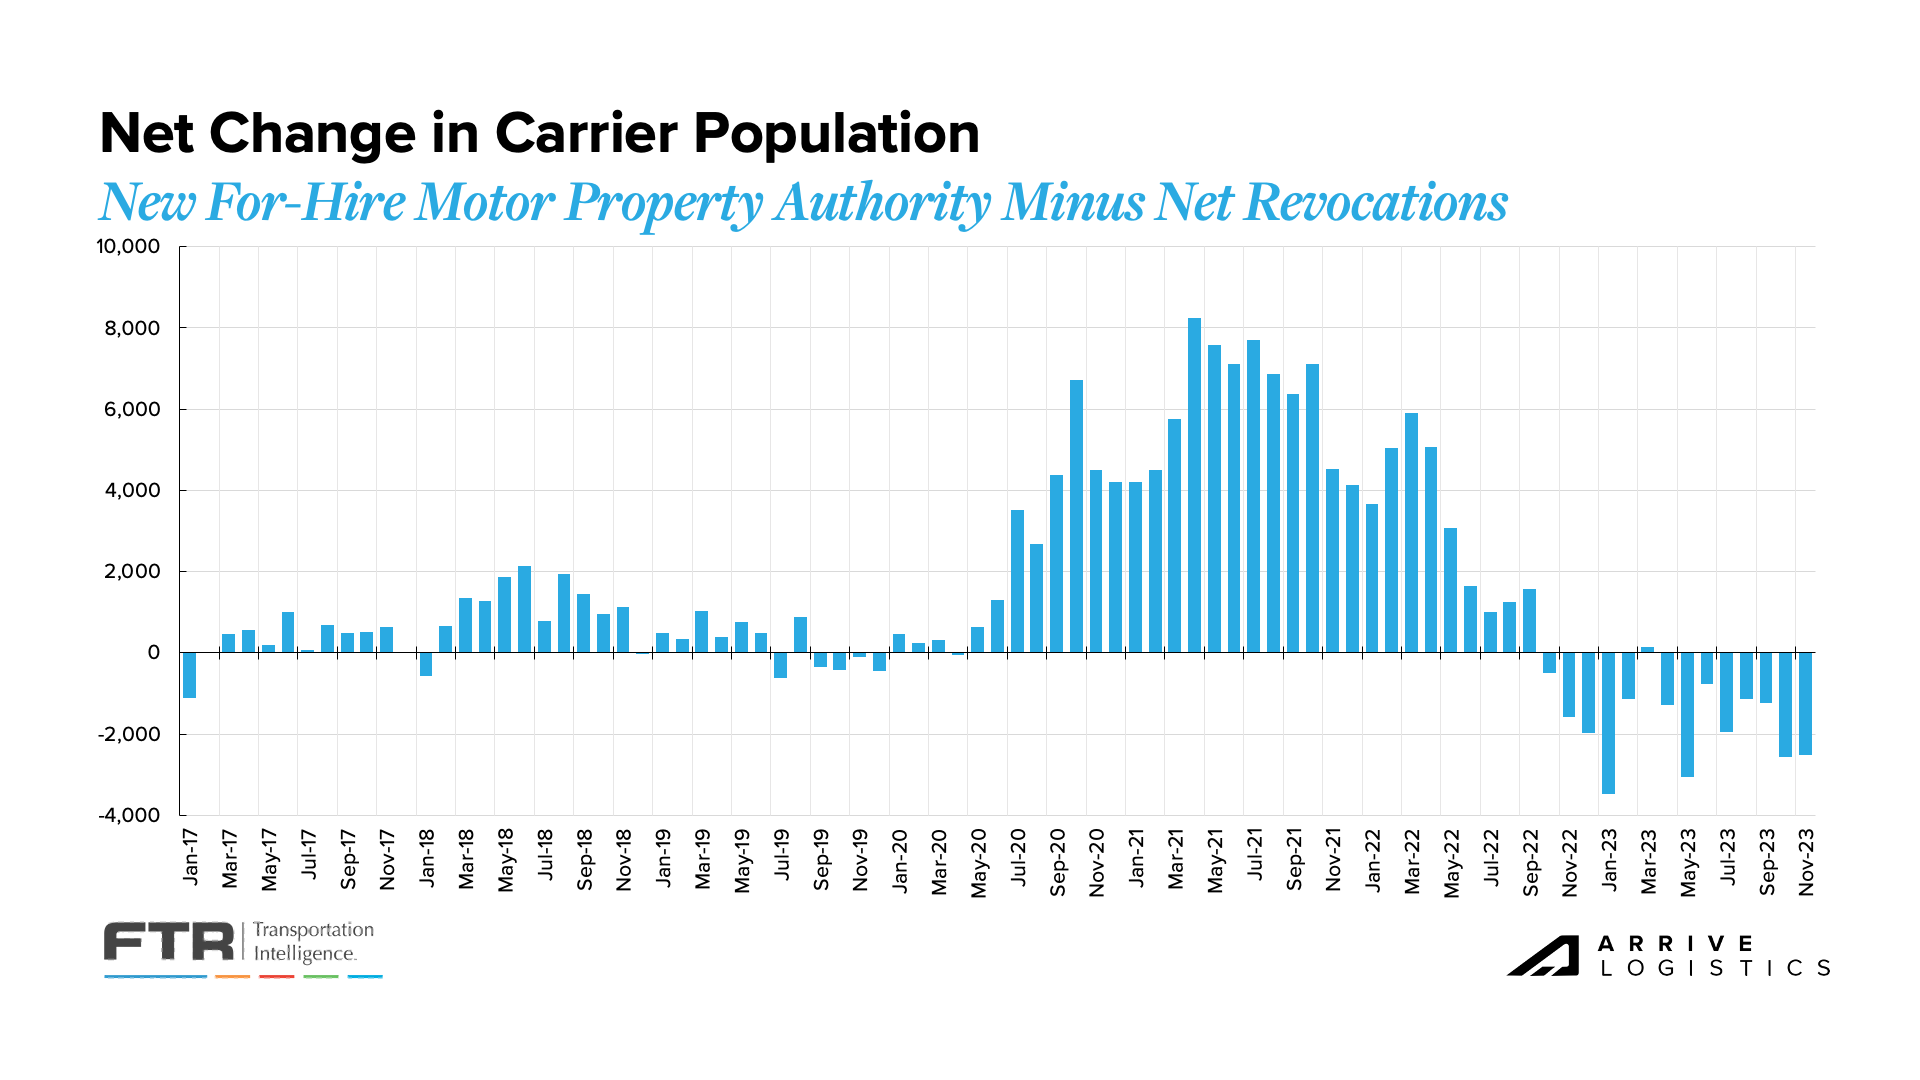 Figure 13: Net Change in Carrier Population: FTR Analysis of FMCSA Data
New equipment orders typically slow during freight recessions. However, as OEMs opened up 2024 build slots, carriers moved quickly to secure new orders. The past four months have seen some of the highest order volumes this year, with November’s report of 36,750 orders being the largest in 2023.
This trend likely points to the financial strength of larger carriers and private fleets’ ongoing investment in growth. While order levels were above the historical average, they did align with season trends. The increase in orders also represents the possibility of a much slower capacity reduction than in previous cycles. Overall, freight demand is healthy, so larger fleets are adding capacity to insource volume back from smaller for-hire fleets and owner-operators.
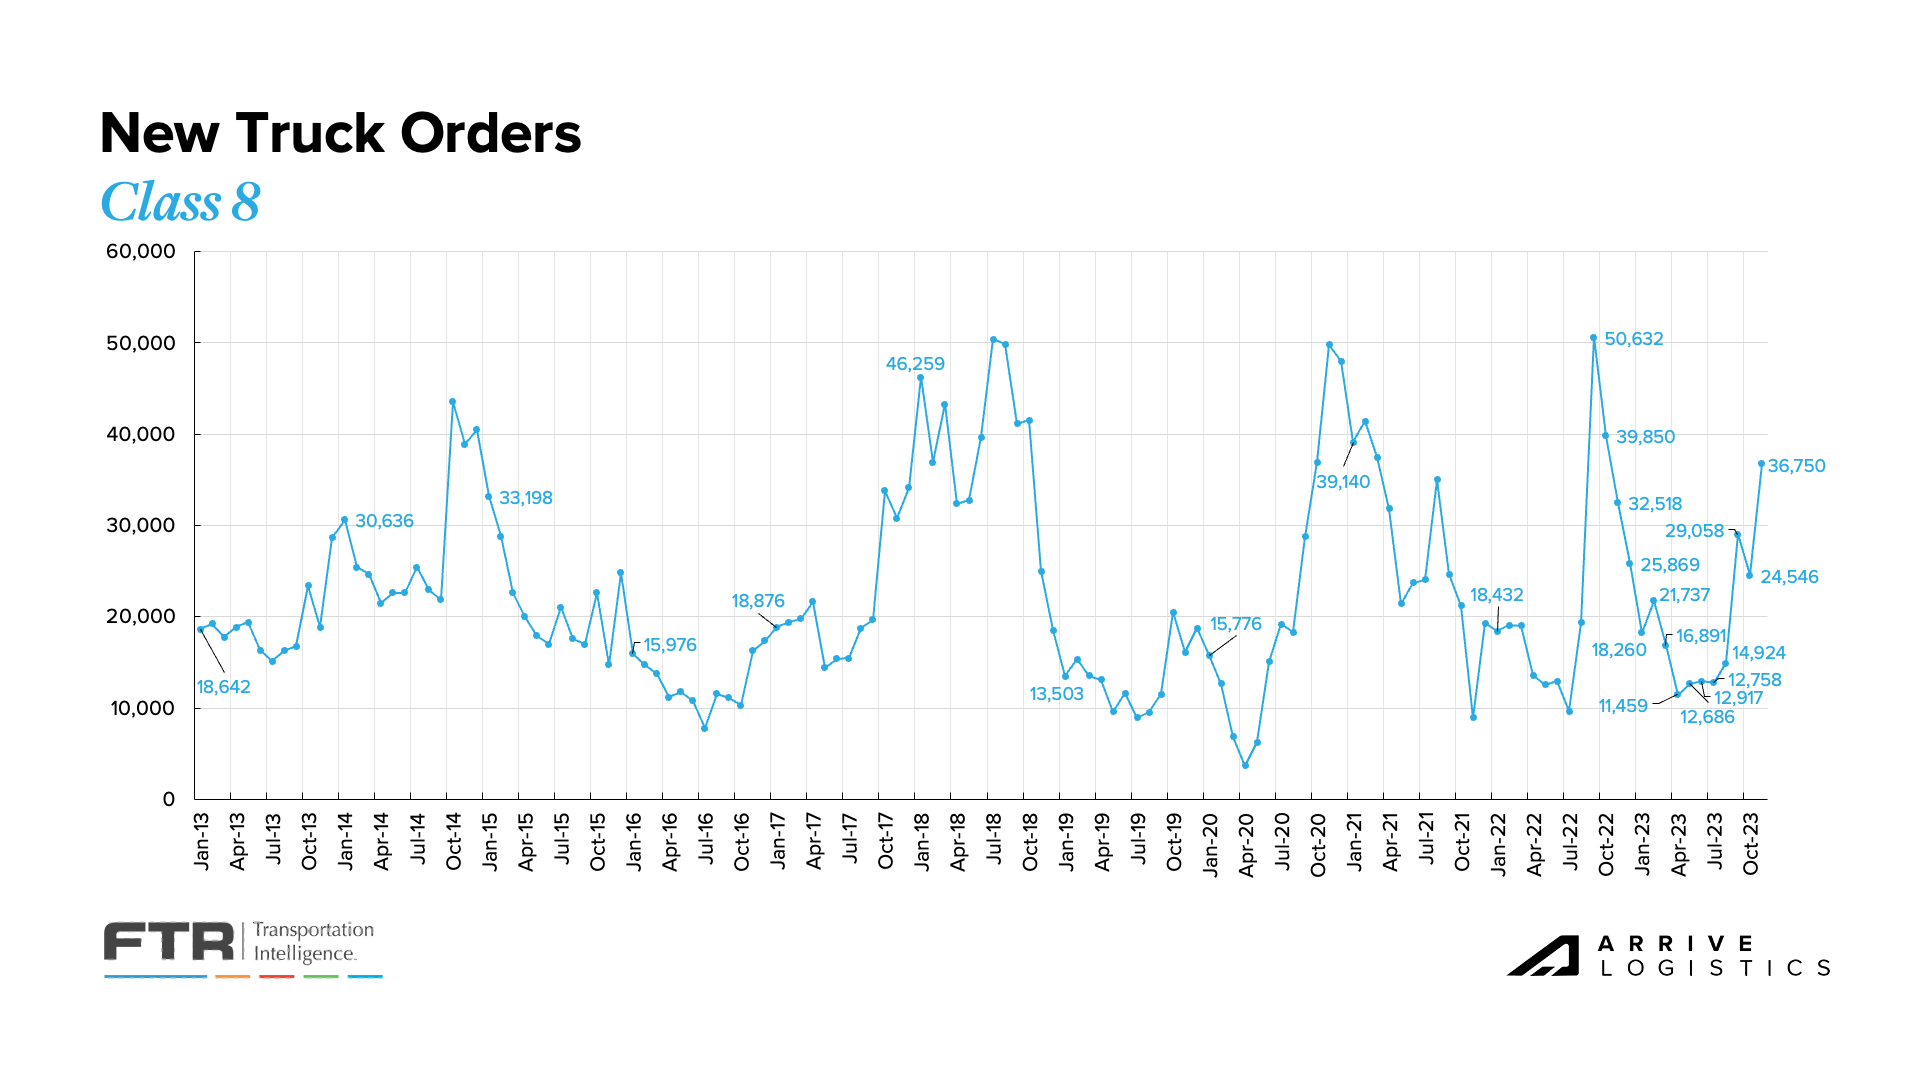 Figure 14: New Truck Order, Class 8: FTR Analysis of FMCSA Data
The Class 8 Backlog to Build ratio rose to 5.7 months in November, up from 5.5 months in October. The backlog steadily declined all year until September when it increased by 2,250 units. Backlogs will likely remain relatively flat over the upcoming months as more build slots open and get filled for 2024. A key trend to watch during this period is new truck orders being placed as more build slots open.
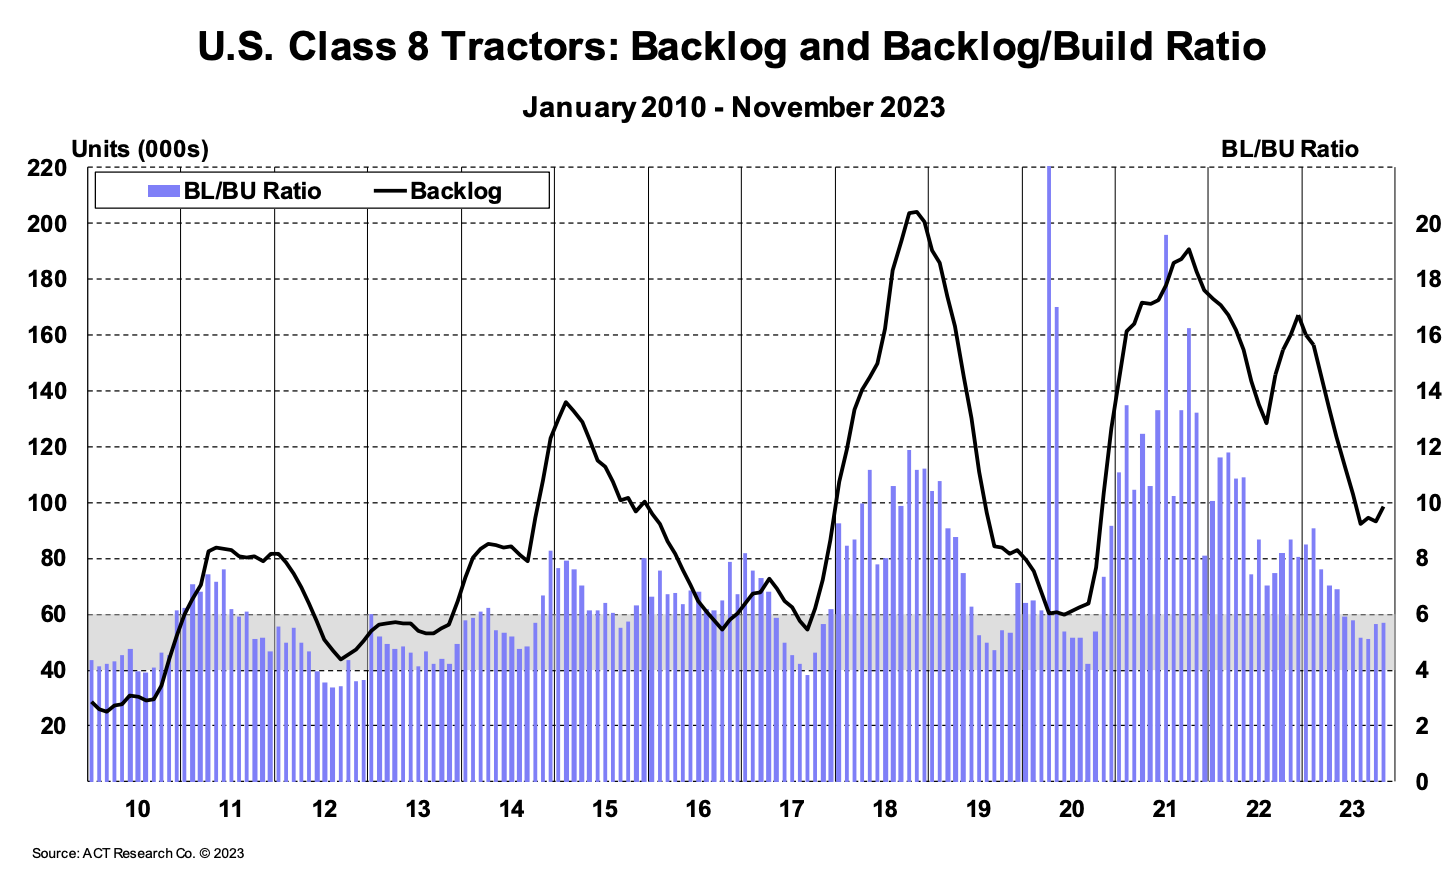 Figure 15: ACT U.S. Class 8 Tractors Backlog
ACT’s Driver Availability Index reached an all-time high of 62 in September before dropping by 6.8 points to 55.2 in October, marking the 17th consecutive month of loosening driver conditions. The primary driver of this trend is likely the influx of owner-operators joining larger fleets that have historically struggled with driver retention. Overarching challenges such as the retiring rate of drivers and FMCSA drug clearance remain prevalent.
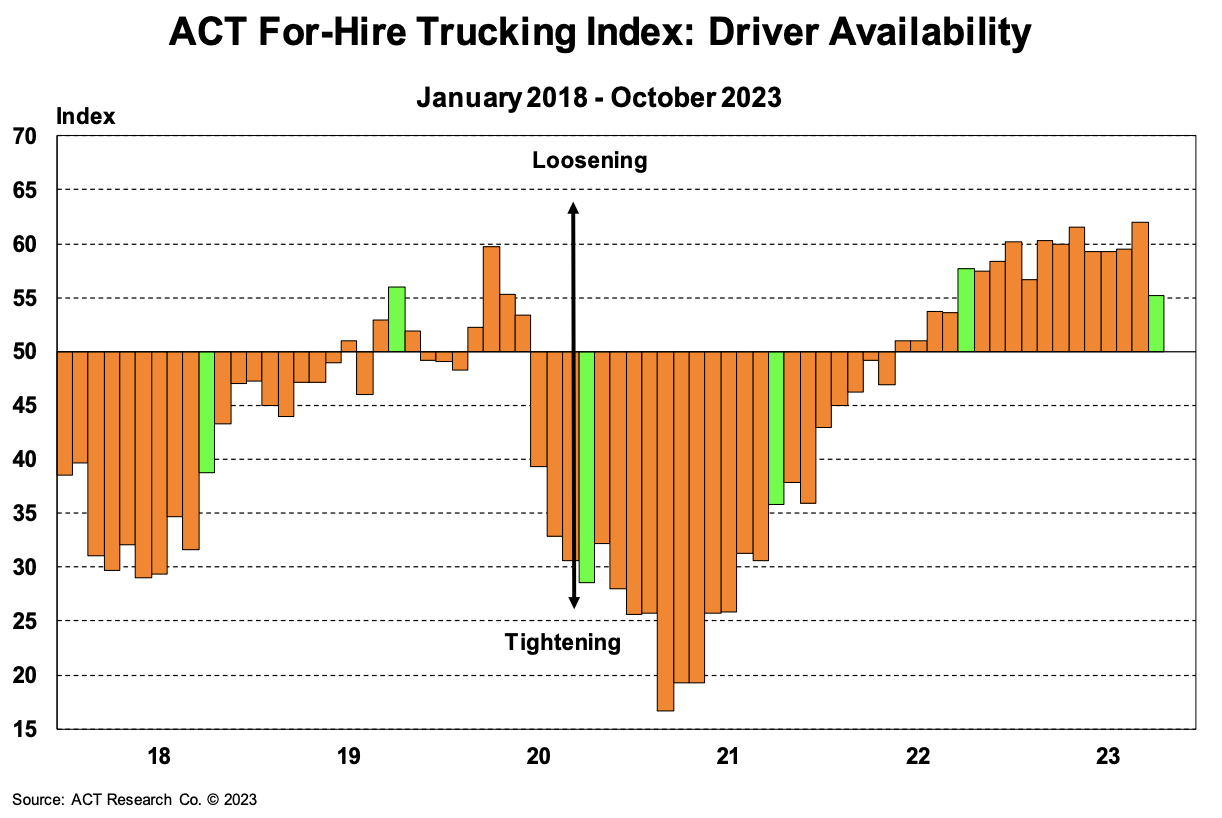 Figure 16: ACT For-Hire Trucking Index: Driver Availability
Our October survey asked carriers their opinion on the current truckload supply and what they believe it will be like in three months. 58% of respondents said that supply today is relatively balanced,16% said it is plentiful, and 30% said it’s limited. As for the three-month projections, a few more carriers said capacity will be plentiful compared to now — this is relatively in line with our expectations.
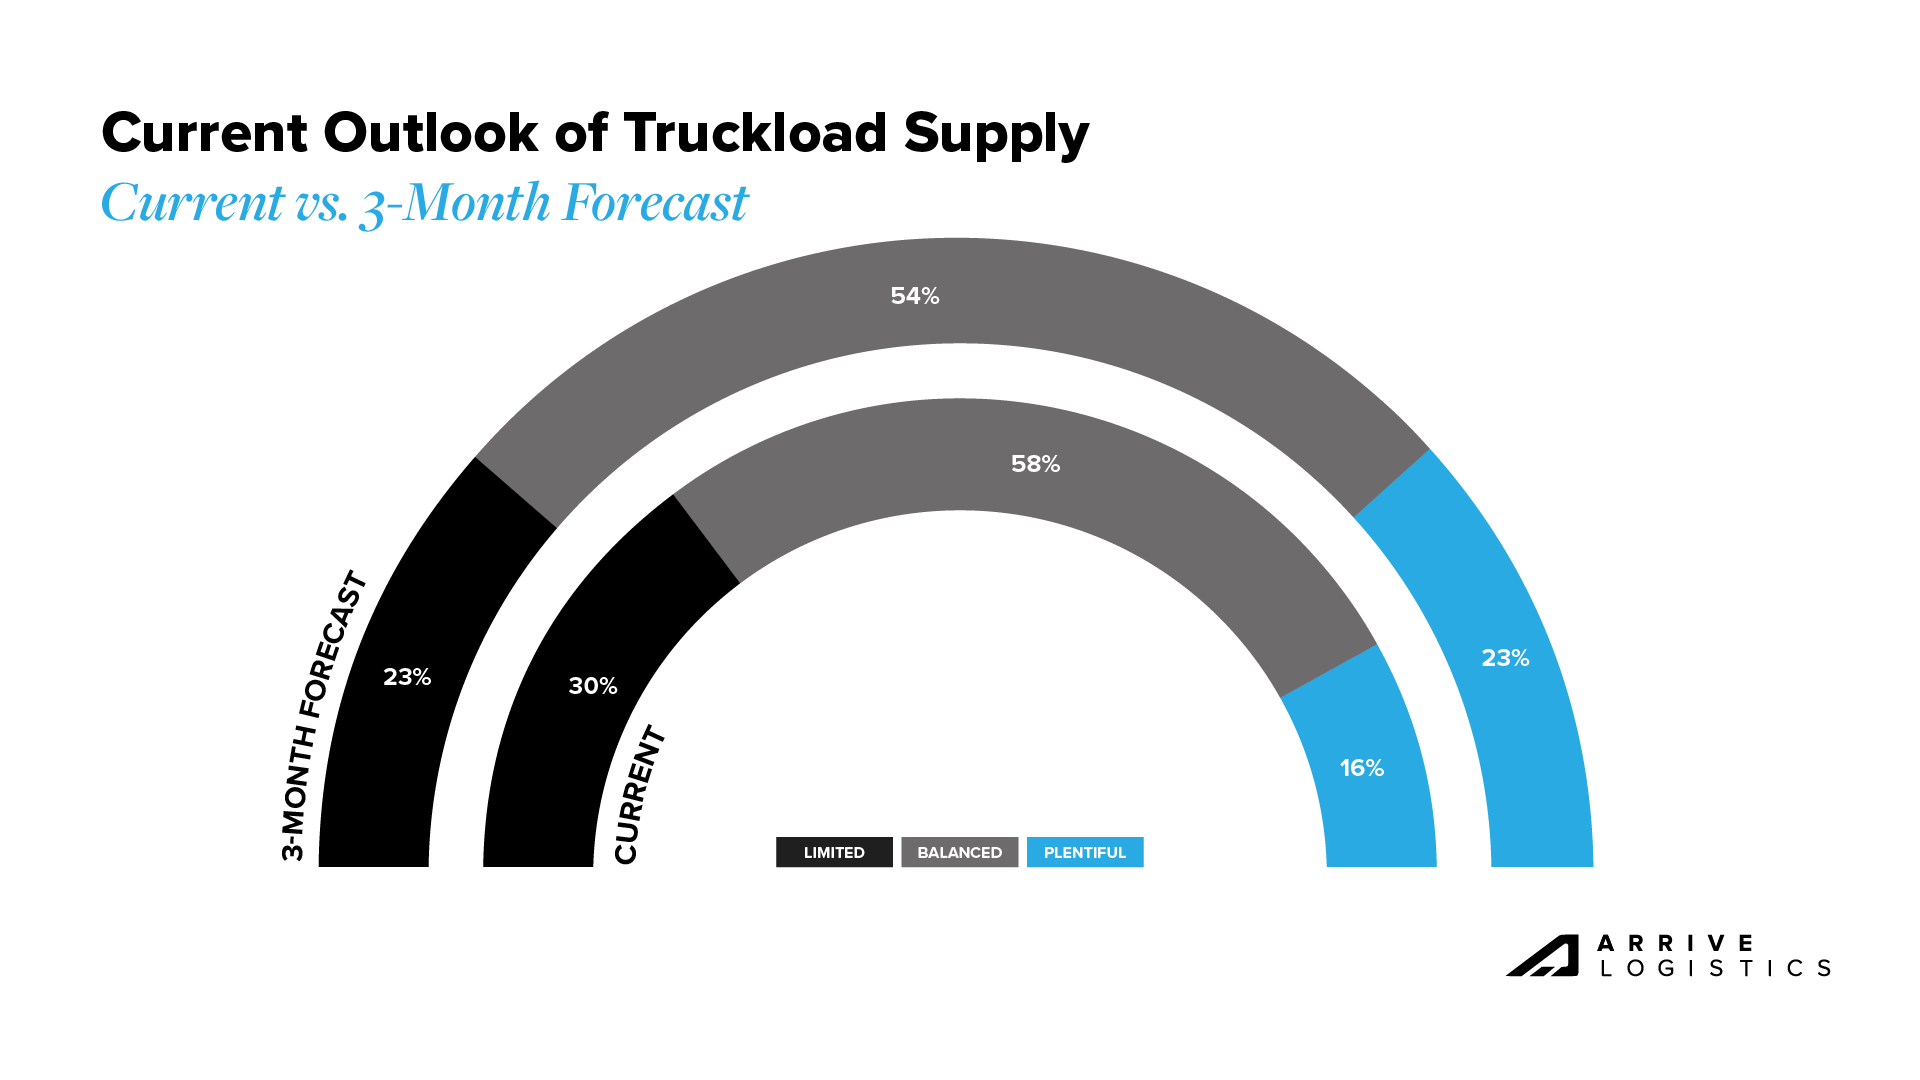 Figure 17: Current Outlook of Truckload Supply, Arrive Carrier Market Survey, October 2023
The survey also prompted carriers about current and future truckload demand. 47% of respondents said demand today is neutral, 32% reported weak demand, and 21% said demand is strong.
In their three-month forecasts, more than half (56%) of all respondents expect balanced conditions, and 26% expect strong demand. This aligns with our forecast that demand will increase through Q4, albeit muted compared to the past few years.
 Figure 18: Current Outlook of Truckload Demand, Arrive Carrier Market Survey, October 2023
Demand remains down year-over-year and will likely stay flat into early 2024. The overall strength of the consumer remains a focus from an economic perspective. The National Retail Federation (NRF) recently reported that imports peaked in October, which was later than the typical peak expected in August.
Imports in Q4 of 2023 remain above Q4 2022 levels, a sign that retailers may have been completing their destocking phase and were gearing up for the holidays. Downside demand risks remain, including concerns about manufacturing trends, how long strong consumer spending will continue, the potential impact of student loan payment resumption on 2024 housing and construction, and the possibility of an extended period of elevated interest rates.
If import volumes remain in line with the NRF forecast, we will see an 11.5% month-over-month jump in December imports, leading to increased freight movement heading into the last two weeks of 2023 and into early 2024. When all is said and done, the total number of imports in 2023 will be around 22.4 million TEUs, down 12.4% from 2022 and over 13% from the all-time high seen in 2021.
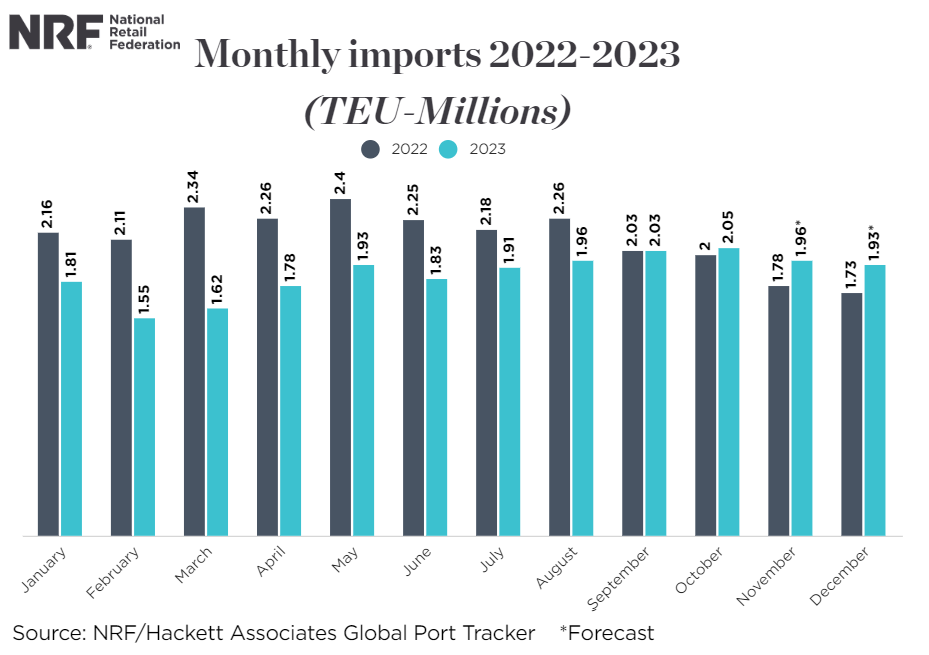 Figure 19: NRF Monthly Imports
November demand trends continued to reflect the trends that we have been experiencing for the majority of 2023. According to DAT, which reports exclusively on spot load trends, load postings were down 41.3% year-over-year and 12.8% month-over-month. Truck postings also have seen large declines, albeit not as large as the declines we have seen for load postings. Truck postings are down 18.4% year-over-year and declined by 10.9% from October to November.
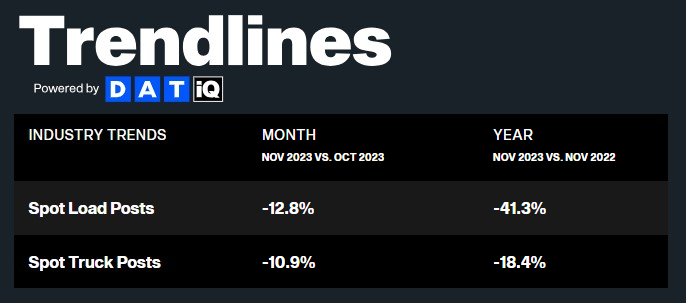 Figure 20: DAT Trendlines
Spot rates are stabilizing but remain well below operating costs for public carriers, which reported negative margins on spot loads for the third consecutive quarter. This trend will likely affect owner-operators and carriers with high spot exposure, potentially leading them to close or join larger fleets. Historically, there would be a rapid rise in spot rates when this occurs. However, capacity is still plentiful, indicating that conditions could remain rough in the near term.
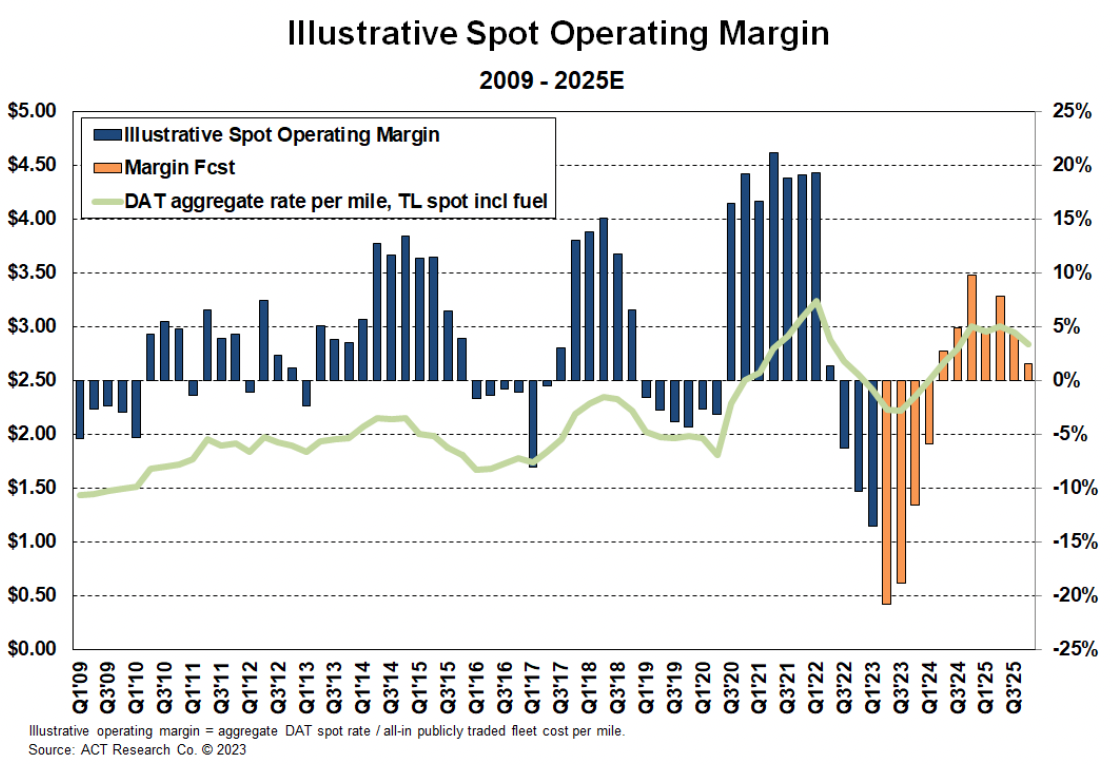 Figure 21: ACT Illustrative Spot Operating Margin
Carriers continue to experience margin compression as spot rates remain low amid high operating expenses. Net income margins in Q3 2023 remained below 5%. Q3 was also the fifth straight quarter where carriers had declining year-over-year margins. As we move through this oversupplied market, conditions will likely stay challenging in the near term and into early 2024.
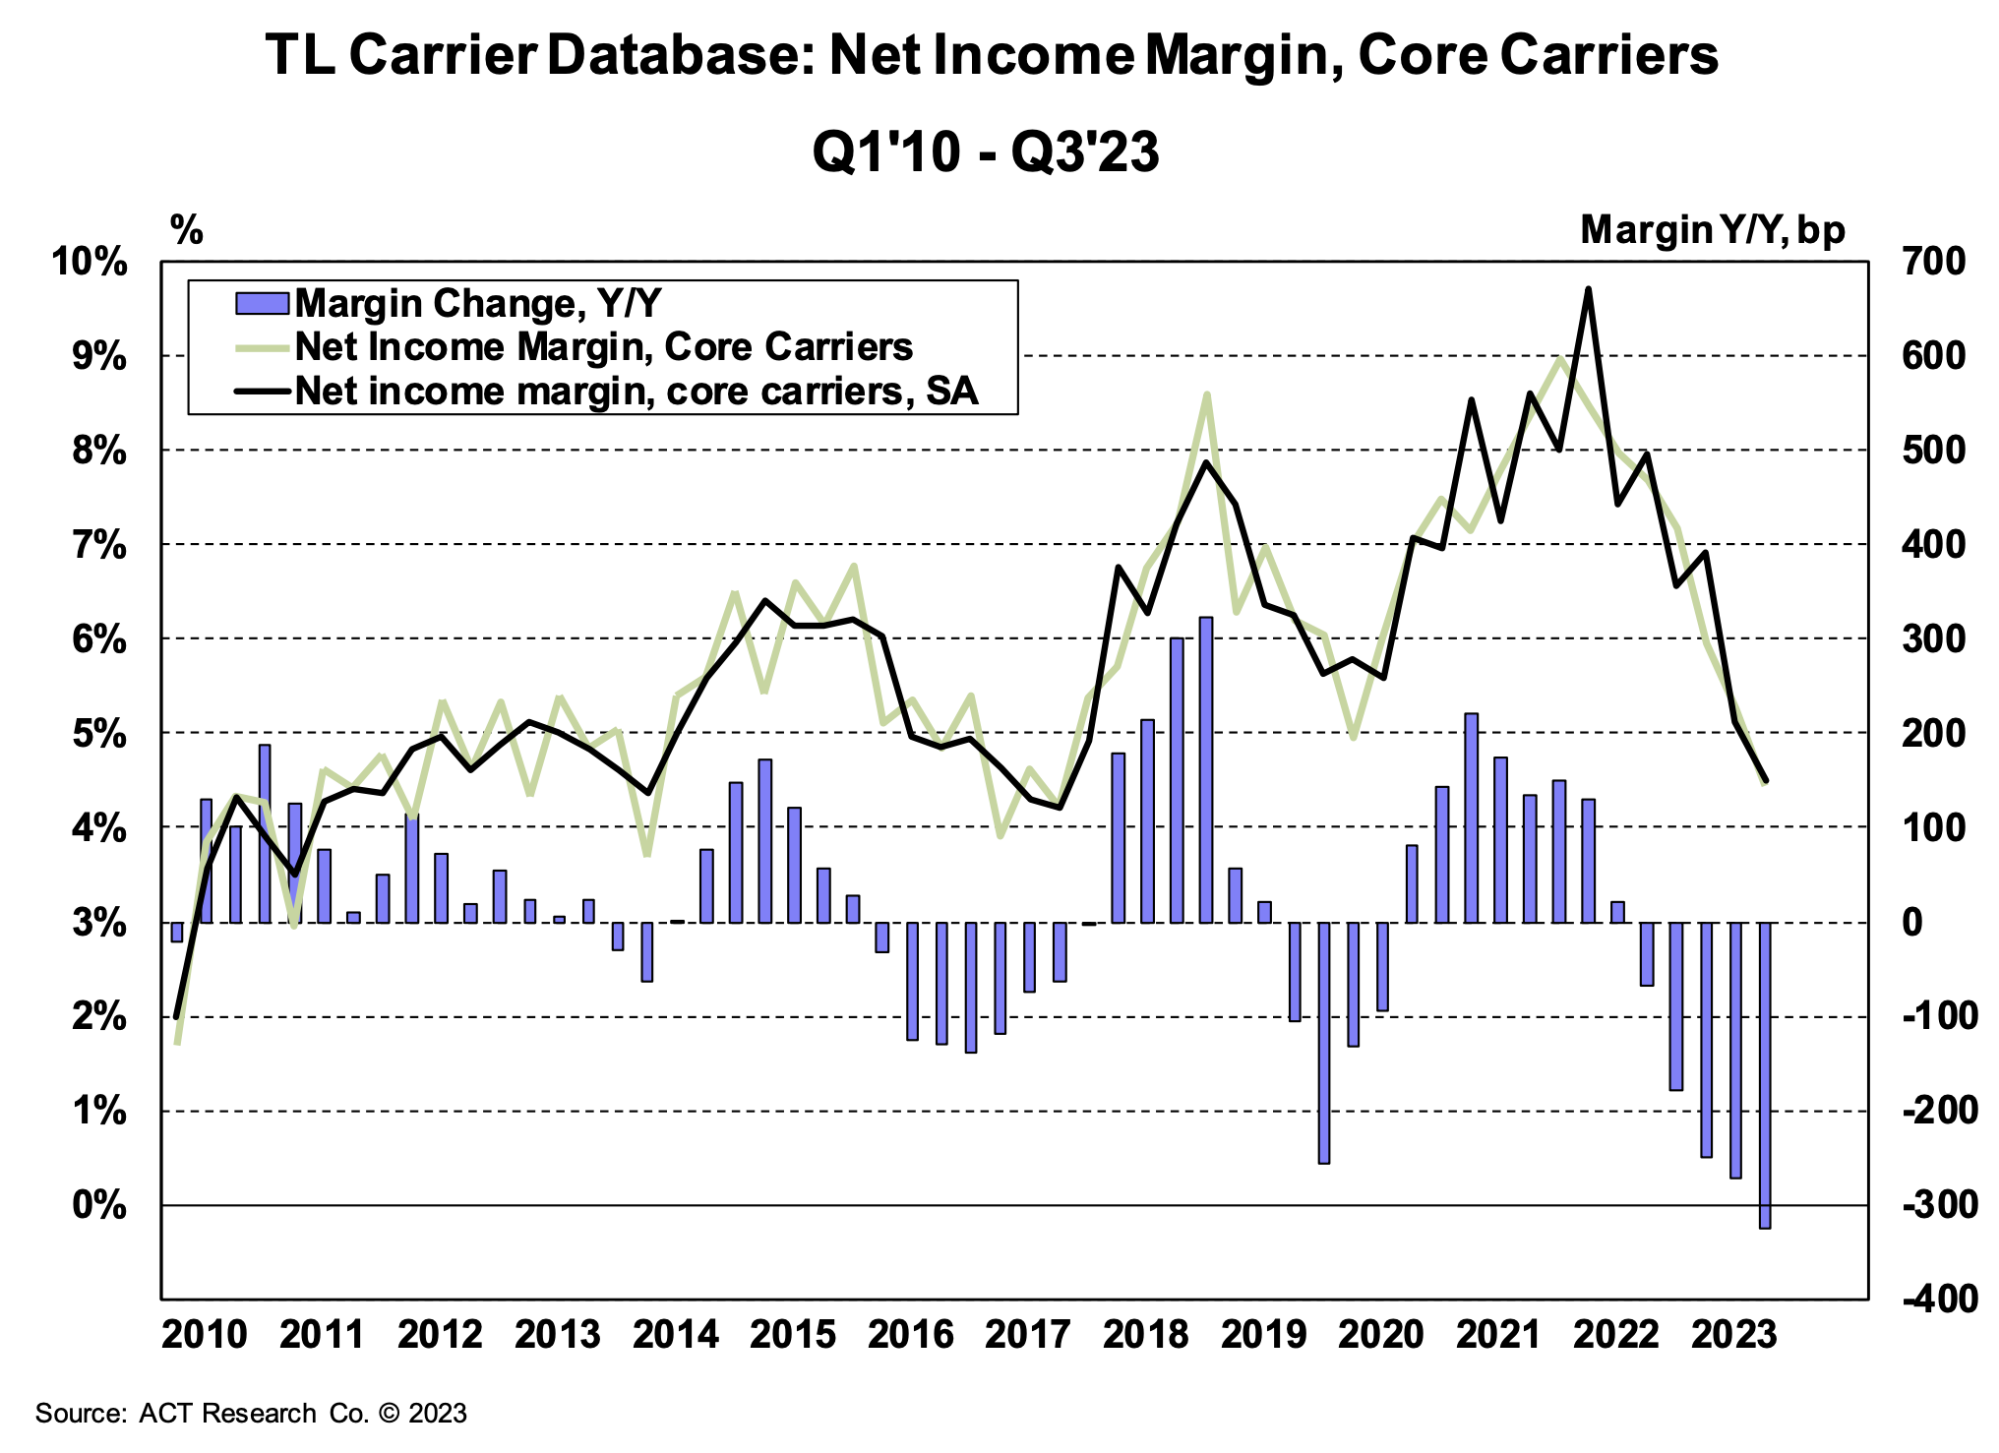
Figure 22: ACT TL Carrier Database, Net Income Margin, Core Carriers
According to financial data from large public carriers, operating revenue per mile has continued to fall faster than the cost per mile, decreasing operational margins to pre-pandemic levels. Despite the sizeable margin decline, large asset carriers are still in a relatively healthy financial position due to having enough contract freight to limit spot market exposure. On the flip side, owner-operators and smaller fleets are seeing more margin compression and closing or joining larger fleets to stay on the road.
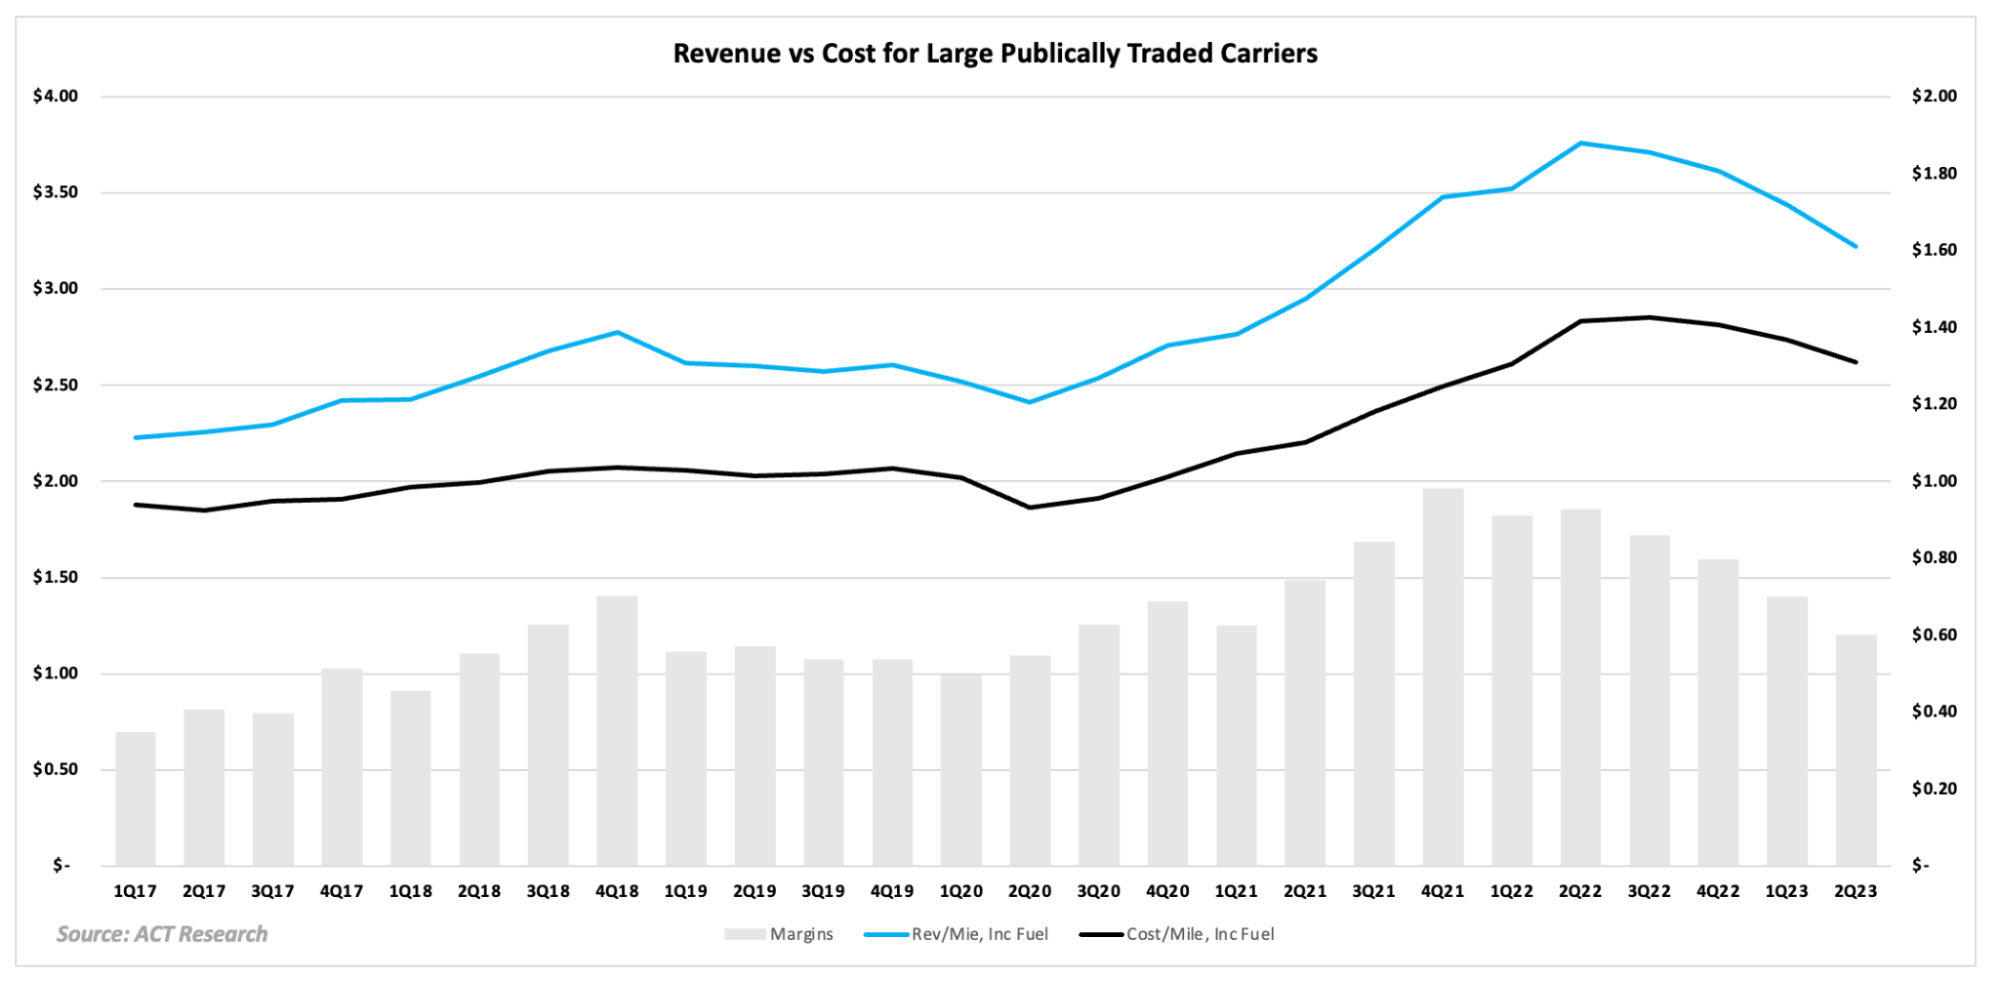 Figure 23: ACT Research, Revenue vs. Cost for Large Publicly Traded Carriers
Looking at driver availability survey results, 18% of respondents reported limited driver availability, over half said it was balanced, and nearly a third said it is plentiful today and will still be three months from now. These results confirm our perspective that the market is still oversupplied and indicate carriers believe current conditions will hold for the short-medium term because drivers with access to contract freight remain healthy, and larger fleets continue to take on capacity from smaller fleets and owner-operators.
 Figure 24: Current Outlook on Driver Availability, Arrive Carrier Market Survey, October 2023
The Truckstop’s Weekly National Average Spot Rates index provide a detailed view of week-to-week rate movements and a real-time look into the current rate environment.
Van spot rates remained relatively flat in early November before spiking during the week of Thanksgiving and into December. Reefer rates followed a slightly different trend, increasing in early November before falling toward the end of the month and into mid-December. The flatbed market remained steady, with rates only fluctuating by a couple of cents each week.
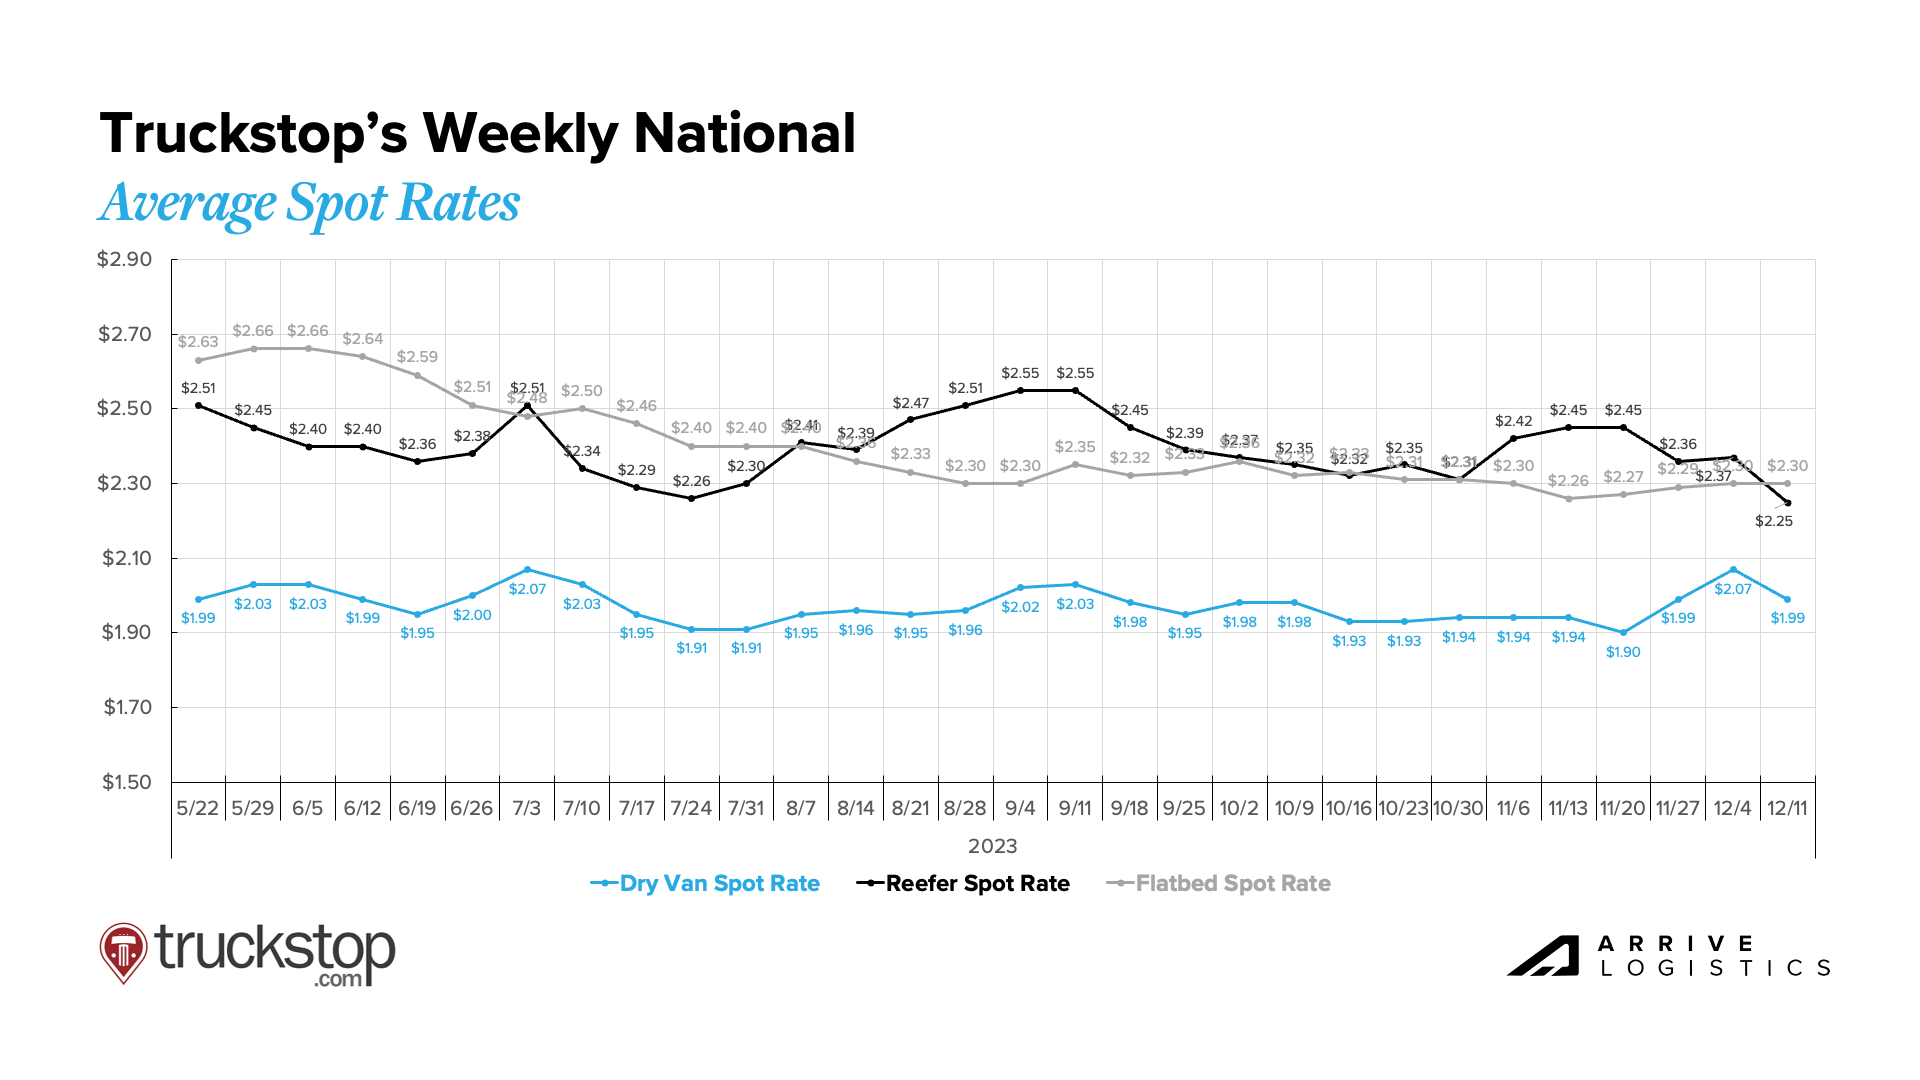
Figure 25: Truckstop Weekly National Average Spot Rates
The month-over-month van rate spread decreased by $0.08, dropping from $0.46 in November to $0.38 month-to-date in December.
All-in dry van spot rates are down 12.5% year-over-year in December, while linehaul spot rates are down 9.9%. If rates hold, this would be the second straight month with single-digit percentage declines in linehaul spot rates. Between May 2022 and October 2023, we saw 18 straight months with double-digit percentage declines. All-in dry van contract rates are down 15.9% year-over-year and linehaul contract rates have declined 14.8% year-over-year.
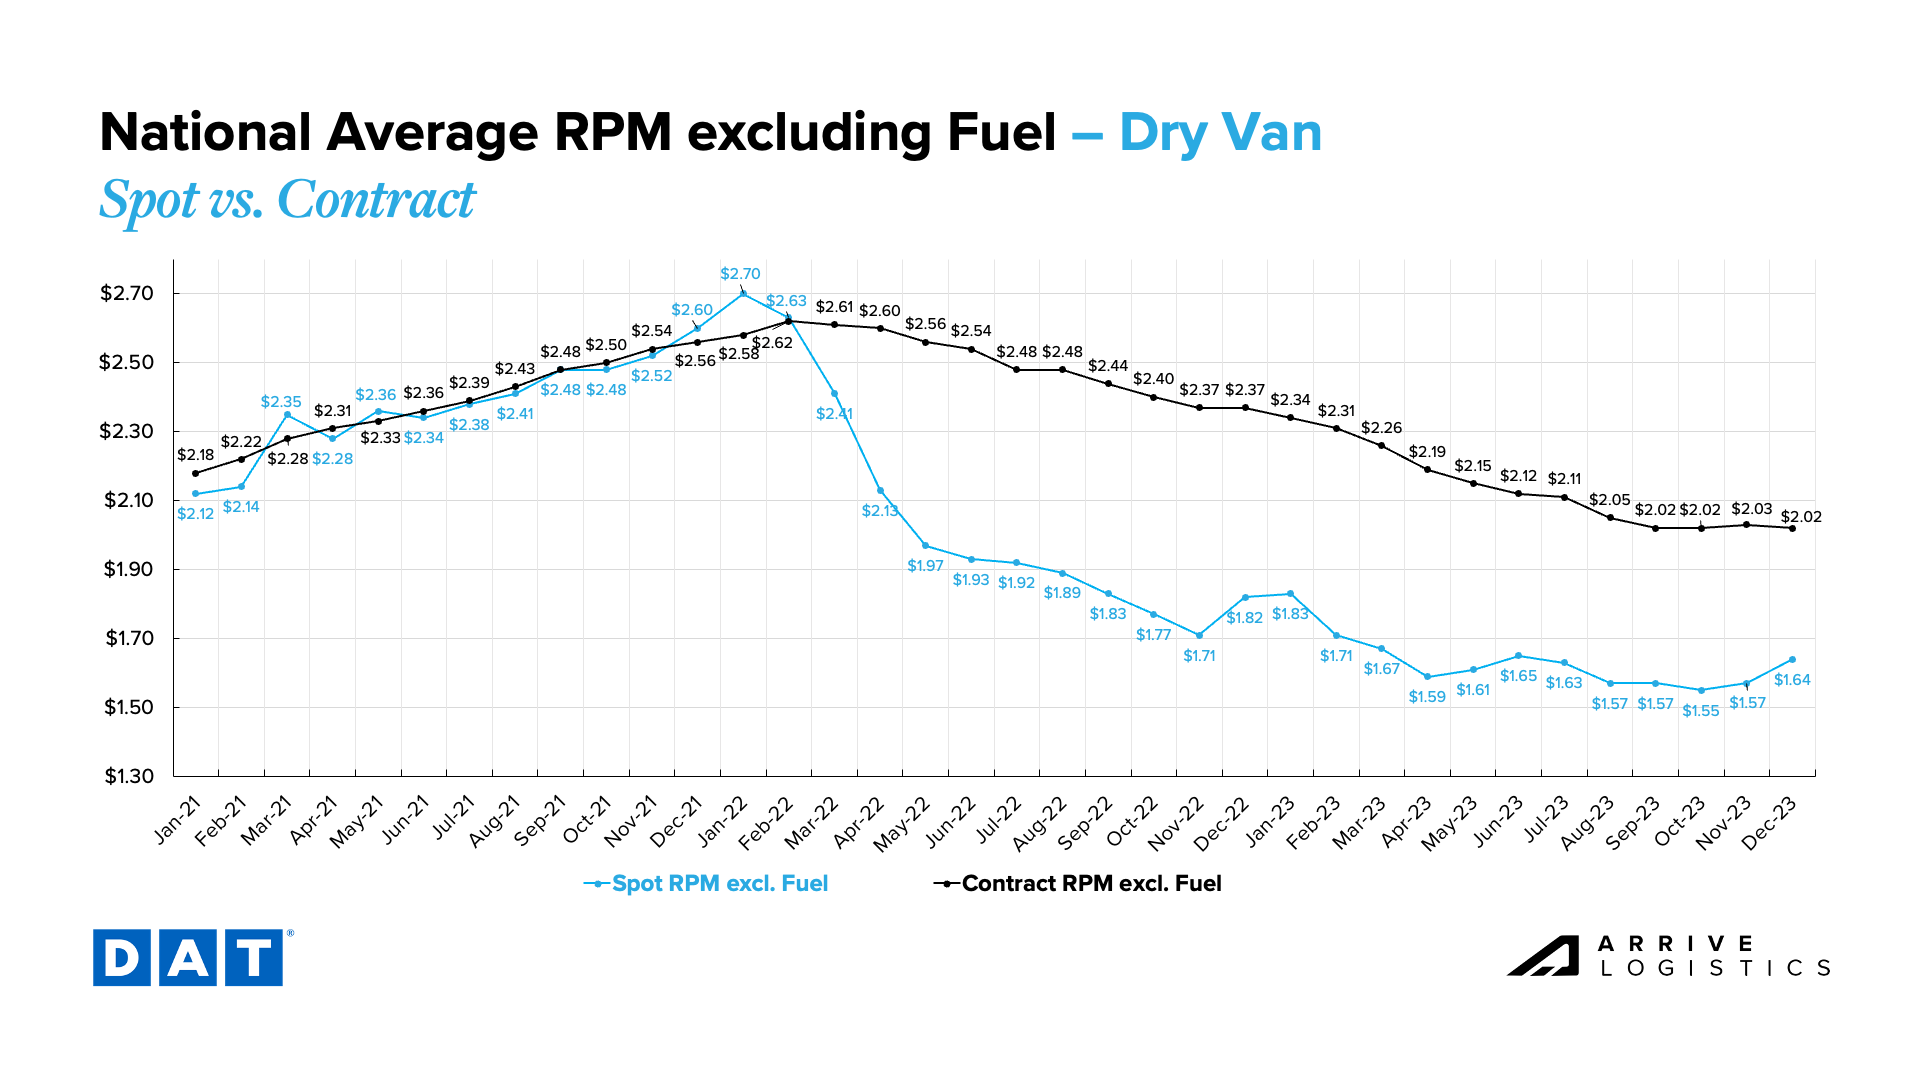 Figure 26: DAT Dry Van National Average RPM Spot vs. Contract
Monthly reefer spot rates rose by $0.07 from October to November but have dropped by $0.03 as of December. Spot rates are currently $1.91, excluding fuel, just $0.04 above the low of $1.87 observed in October.
The reefer spot-contract spread has dropped to $0.39, down from $0.45 last month and the lowest value since April 2022. This is mainly caused by the large contract rate decline this month. As we wrap up the year, expect contract rates to even out and rise slightly above current levels.
The current reefer contract rate has dropped 11.9% year-over-year to $2.30 per mile, excluding fuel. The current reefer spot rate dropped by 12.4% year-over-year to $1.91 per mile, excluding fuel.
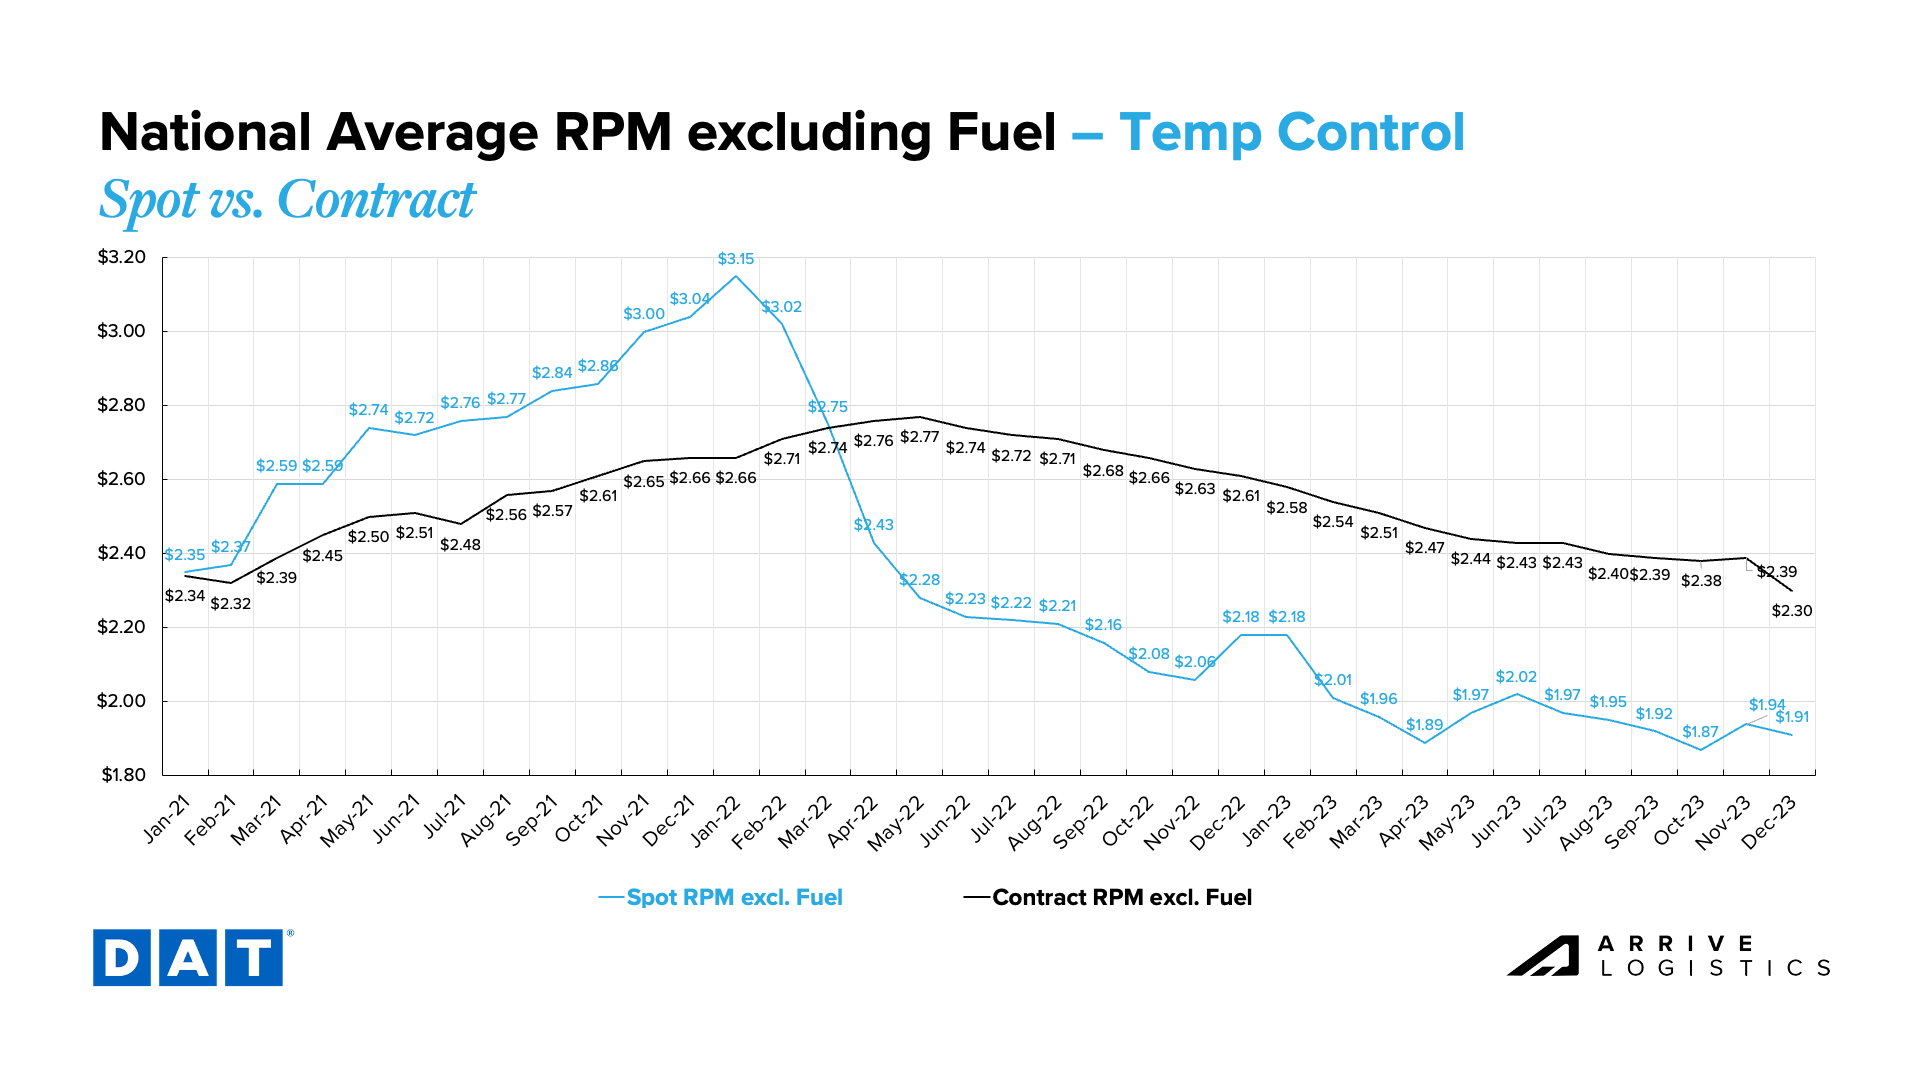 Figure 27: DAT Temp Control National Average RPM Spot vs. Contract
Flatbed spot rates have increased by $0.04 this month, rising to $1.85, excluding fuel. If they hold, it would snap a six-month streak of rate declines. Contract rates have continued to rise, increasing by $0.04 this month to $2.58 per mile, excluding fuel. With both spot and contract rates growing at the same rate, the contract-spot spread remained at $0.73. The last time the spread was higher than this was in November of 2022 when the rate spread was $0.81.
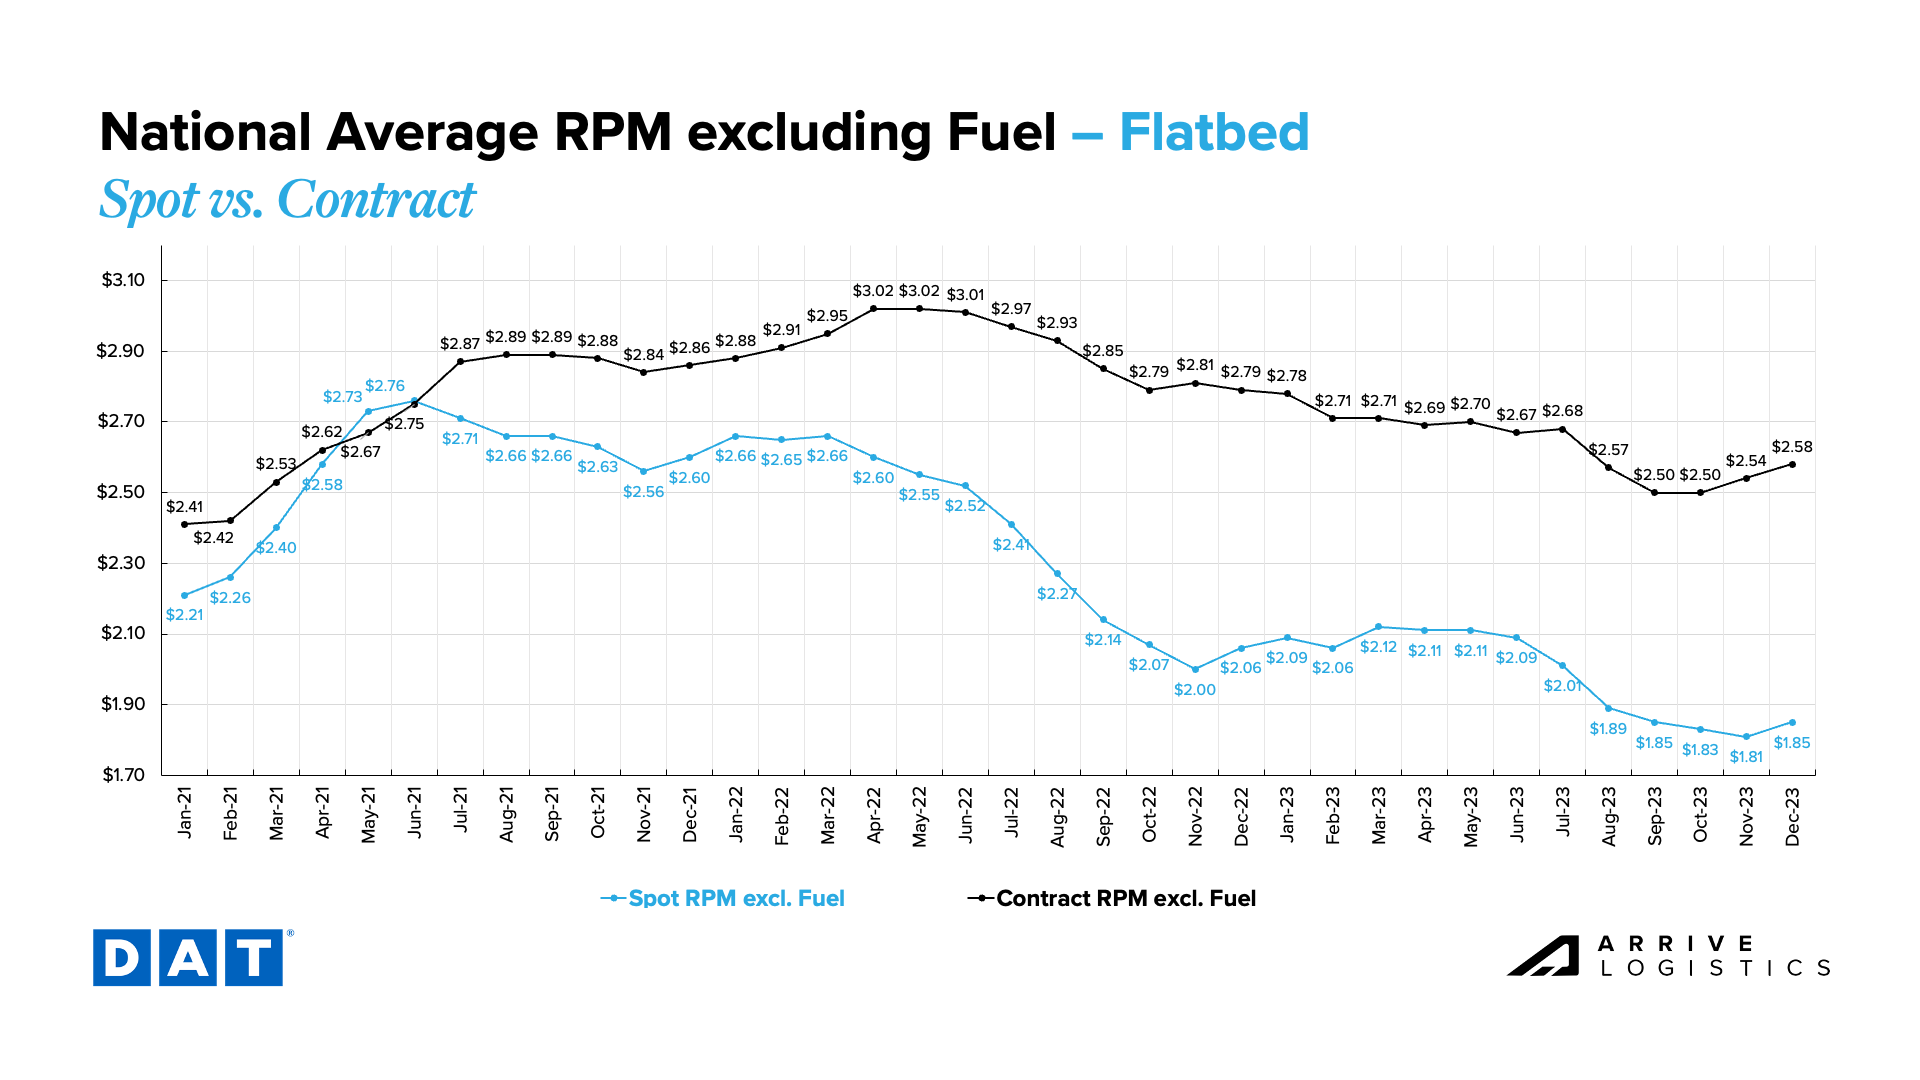 Figure 28: Flatbed National Average RPM Spot vs. Contract
We also asked our carriers what their truckload rates are compared to one year ago. Unsurprisingly, 81% of respondents reported that rates are down year-over-year, while 14% and 5%, respectively, said that rates were flat or higher. This is what we expected, as rates have been in a steady decline for well over a year.
We also asked the same set of carriers what direction they thought rates would go over the next three months. Over half of respondents believe rates will decline throughout the rest of 2023, 21% said they will be flat, and 21% expect rates to rise. These results reflect collective uncertainty about current market conditions and whether we will experience a strong or muted holiday demand push.
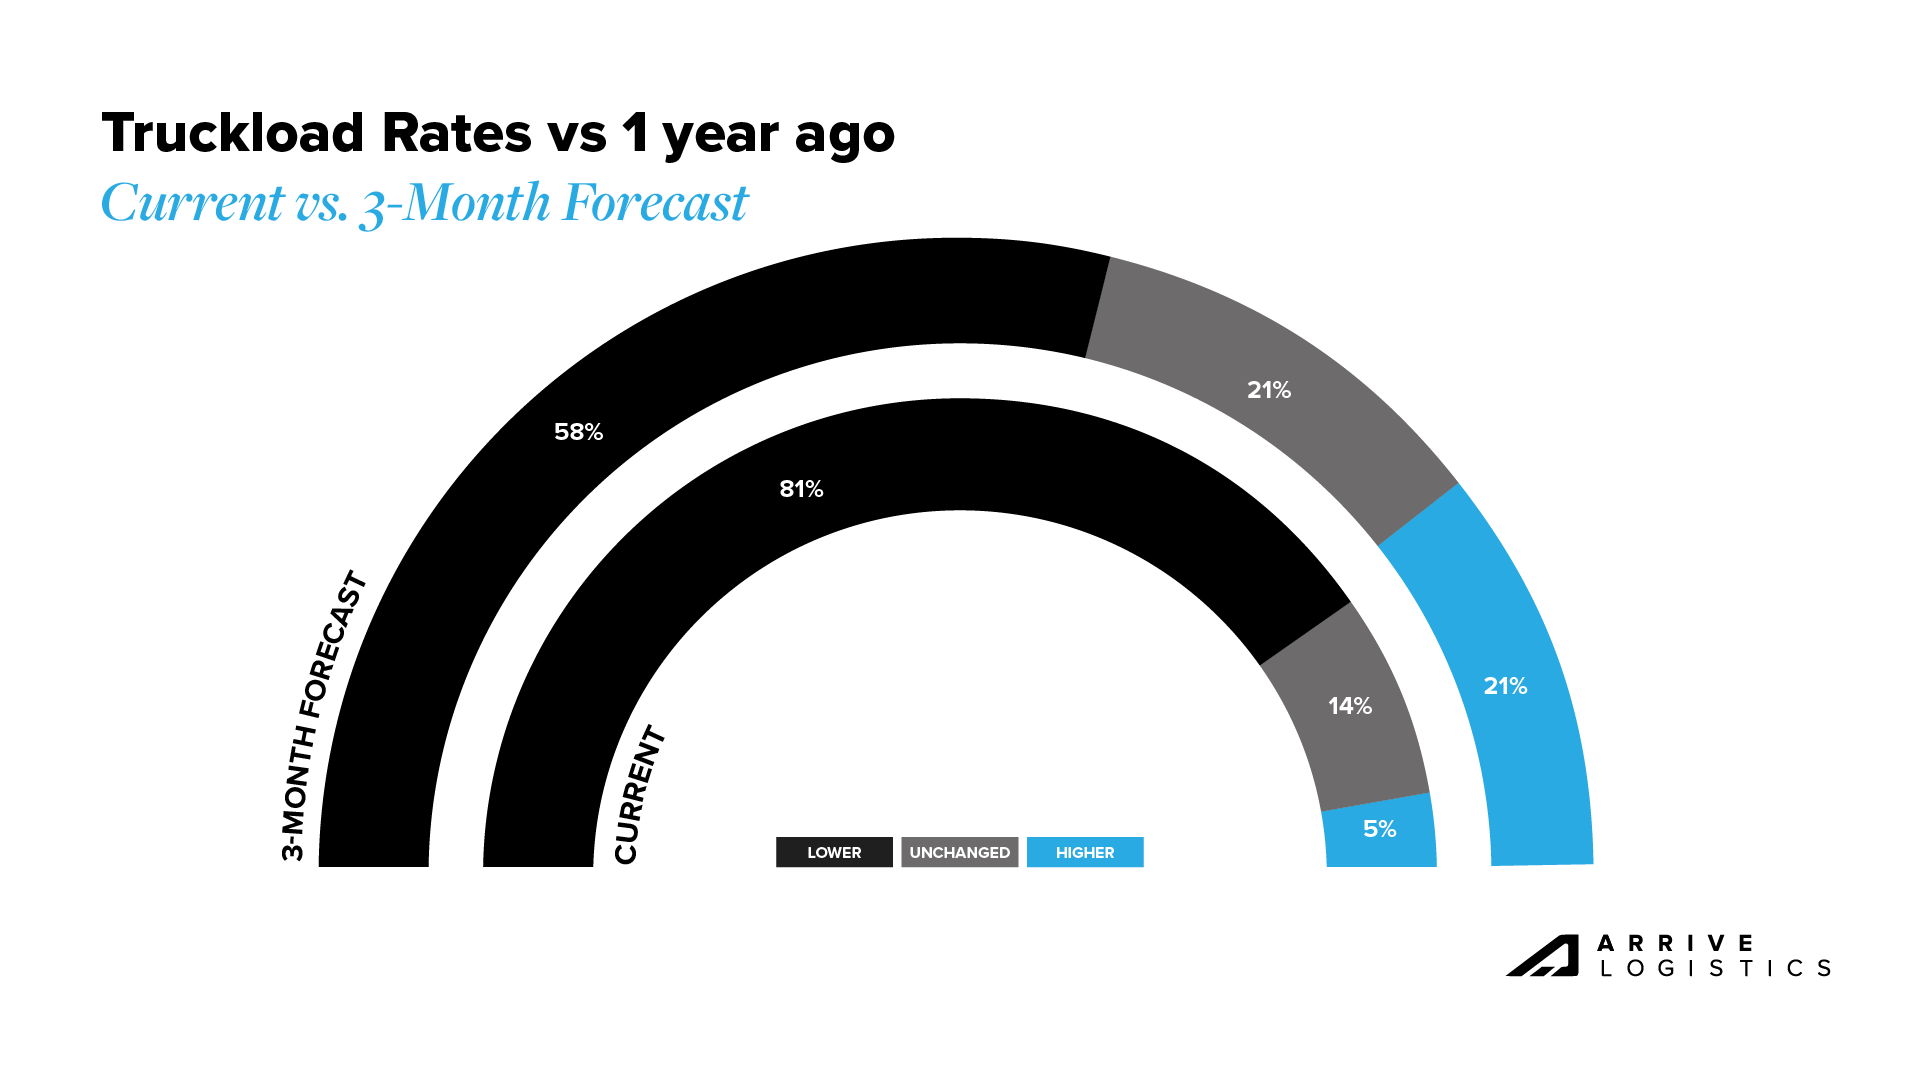 Figure 29: Truckload Rates vs. 1 year Ago, Arrive Carrier Market Survey, October 2023
November CPI data showed relatively flat inflation, with the reading up 3.1% year-over-year. As a result, the Fed decided to keep interest rates flat for the third consecutive month. If inflation continues to decline in early 2024, it is possible the Fed will start to lower interest rates at some point in the first half of the year. Lower interest rates would boost housing activity and manufacturing investments — two sectors that have meaningful contributions to freight demand.
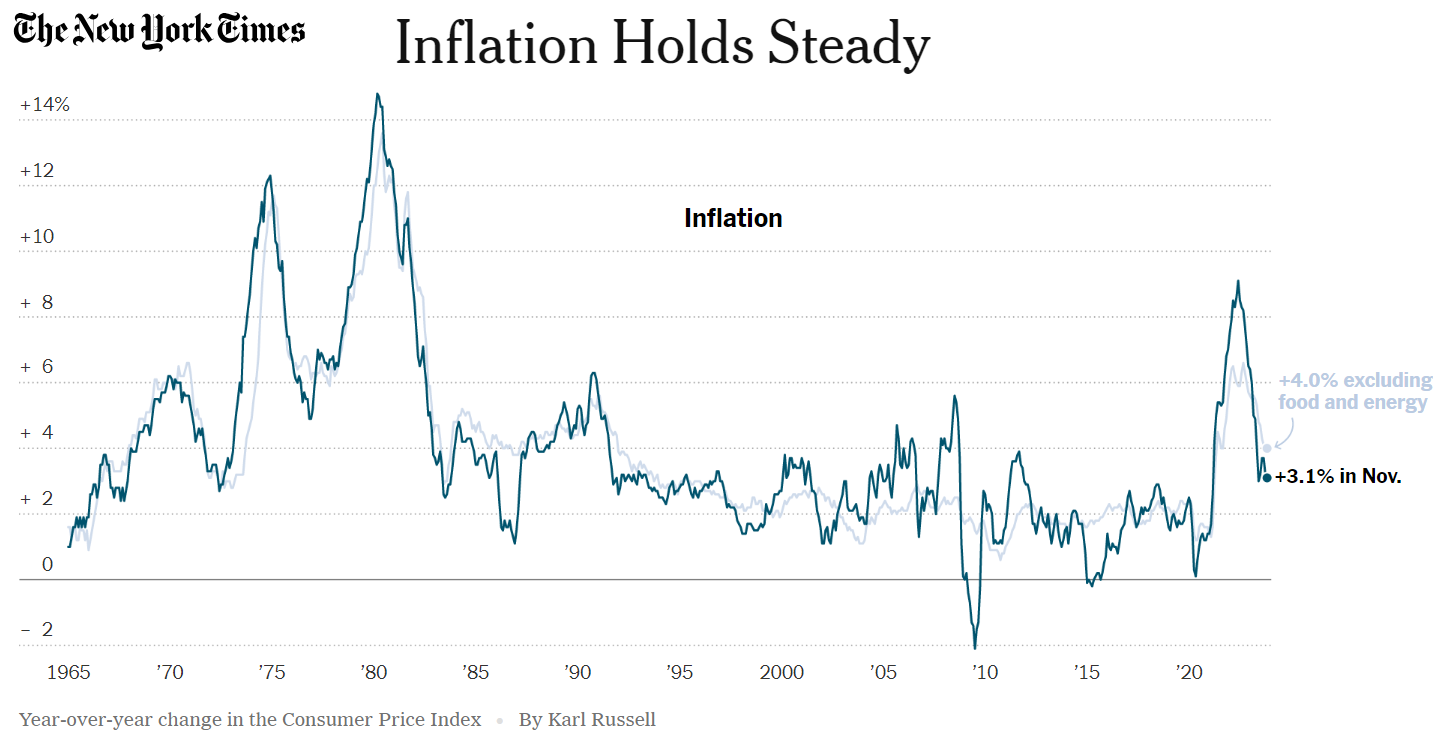 Figure 30: New York Times Inflation Data
Diesel prices have fallen by $0.65 per gallon since mid-October, providing some relief for carriers. The price decline came despite OPEC+ announcing they would continue cutting oil production in 2024. As demand remains relatively steady, fuel prices will likely level out in early 2024.
Geopolitical events often influence fuel prices. Prices soared soon after Russia invaded Ukraine and took several months to fall. We are now watching the war in the Middle East. While Israel and Palestine are not significant oil providers, the Middle East as a whole has a direct impact on prices in the United States. If the conflict were to affect other regions in the Middle East, we can expect another large fuel price spike.
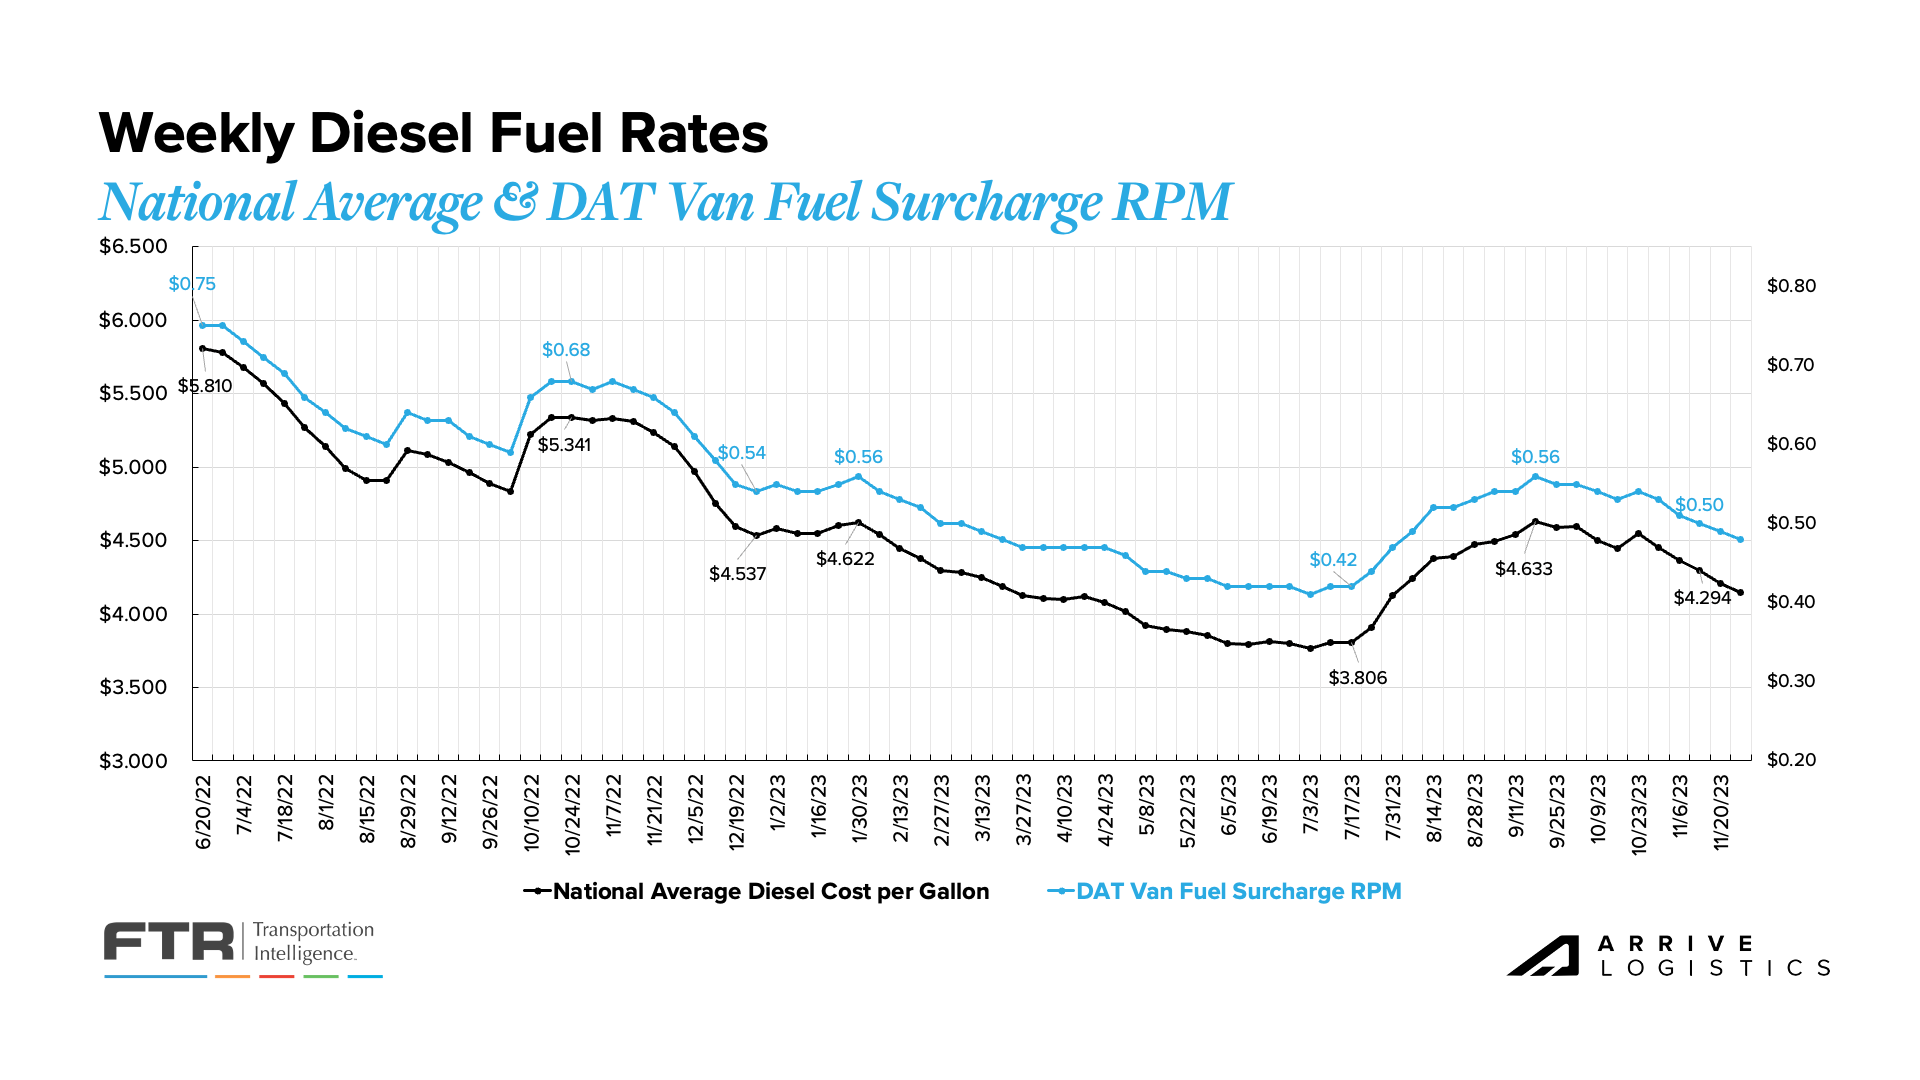
Figure 31: National Average Diesel Rates & DAT Fuel Surcharge RPM
November Bank of America card data showed consumer spending per household increased by 0.5% year-over-year but decreased by 0.8% month-over-month on a seasonally adjusted basis. This was the largest month-over-month decline observed over the past six months. However, it is important to note that the largest driver was gas spending, which dropped 4% from October due to declining gas prices rather than weak consumer behavior. The only other category to see a decline in spending was groceries, which could also be attributed to declining inflation. The two sectors with the largest growth were furniture and airlines, up 2.9% and 3.0%, respectively.
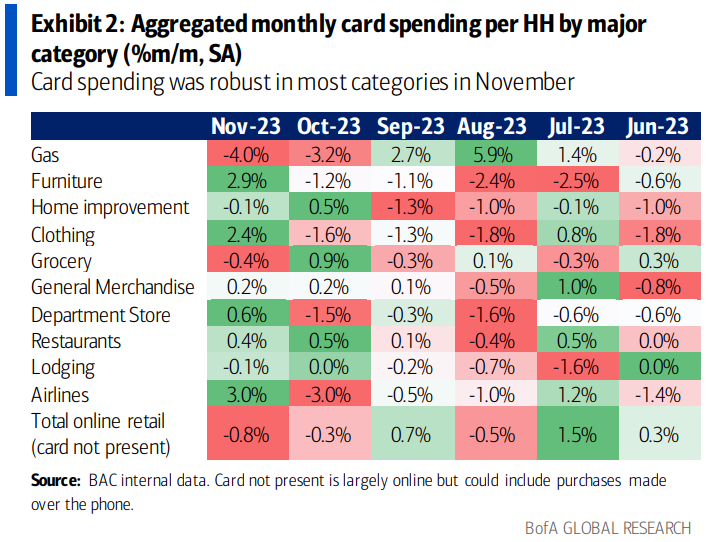 Figure 32: Bank of America Aggregated Monthly Card Spending