Need Help
close button

How can we help?

Select One:

Carrier Market Outlook

Author: rwalter@arrivelogistics.com
Shape

Theme: Welcome to 2025

Carrier Market Outlook

Arrive Insights™

Arrive Logistics VP of Market Intelligence David Spencer Headshot
David Spencer
VP of Market Intelligence
Aryan Shah
Senior Research Analyst

2024 peak season trends clearly show that the market has moved past its lowest point. Rates and capacity challenges aligned closely with typical seasonal patterns, while economic and consumer indicators suggest a stable environment ahead. Our forecast for 2025 remains unchanged: The ongoing balancing of supply and demand, along with a narrowing spot-contract rate gap, is likely to heighten the risk of disruptions in 2025.

Key Takeaways:

  • Q4 demand trends aligned with typical seasonal expectations.

  • Trucking employment has increased, but the decline in long-haul trucking jobs points to an ongoing capacity reduction.

  • Tender rejections for dry van and reefer shipments are significantly higher than 2023 levels, reflecting a better supply-demand balance and increased vulnerability to market disruption.

  • Rates continued to follow seasonal trends as volatility increased during the peak holiday season. However, they will likely return to a lower baseline as seasonal demand softens throughout Q1.

  • Potential risks such as a second port strike and tariff increases in January could influence the market positively or negatively, depending on their outcomes.

  • Both the economy and consumer activity remain strong, signaling stable or upward demand trends as 2025 begins.

Special Notice on Tariffs & Port Strikes

Tariffs have been top of mind for businesses in the freight market and beyond since President-elect Trump announced plans to impose a 25% tax on imports from Mexico and Canada, along with a 10% increase on imports from China, starting January 20. 

Avery Vise’s commentary in the recently released FTR December 2024 Trucking Report offers a comprehensive analysis and insight into the potential impact of these changes. We’ve outlined key takeaways from that commentary below and will continue to provide updates in this report.

Short-Term Impacts: Trump’s social media announcements lack critical policy details, leaving many businesses unsure of how to respond.

  • Historically, such situations create a “pull-forward” effect, where businesses rush to import goods before tariffs begin.
  • Despite this announcement coming just before a major holiday and only two months before the tariffs take effect, it is becoming increasingly clear that U.S. companies are racing to stockpile goods ahead of tariff implementation.
  • Experts anticipate import activity to increase further in the short term, particularly from Mexico, Canada and China. This could create significant congestion at U.S. ports and key border crossings in December and January, especially if port strikes resume in mid-January.

Long-Term Implications: Though the long-term political and economic implications of raising tariffs are unclear, the trucking industry would likely face significant disruption if the increases remain in place for an extended period.

  • For example, finished vehicles accounted for nearly 20% of Mexican exports to the U.S. by value in 2023 and currently represent 15% of Mexican truck tonnage; vehicle parts and accessories also accounted for 14% of export value in 2023. Thus, tariffs on vehicle imports from Mexico could dramatically impact cross-border trade flows.
  • Long-term tariffs could also drive up inflation by increasing the cost of imports, even if the U.S. dollar remains strong.
  • Potential retaliatory tariffs from Mexico and Canada could also further complicate trade dynamics.

Preparing Amid Uncertainty: Businesses should consider several strategic actions to mitigate risk ahead of potential tariff increases.

  • For now, the best course is to avoid long-term planning based on speculation and stay informed on policy details as they become available. 
  • A few strategies shippers could implement to prepare for any near-term volatility are: 
    • Holding excess inventory to buffer against potential supply chain disruptions; however, high interest rates and warehousing costs could complicate this approach.
    • Diversifying sourcing can also help reduce reliance on Mexico, Canada and China; however, if the administration were to impose similar tariffs on other countries, these efforts could be wasted.
  • Carriers should also be prepared to cover tariff-related volume surges in the near term but avoid making any long-term hiring or fleet expansion plans. 

The Reason For Raising Tariffs: This initiative is just one part of Trump’s pro-business policy agenda, which could positively impact the freight market.

  • The Trump administration says that raising tariffs supports its goal of reducing the trade deficit and bringing manufacturing back to the U.S. (i.e., reshoring). 
  • Though sustained reshoring would likely take years to achieve, such a transformation could benefit trucking by increasing domestic freight demand.
  • Beyond tariffs, several other facets of the Trump administration’s pro-business approach could bolster demand in the freight market:
    • Cutting Corporate Taxes: Trump plans to reduce the corporate tax rate from 21% to 15% to drive business investment and economic growth.
    • Infrastructure Improvements: The administration says it will invest in improving roads, bridges and transportation networks to enhance transportation efficiency; sourcing materials for these projects might also support freight demand.
    • Regulatory Reforms: Trump wants to deregulate the environmental, energy and finance sectors to reduce compliance costs and encourage investment.

Preparing For Port Strikes: East and Gulf port strikes will resume in mid-January if the sides can’t reach a deal. Here’s what we know:

  • The likelihood of port strikes resuming in January 2025 remains high.
  • The core issue is automation, which the International Longshoremen’s Association (ILA) says will eliminate jobs and pose security risks, but the USMX argues is necessary to maintain global competitiveness.
  • Negotiations will likely continue until the current contract extension expires on January 15, 2025.
  • If the strikes resume, they will halt East and Gulf Coast port operations, which could disrupt the freight market.
  • President-elect Trump has publicly supported the union by opposing automation.

Market Indicators

Routing guide challenges.

Trucking Capacity

Exits slowed.

Demand Outlook

Typical seasonality.

Market By Mode

Holiday-related tightness.

Rates

Holiday rate increases.

Economic Outlook

Resilient consumers.

Market Indicators

What’s Happening: Shippers are experiencing the most significant routing guide challenges in over two years.

Why It Matters: Despite those challenges, there is no indication of a sustained market shift.

The Morgan Stanley Dry Van Freight Index measures relative supply; the higher the index, the tighter the market conditions. The black line with triangle markers on the chart provides a great view of what directional trends would be in line with normal seasonality based on historical data dating back to 2007.

Despite recent routing guide disruptions and rate volatility, as of mid-December, the latest reading showed no meaningful activity or demand increases and trends returning to the 10-year average amid seasonal cooling.

Morgan Stanley Dry Van Truckload Freight Index

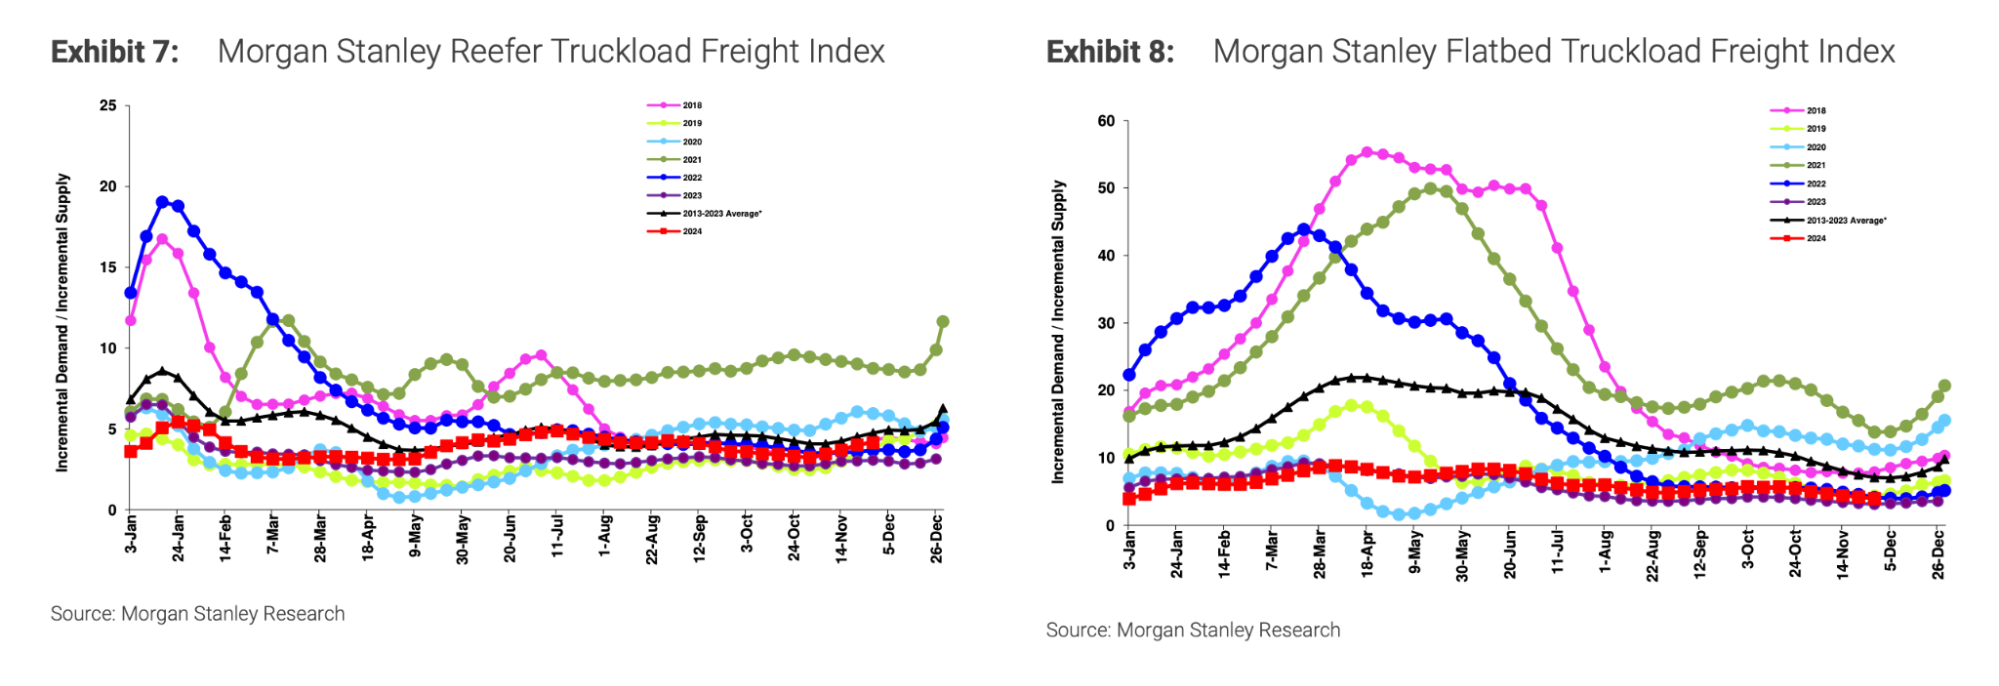
Morgan Stanley Reefer and Flatbed Truckload Freight Indices

The latest ACT for-hire Trucking Supply-Demand Balance Index shows conditions tightened in the most recent reading (October) as a result of increased freight volumes and decreased fleet capacity. ACT reports that one of the primary drivers of a longer equilibrium cycle is the expansion of private fleets, as increased capacity results in longer recovery times. 

Class 8 tractor sales have continued to slow, a sign that the market will continue to rebalance in the coming months. As the broader economy grows, freight volumes should rise. As a result, the market will likely be tighter in 2025 than in 2024.

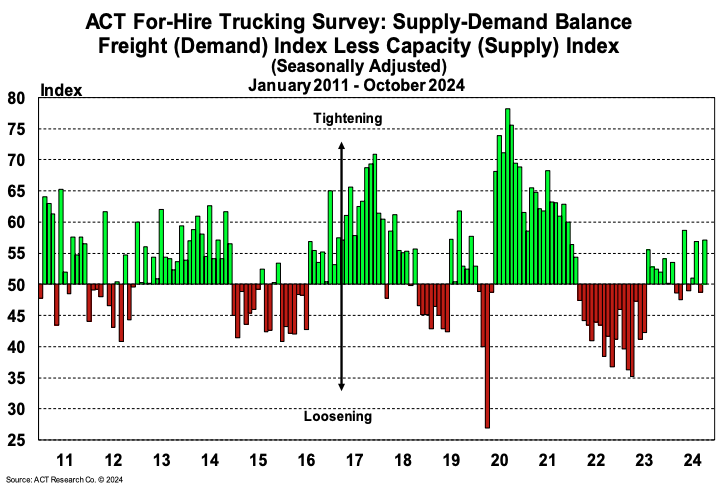
ACT For-Hire Trucking Survey

The Sonar Outbound Tender Reject Index (OTRI), which measures the rate at which carriers reject the freight they are contractually required to take, is trending well above where it was a year ago and fairly close to 2019 levels. Rejections during Thanksgiving were over 60% higher than last. Rejection rates prior to Christmas surpassed 10% for the first time since April 2022, before dropping back down to around 8%.

In the full history of the FreightWaves Sonar OTRI, the measure has only risen above 10% when a market disruption was in progress or conditions were primed for one with the right catalyst. For example, in 2019, rejection rates peaked at roughly 14% over Christmas week. A few months later, pandemic-related buying patterns sent the market on a multi-year bull run. While that was an extraordinary black swan event and one unlikely to occur again in the next few months, it does highlight that OTRI volatility leading up to the 2020 disruption indicated market vulnerability.

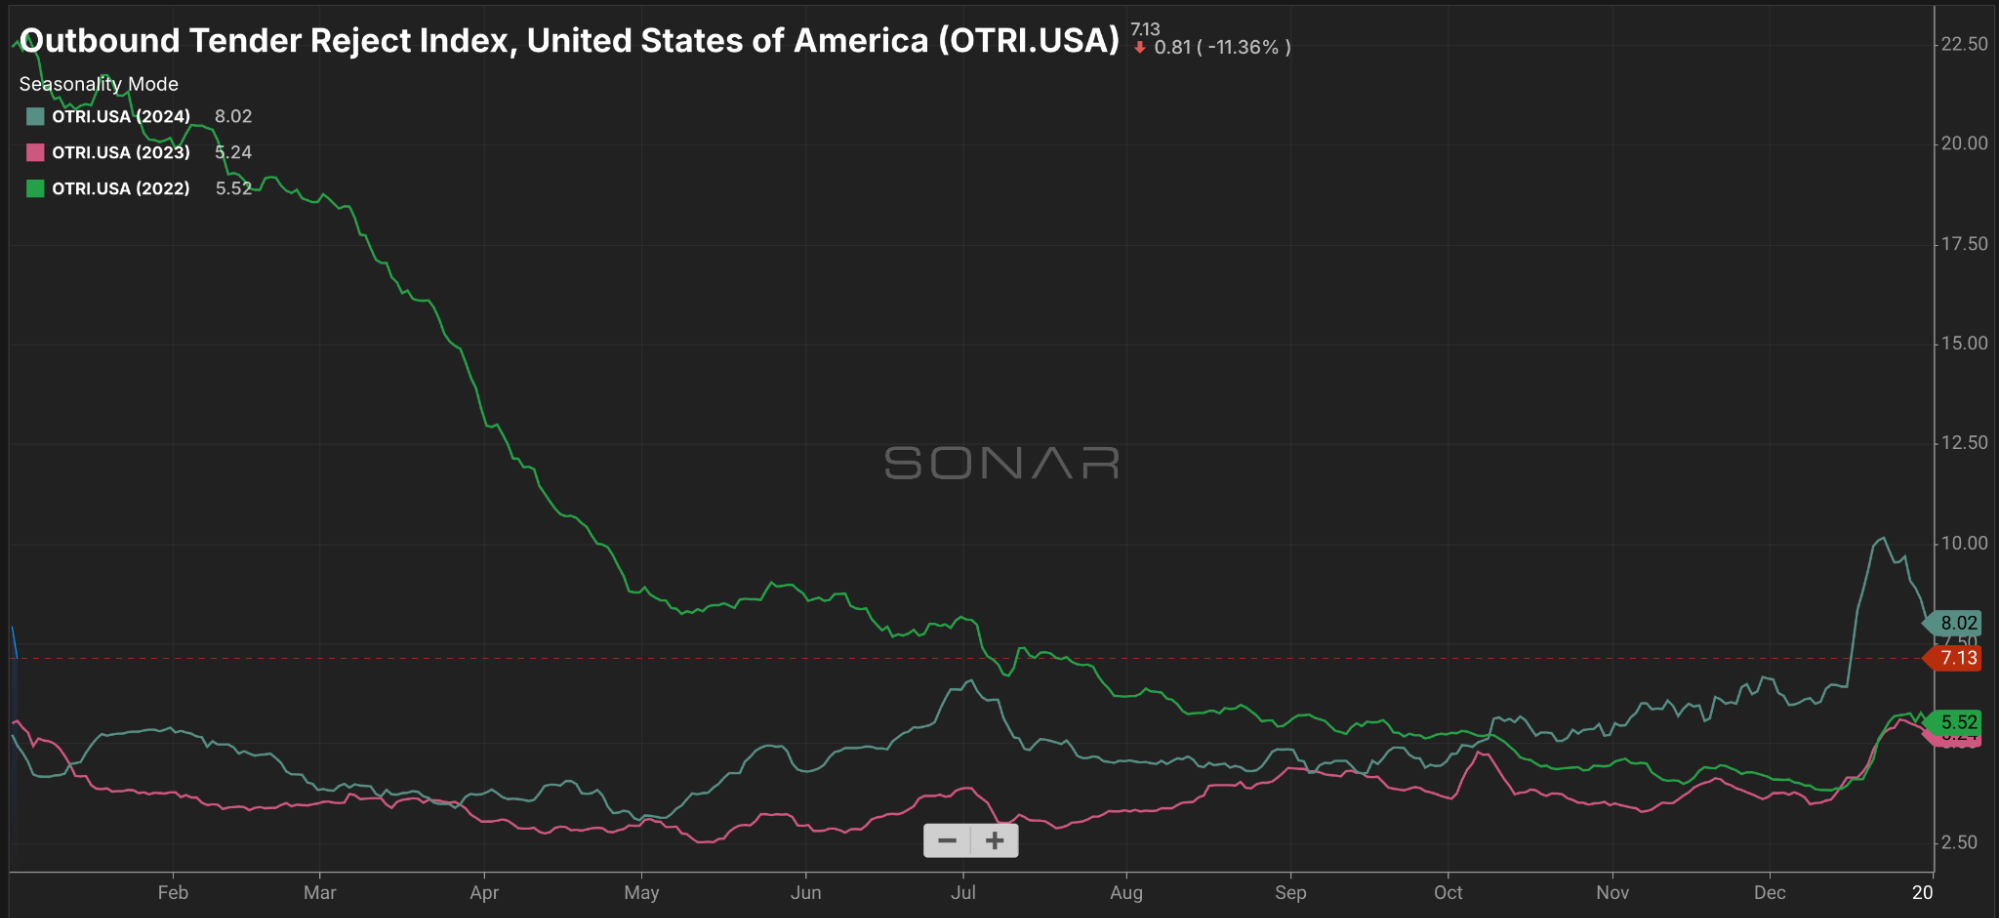
Outbound Tender Reject Index (SONAR)

Dry van tender rejections remain above 2023 and 2024 levels. They spiked in December in line with typical seasonal expectations, indicating that the market is more volatile than a year ago. Van rejections surpassed 8% ahead of the holiday week, offering additional proof that the market is more sensitive heading into 2025. During the second half of December 2023, we saw a sharp increase in tender rejections followed by a sharp reduction in mid to late January. We saw similar trends in 2024, but some risk remains with the looming threat of a mid-January port strike and the new administration taking office on January 20th.

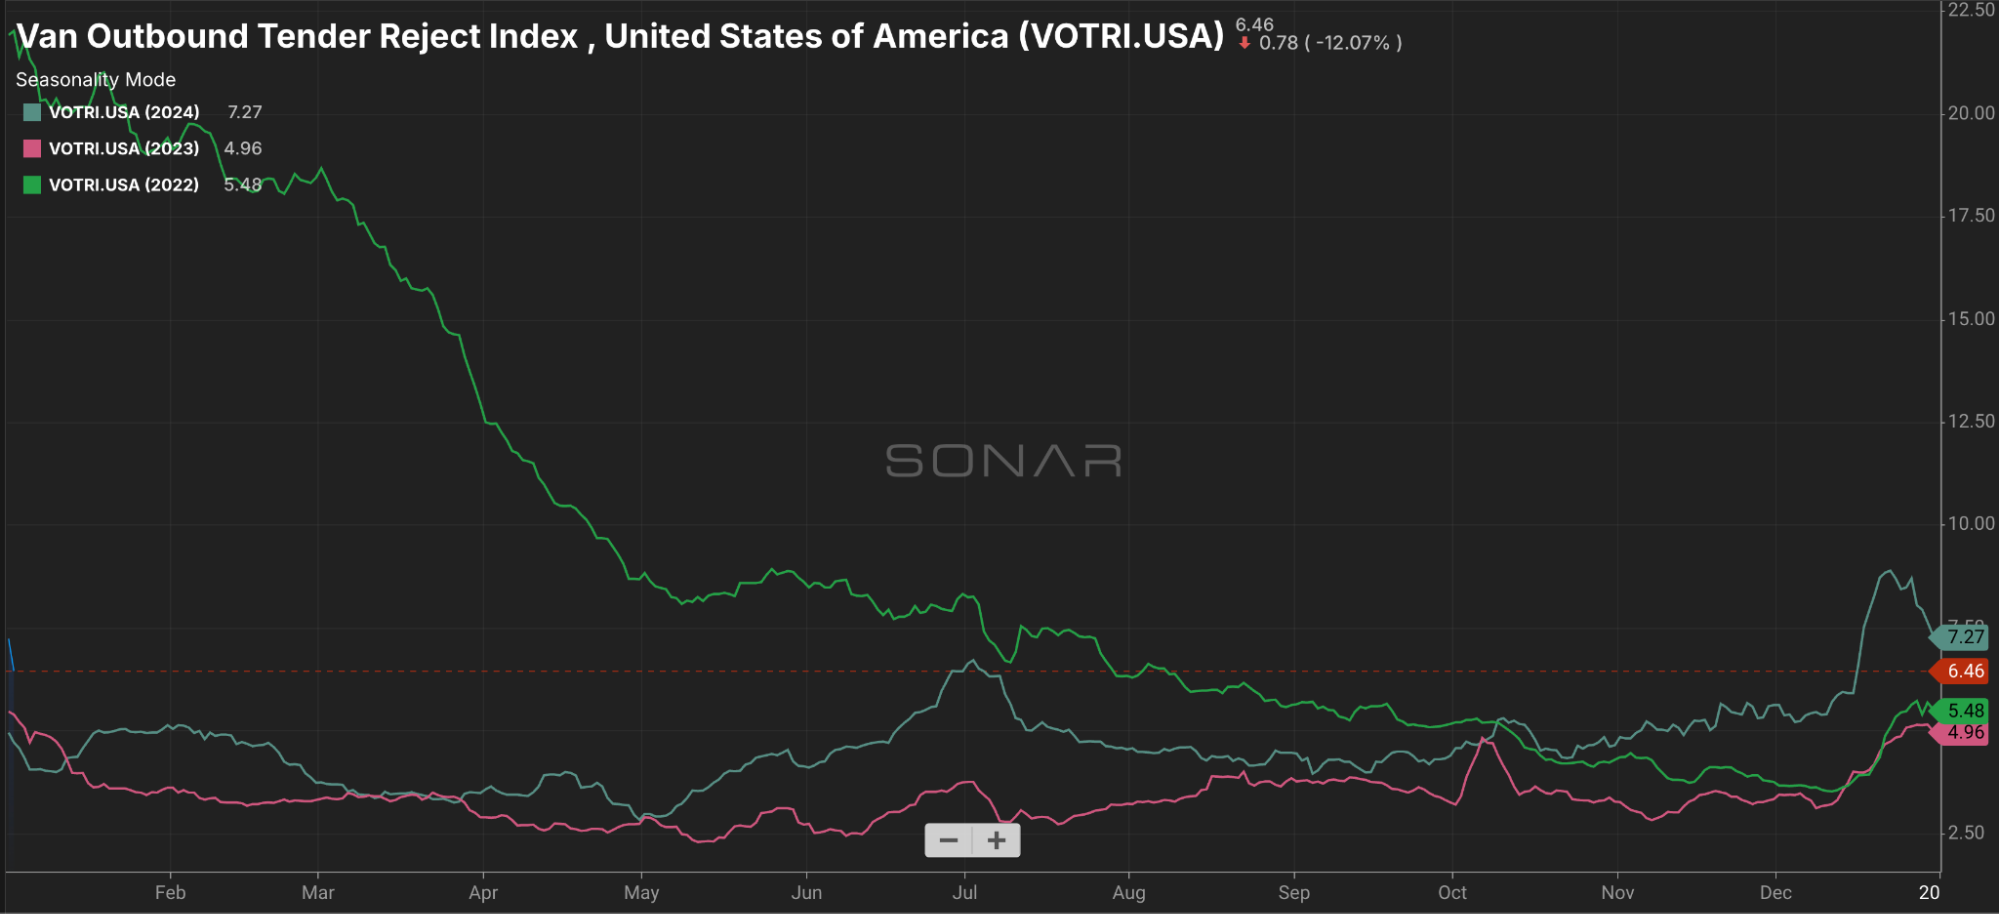
Van & Reefer Outbound Tender Reject Indices

The reefer market continues to illustrate similar year-over-year trends to the van market, indicating improved supply and demand balance. However, with rejections on track to pass 20%, the same risks exist for reefer as for van. Throughout the history of the reefer-specific metric, the 20% range has been the threshold indicating an active or imminent disruption. That said, typical seasonality will likely be the narrative for the reefer market until the right catalyst occurs.

The DAT Load-to-Truck Ratio (L/T) measures the total number of loads relative to the total number of trucks posted on its spot board. The van L/T increased sharply from November to December, passing 6 for the first time since February 2022. The ratio will likely fall entering early 2025, but the data continues to indicate that the market is more volatile than it has been in the last 24 months.

DAT Van Load-to-Truck Ratio

DAT Reefer Load-to-Truck Ratio

Trucking Capacity

What’s Happening: Carrier exits have slowed somewhat. 

Why It Matters: This is likely due to increased seasonal opportunities, and we expect exits to ramp up again in 2025.

Carriers continue to exit the market, but the pace has slowed. FTR noted in its most recent report that over the past four months, the average decline in the for-hire population has been just 327 carriers per month, compared to 1,755 per month throughout 2023. While recent disruptions, holiday rate increases and fuel price declines may offer many carriers a sense of stability, we anticipate further capacity reductions in 2025.

FTR’s Carrier Revocations, New Carriers & Net Change in Carrier Population

We continue to monitor the evolving role of private fleets as they increase their share of the for-hire market despite volume declines. With less freight available, for-hire carriers are negotiating rates aggressively to maintain volume and revenue, putting downward pressure on spot rates. If this trend persists, it could extend the current rate environment deeper into 2025.

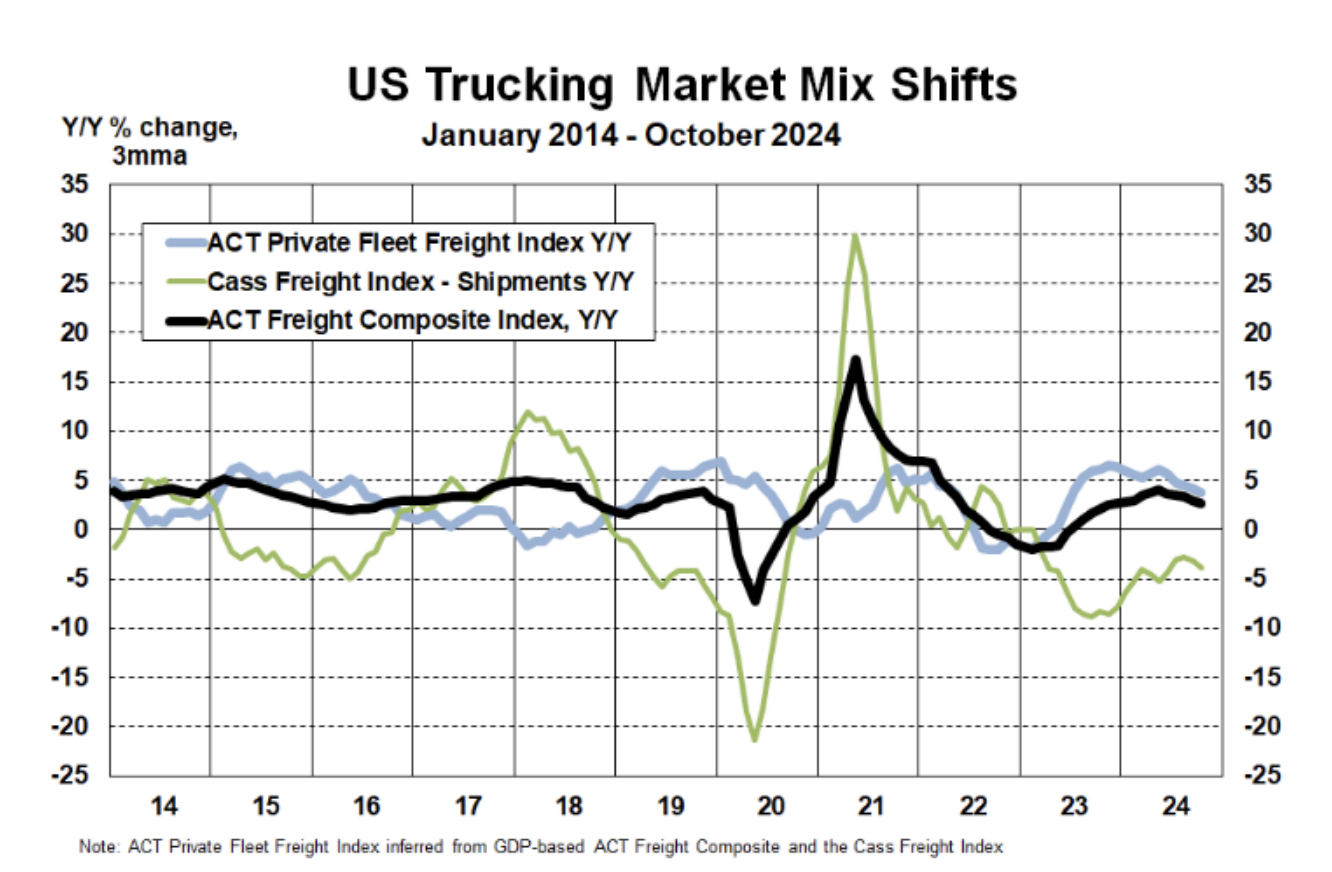
US Truckload Market Mix Shifts, ACT Research & Cass Freight Index

According to the latest data from ACT Research on U.S. Class 8 tractors, the backlog-to-build (BL/BU) ratio increased from 6 months in October to 6.5 months in November. The overall backlog grew by over 10,000 units in November to around 75,000 units. ACT Research reports this growth was largely supported by lower build rates as manufacturers focus on vocational production rather than tractor production. With rates still low, more major near-term growth is unlikely.

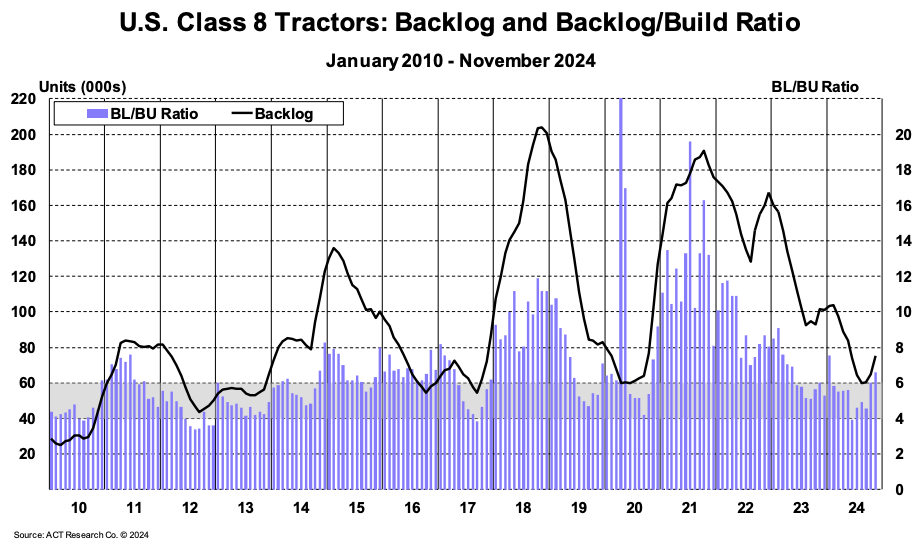
ACT Research, U.S. Class 8 Tractors: Backlog and Backlog/Build Ratio

Driver availability remains relatively soft. There is little evidence of a shortage, likely due to older drivers staying on the road longer to cover their high cost of living and the growing migrant population. Driver availability showed no apparent tightening as a result of the November drug and alcohol clearinghouse rule changes regarding drivers with prohibited status.

ACT For-Hire Trucking Index: Driver Availability

The November trucking jobs report indicated an increase of just 2,900 jobs on a seasonally adjusted basis. Although total jobs were up 3,700 over the previous four months, they were still down 1,400 year-over-year in November and more than 39,000 from the peak in July 2022. The long-haul sector continues to show job losses consistent with for-hire carrier data, a sign that optimism around recent green shoots isn’t necessarily driving an uptick in long-haul trucking employment.

Monthly Change in Trucking Jobs, FRED Economic Data

Demand Outlook

What’s Happening: Trends are following typical seasonality.

Why It Matters: This should continue through the first half of 2025.

The key demand variables to watch are the potential port strike in mid-January and the tariff increases slated for late January. These events have the potential to create both upward and downward risks to volume. However, given the lingering uncertainty around both events, our outlook still calls for flat to slow demand growth in 2025.

The National Retail Federation estimated a 14.3% increase year-over-year in December, which would close the full year out 14.8% above 2023 levels. Elevated levels earlier in the year were expected due to the initial threat of a port strike in October, and they have continued as shippers have looked to lower risk heading into a potential disruption later in January.
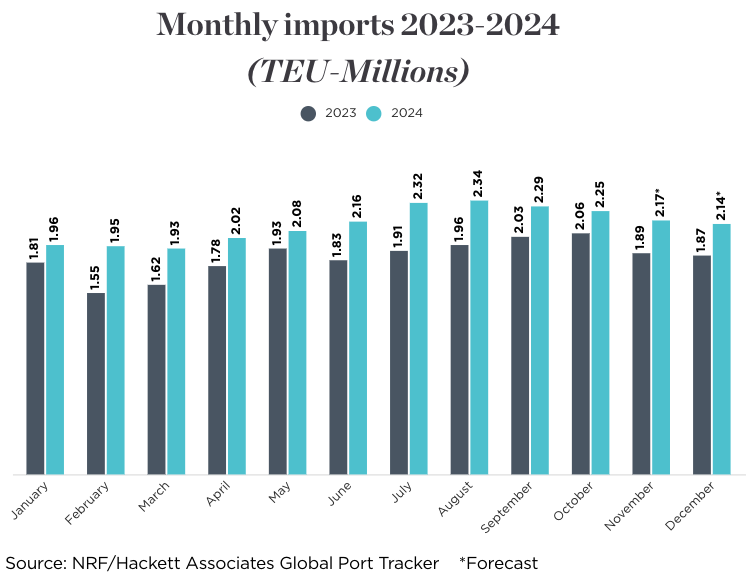
NRF Monthly Imports

DAT reported that November spot loadings were down nearly 26% from October and 7.0% from November 2023. The large month-over-month decrease likely correlates with the spot posting surge following Hurricanes Helene and Milton in October. Notably, postings during the first week of December were up 116% from the last week of November. While this uptick was largely due to fewer business days during Thanksgiving, it is still one of the largest we have seen.

DAT Trendlines

Market by Mode

Cross-Border Canada

What’s Happening: Volatility increased ahead of the holidays. 

Why It Matters: Any disruptions will likely subside in Q1 2025.

  • Carriers are raising rates in certain areas, especially for outbound Canada freight.
  • Supply tightened as drivers took time off for the holidays.
  • Spot board activity is increasing, primarily for southbound freight.
  • Potential tariff increases could create volatility, but it is too early to know to what extent.
  • The postal strike is having a limited impact on cross-border freight and intra-Canada capacity.

Cross-Border Mexico

What’s Happening: Increased holiday volume created border bottlenecks.

Why It Matters: This should subside in Q1.

  • Seasonal demand for retail and consumer goods spiked and created tightness as carriers prioritized high-yield freight.
  • B1 driver availability is expected to drop 50%-70% from late December to mid-January, primarily impacting PU/DELs in the U.S.
  • Year-end shipment volumes are driving longer processing times at busy ports like Laredo and Otay Mesa.
  • Capacity was constrained due to holiday schedules, vacations and driver shortages, especially on the U.S. side for B1 drivers.
  • Growth in Mexico’s automotive and electronics sectors is driving outbound volumes for industrial materials.
  • Cargo theft risk rose in the EM, PU and DF regions during the holiday season.

Temp Controlled

What’s Happening: Regional tightening.

Why It Matters: Things should settle in Q1.

East Coast

  • Southeast markets remain soft, with no significant produce volume this time of year.
  • Seafood shipments remain steady in the Northeast.
  • Rates are low from the Northeast into the Midwest and West Coast.
  • The market should stay relatively soft unless disrupted by major snowstorms.

Midwest

  • Volatility has increased, but rates remain in line or lower than prior years.
  • Reefer volume is increasing due to protect-from-freeze freight.
  • Capacity is tightening in meat hubs like Kansas, Iowa, Missouri and Nebraska.
  • Rates are high for outbound loads to regions outside the Midwest.

South

  • Capacity is available, though securing same-day loads remains challenging in McAllen and El Paso, Texas.
  • The rest of the South is quiet, as expected for this time of year.

West

  • Arizona is tightening as produce volumes pick up.
  • Carriers heading outbound from Los Angeles may create tightness near the Arizona border.

Pacific Northwest (PNW)

  • Rates were elevated with limited volatility compared to December 2023.
  • The region should stay tight until mid-Q2.
  • January could see more volatility than December.

Truckload Rates

What’s Happening: Rates increased meaningfully during the holidays.

Why It Matters: This is normal seasonality, and we expect rates to settle in early Q1.

According to weekly spot market data provided by Truckstop, which we believe provides the best view of week-to-week seasonal volatility, rates moved as expected throughout November and December. Typical seasonal patterns call for localized peaks around both holiday weeks, followed by a return to the floor in late January and early February. While risks related to external factors such as winter weather, a possible port strike and the new administration could complicate the exact timing, we still expect a rate pullback in early Q1.

Truckstop Weekly National Spot Rate Average

National diesel prices continue to tick down, with the December average sitting at $3.49 per gallon. Low fuel prices continue to benefit carriers navigating higher operating costs amid low revenues. The long-term fuel cost outlook remains favorable for carriers, as the EIA predicts that global oil production will rise by over 1.6 million barrels a day in 2025, including a projected increase of U.S. production from 13.2 million barrels a day to 13.5 million barrels a day. While it is impossible to predict future fuel prices, additional supply should help keep them low.
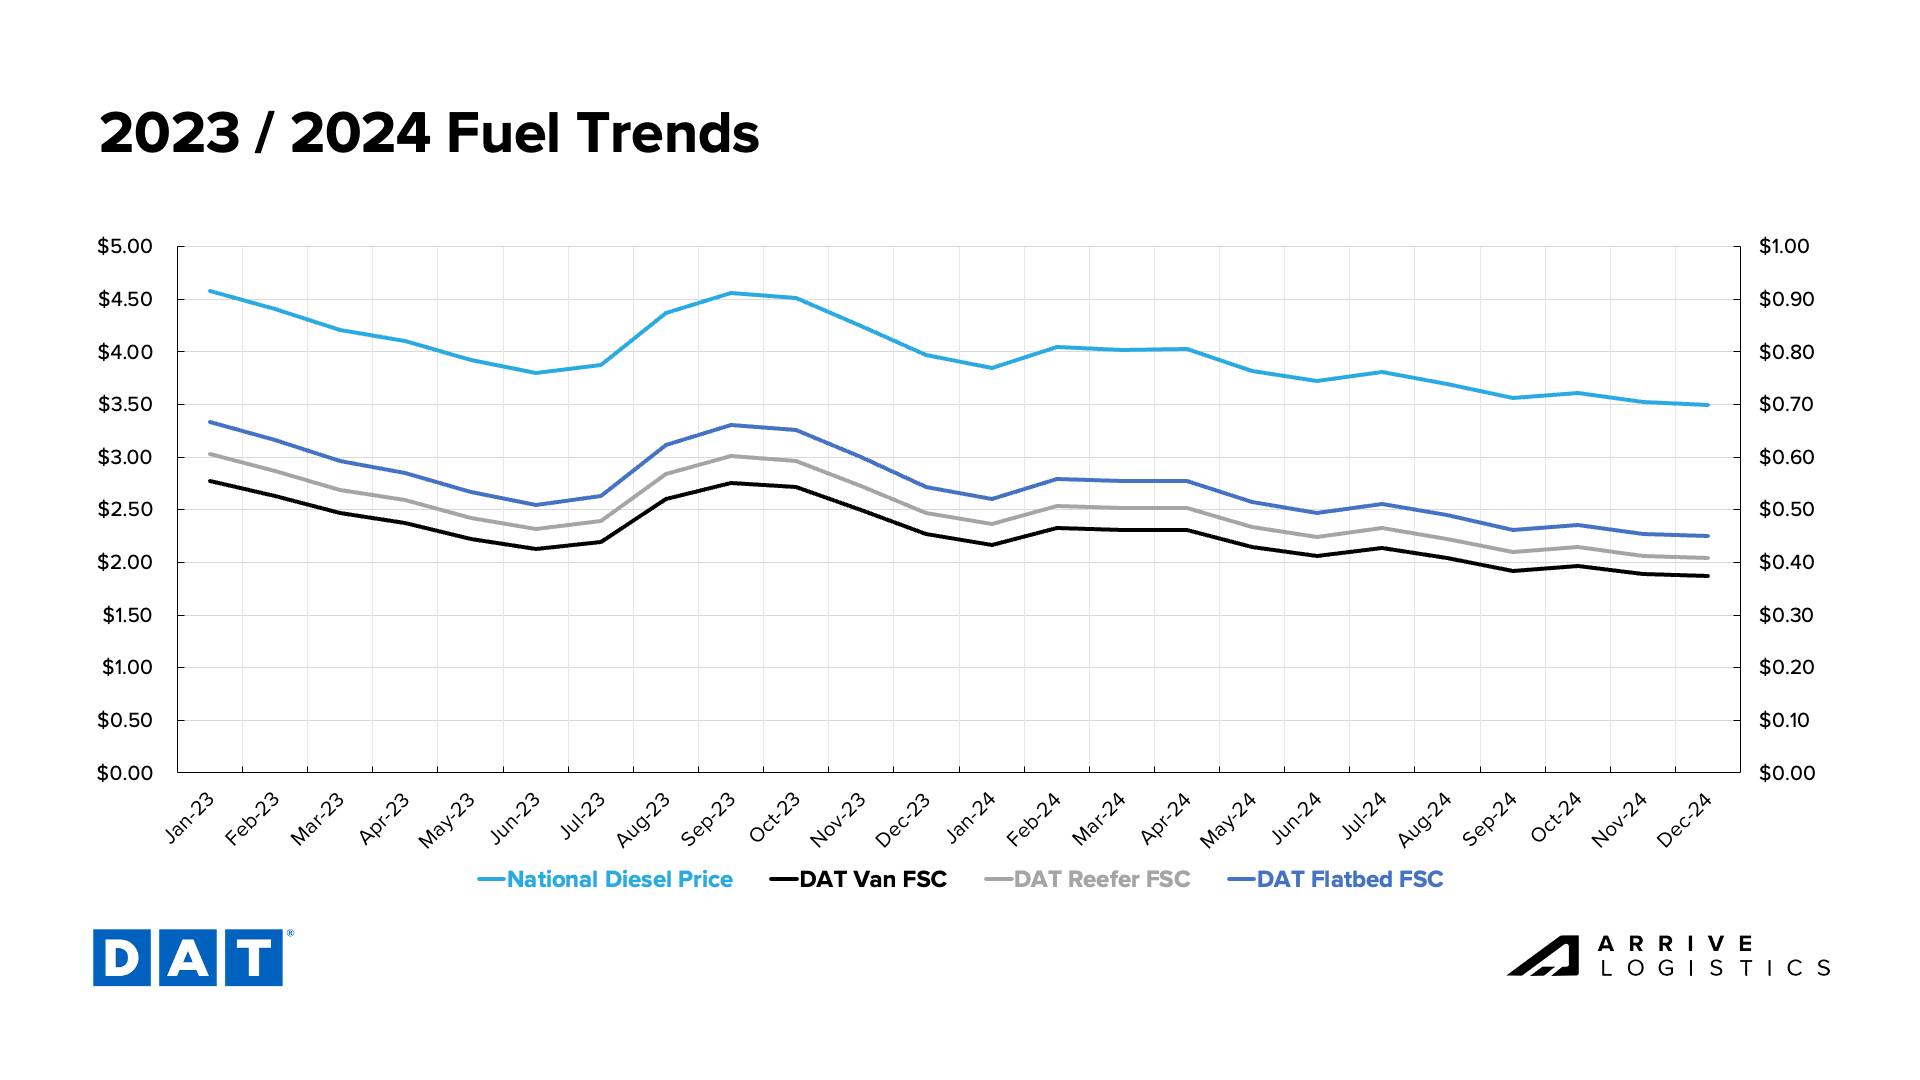
DAT Fuel Trends

DAT dry van data showed the seasonal rate volatility we would expect around the holiday season. At $1.73 per mile, excluding fuel, spot rates rose over 4% year-over-year in December, while contract rates returned to flat year-over-year. These rates are expected to decline during Q1.

The spot-contract rate gap remains large at $0.31 per mile, making any sustained disruption at this time unlikely. However, this is half the cycle high of $0.66 seen in November 2022, where linehaul spot rates were also $1.71 per mile, excluding fuel. As the gap closes further, the risk of normal seasonal patterns or other external catalysts creating sustained disruption to shipper routing guides increases.

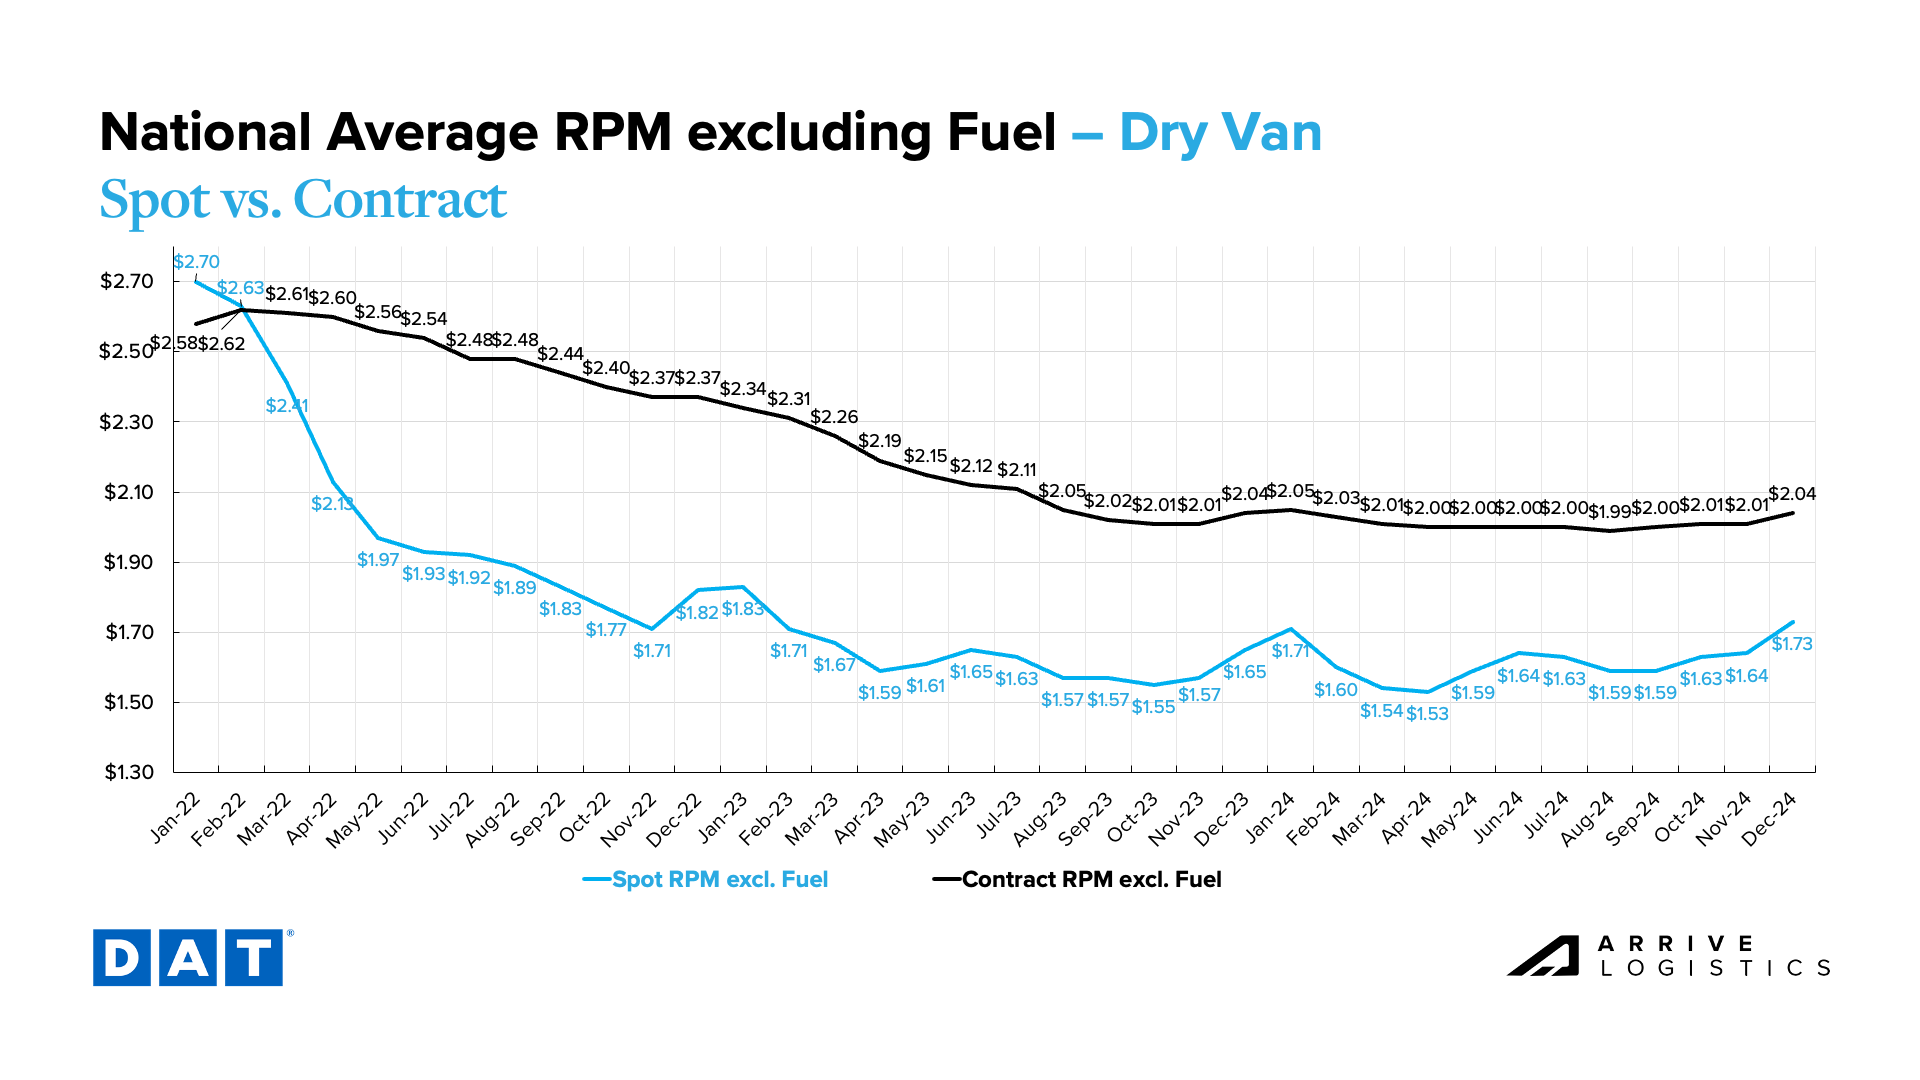
DAT Dry Van National Average RPM Spot vs. Contract

Reefer markets were volatile in November and December, with spot rates, excluding fuel, jumping up to $2.05 per mile from $1.97 per mile in October. Contract rates also increased slightly to $2.32 per mile but remained relatively stable overall.

Early December trends showed a slight pullback in spot rates. However, as challenges increased around the holidays, rates jumped up meaningfully.

The spot-contract rate gap is currently $0.27 per mile, a slight decrease from the cycle low of $0.28 per mile this November and down significantly from the cycle high of $0.58 per mile in October 2022, when spot linehaul rates were at $2.08 per mile, excluding fuel. As a result, the reefer market remains more susceptible to disruption than the dry van market.

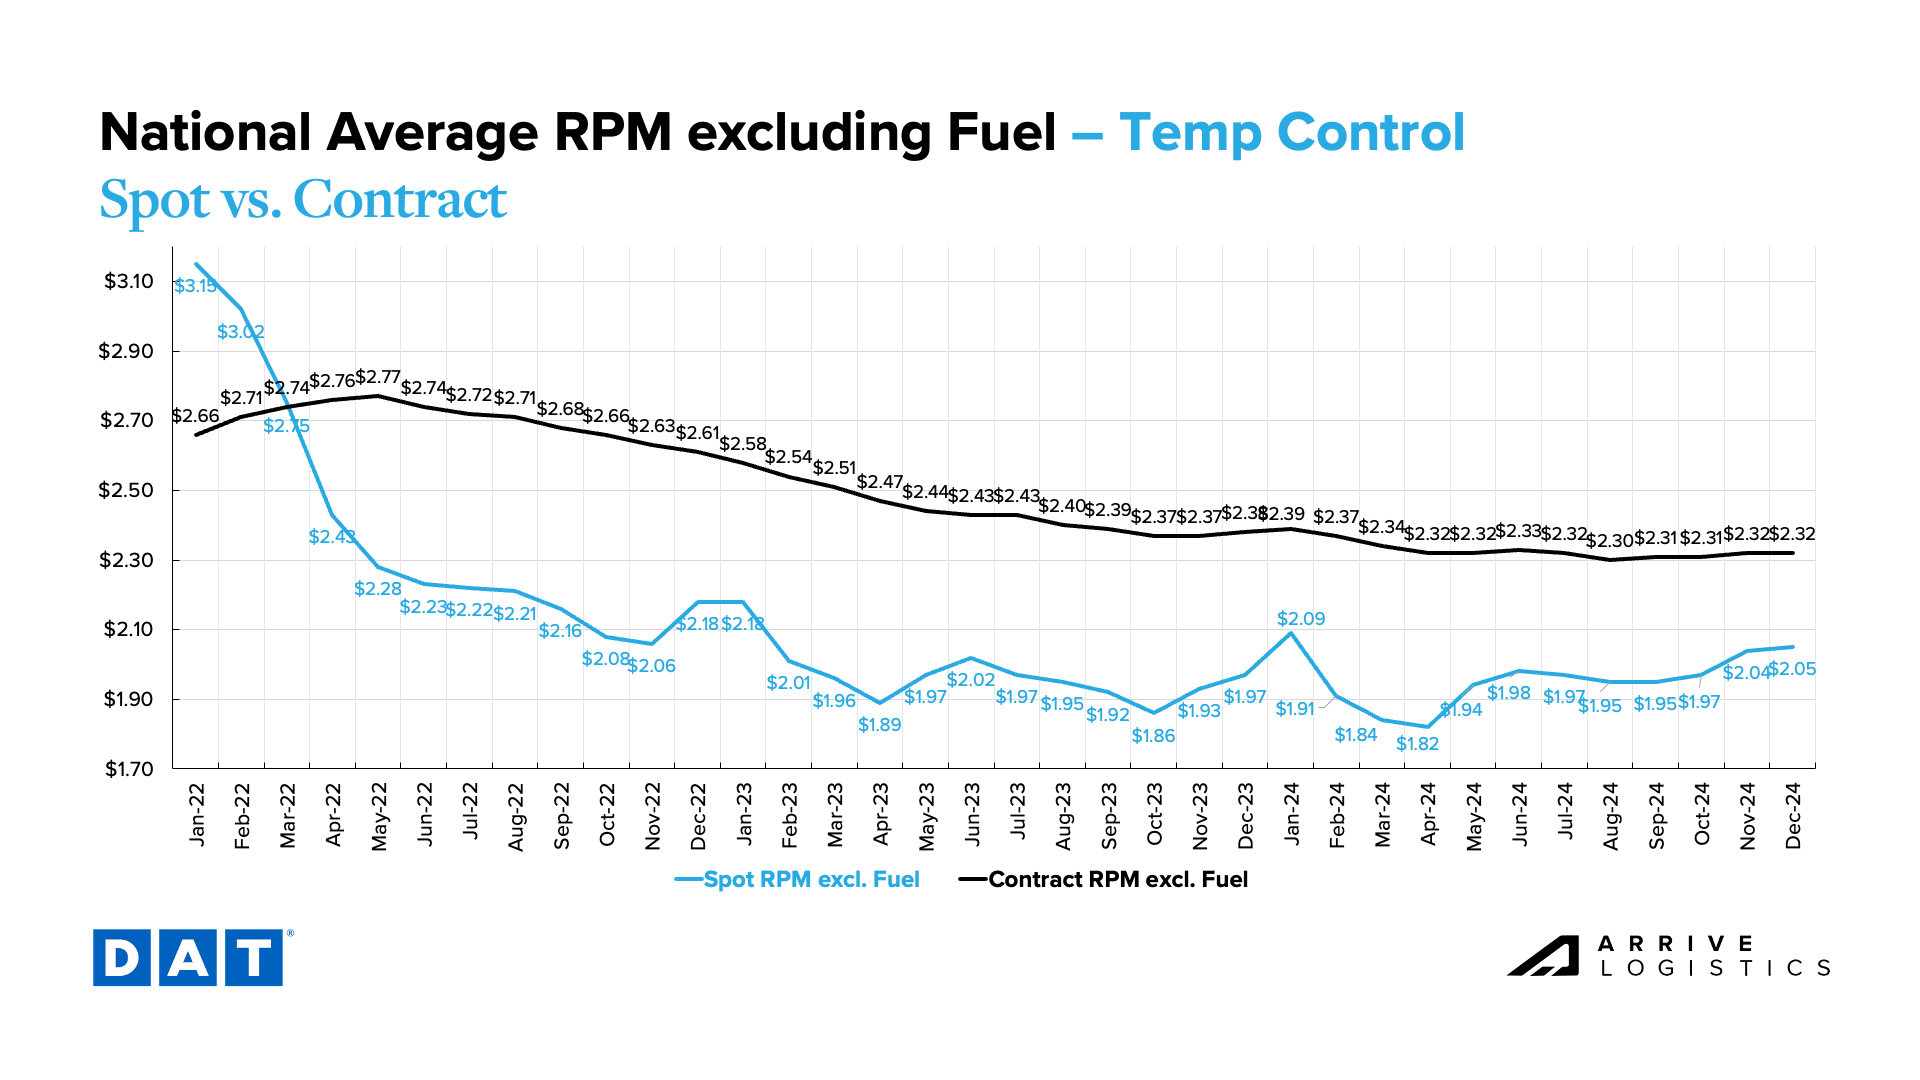
DAT Temp Control National Average RPM Spot vs. Contract

Flatbed spot rates rose slightly in December but remained relatively steady. Contract rates show a large uptick, but that is typical as tender rejections increase at this time of year. Ultimately, the flatbed market continues to follow a more stable pattern than dry van and reefer. The spot-contract rate gap remains historically elevated, with no major disruptions likely in the near term.

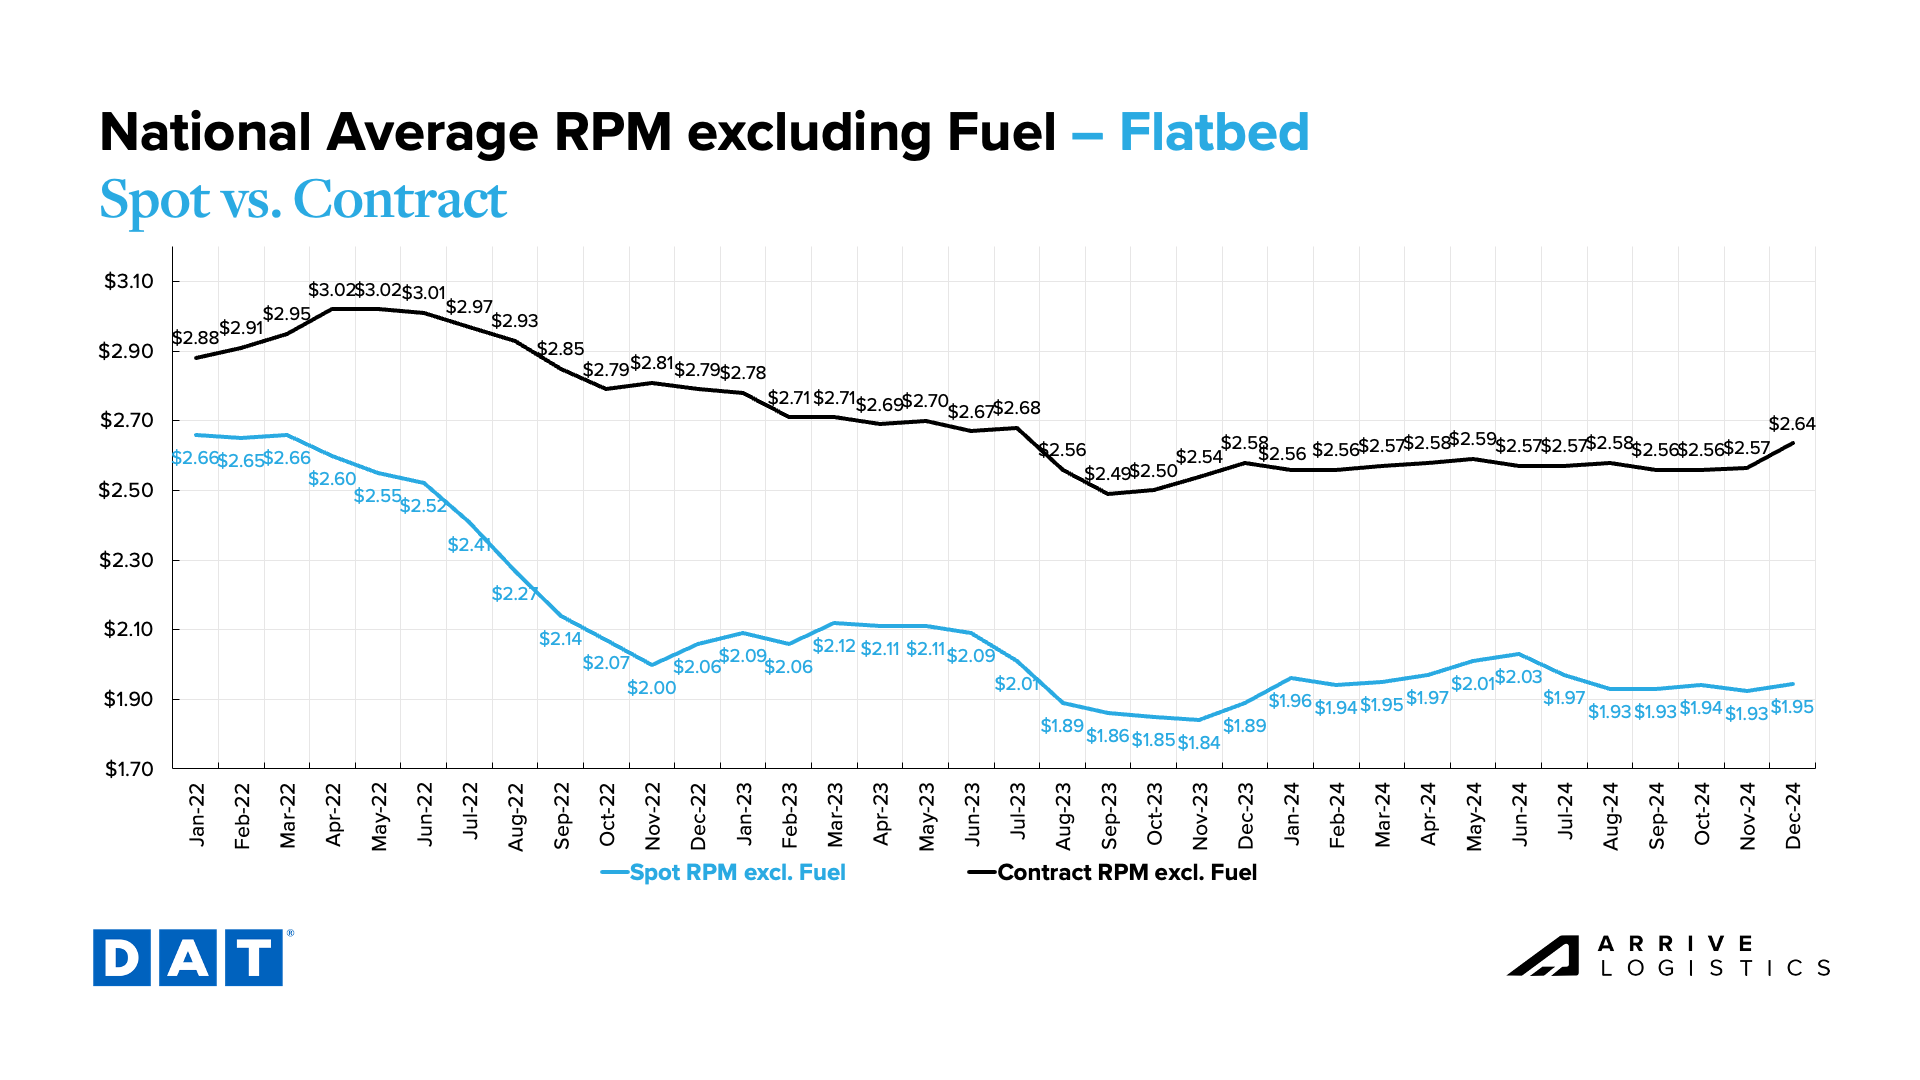
DAT Flatbed National Average RPM Spot vs. Contract

Economic Outlook

What’s Happening: Inflation ticked up in November.

Why It Matters: The Fed may pause rate cuts.

Inflation remains above the target rate and ticked up to 2.7% in November. The Fed made another quarter percent cut during its December meeting and will revisit additional rate cut plans in January. With inflation remaining sticky, the Fed may pause rate cuts at the beginning of the year. In any case, no meaningful implications of rate cuts will materialize in the freight market until late 2025.

New York Times Inflation Data

Recent Bank of America credit card data shows that consumers remain resilient. There were no signs of weakness in November or during the holiday shopping season, and spending levels should stay relatively stable in the near term as long as the labor market and wages continue to display strength.

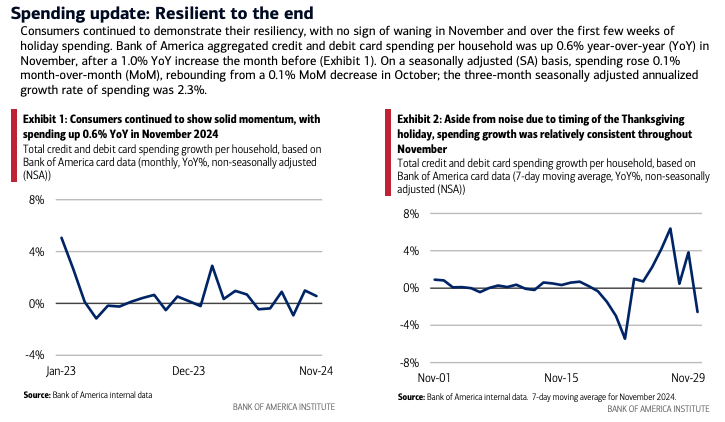
Bank of America, Total Card Spending per Household

Conclusion

As expected, typical seasonal trends dominated the 2024 peak holiday season and will continue to do so in Q1 2025. Higher tender rejection rates and increased spot activity following recent disruptions suggest the market is more balanced than it was a year ago. We are closely monitoring emerging holiday season trends to gauge how sensitive conditions might be to sustained disruptions in 2025.

Demand stability appears likely, particularly as shippers accelerate imports amid concerns over a potential second port strike and upcoming tariff increases. However, we believe supply remains sufficient to maintain routing guide compliance beyond the peak season. As the new administration’s policies take shape, we expect greater clarity on how they might impact transportation markets, with key areas of focus including tariffs, immigration, labor, industry regulation and environmental policies

With the right catalysts, a market shift is possible, but we are not yet prepared to predict widespread disruption in the near term. For now, we are watching for additional signs of vulnerability or any significant events that could abruptly affect demand or supply.

About the Carrier Market Update

The Arrive Carrier Market Outlook, created by Arrive Insights™, is a report that analyzes data from multiple sources, including but not limited to FreightWaves SONAR, DAT, FTR Transportation Intelligence, Morgan Stanley Research, Bank of America Internal Data, ACT Research, Journal of Commerce, Stephens Research, National Retail Federation and FRED Economic Data from the past month as well as year-over-year. We know market data is vital in making real-time business decisions. At Arrive Logistics, we are committed to giving you the data and insights you need to better manage your freight.

Tim Denoyer,
VP and Senior Analyst at ACT Research

As VP and Senior Analyst at ACT Research, Tim analyzes commercial vehicle demand and alternative powertrain development (i.e. electrification), and authors the ACT Freight Forecast, U.S. Rate and Volume Outlook. He previously spent fifteen years in equity research focused primarily on the transportation, machinery, and automotive industries, and co-founded leading equity research firm Wolfe Research.

Contact Us

"*" indicates required fields

Subscribe to receive freight market updates​​

"*" indicates required fields


Quick Apply

"*" indicates required fields

Max. file size: 50 MB.

Arrive Carrier Requirements

Please have the following info ready to complete registration

  • MC, MX, DOT, or state reg #
  • Tax ID & W9 info
  • Cert of Insurance: $100k cargo, $1M Auto, & $1M commercial general liability coverage
  • Active Common or Contract Authority (365+ days)
  • Safety Rating of at least Satisfactory (or None)

Use of Cookies

We use cookies to enhance your browsing experience, serve personalized ads or content, and analyze site traffic. By continuing to use this website, you acknowledge and consent to our use of cookies as detailed in our privacy policy.

Fraud Prevention

Freight fraud continues to impact our industry. We encourage shippers and carriers to reach out to Arrive immediately if there is ever a shipment in question that may be subject to fraud. Arrive Logistics registered email domain is @arrivelogistics.com. Our 24/7 phone number is 888-861-0650 and our leadership team can also be reached at feedback@arrivelogistics.com

Get Access to the Shipper Portal

Current Customers

Already shipping with Arrive?

Connect with your representative to get access to your ARRIVEnow Shipper Portal. Can’t connect with your rep? Use this form to reach out.

New Customers

Not shipping with Arrive yet?

If you’re not an Arrive customer, please join our network to access the portal.

Carrier Scorecard Feedback

Scott Sandager,
Chief Administrative Officer 

Scott Sandager is the Chief Administrative Officer at Arrive Logistics. He joined Arrive in 2018, bringing over 14 years of logistics and brokerage experience, with expertise in project and change management, organizational design, talent development and customer satisfaction. Scott previously held many diverse roles of increasing responsibility with AFN, a Chicago-based freight brokerage.

Barry Conlon,
CEO & Founder at Overhaul

Barry Conlon is the CEO and founder of Overhaul, the global leader in active supply chain risk management and intelligence. With a remarkable career spanning over 30 years in supply chain security, he is widely regarded as a trailblazer in modern-day supply chain security standards and best practices.

Matt Pyatt, Chief Executive Officer

Matt Pyatt is the Chief Executive Officer of Arrive Logistics. He co-founded Arrive with President Eric Dunigan in 2014 after building his career at Command Transportation. As CEO, he is responsible for overseeing the company’s financial health, strategic vision and culture, as well as building a scalable leadership team to support Arrive’s growth.

Eric Dunigan,
President & Co-Founder

Eric Dunigan is the President of Arrive Logistics. He began his career at Command Transportation before co-founding Arrive with Matt Pyatt in 2014. As president, he is responsible for driving revenue and growth, as well as leading the Strategic Partnerships team — a veteran group of supply chain experts who work with Arrive’s customers to reimagine their shipping strategy.

Arrive Logistics VP of Market Intelligence David Spencer Headshot

David Spencer,
VP of Market Intelligence

David Spencer is the Vice President of Market Intelligence at Arrive Logistics. David joined Arrive in 2017 after spending six years at AFN focused on business intelligence. His department provides critical market data and expert analysis to internal teams and publishes monthly market updates for shippers and carriers under the Arrive Insights banner.

Andrew Clarke, Board Chair,
Arrive Logistics and Global Critical Logistics

Andrew Clarke is Board Chairman for Global Critical and DCLI, Inc., and a board member for Arrive Logistics and Element Fleet Management Corp. His 20 years of global transportation and logistics experience include time as CFO of C.H. Robinson, CEO of Panther Expedited Services, Inc. and SVP and CFO roles at Forward Air Corporation.

Dean Croke,
Principal Analyst
at DAT Freight and Analytics

Dean Croke is a Market Analyst at DAT Solutions, where he focuses on freight market intelligence and data analytics. His 35 years of experience with data analytics, transportation, supply chain management, mining and insurance risk management include time as co-founder of FleetRisk Advisors and in a number of other high-level roles with FreightWaves, Spireon, Lancer Insurance, Omnitracs Analytics (formerly Qualcomm) and more.

Asanka Jayasuriya,
CTO and Partner at 8VC

Asanka Jayasuriya is the CTO at 8VC. He is an accomplished engineering and product leader with 20+ years of experience in the cloud. He has a strong background in enterprise SaaS, PLG products, infrastructure, and security. Notably, he served as CTO and SVP of Engineering at SailPoint, leading their successful transition to the cloud and successful exit event. He also held senior leadership roles at InVision, Atlassian, and Amazon, driving growth, operational excellence, and innovation. At 8VC, Asanka works with the entrepreneurs and leaders in our portfolio as a virtual CTO supporting their growth.

Chad Eichelberger,
President at Reliance Partners

Chad Eichelberger is the President of Reliance Partners. Since 2015, he’s leveraged his extensive experience in risk management, compliance, best practices and contracts to lead the company’s logistics and truck insurance strategy and operations. Chad was previously the President of Access America Transport, where he led the company from $8M to over $600M in revenue.

Download this Report

"*" indicates required fields

Add me to the monthly distribution