


The Morgan Stanley Dry Van Freight Index is another measure of relative supply; the higher the index, the tighter the market conditions. The black line with triangle markers on the chart provides a great view of what directional trends would be in line with normal seasonality based on historical data dating back to 2007.
2023 ended with some increased tightness in line with typical seasonality. The market tightened as 2024 began, with three straight reports outperforming expectations. However, the last reading showed slightly loosening conditions and aligned with the 10-year average.
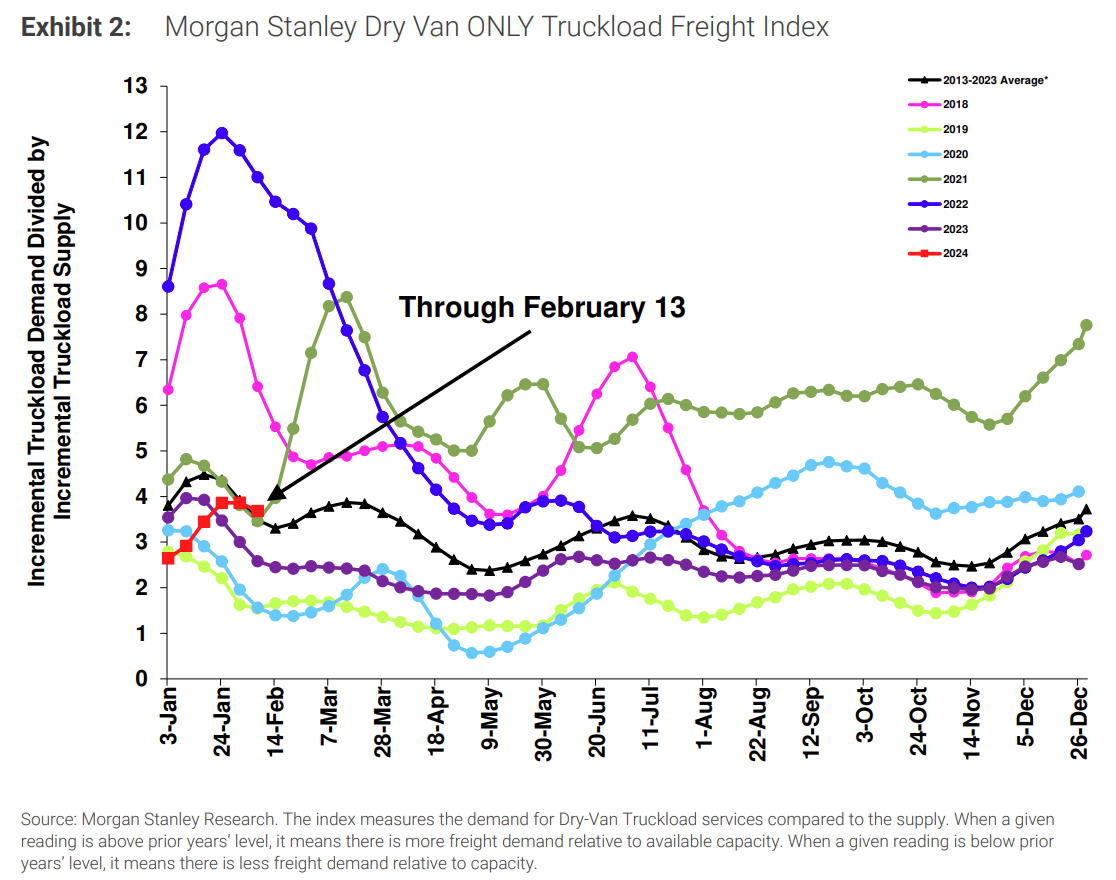 Figure 1: Morgan Stanley Dry Van Truckload Freight Index
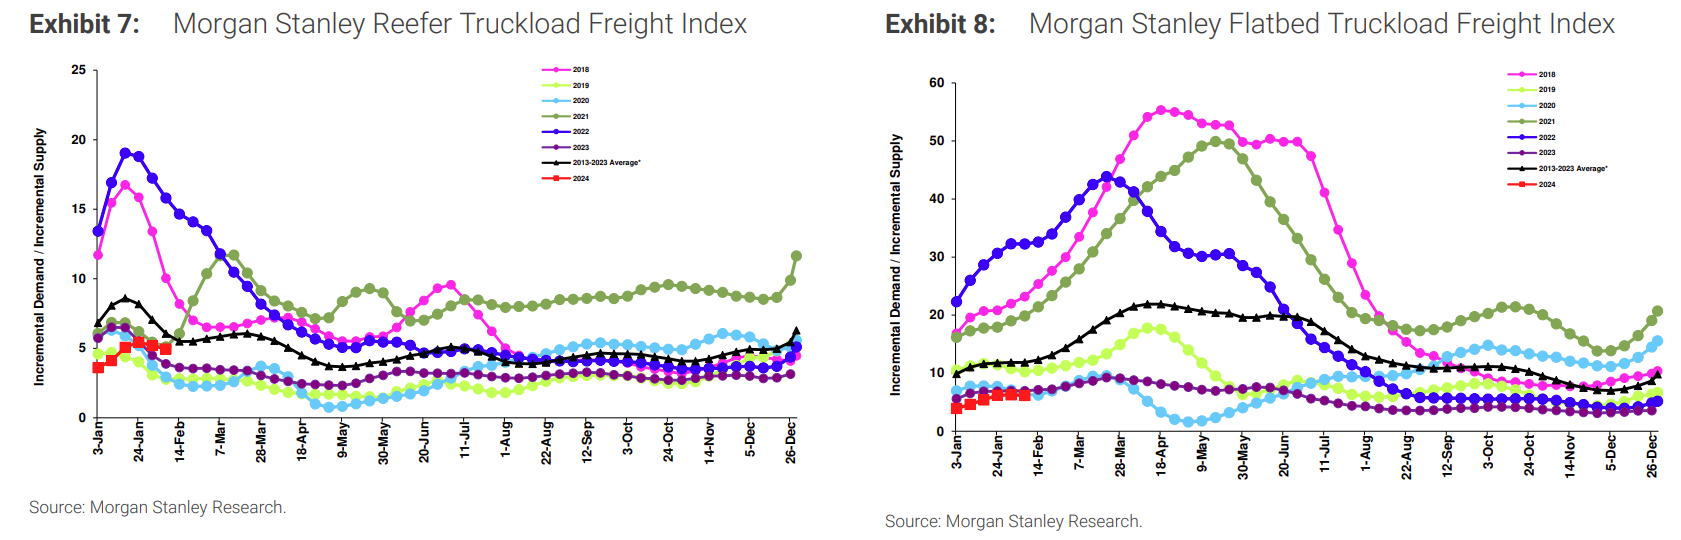
Figures 2 & 3: Morgan Stanley Reefer and Flatbed Truckload Freight Indices
According to ACT’s Supply-Demand Index, conditions have tightened over the last five months after loosening for the previous 17. The index rose by 2.2 points month-over-month to 54.2 in December. The last five months of tightening largely resulted from capacity exits and volume declines. While the index represented tightening conditions in December and likely will again in January, a meaningful market flip is still months away.
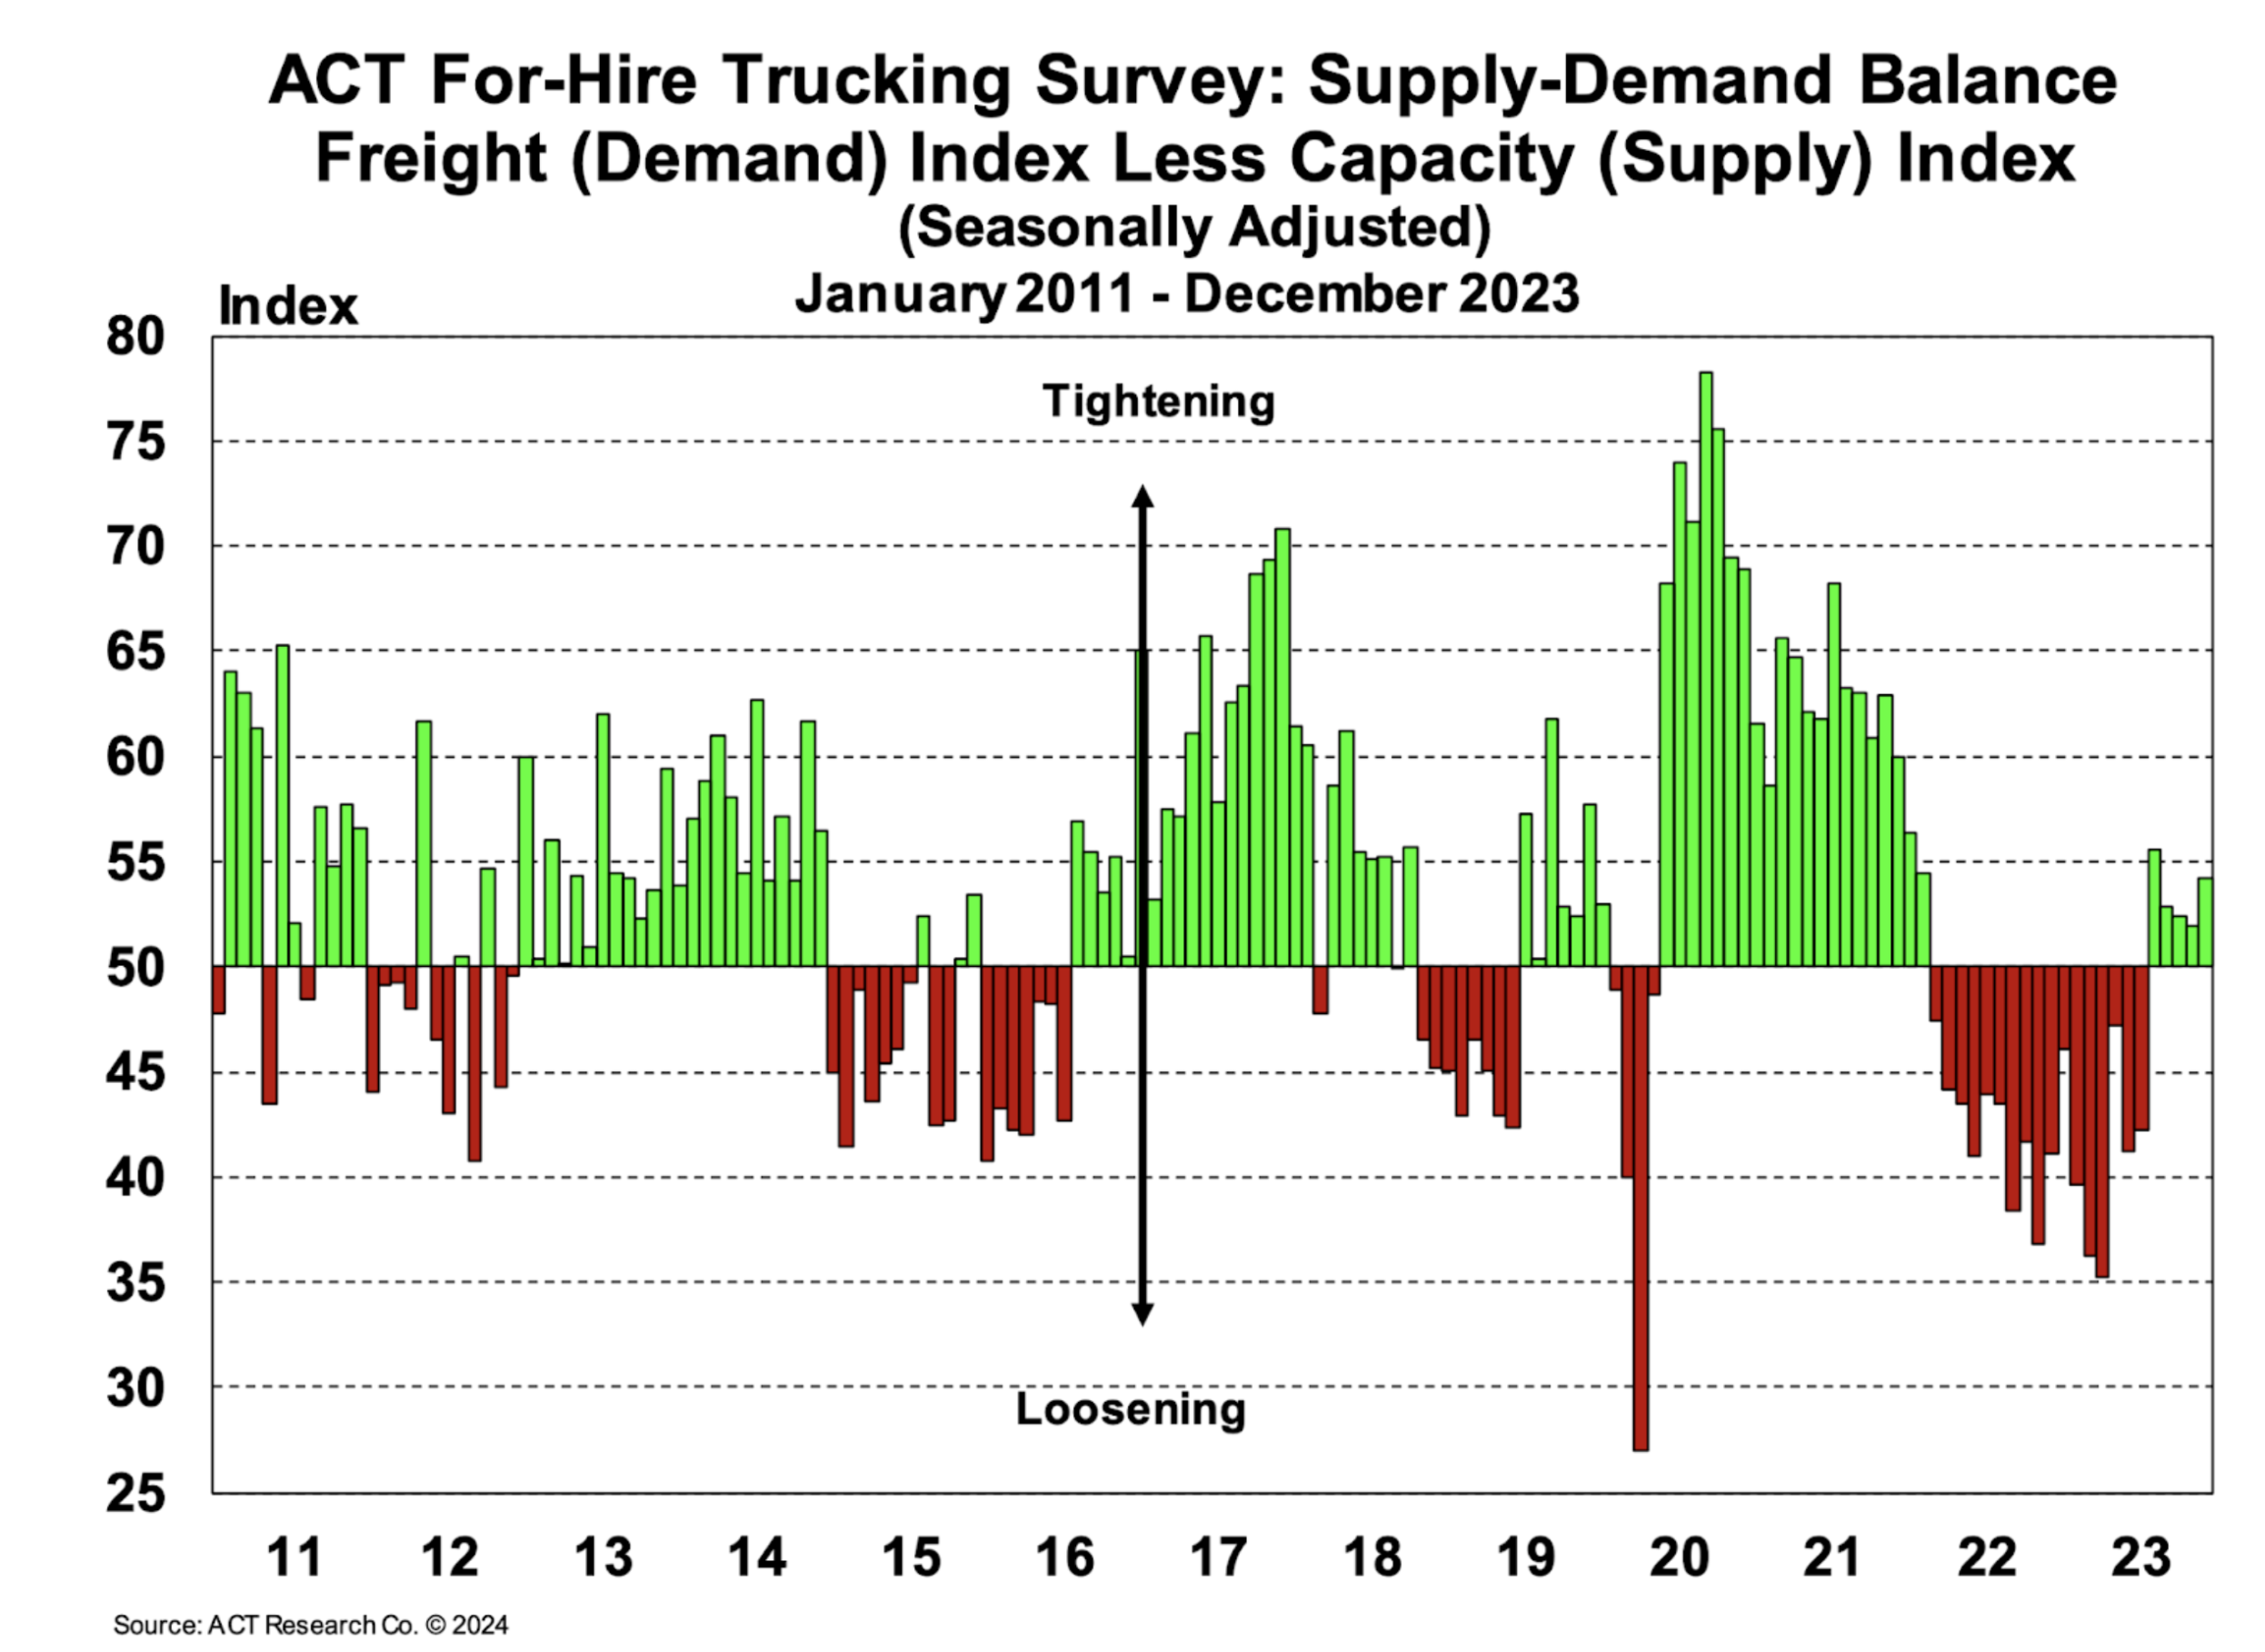
Figure 4: ACT For-Hire Trucking Survey
January market conditions deviated from 2023 trends, with increased sensitivity caused by weather-related events. This volatility points to improved capacity balance year-over-year and signals that the market is still moving toward equilibrium. However, dry van conditions remain loose, while increased reefer rejection rates indicate that the temp-control market is farther along in recovery than the dry van market.
The Sonar Outbound Tender Reject Index (OTRI), which measures the rate at which carriers reject freight they are contractually required to take, has been hovering over 5% for the majority of the year and remains above the tender rejection rates at this time last year. The slight rise in tender rejections results from weather-induced spot volatility and recent capacity reductions.
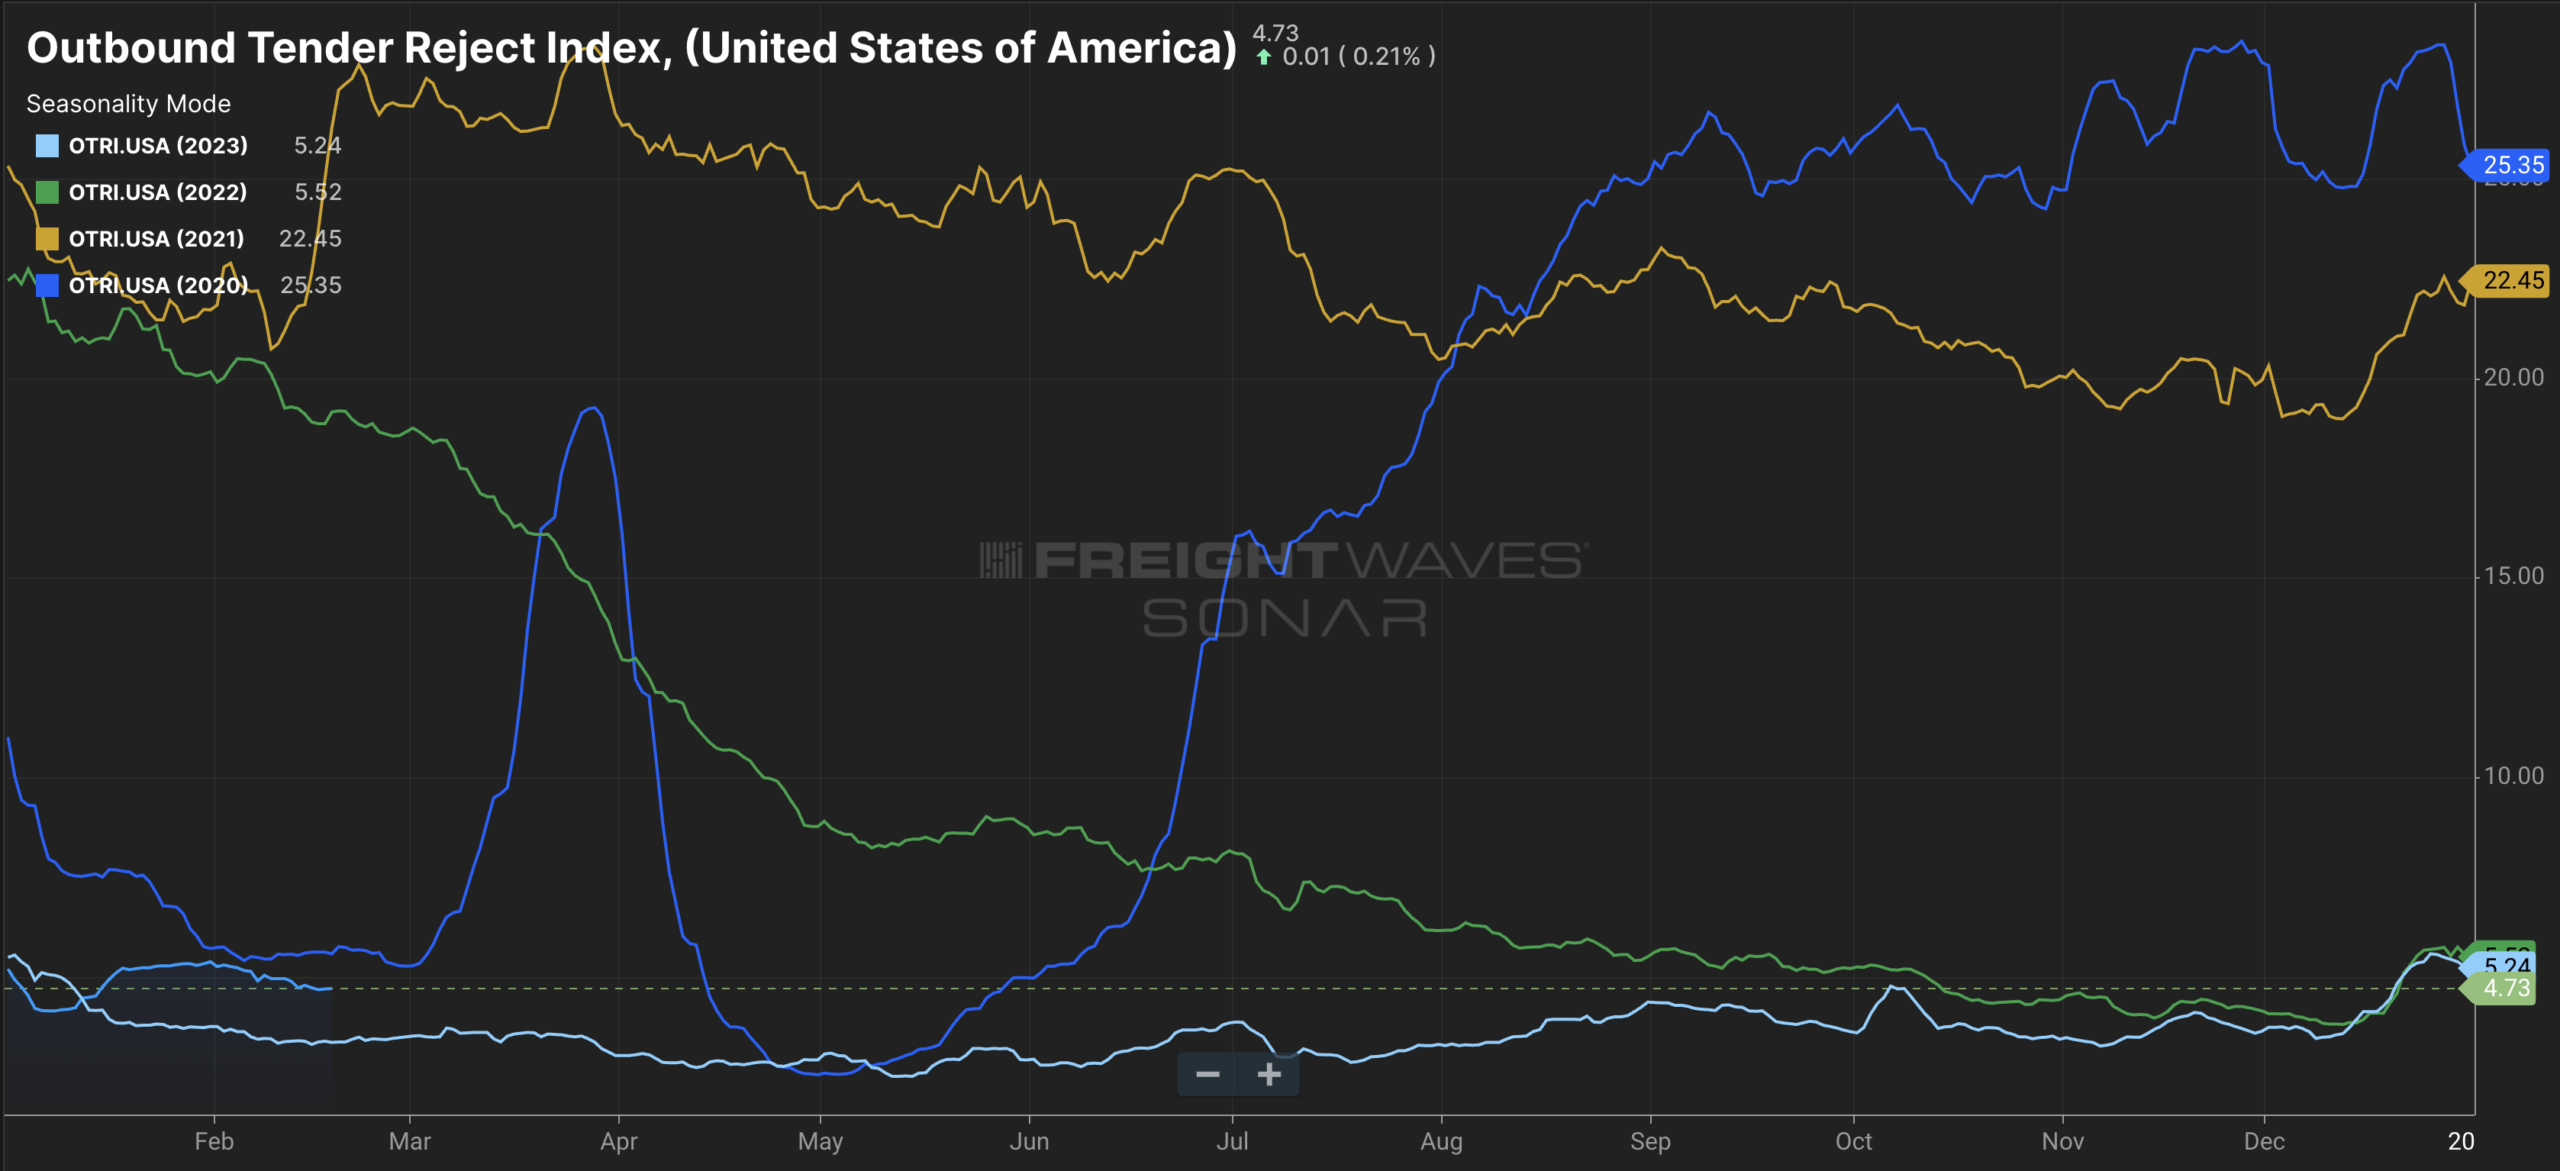
Figure 5: Outbound Tender Reject Index (SONAR)
Tender rejections, specifically for dry van freight, remain slightly below 5% and relatively flat this year. On the other hand, reefer tender rejections increased by over 10% in January before declining by under 9% in early February. The sharp uptick directly resulted from winter weather but still indicates that the reefer market is more vulnerable to disruption than the dry van market.
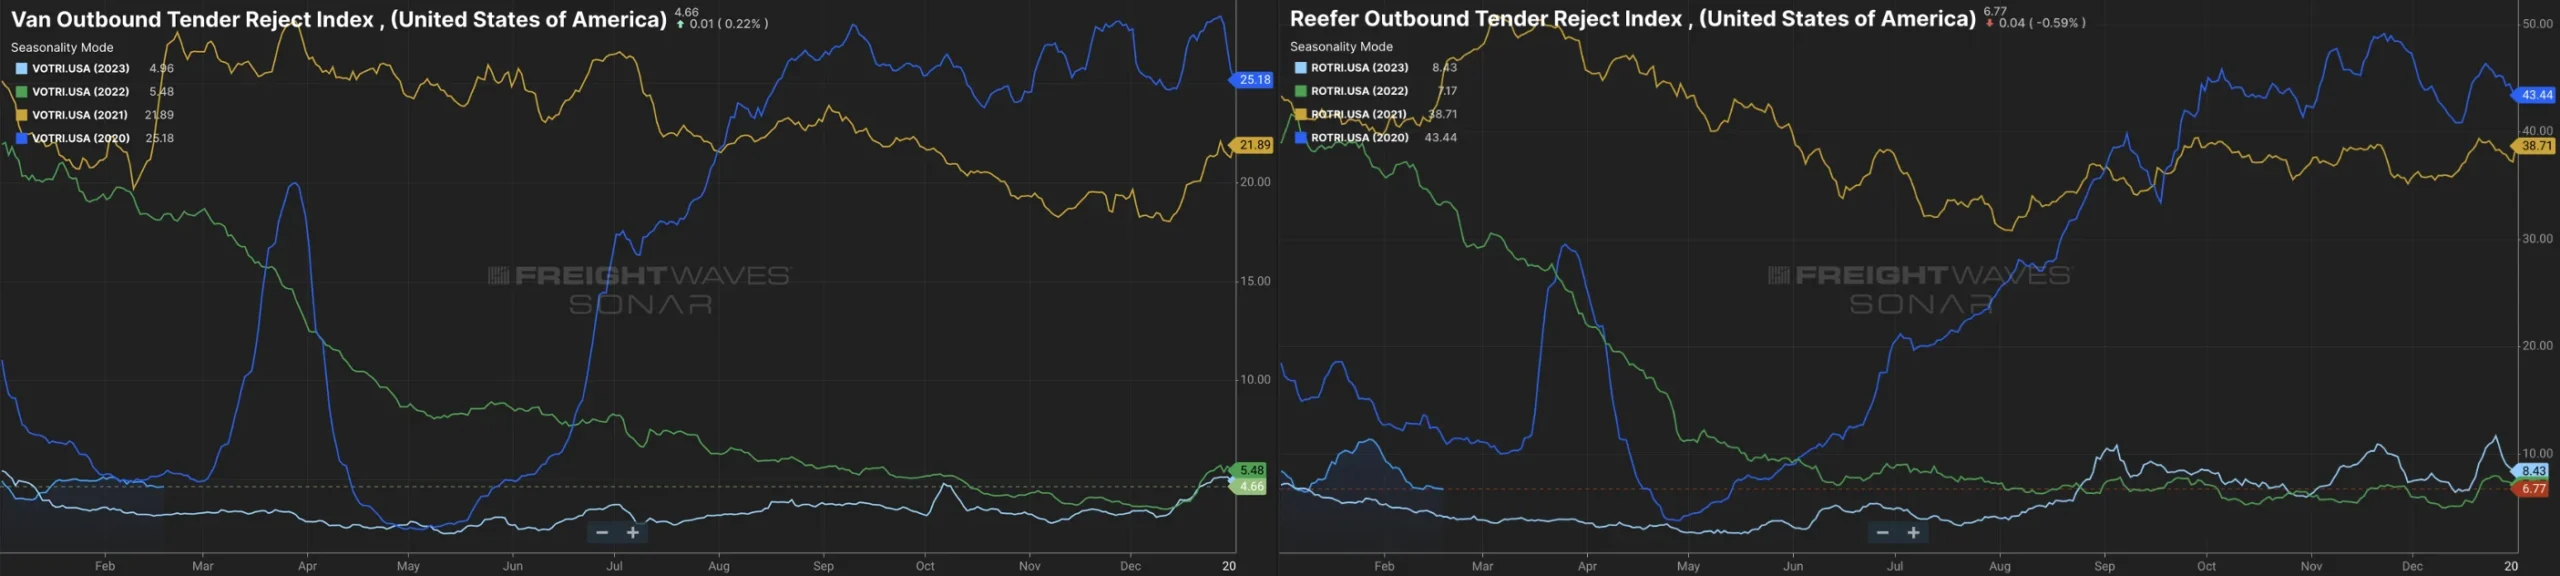 Figures 6 & 7: Van & Reefer Outbound Tender Reject Indices
The FreightWaves SONAR Outbound Tender Volume Index (OTVI), which measures contract tender volumes across all modes, was up 9.8% year-over-year, or 8.1% when measuring accepted volumes.
Adjusted accepted volumes were down 4% month-over-month in early February, driven by a 3.7% decline in accepted dry van tenders and a 2.4% decline in accepted reefer tenders.
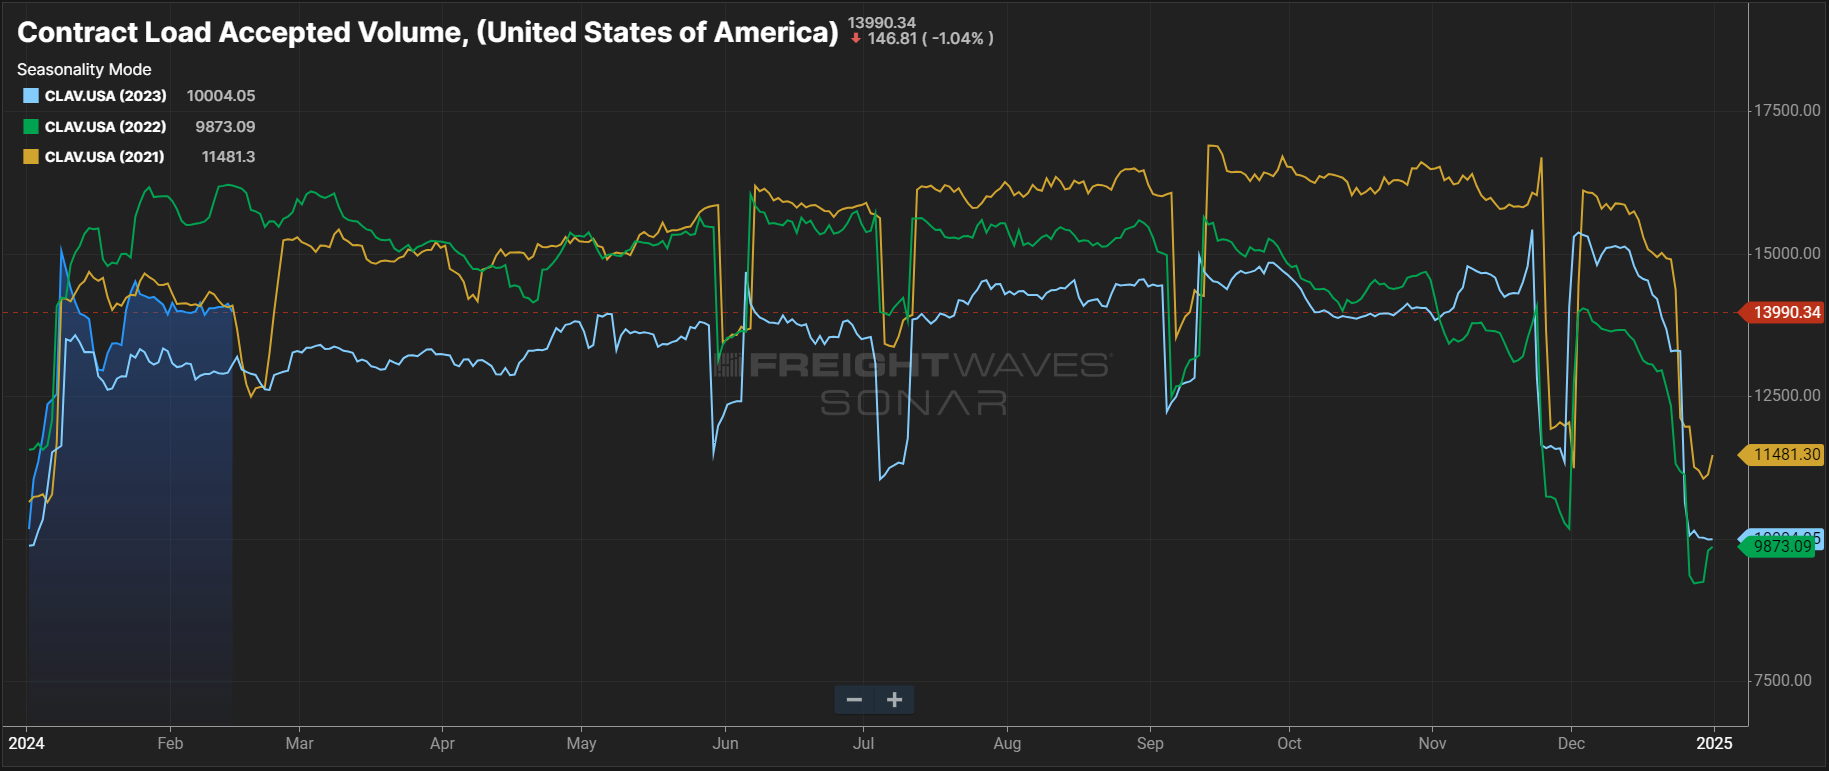
Figure 8: Contract Load Accepted Volume (SONAR)
The DAT Load-to-Truck Ratio measures the total number of loads relative to the total number of trucks posted on their spot board. January data showed slight upticks from December 2023 and a load-to-truck ratio slightly below January 2023 levels. The dry van load-to-truck ratio came in at 2.69, while the reefer ratio came in at 4.14.
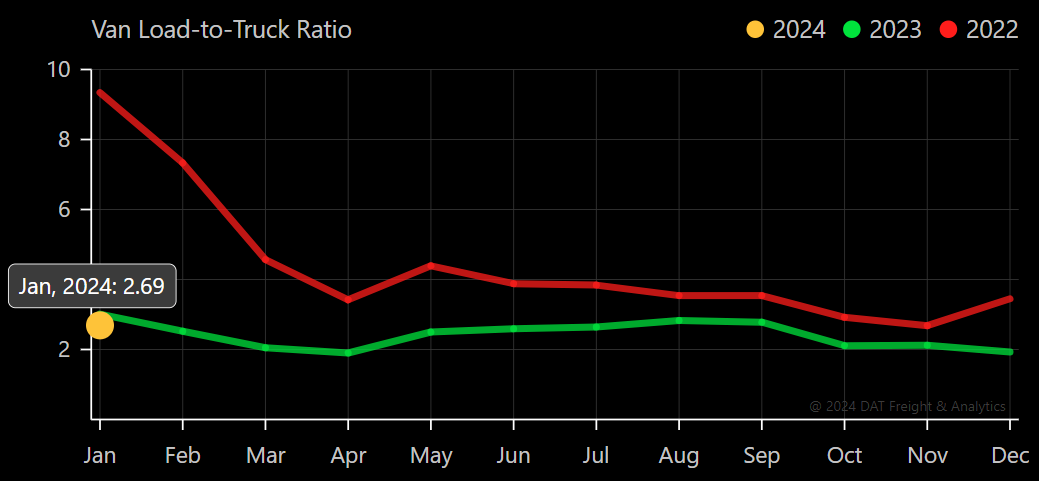 Figure 9: DAT Van Load-to-Truck Ratio
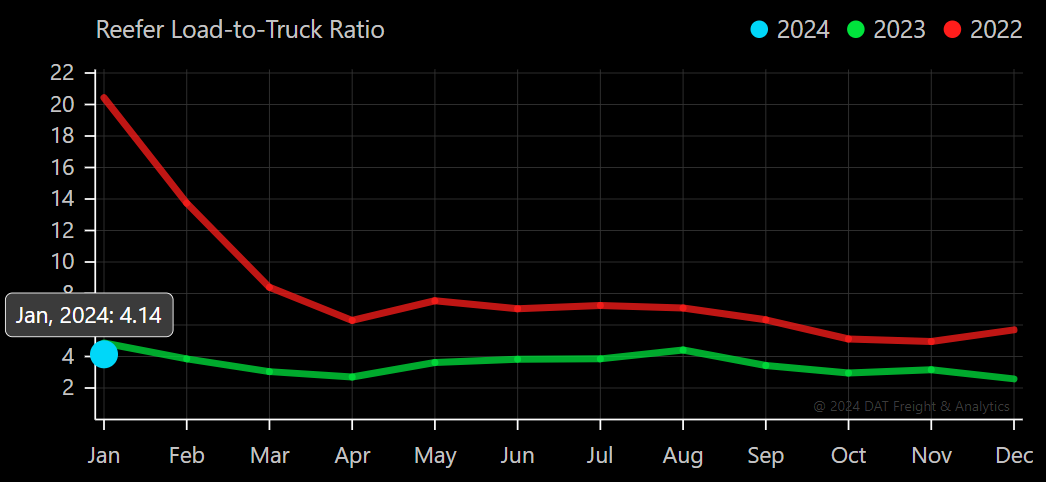 Figure 10: DAT Reefer Load-to-Truck Ratio
Linehaul rates have shown some volatility recently due to holiday and winter weather-related disruptions. However, rates are down year-over-year and have started to return to cycle lows. That trend and a recent surge in fuel prices are increasing carriers’ operational expenses.
Net revocations continue to outpace new entrants. In January, we saw the highest number of net revocations since the second quarter of 2023. Although there have been proportionally fewer capacity exits than in previous down cycles, this trend could indicate that more carriers are beginning to leave the market as expenses outpace spot rates.
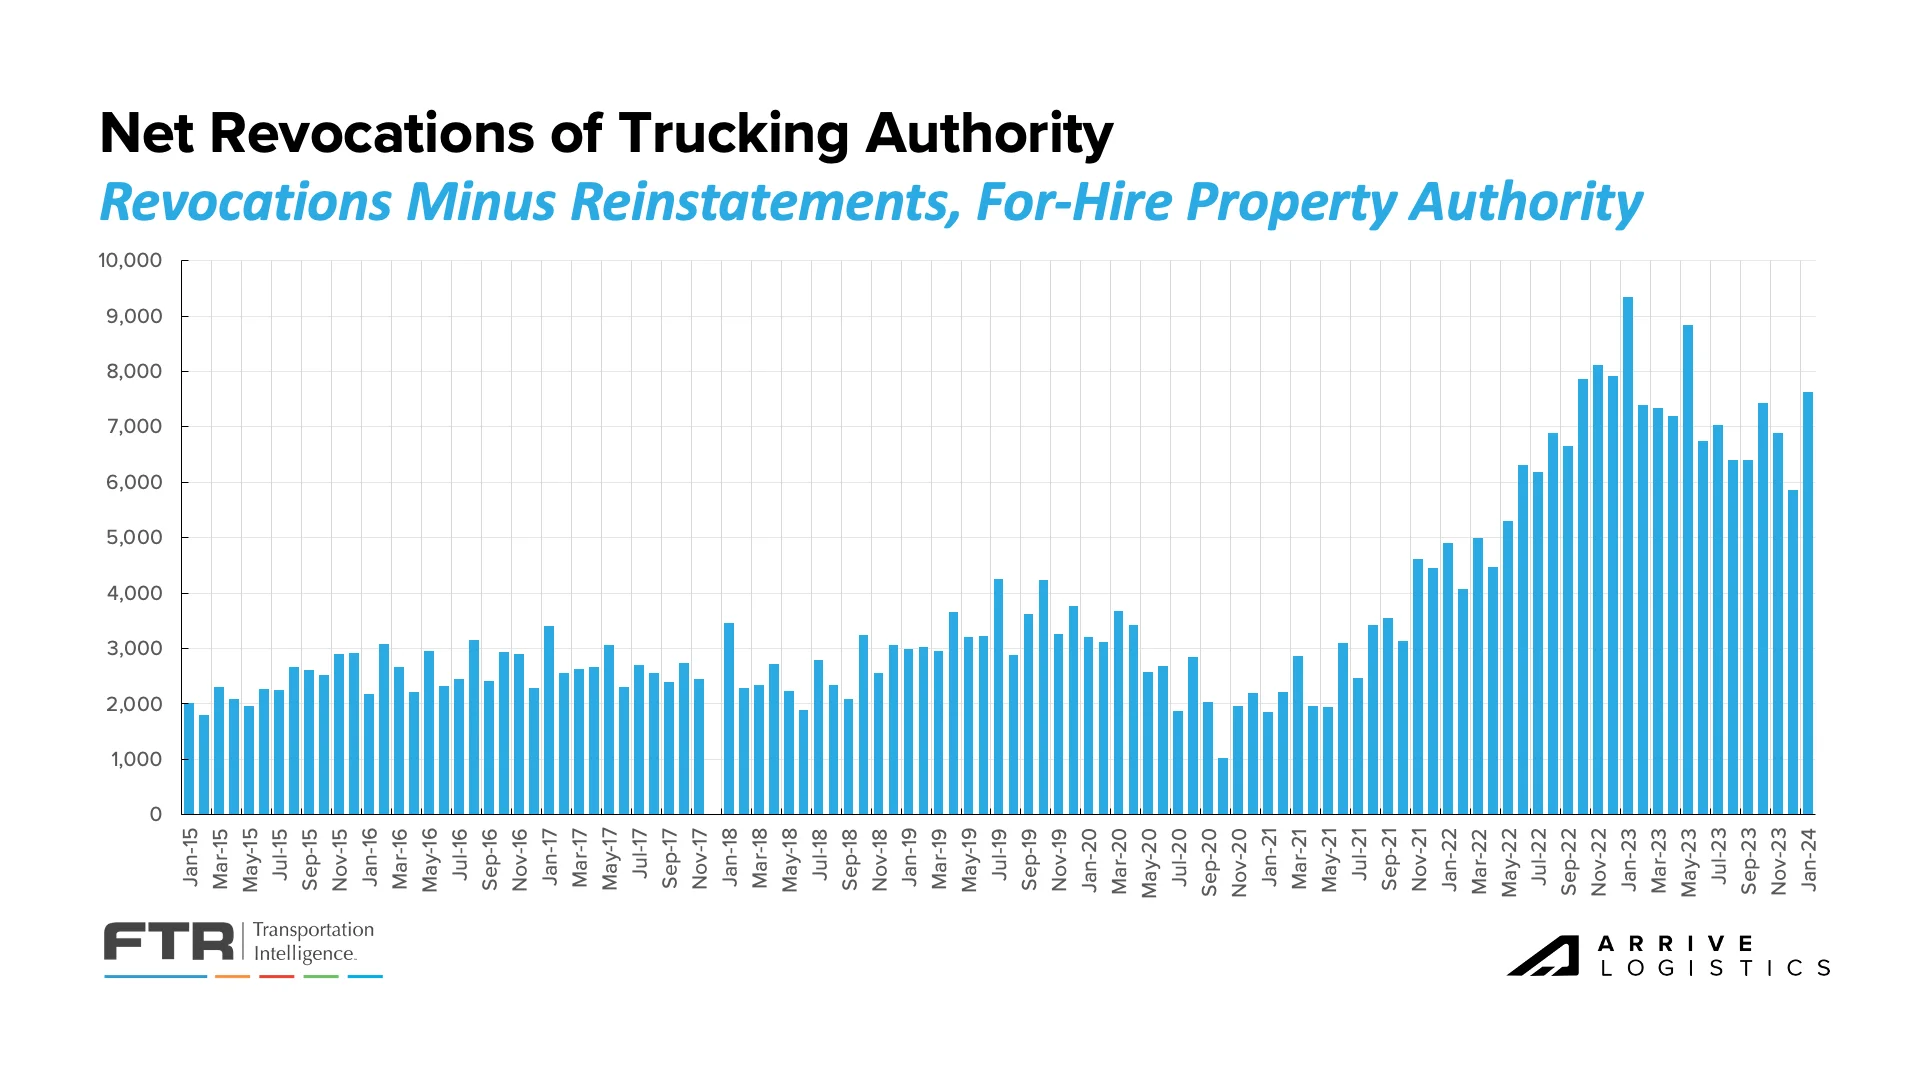 Figure 11: FTR’s Net Revocations of Trucking Authority
Carriers are facing challenges again after surging spot rates and declining fuel prices supported a strong start to the year. These trends put more financial strain on carriers, especially those with heavy spot exposure, and should result in a continuation of the ongoing supply-side correction.
The Net Change in Carrier Population metric depicts the difference between the number of new carrier entrants and revocations of authority. While not the most precise measure of capacity movement because many of the carriers closing have just one or two trucks, this trend supports the narrative that challenging conditions are reducing capacity on the road.
The largest quarterly carrier population decline occurred in Q4 2023, when the total fell by more than 7,200. The acceleration continued in January, with the population dropping by nearly 3,600 — the highest number of exits in a single month since May 2023.
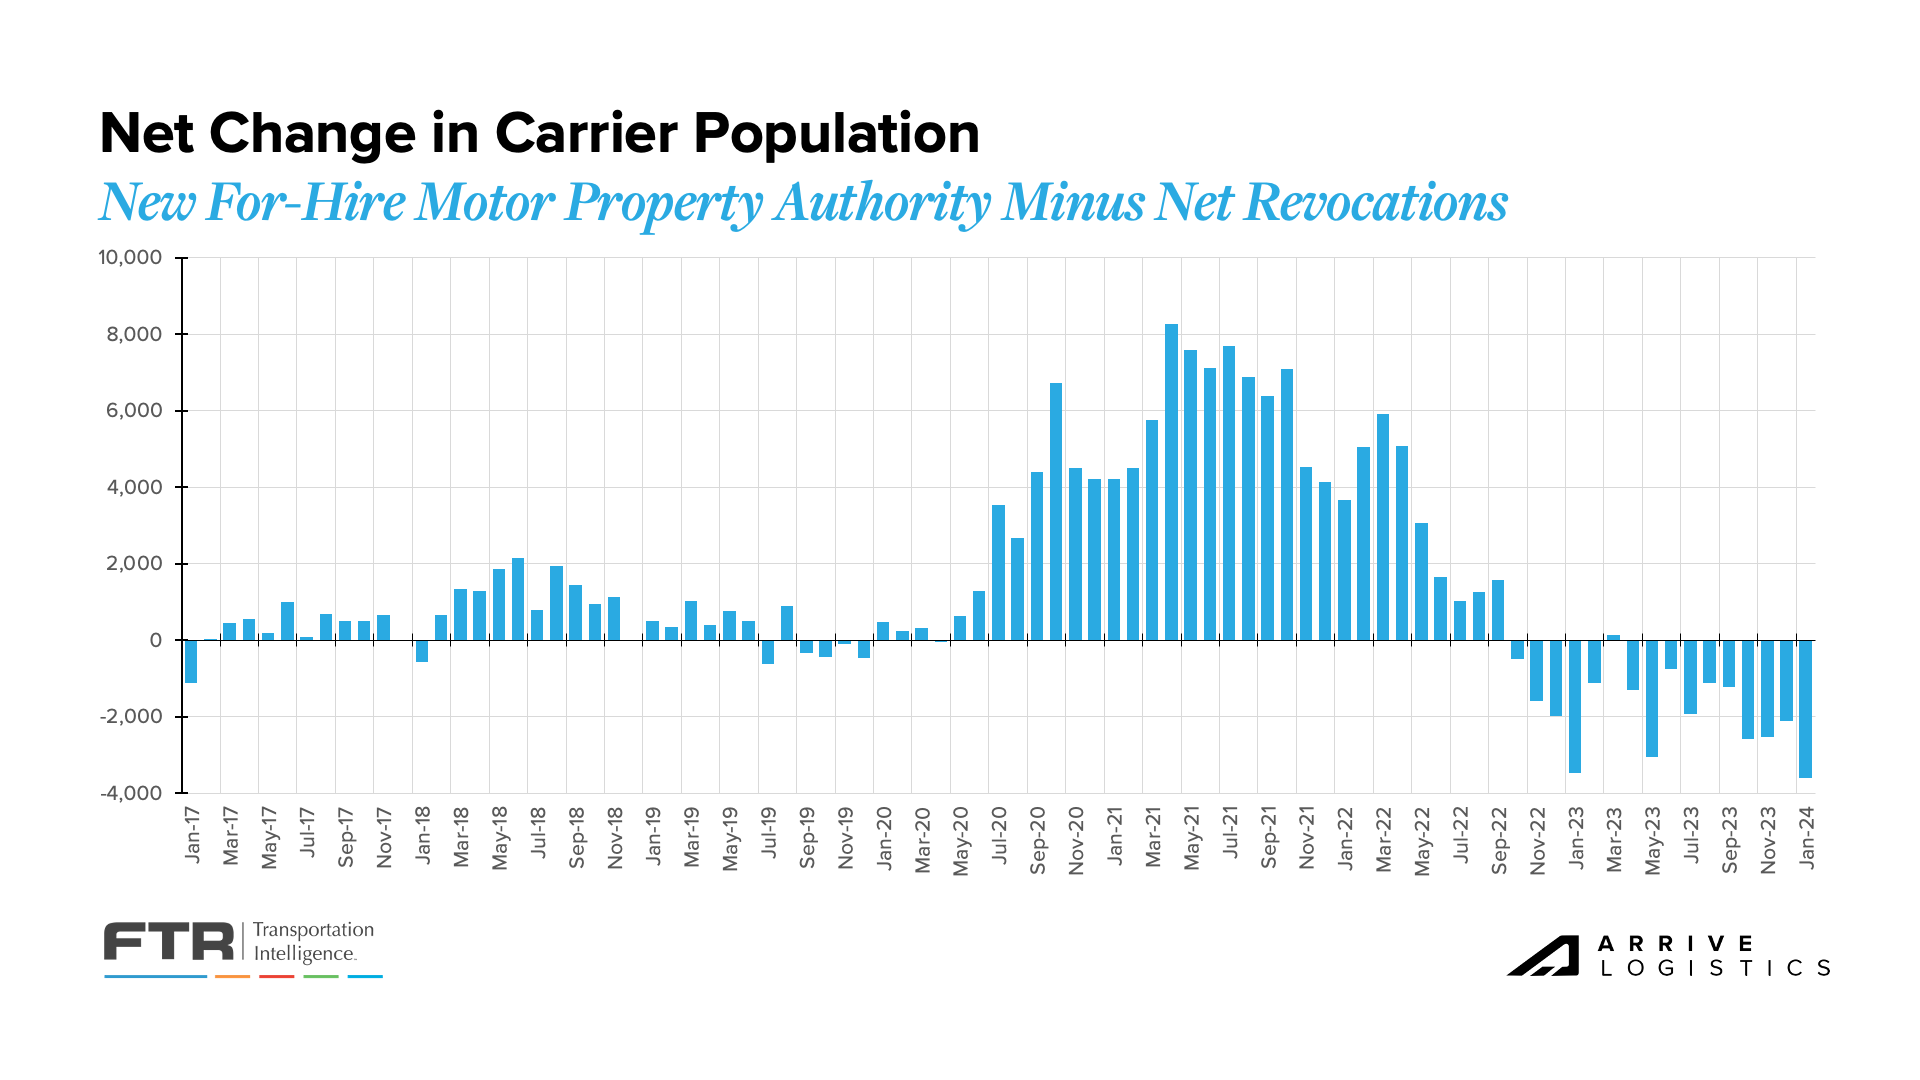 Figure 12: FTR’s Net Change in Carrier Population
New truck orders declined at the end of 2023 but were still above the year’s average. According to FTR, there were 23,900 new orders in December, a 26.9% decrease from November and a 7.6% decrease from December 2022. If orders and production outpace replacement levels, it could slow the capacity correction and extend this downcycle.
This trend likely points to the financial strength of larger carriers and private fleets’ ongoing investment in growth. While order levels were above the historical average, they did align with seasonal trends. Overall, freight demand is healthy, so larger fleets are adding capacity to insource volume back from smaller for-hire fleets and owner-operators.
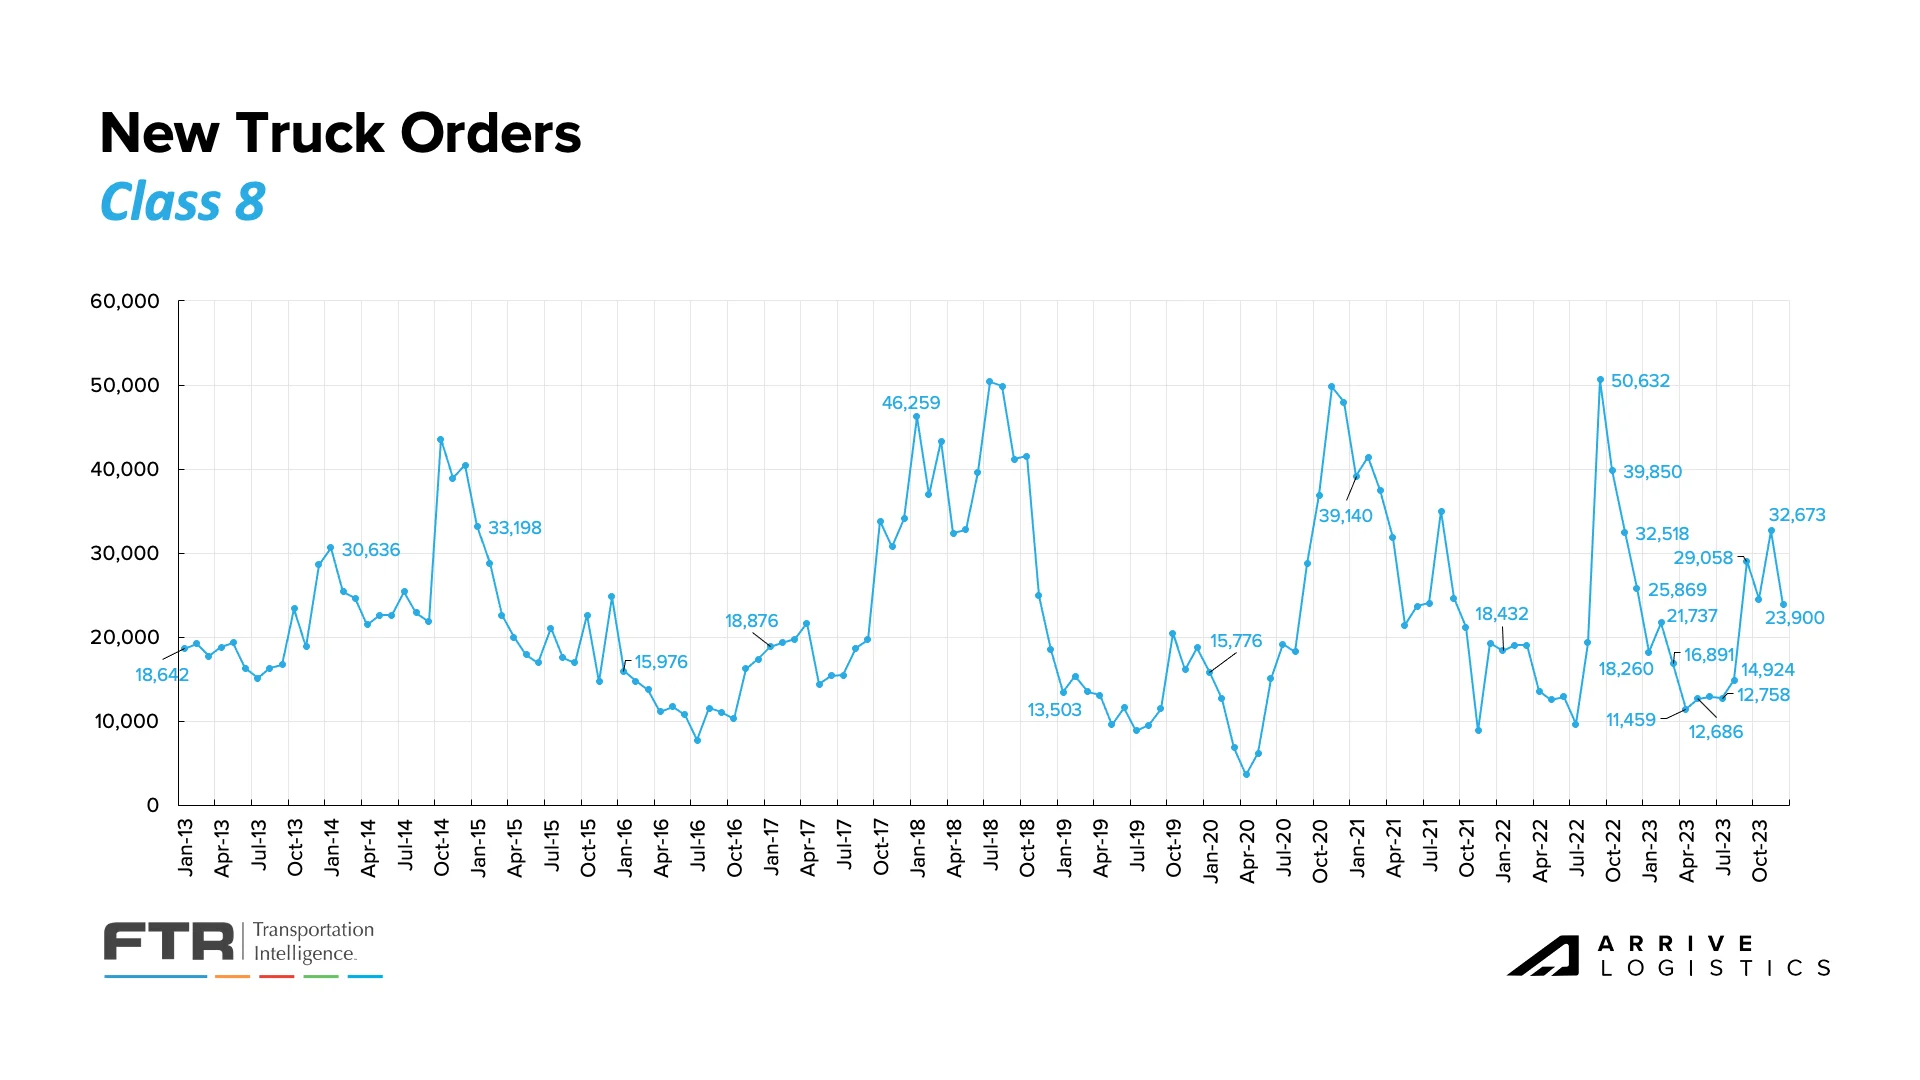 Figure 13: New Class 8 Truck Orders
Carrier margins also continue to shrink due to declining revenues and high operating expenses. ACT’s ‘core carrier’ set shows declining year-over-year margins for six consecutive quarters. Net margins did rise quarter-over-quarter in Q4 2023 but were still down 2.7% year-over-year. As rates become more volatile, the pressure on carriers should ease toward the back half of 2024 and into 2025.
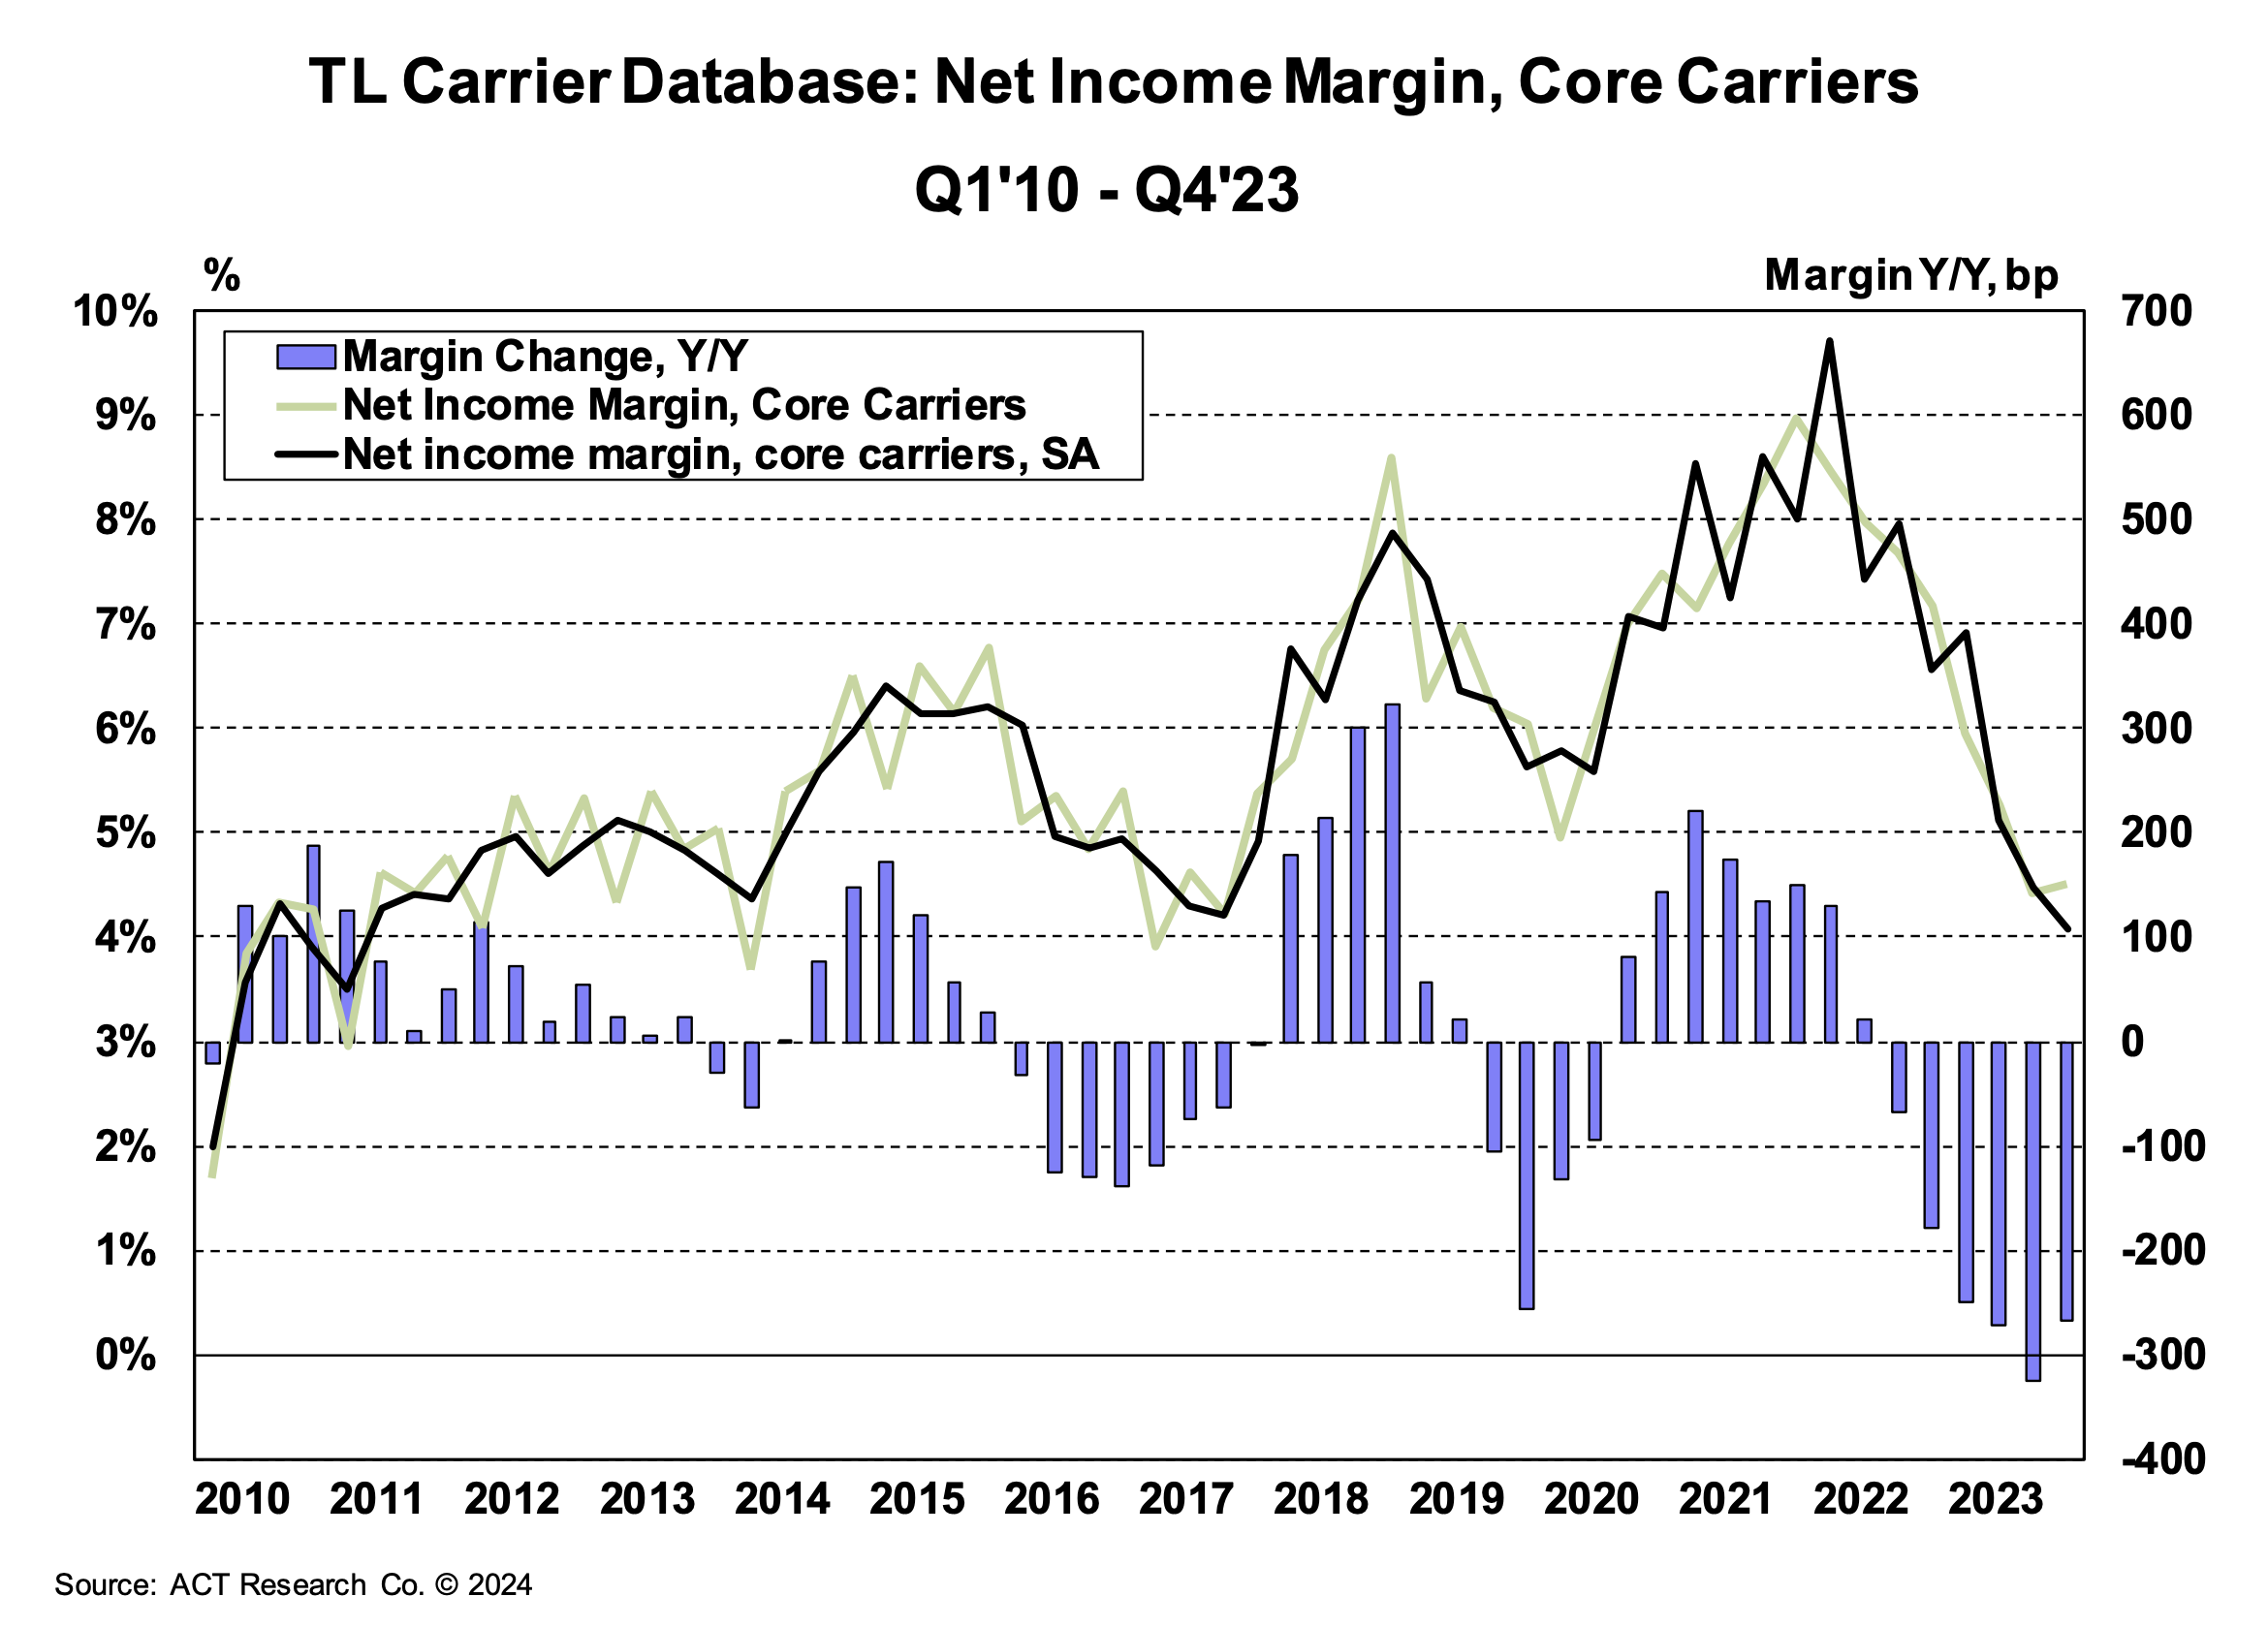 Figure 14: ACT Research, Net Income, Core Carriers
The estimated Class 8 backlog-to-build ratio rose to 5.7 months in January, up from 5.3 months in December. Despite the order increase, the backlog remains down nearly 40% year-over-year. However, the slight spike does indicate that the build rate could be less than the number of new orders.
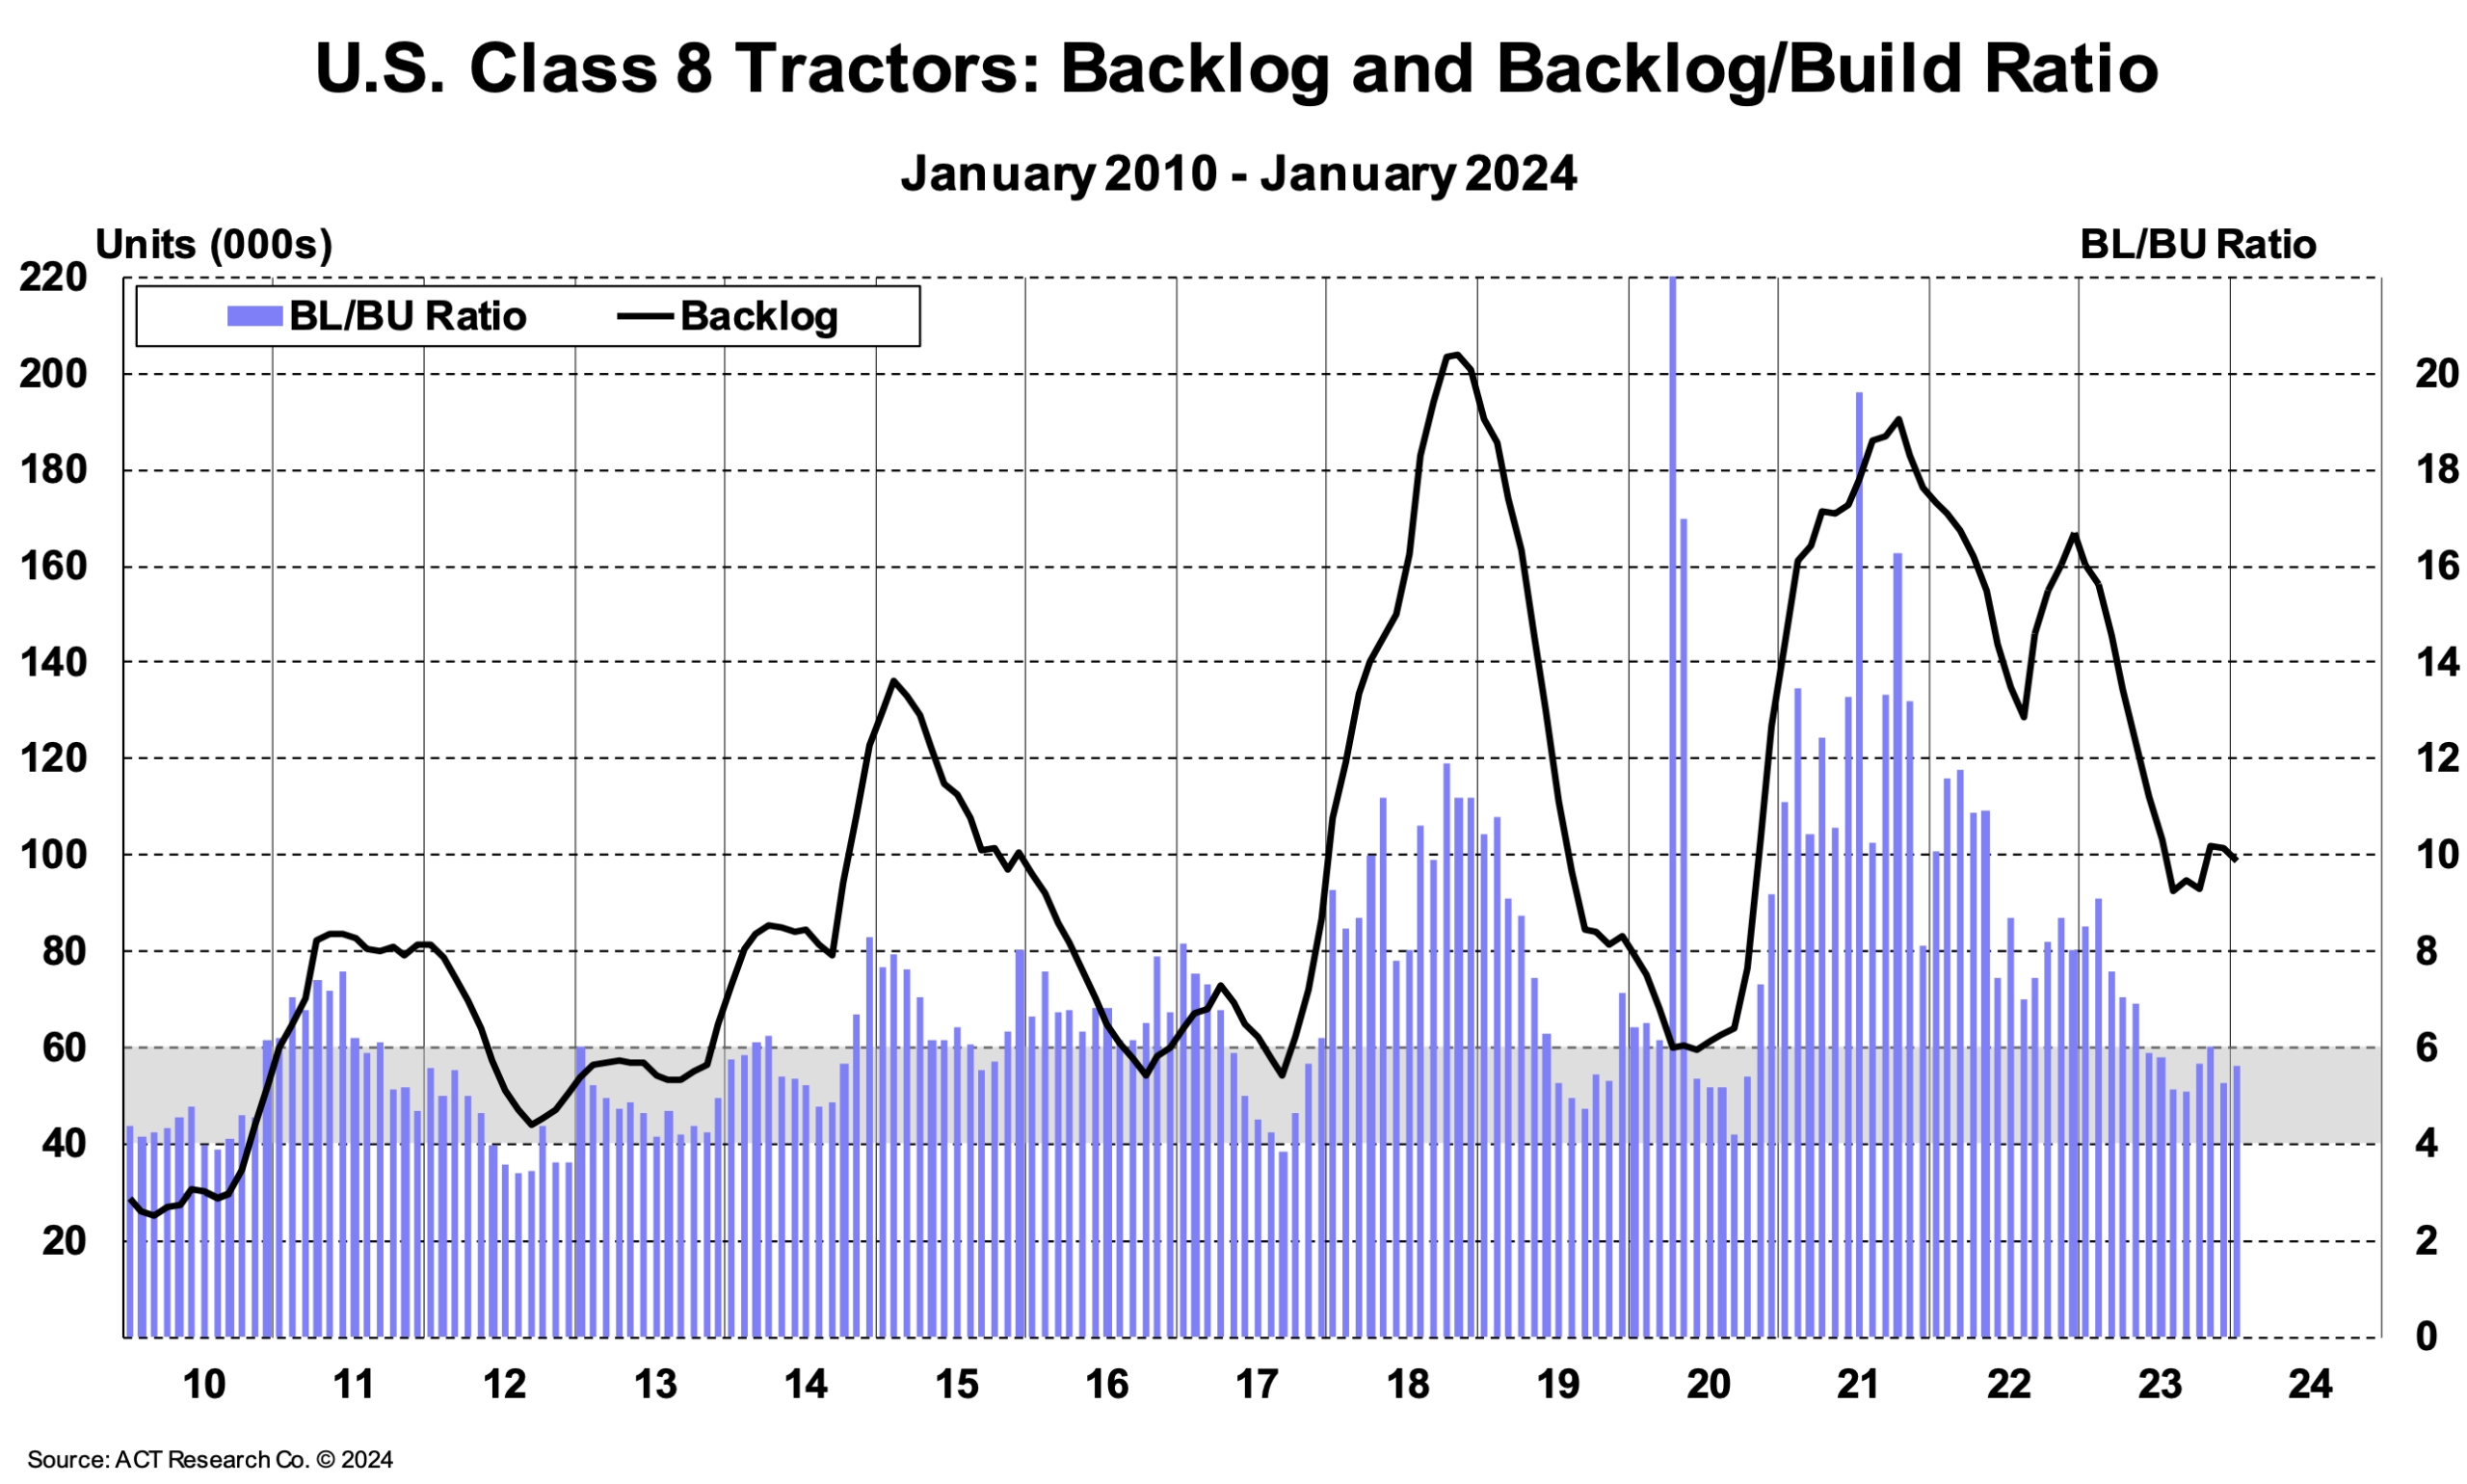 Figure 15: ACT Research, U.S. Class 8 Tractors: Backlog and Backlog/Build Ratio
The ACT Driver Availability Index declined significantly in December, dropping by 4.1 points month-over-month to 50.9. Driver availability reached an all-time high in September of 2023 but has since dropped 11 points in just three months, providing one of the stronger indications that the market is becoming more vulnerable to disruption as capacity and drivers continue to exit. In addition to tough market conditions, overarching challenges such as the driver retirement rate and FMCSA drug clearance remain prevalent.
After evaluating trends among the major drivers of freight tonnage (imports, inventory restocking and manufacturing), our base case is flat to slow demand growth in 2024. All three categories currently show a bottoming of related demand declines, indicating there is more upside than downside risk, and freight demand should remain relatively stable.
Despite the attacks on ships in the Red Sea, the National Retail Federation expects inbound cargo volume at the nation’s major container ports to increase year-over-year through the first half of 2023. The challenges caused by the attacks have been largely solved by adding extra vessels to increase capacity and shippers being patient with arrival times due to longer sailing routes. If import volumes remain in line with the current NRF forecast, January imports should show a 0.3% year-over-year increase. And if greater year-over-year increases occur as expected in the coming months, first-half totals could reach 5.3% above the same period in 2023.
![]()
Figure 17: NRF Monthly Imports
An influx of weather-related spot demand largely influenced January trends. Spot load postings were up nearly 50% from December and down 36.7% compared to January 2023. While the decline seems large, it is well below the 57% year-over-year decline in December. The spot demand increase was relatively short-lived, and we are already seeing a pullback in February.
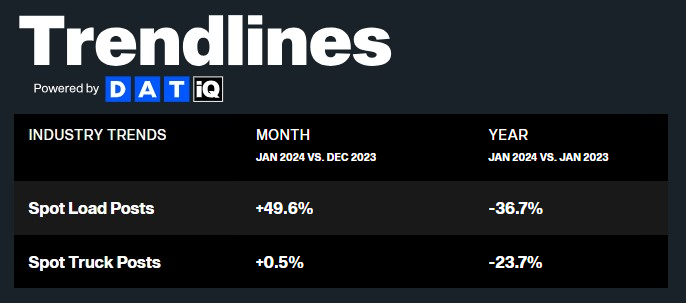
Figure 18: DAT Trendlines
Truckstop’s Weekly National Average Spot Rates index provides a detailed view of week-to-week rate movements and a real-time look into the current rate environment.
Reefer rates increased rapidly toward the end of 2023 and remained elevated for the first few weeks of 2024 before declining over the past three weeks. Van rates also increased during the same period but have dropped below $2.00 per mile for the first time since mid-December. Compared to rate movements observed during the summer peak and last year’s holiday season, these illustrate that the market is progressing toward equilibrium.
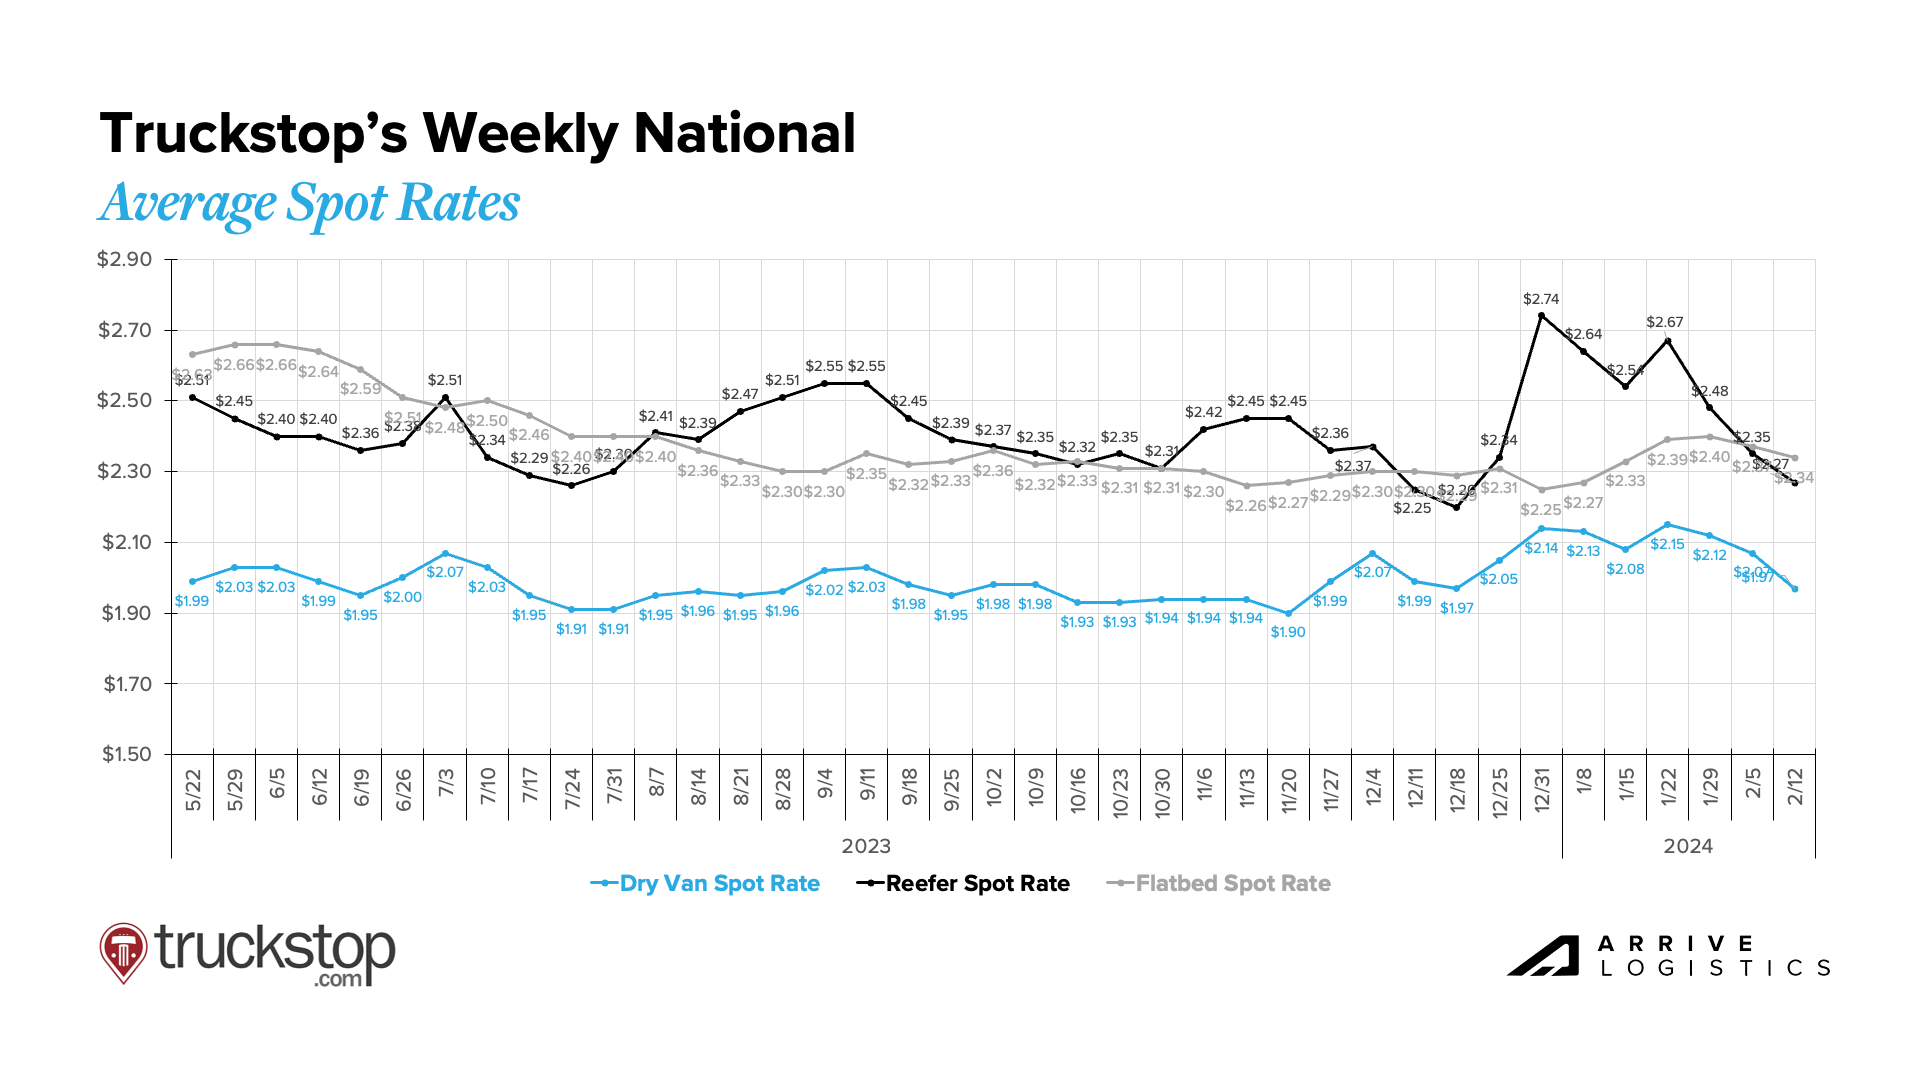
Figure 19: Truckstop Weekly National Spot Rate Average
National diesel prices were volatile in 2023 and declined quickly throughout Q4, falling nearly 13% to below $4.00 per gallon from September to December. In turn, per-mile fuel surcharges decreased significantly. The DAT van fuel surcharge dropped by $0.10 per mile from September to December, while reefer and flatbed surcharges declined by $0.11 per mile and $0.12 per mile, respectively, illustrating the variance between linehaul and all-in rate movement. Overall, fuel prices declined in January 2024 before increasing slightly through the first two weeks of February.
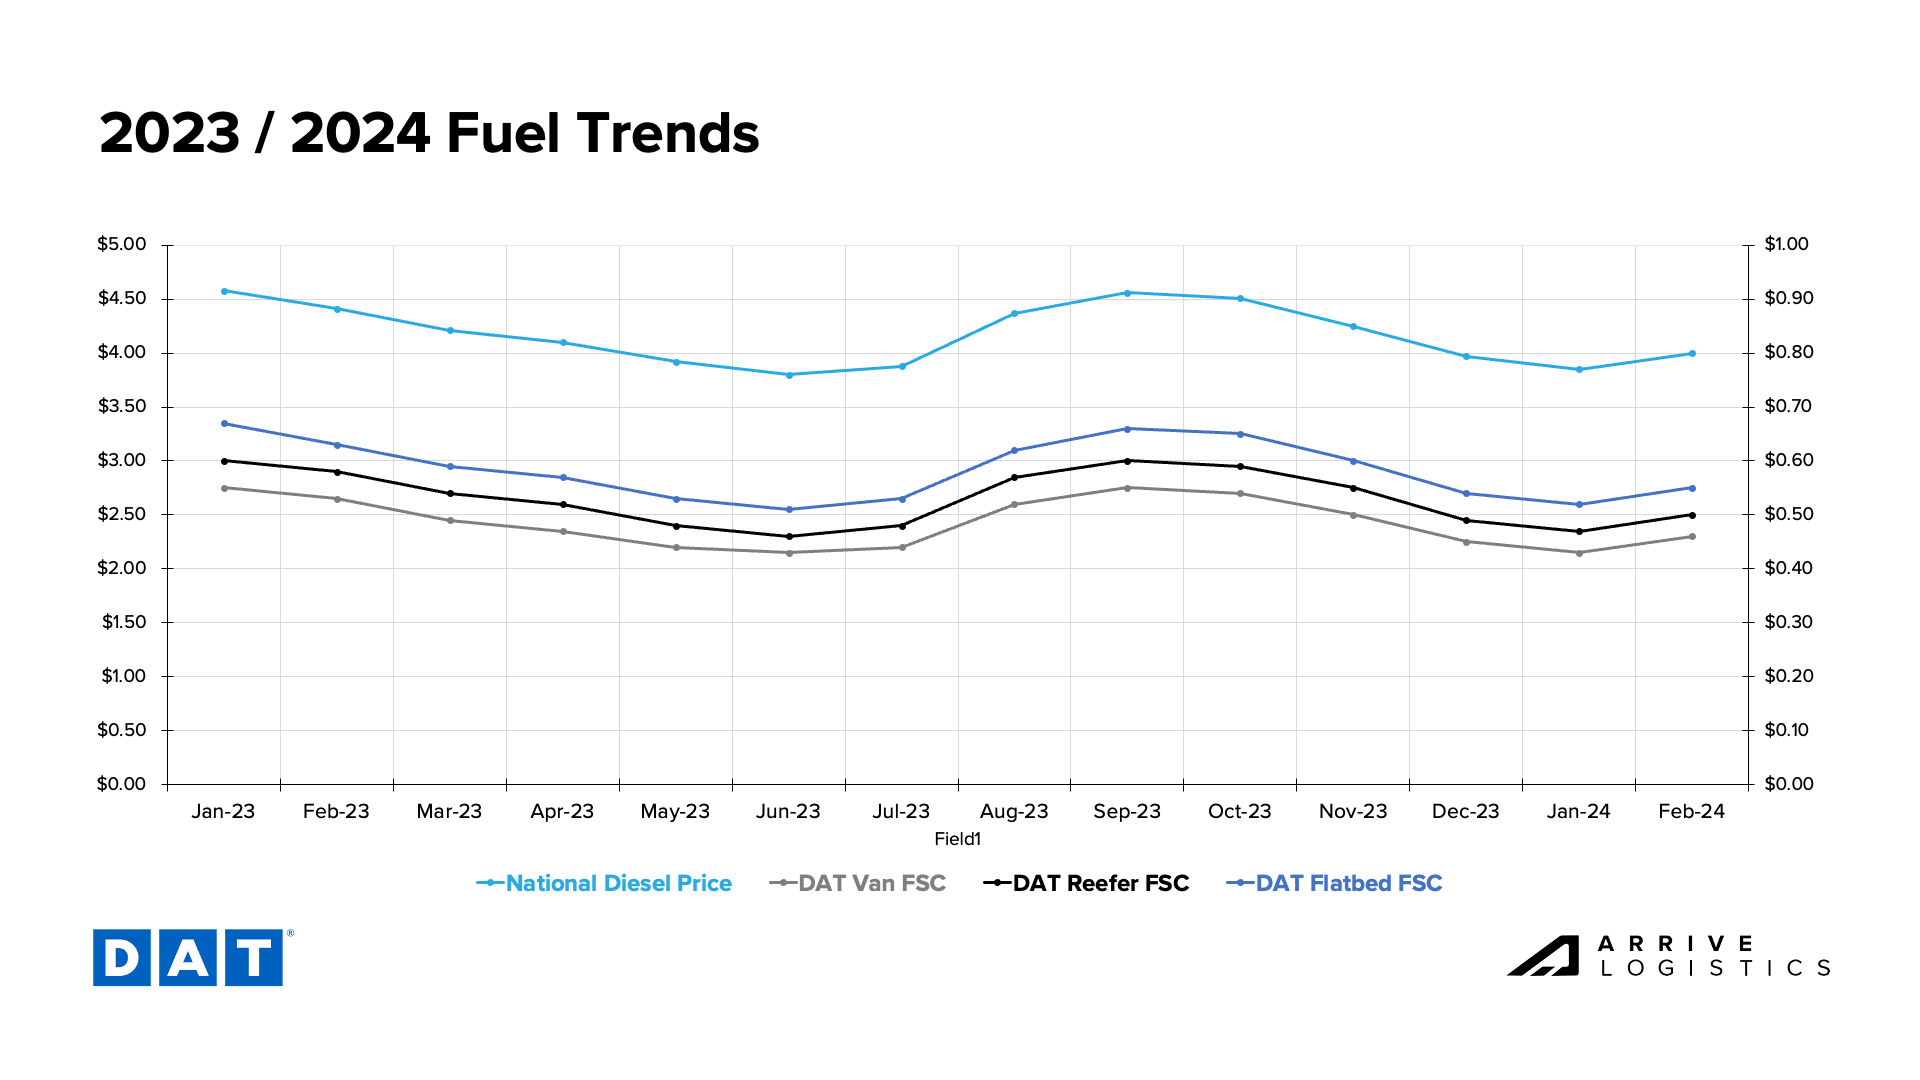 Figure 20: DAT Fuel Trends
Van spot rates continued to rise in January, ending the month $0.06 above December levels. However, February rates have declined by $0.06, and linehaul rates are $1.65 per mile. On the other hand, contract rates continued to flatten, increasing by just $0.01 per mile in January and holding steady at $2.05 per mile in February. The spot-contract rate gap remains elevated at $0.40/mile.
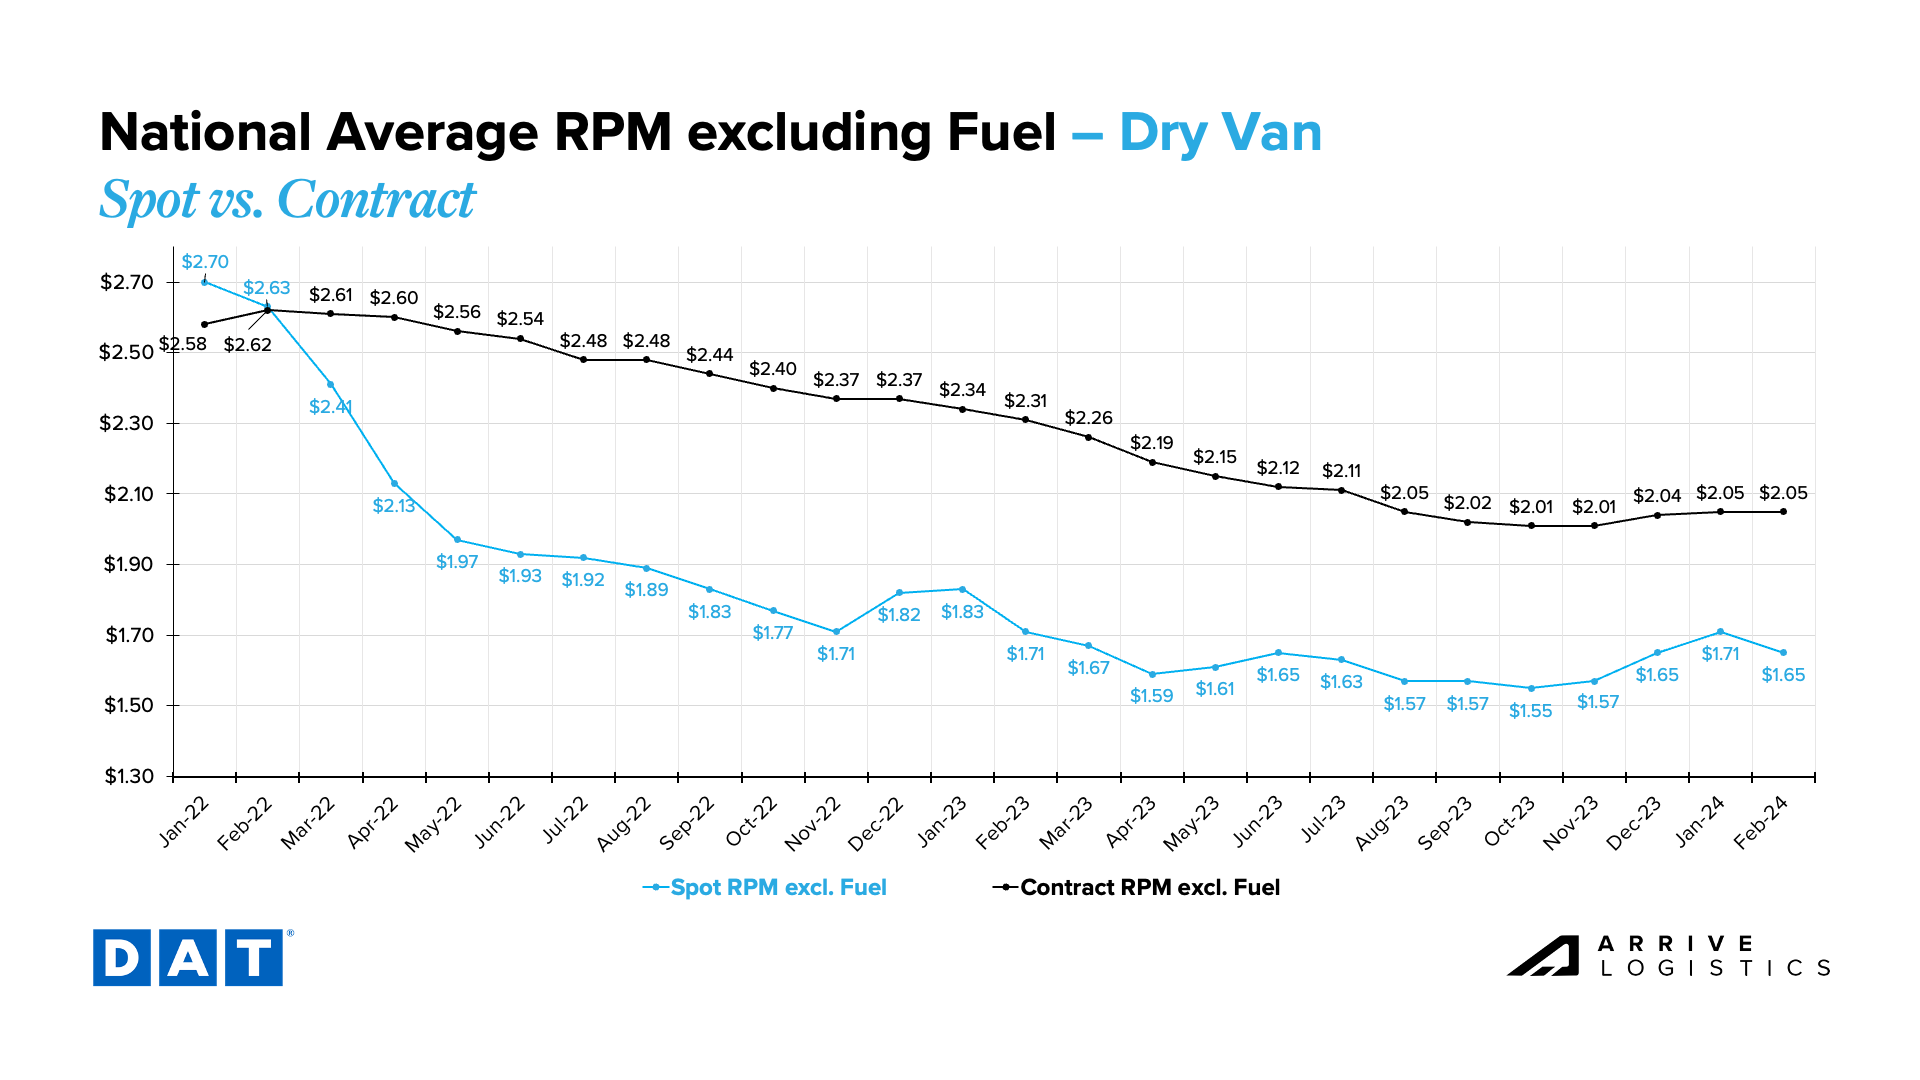 Figure 21: DAT Dry Van National Average RPM Spot vs. Contract
Reefer rates continue to follow a similar directional trend as dry van but at a more magnified level. Reefer linehaul spot rates jumped by $0.12 per mile in January, the largest single-month increase in over a year. They have declined as quickly as dry van in February, dropping by $0.12 per mile and returning to the December average of $1.98 per mile. Contract linehaul rates remain relatively flat, increasing by just $0.02 per mile in January to $2.41 per mile.
The January spot and contract rate spread was $0.31 per mile, the smallest since the downcycle began. It widened again in February and currently sits at around $0.41 per mile.
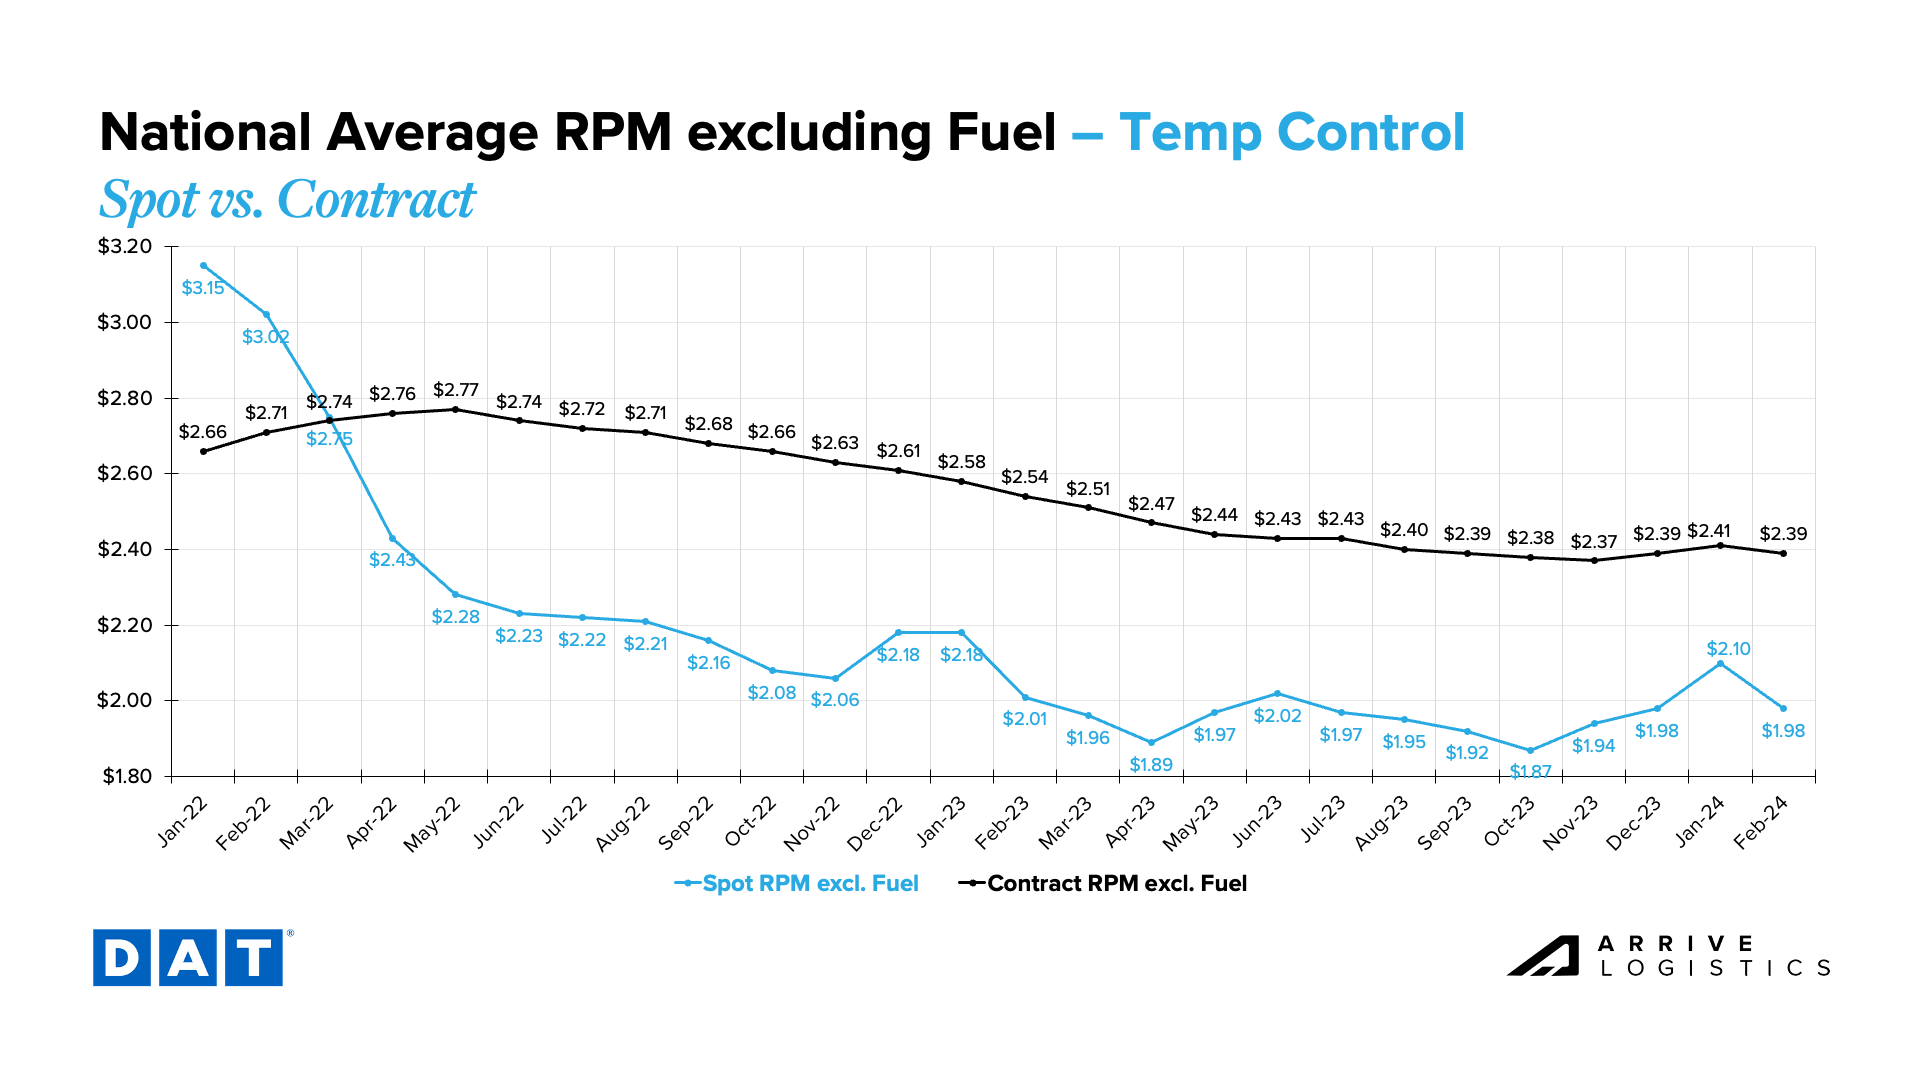
Figure 22: DAT Temp Control National Average RPM Spot vs. Contract
Flatbed linehaul spot rates followed a similar trend as van and reefer equipment in January, increasing by $0.07 per mile. However, unlike van and reefer equipment, linehaul spot rates in February have remained flat, sitting at $1.95 per mile. Flatbed contract rates in January were flat month-over-month at $2.58 per mile and are $2.60 per mile as of mid-February.
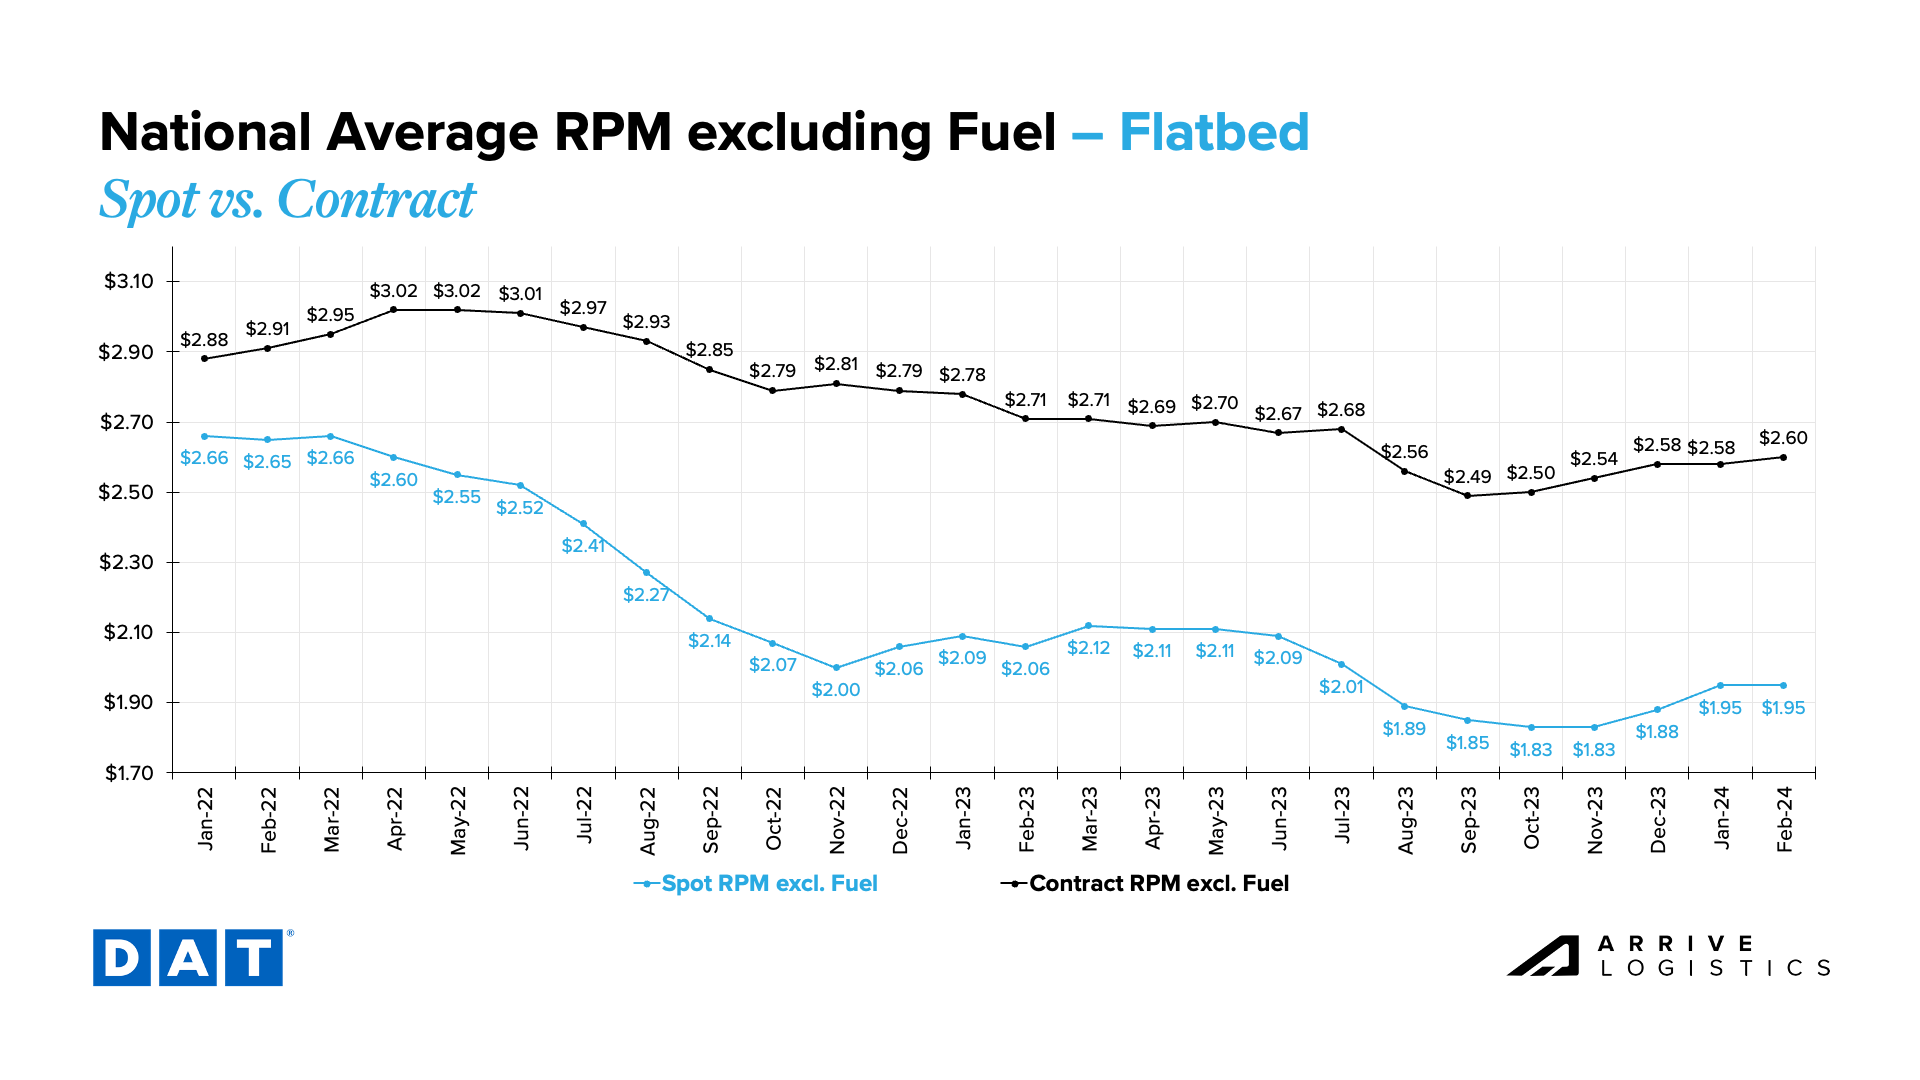
Figure 23: DAT Flatbed National Average RPM Spot vs. Contract
Optimistic economic reports and indicators like labor market stability support our view that consumer spending should remain strong enough to support healthy truckload volumes in 2024.
January CPI data came in at 3.1%, a slight inflation decline from 3.4% in December but hotter than the 2.9% expectation. Though we still believe the FED will cut interest rates at some point this year, this data, in combination with other strong economic indicators, leads many experts to believe that cuts may not begin at the next meeting. We still expect to see two to three rate cuts this year; large interest rate reductions would likely trigger increased housing activity and increase overall freight demand.
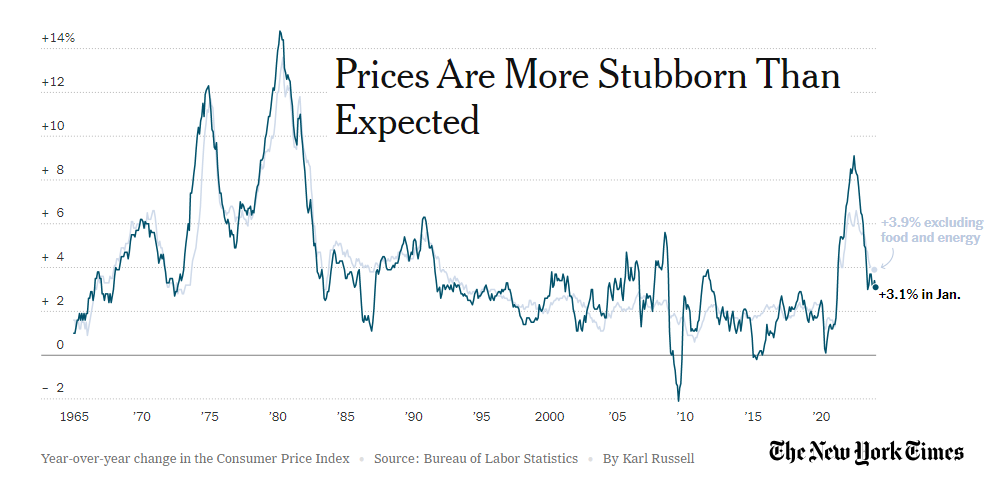
Figure 24: New York Times Inflation Data
January Bank of America card data showed consumer spending fell by 0.3% month-over-month and 0.2% year-over-year. However, they noted this downward trend is likely just a short blip caused by winter storms that disrupted retail spending, especially in the South, and because seasonal adjustments made in January 2024 were unfavorable based on December and prior year reports. They added that when sifting out the noise, consumer spending remains solid, saying, “In our view, with real income growth picking up due to a strong labor market and continued disinflation, the risks to consumer spending are increasing to the upside.”
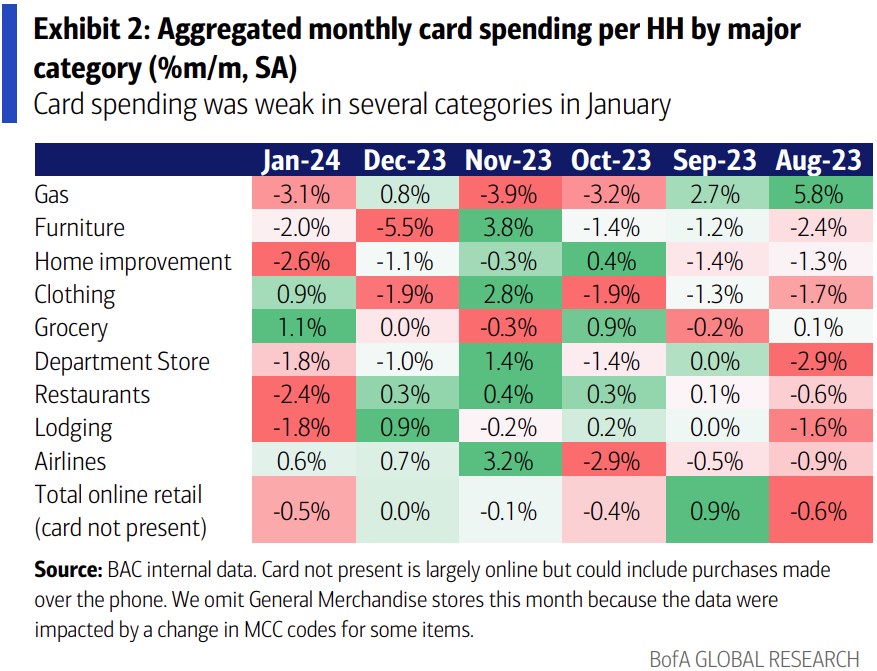
Figure 25: Bank of America Card Spending


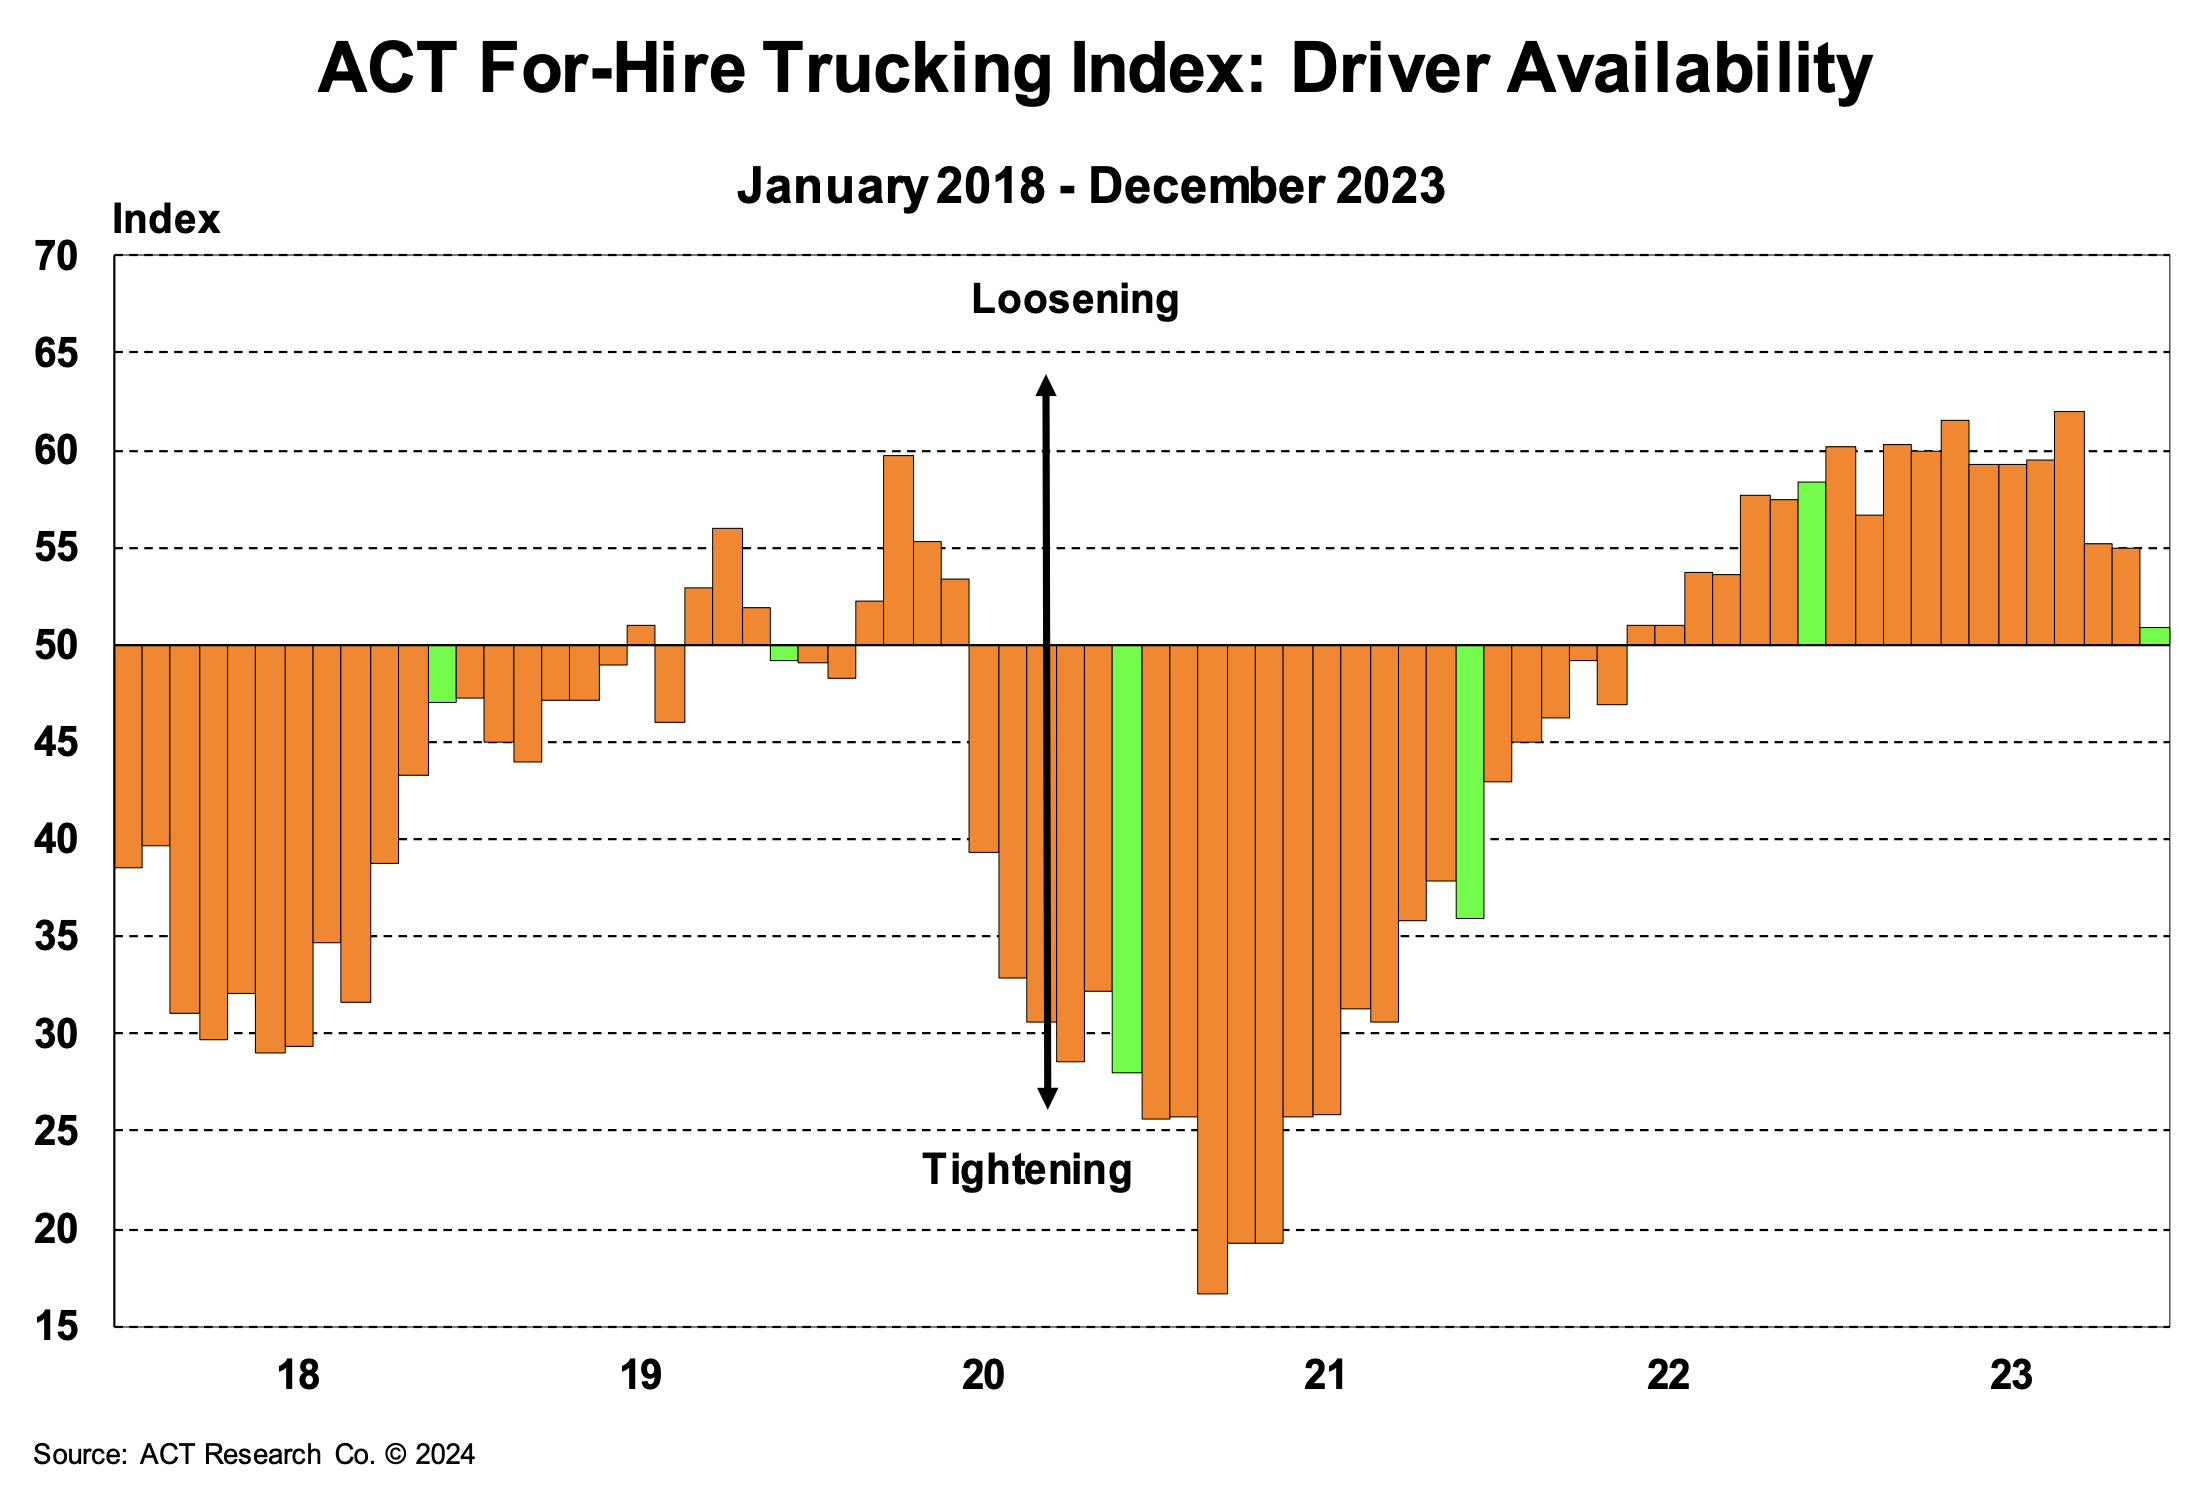 Figure 16: