Need Help
close button

How can we help?

Select One:

Carrier Market Outlook – February 2025

Author: rwalter@arrivelogistics.com
Shape

February Theme: Post-Holiday Slowdowns

Carrier Market Outlook - February 2025

Arrive Insights™

Arrive Logistics VP of Market Intelligence David Spencer Headshot
David Spencer
VP of Market Intelligence
Aryan Shah
Senior Research Analyst

The freight market has stabilized following a volatile end to 2024, as lower demand and sufficient capacity led to typical seasonal slowdowns in early February. While spot market activity increased in January, truckload volumes remain below early 2024 levels, reinforcing that market recovery is still in progress.

Supply remains tighter than at previous points in the cycle but not tight enough to trigger a sustained inflationary shift. Dry van and reefer rates spiked in line with typical seasonal patterns throughout the holiday season but have fallen recently, reflecting normal slowdowns in the latter part of Q1.

Economic indicators suggest a stable demand outlook for 2025, supported by consumer resilience and a strong labor market. However, uncertainty around tariffs and corporate tax policies presents both upside and downside risks for freight demand.

Key Takeaways:

  • For-hire truckload volumes are down year-over-year, and capacity remains sufficient to mitigate any disruption risk.

  • Spot postings increased by 27% month-over-month in January but were flat year-over-year, signaling improved market balance.

  • Dry van and reefer rejection rates have declined, indicating the market is following seasonal trends.

  • The potential impact of U.S. tariffs remains unknown, but January trends indicate they could drive increased volatility.

  • Inflation ticked up to 3.0%, and core inflation remains high, creating uncertainty around whether future interest rate cuts will benefit freight demand.

Preventing Fraud

Protect your business from fraud with our latest guide.

Market Indicators

Q1 lull.

Trucking Capacity

More tightening.

Demand Outlook

Imports going strong.

Market By Mode

Flatbed heating up.

Rates

The storm has passed.

Economic Outlook

Strong services spending.

Market Indicators

What’s Happening: Capacity is tightening.

Why It Matters: Tight supply makes the market more vulnerable to disruption.

The Morgan Stanley Dry Van Freight Index is another measure of relative supply; the higher the index, the tighter the market conditions. The black line with triangle markers on the chart below provides a great view of what directional trends would be in line with normal seasonality based on historical data dating back to 2007.

Trends deviated from the 10-year average toward the end of 2024 and remained above 2024 levels and the 10-year average in early February 2025. However, the movement so far in 2025 has followed historical seasonal patterns very closely. If these trends continue, we expect further seasonal softening over the next few months.

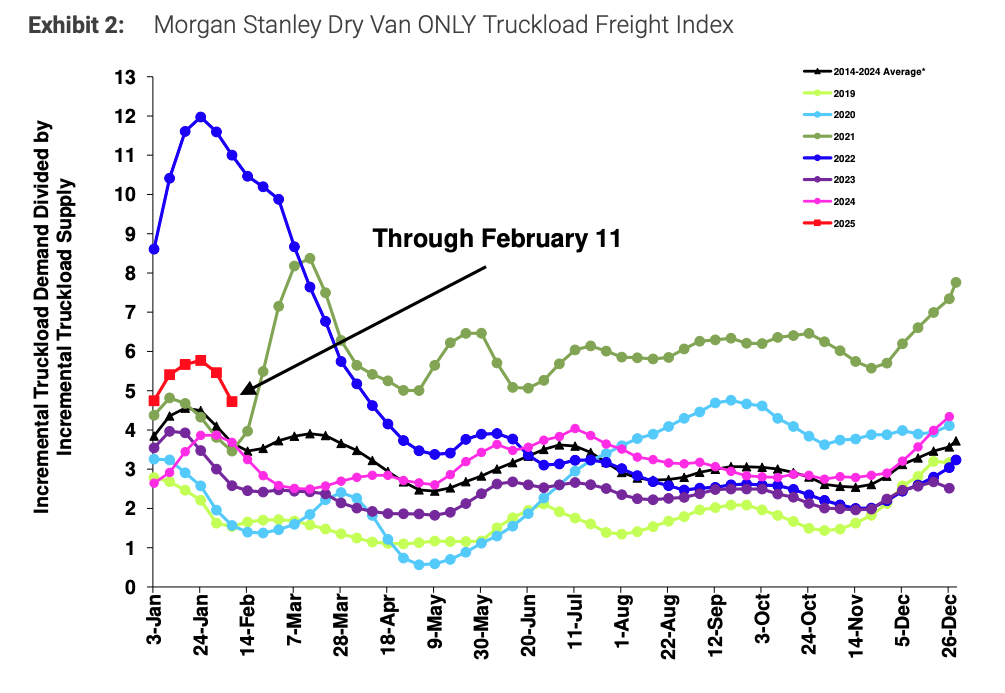
Morgan Stanley Dry Van Truckload Freight Index

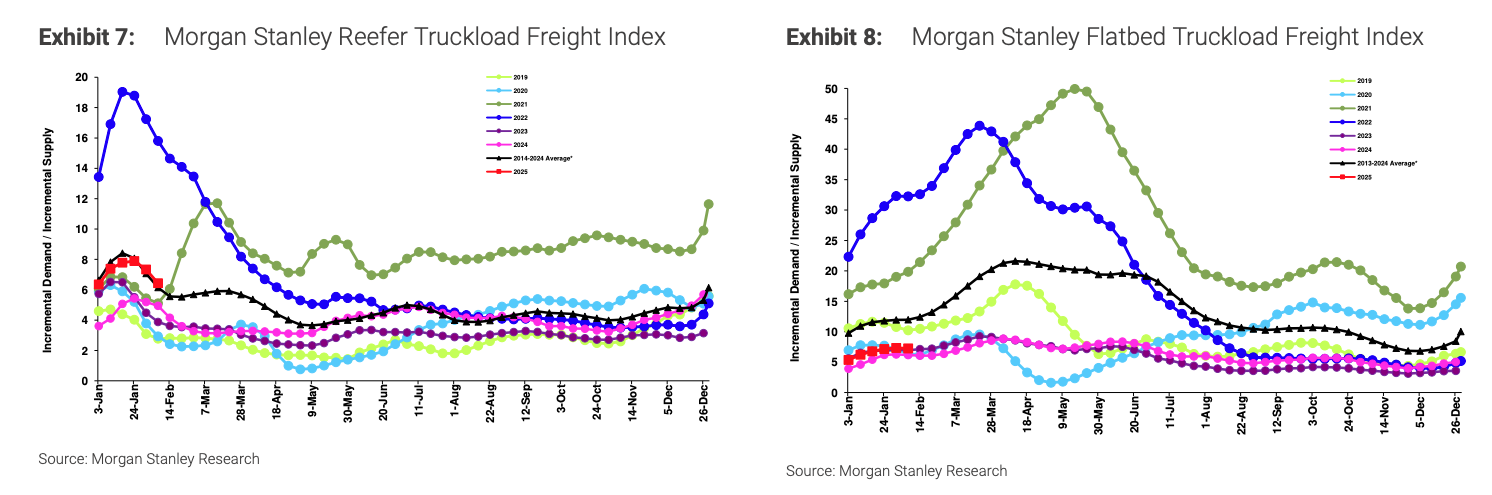
Morgan Stanley Reefer and Flatbed Truckload Freight Indices

The latest ACT For-Hire Trucking Supply-Demand Balance Index indicates that market conditions tightened from October to November, driven by rising freight volumes and shrinking capacity. ACT also highlighted that the expansion of private fleets continues to play a key role in sustaining the prolonged equilibrium cycle.

Meanwhile, Class 8 tractor sales have slowed further, reinforcing expectations that the market will continue rebalancing in the coming months. If the U.S. economy expands as projected, freight volumes should rise, leading to tighter market conditions in 2025 compared to 2024.

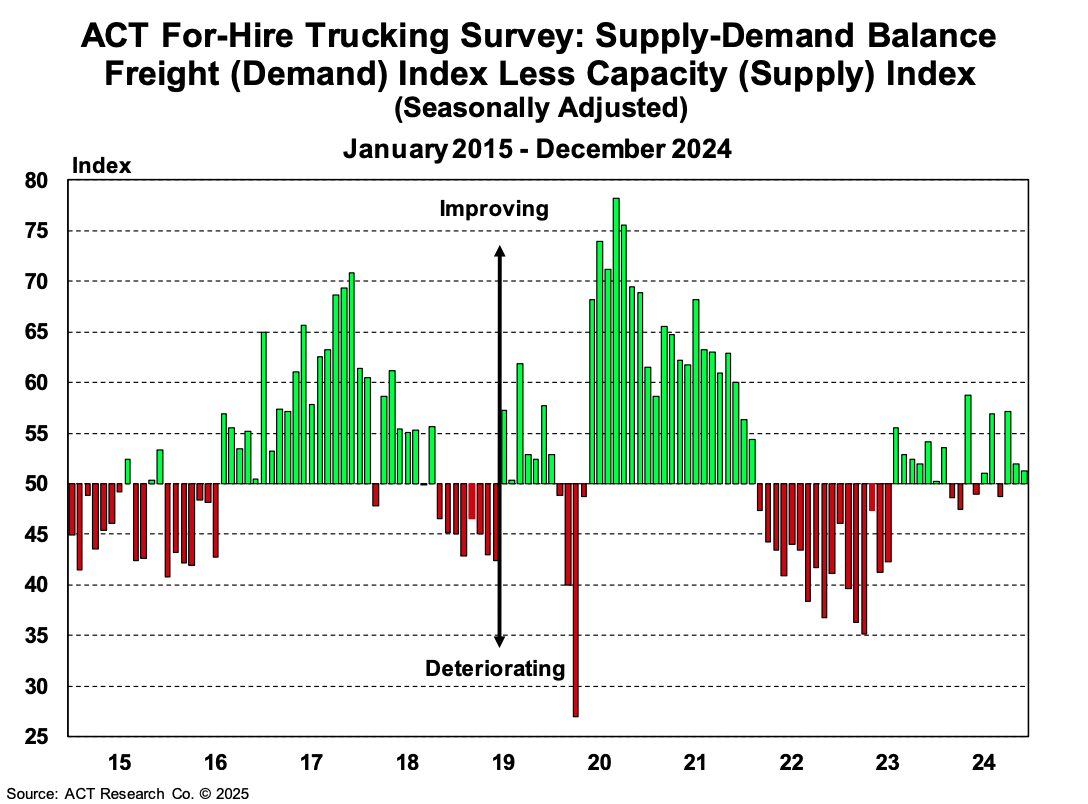
ACT For-Hire Trucking Survey

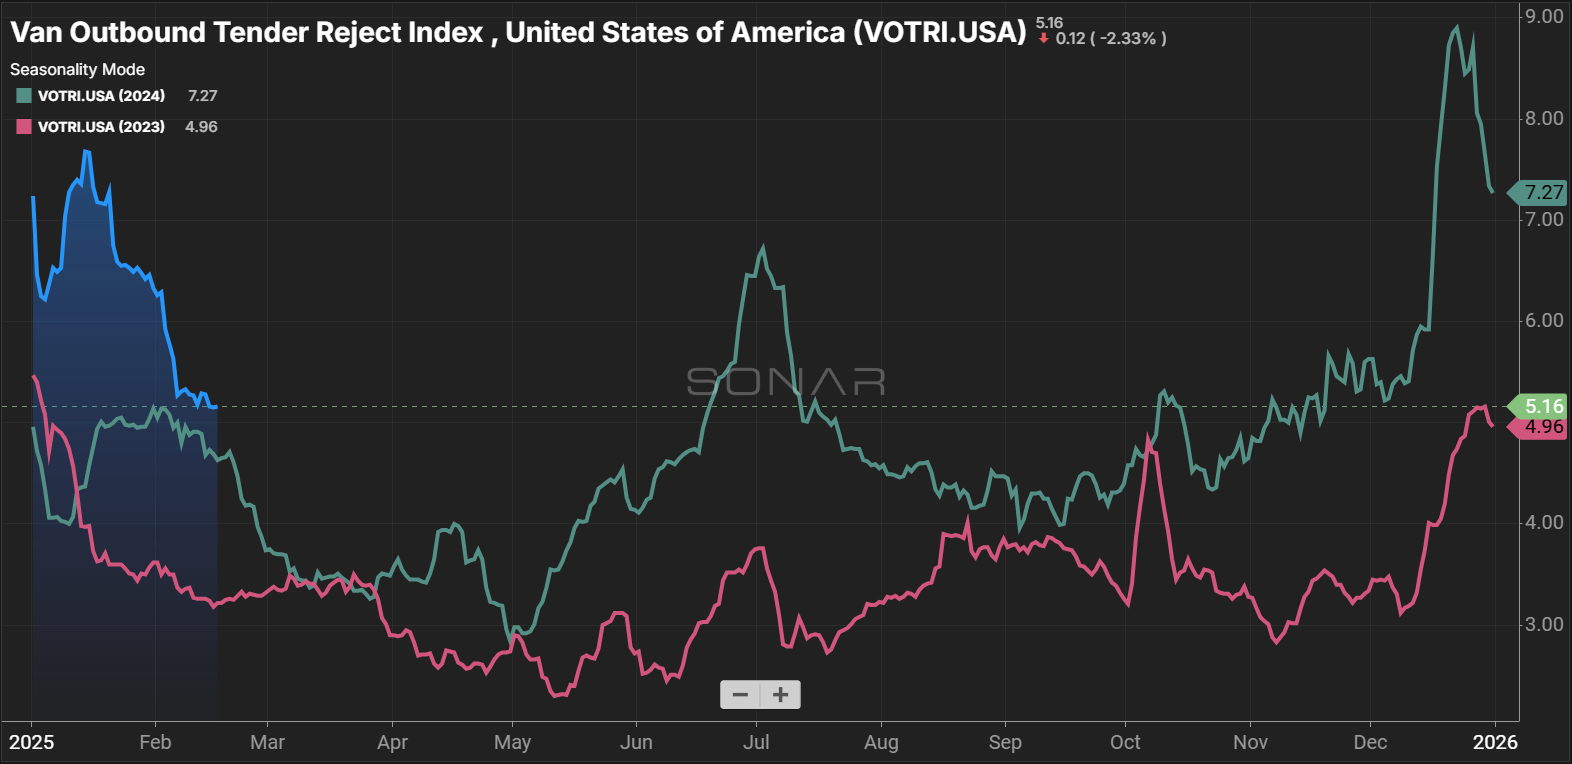
After several volatile weeks, recent data indicates rapid market normalization as demand and capacity ease. We expect Q1 conditions to remain steady aside from the disruptions typical for this time of year, such as winter storms.

The Sonar Outbound Tender Reject Index (OTRI), which measures the rate at which carriers reject the freight they are contractually required to take, has declined significantly from the weather-induced peaks of mid-January. Rates are hovering in the upper 5% range—while slightly higher than the same period last year. This reading indicates strong routing guide compliance.

We expect rejection rates to fall further in March and April in line with seasonal expectations ahead of the 100 Days of Summer. However, the increased volatility during the 2024 peak season is a sign that the market is more vulnerable to disruption than at any point in the current cycle, even as demand declines.

Outbound Tender Reject Index (SONAR)

Dry van tender rejection rates have declined significantly and now align closely with February 2024 levels. As the market continues to follow typical seasonality, we expect rates to remain near the floor through the rest of Q1 and into early Q2.

The reefer market remains far more volatile than the dry van market. At 13%, tender rejection rates are up 75% year-over-year. Winter weather remains a risk, but if market conditions persist as temperatures rise, the 2025 produce and summer peak seasons could be significantly more active than in recent years.

Van & Reefer Outbound Tender Reject Indices

The DAT Load-to-Truck Ratio (L/T), which compares the total number of loads to the total number of trucks posted on the DAT spot board, increased for dry van and reefer freight in January. The dry van L/T ratio climbed above 7.0, the highest point in the last two years. Similarly, the reefer L/T ratio surpassed 11, exceeding any point in 2023 and 2024. DAT’s load and truck posting metrics suggest this increase is driven almost entirely by a pullback in equipment postings, indicating carriers were much less reliant on posting equipment to find freight.

DAT Van Load-to-Truck Ratio

DAT Reefer Load-to-Truck Ratio

Trucking Capacity

What’s Happening: Carriers continue to exit the market.

Why It Matters: This makes the market more vulnerable to disruption.

Challenging trucking conditions for carriers have resulted in high numbers of exits over the past few years. Year-over-year increases in load-to-truck ratios and tender rejection rates around the holidays make clear that these exits are creating more balanced market conditions.

While carrier population change trends do not tell the full story, they provide some insight into where supply levels are headed. Since the first carrier population decline during this cycle in October 2022, there has been a net loss of nearly 38,000 carriers, including 2,700 net revocations in the past two months—the highest number since January and February 2024 (nearly 4,400 net revocations). As the carrier pool continues to shrink, spot capacity will tighten, and market vulnerability will increase.

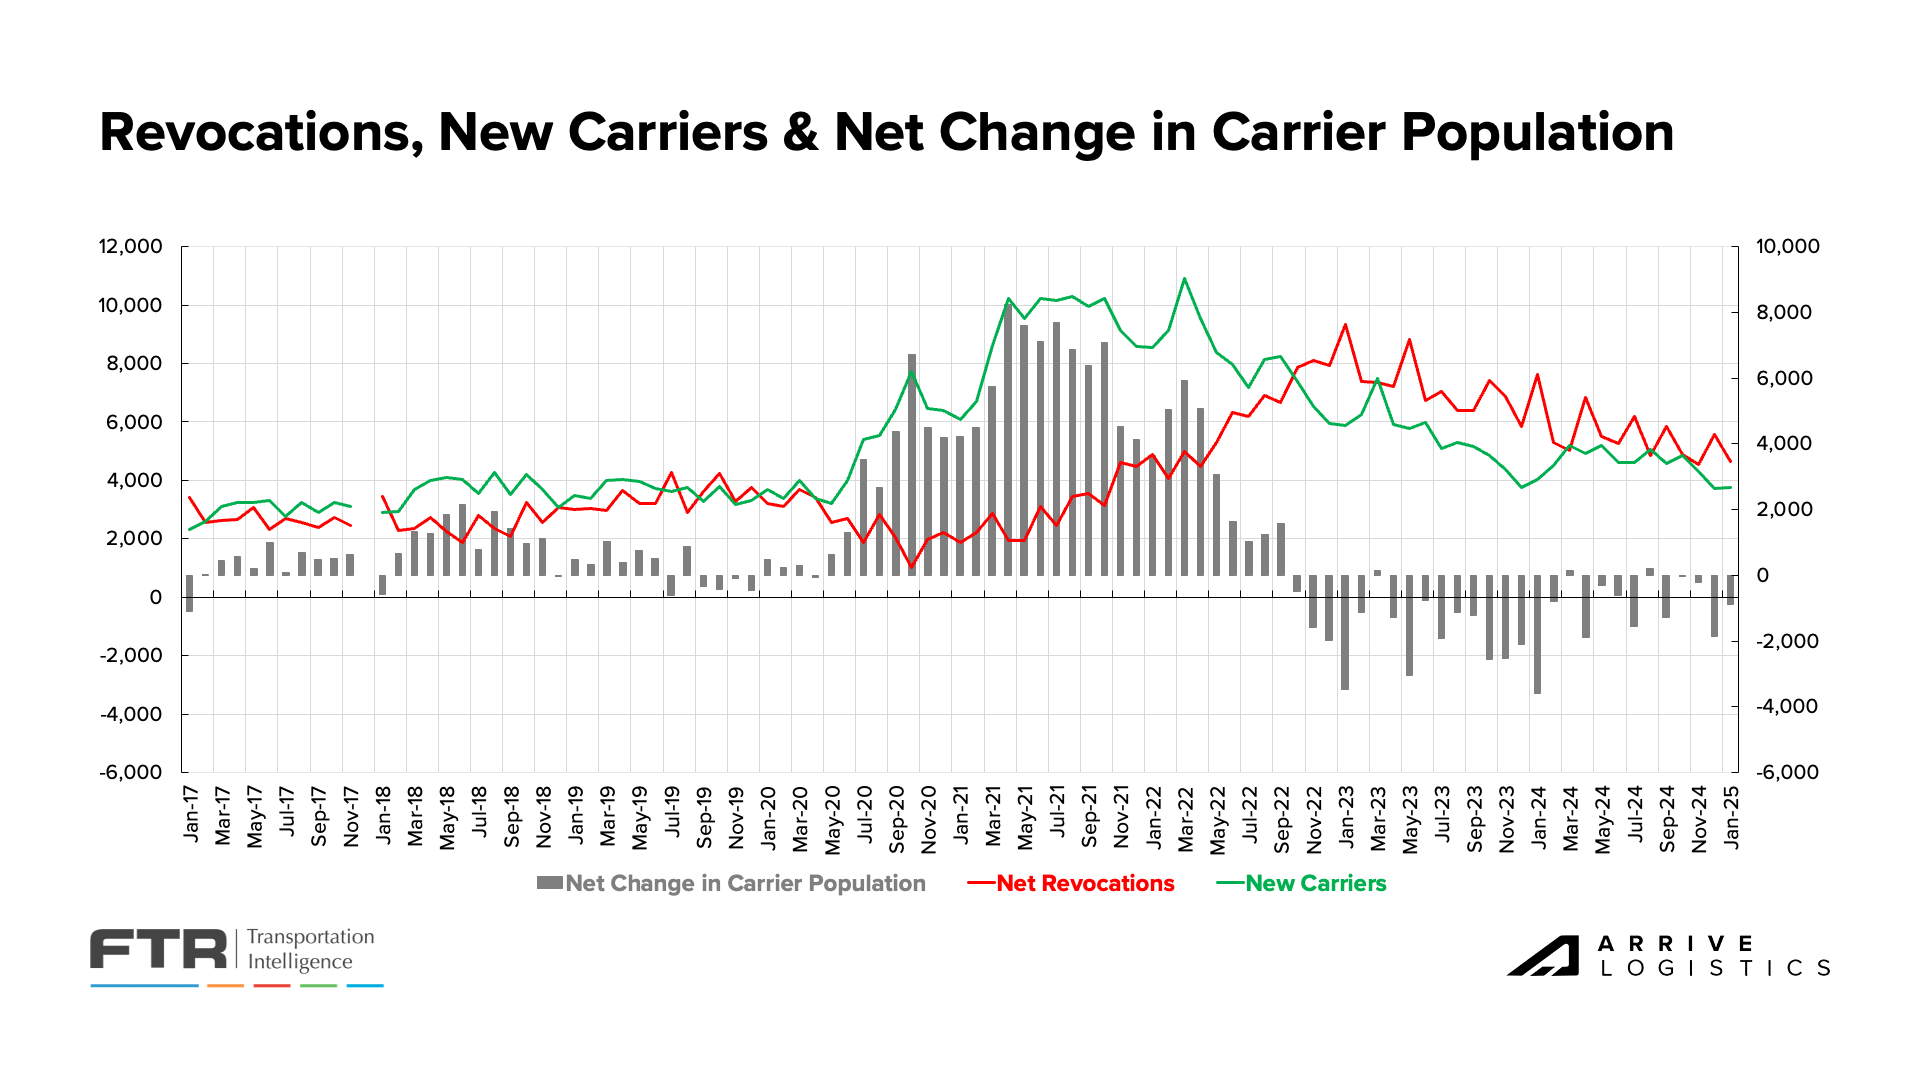
FTR’s Carrier Revocations, New Carriers & Net Change in Carrier Population

According to the latest ACT Research data on U.S. Class 8 tractors, the backlog-to-build (BL/BU) ratio rose from 6.5 months in November to 7.0 months in December. The backlog increased by more than 12,000 units, reaching 87,000 in December. ACT Research attributes this growth primarily to lower build rates as manufacturers continue prioritizing vocational production over tractor production. Lagging build rates indicate that significant increases in the capacity market remain unlikely – another sign that inflationary conditions will take shape more gradually.

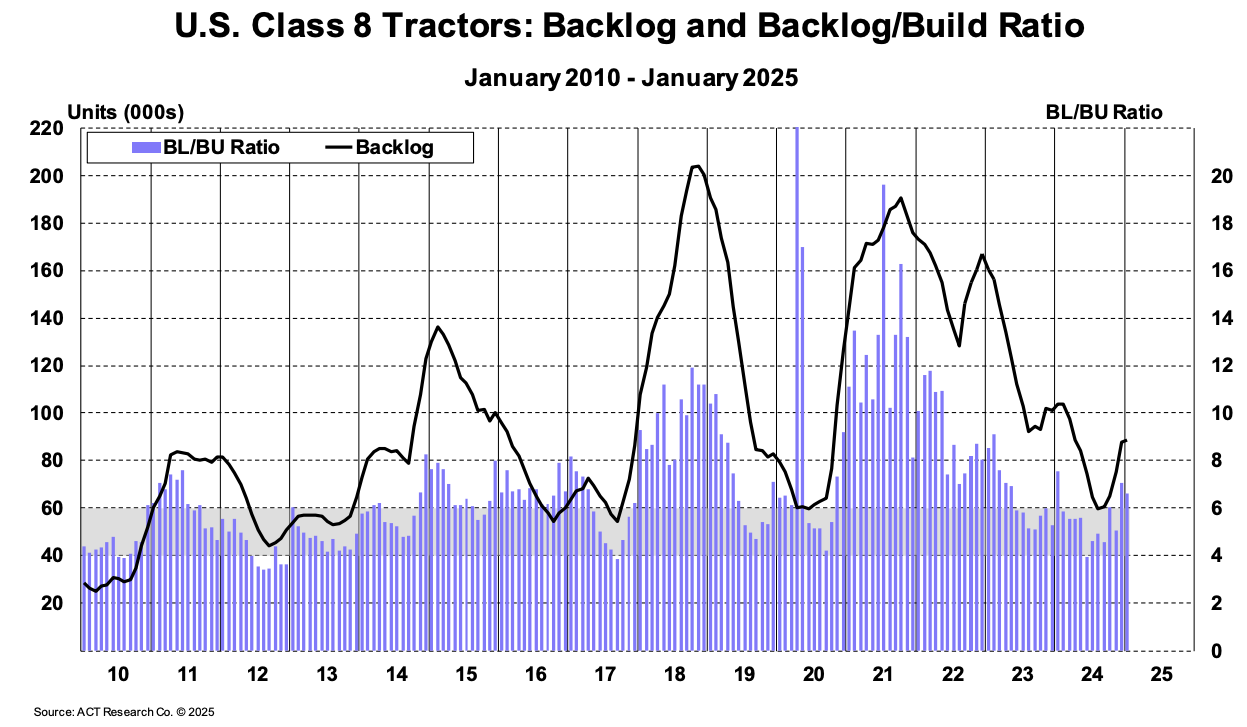
ACT Research, U.S. Class 8 Tractors: Backlog and Backlog/Build Ratio

The driver market continues to support demand, as evidenced by the ACT Driver Availability Index rising 3.5 points to 56.3 in December, marking 31 consecutive months of stable or improving driver availability. Several factors contribute to sustained availability, including a 4%-5% market share shift to private fleets over the past two years and experienced owner-operators leaving the market to join larger carriers.

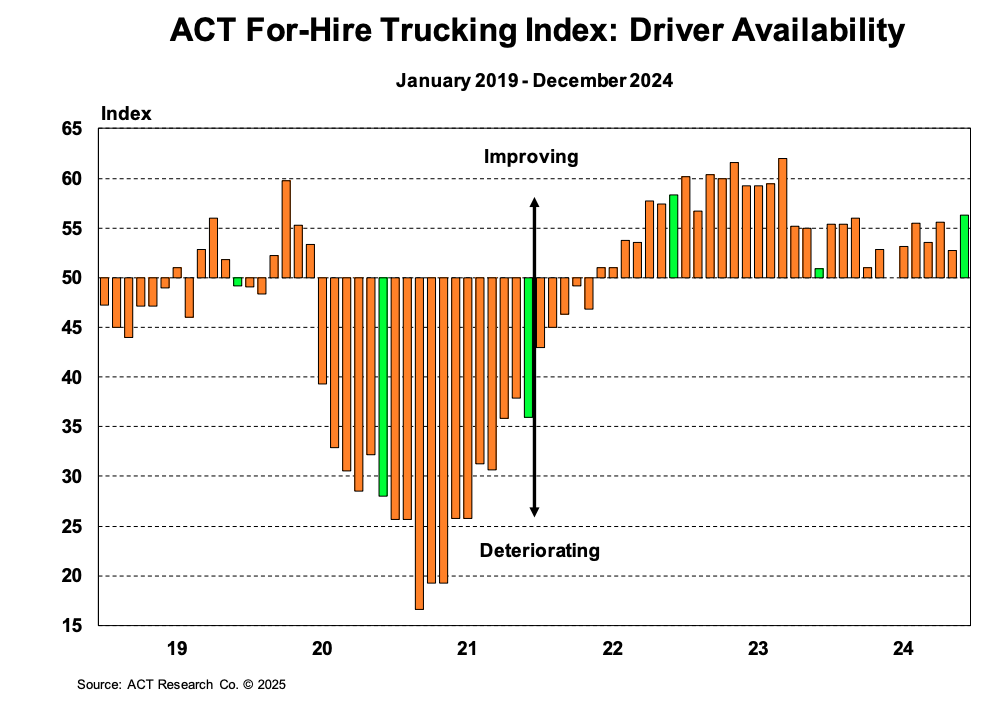
ACT For-Hire Trucking Index: Driver Availability

The January trucking jobs report revealed that 2024 started with 20,000 fewer jobs than previously reported and ended with 27,800 fewer jobs. This significant downward revision brings total trucking employment back to pre-pandemic levels, erasing gains from that high-rate era. This data doesn’t fully capture owner-operator capacity or private fleet capacity growth, so we do not believe overall supply has fallen to 2020 levels. However, the decline is significant and supports the narrative that capacity is, in fact, exiting the market.

On a positive note, though employment is down from its peak, there has been industry job growth in recent months. January saw a 3,800 job increase from December and 7,400 compared to October, likely driven by short-term disruptions like port strike threats, tariffs and peak retail season.

Monthly Change in Trucking Jobs, FRED Economic Data

Demand Outlook

What’s Happening: Imports have maintained momentum in the new year.

Why It Matters: Elevated imports create increased demand in the freight market.

Demand was steady through the holiday season and should remain consistent in the near term. However, there is uncertainty surrounding how proposed U.S. tariffs and corporate tax cuts would impact the 2025 truckload demand environment.

The National Retail Federation (NRF) reports that imports consistently increased month-over-month in 2024. 2.14 million TEUs were imported in December, a slight decrease from November but nearly a 15% increase from December 2023. Import strength is likely due to shippers pulling freight forward to avoid the impact of the potential strike at East and Gulf Coast ports.

Imports for the first six months of 2025 are expected to remain steady. However, if additional tariffs are placed on North American, Asian and European goods, import volumes could be negatively affected.

NRF Monthly Imports

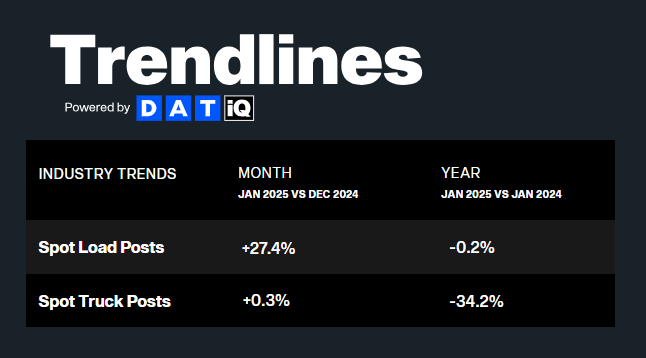
DAT reports that spot postings remained relatively flat year-over-year but increased over 27% from December to January, helping to offset contract volume declines. The year-over-year results showed significant improvement from January 2024, when spot postings were down nearly 40% from January 2023.

Truck postings tell a different story. They were relatively unchanged month-over-month but down significantly year-over-year, indicating that capacity reductions were the main driver of greater rate volatility during the 2024 holiday peak season. 

DAT Trendlines

Market by Mode

Cross-Border Canada

What’s Happening: The Canadian freight market experienced volatility in Q4 2024 due to tightening capacity and strong holiday demand.

Why It Matters: Market conditions are expected to stabilize in early 2025, but uncertainty about tariffs may create additional volatility.

  • Capacity tightened in Q4 as drivers took holiday time off, leading to higher rates.
  • The U.S. announced 25% tariffs on Canadian exports, but a last-minute agreement delayed implementation until March 1, creating uncertainty for the cross-border freight market.
  • Inbound and outbound rejection rates spiked in December as shippers pulled freight forward ahead of tariffs; rates declined quickly once the delay was announced.
  • Fuel prices surged in January amid increased demand and tariff concerns but are expected to stabilize unless new tariffs take effect.
  • The Bank of Canada lowered interest rates to 3%, reinforcing economic stability, though tariffs could pose downside risks to GDP and inflation.

Cross-Border Mexico

What’s Happening: Cross-border trade is at record levels, driven by nearshoring, proposed U.S. tariffs and seasonal produce demand.

Why It Matters: Capacity constraints and transportation costs may remain elevated beyond Q1 2025.

  • The U.S. enacted and then paused a 25% tariff on all Mexican imports.
  • Mexico surpassed China and Canada as the top U.S. trade partner in November 2024.
  • The Super Bowl contributed to higher demand for Mexican produce, leading to increased rates and tighter capacity.
  • Trucking rates remain elevated despite easing inflation.
  • Shippers are working to lock in contract rates before the end of Q1 to secure capacity and manage volatility.

Temp Controlled

What’s Happening: Regional capacity remains tight in key markets, with severe weather and seasonal demand influencing conditions.

Why It Matters: Market conditions are expected to remain uneven through Q1, with weather disruptions and shifting produce seasons playing a key role.

East Coast

  • Capacity is tighter than usual, primarily due to weather-related disruptions and port activity.
  • Seafood shipments in the Northeast remain steady, but inbound Midwest and West Coast rates continue to lag.
  • Florida did not see capacity tighten as expected ahead of Valentine’s Day.

Midwest

  • Outside of weather-related disruptions, capacity remains relatively easy to secure.
  • Reefer demand is steady due to protect-from-freeze shipments.

South

  • South Texas remains the tightest market in the country, driven by high produce volumes moving through McAllen and Laredo.
  • Berry season and Mexican produce imports are in full swing, contributing to strong reefer demand.
  • Capacity remains generally available in other southern markets, with no significant seasonal surges.

West

  • California markets remain extremely soft, with no major demand shifts expected until May.
  • Arizona is starting to tighten. Demand is expected to remain elevated until April or May, when California’s produce season begins.
  • Outbound Los Angeles freight may cause localized capacity constraints near the Arizona border.

Pacific Northwest (PNW)

  • Capacity will be soft until produce season picks up this summer.
  • Weather remains the primary risk factor, with occasional storms leading to temporary disruptions.

Open Deck

What’s Happening: Flatbed demand is rising, while capacity constraints and weather disruptions are tightening the market.

Why It Matters: Spot rates may increase as carriers prioritize key customers and avoid winter weather regions.

  • Flatbed tender rejections are expected to increase in the next six weeks as demand for building materials and machinery grows.
  • Asset-based carriers are focusing on core customers, reducing available capacity and driving spot rate increases.
  • Severe winter weather in colder regions (CO, ND, WY, SD) is limiting capacity, as carriers avoid delays to keep drivers moving.
  • Outbound Canada flatbed capacity remains constrained, mirroring trends seen in the dry van market.
  • Northbound freight from Mexico is unusually slow, with tariffs and trade uncertainty limiting capacity in Texas and other affected areas.

Rates

What’s Happening: Dry van and reefer rates have declined rapidly following holiday season increases.

Why It Matters: The market is following normal seasonality and we expect a quiet second half of Q1.

Truckstop’s weekly spot market rate data shows sharp seasonal declines for van and reefer in early February. Rates for both modes reached their 2024 peak amid a year-end demand surge. However, around mid-January, rates rapidly returned to pre-holiday averages. This pattern is normal and closely resembles the trend observed around the same time last year.

Truckstop Weekly National Spot Rate Average

Fuel prices fell for most of 2024 but rose in January and remained high in February. The February average is $3.66 per gallon, with a $0.40 dry van surcharge. Despite recent increases, prices are still lower than last year’s $4.04 per gallon average and $0.47 surcharge. Prices are expected to remain steady, but U.S. tariffs could create volatility.

DAT Fuel Trends

DAT dry van data shows linehaul spot rates increased during the 2024 holiday season. They remained elevated into the new year, with the $1.76 per mile average in January being the highest monthly average since January 2023. Contract rates also rose to $2.05 per mile, matching the previous high in January of last year. Rates have since normalized. The spot average is currently $1.68 per mile, excluding fuel, and further declines are likely through the end of the month.

After closing to a cycle low in January, cooling spot rates caused the spot-contract rate gap to expand again in February. This shift supports our view that a sustained inflationary flip is not imminent.

DAT Dry Van National Average RPM Spot vs. Contract

Reefer spot rates, excluding fuel, increased month-over-month from October 2024 to January 2025. They peaked at $2.11 per mile in January, the highest mark since January 2023, before declining rapidly in early February. Rates are currently $1.95 per mile, excluding fuel, mirroring a similar downward trajectory as a year ago. Barring a major disruption, we anticipate rates will follow trends similar to 2024 for the next few months, remaining near a floor until May. Contract rates remain stable despite recent spot rate volatility.

DAT Temp Control National Average RPM Spot vs. Contract

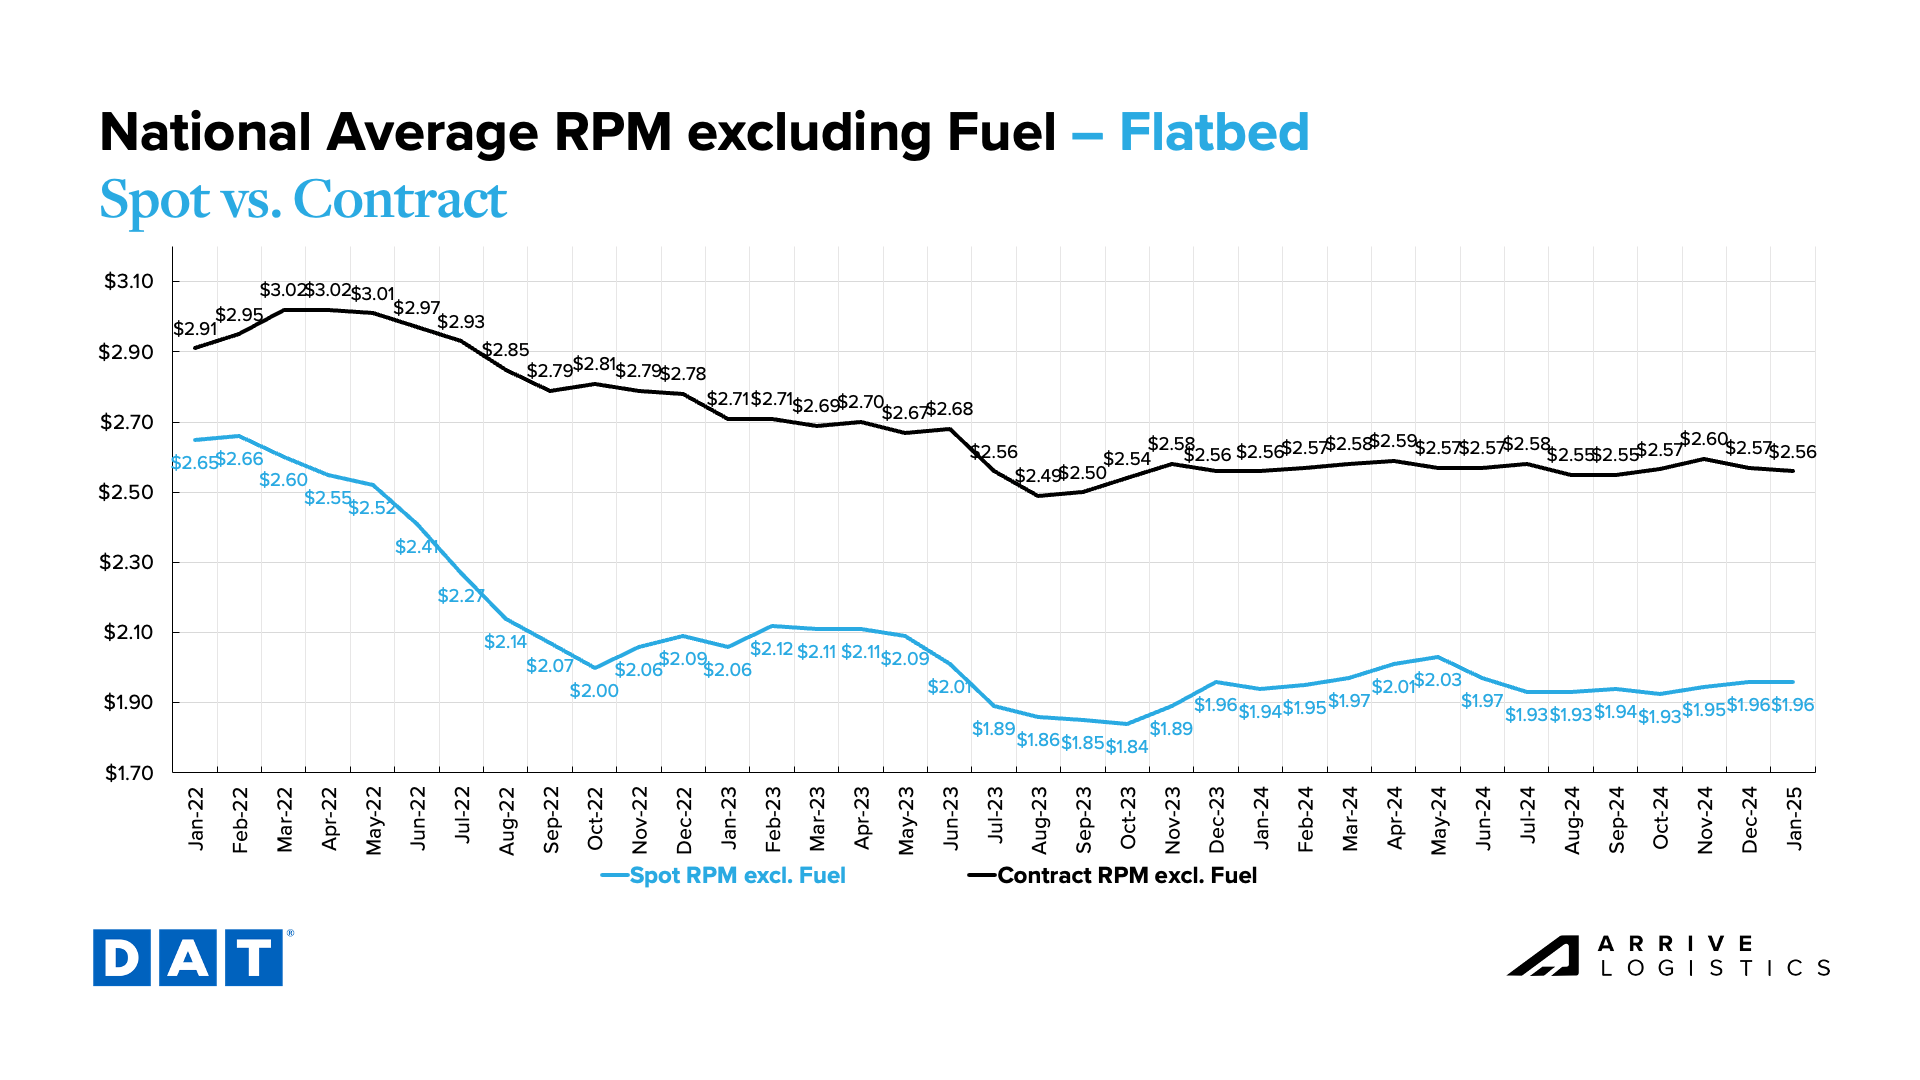
The flatbed market remains significantly more stable than van and reefer, with spot and contract linehaul rates sitting at $1.96 per mile and $2.56 per mile, respectively. The significant $0.60 per mile rate spread suggests the market is unlikely to experience any disruption in the near future. However, that could change as the building season drives increased activity in the spring. 

Economic Outlook

What’s Happening: Inflation ticked up slightly in January.

Why It Matters: Higher inflation is a sign that consumers might still see elevated prices.

Inflation ticked up to 3.0% in January due to increased food and energy prices. Core inflation, excluding food and energy, remained at 3.5%. While this raises speculation about potential interest rate cuts in 2025, the robust labor market and stubborn core inflation suggest that the Fed may keep interest rates higher for an extended period, presenting a downside risk to freight demand.

New York Times Inflation Data

Bank of America credit card data reveals that household spending rose 1.9% year-over-year in January, following a 2.2% increase in December. Seasonally adjusted spending dipped 0.4% month-over-month, but the three-month annualized rate (SAAR) climbed 2.8%. Because services spending outpaced goods, the freight market is unlikely to benefit much.

Bank of America, Total Card Spending per Household

Conclusion

The freight market has stabilized after a volatile start to the year, with tender rejections and spot market activity both declining. Despite a more balanced market and some year-over-year spot rate inflation, seasonal rate patterns will likely be the main narrative in 2025.

Freight volumes remain flat to down as capacity continues to contract, indicating that supply constraints rather than demand declines are driving market fluctuations. While future demand is uncertain, continued capacity exits in a low spot rate environment could leave the market open to disruption later in the year, especially if demand stabilizes or grows.

Although the spot-contract rate gap has narrowed year-over-year, it remains wide enough to prevent significant market disruption. Thus, an inflationary market shift is unlikely, barring any unforeseen and disruptive events.

About the Carrier Market Update

The Arrive Carrier Market Outlook, created by Arrive Insights™, is a report that analyzes data from multiple sources, including but not limited to FreightWaves SONAR, DAT, FTR Transportation Intelligence, Morgan Stanley Research, Bank of America Internal Data, ACT Research, Journal of Commerce, Stephens Research, National Retail Federation and FRED Economic Data from the past month as well as year-over-year. We know market data is vital in making real-time business decisions. At Arrive Logistics, we are committed to giving you the data and insights you need to better manage your freight.

Download Carrier Market Outlook – February 2025

Scott Sandager,
Chief Administrative Officer 

Scott Sandager is the Chief Administrative Officer at Arrive Logistics. He joined Arrive in 2018, bringing over 14 years of logistics and brokerage experience, with expertise in project and change management, organizational design, talent development and customer satisfaction. Scott previously held many diverse roles of increasing responsibility with AFN, a Chicago-based freight brokerage.

Subscribe to receive freight market updates​​

"*" indicates required fields


Subscribe to receive freight market updates

Quick Apply

"*" indicates required fields

Max. file size: 50 MB.

Arrive Carrier Requirements

Please have the following info ready to complete registration

  • MC, MX, DOT, or state reg #
  • Tax ID & W9 info
  • Cert of Insurance: $100k cargo, $1M Auto, & $1M commercial general liability coverage
  • Active Common or Contract Authority (365+ days)
  • Safety Rating of at least Satisfactory (or None)

Fraud Prevention

Freight fraud continues to impact our industry. We encourage shippers and carriers to reach out to Arrive immediately if there is ever a shipment in question that may be subject to fraud. Arrive will not ask you to pay upfront for any dedicated lane or committed capacity program. If the offer you are receiving sounds too good to be true or unrealistic, it may be fraud. Arrive Logistics recommends verifying all communications come from our registered email domain is @arrivelogistics.com. Our 24/7 phone number is 888-861-0650 and our leadership team can also be reached at feedback@arrivelogistics.com.

Use of Cookies

We use cookies to enhance your browsing experience, serve personalized ads or content, and analyze site traffic. By continuing to use this website, you acknowledge and consent to our use of cookies as detailed in our privacy policy.

Get Access to the Shipper Portal

Current Customers

Already shipping with Arrive?

Connect with your representative to get access to your ARRIVEnow Shipper Portal. Can’t connect with your rep? Use this form to reach out.

New Customers

Not shipping with Arrive yet?

If you’re not an Arrive customer, please join our network to access the portal.

Carrier Scorecard Feedback

Contact Us

"*" indicates required fields

Matt Pyatt, Chief Executive Officer

Matt Pyatt is the Chief Executive Officer of Arrive Logistics. He co-founded Arrive with President Eric Dunigan in 2014 after building his career at Command Transportation. As CEO, he is responsible for overseeing the company’s financial health, strategic vision and culture, as well as building a scalable leadership team to support Arrive’s growth.

Request Arrive's SOC 2 Report

Eric Dunigan,
President & Co-Founder

Eric Dunigan is the President of Arrive Logistics. He began his career at Command Transportation before co-founding Arrive with Matt Pyatt in 2014. As president, he is responsible for driving revenue and growth, as well as leading the Strategic Partnerships team — a veteran group of supply chain experts who work with Arrive’s customers to reimagine their shipping strategy.

Arrive Logistics VP of Market Intelligence David Spencer Headshot

David Spencer,
VP of Market Intelligence

David Spencer is the Vice President of Market Intelligence at Arrive Logistics. David joined Arrive in 2017 after spending six years at AFN focused on business intelligence. His department provides critical market data and expert analysis to internal teams and publishes monthly market updates for shippers and carriers under the Arrive Insights banner.

Andrew Clarke, Board Chair,
Arrive Logistics and Global Critical Logistics

Andrew Clarke is Board Chairman for Global Critical and DCLI, Inc., and a board member for Arrive Logistics and Element Fleet Management Corp. His 20 years of global transportation and logistics experience include time as CFO of C.H. Robinson, CEO of Panther Expedited Services, Inc. and SVP and CFO roles at Forward Air Corporation.

Dean Croke,
Principal Analyst
at DAT Freight and Analytics

Dean Croke is a Market Analyst at DAT Solutions, where he focuses on freight market intelligence and data analytics. His 35 years of experience with data analytics, transportation, supply chain management, mining and insurance risk management include time as co-founder of FleetRisk Advisors and in a number of other high-level roles with FreightWaves, Spireon, Lancer Insurance, Omnitracs Analytics (formerly Qualcomm) and more.

Asanka Jayasuriya,
CTO and Partner at 8VC

Asanka Jayasuriya is the CTO at 8VC. He is an accomplished engineering and product leader with 20+ years of experience in the cloud. He has a strong background in enterprise SaaS, PLG products, infrastructure, and security. Notably, he served as CTO and SVP of Engineering at SailPoint, leading their successful transition to the cloud and successful exit event. He also held senior leadership roles at InVision, Atlassian, and Amazon, driving growth, operational excellence, and innovation. At 8VC, Asanka works with the entrepreneurs and leaders in our portfolio as a virtual CTO supporting their growth.

Chad Eichelberger,
President at Reliance Partners

Chad Eichelberger is the President of Reliance Partners. Since 2015, he’s leveraged his extensive experience in risk management, compliance, best practices and contracts to lead the company’s logistics and truck insurance strategy and operations. Chad was previously the President of Access America Transport, where he led the company from $8M to over $600M in revenue.

Barry Conlon,
CEO & Founder at Overhaul

Barry Conlon is the CEO and founder of Overhaul, the global leader in active supply chain risk management and intelligence. With a remarkable career spanning over 30 years in supply chain security, he is widely regarded as a trailblazer in modern-day supply chain security standards and best practices.

Tim Denoyer,
VP and Senior Analyst at ACT Research

As VP and Senior Analyst at ACT Research, Tim analyzes commercial vehicle demand and alternative powertrain development (i.e. electrification), and authors the ACT Freight Forecast, U.S. Rate and Volume Outlook. He previously spent fifteen years in equity research focused primarily on the transportation, machinery, and automotive industries, and co-founded leading equity research firm Wolfe Research.

Download this Report

"*" indicates required fields

Add me to the monthly distribution