Need Help
close button

How can we help?

Select One:

Carrier Market Outlook – January 2025

Author: rwalter@arrivelogistics.com
Shape

January Theme: New Year Shakeups

Carrier Market Outlook - January 2025

Arrive Insights™

Arrive Logistics VP of Market Intelligence David Spencer Headshot
David Spencer
VP of Market Intelligence
Aryan Shah
Senior Research Analyst

The 2024 peak season had no major surprises. Routing guide disruptions led to elevated spot market activity and rates, and increased year-over-year volatility signaled that the market recovery is progressing. Winter storms Blair and Cora triggered short-term volatility in early January, but conditions are expected to stabilize through February. Our outlook for 2025 remains consistent: The ongoing balancing of supply and demand, along with the narrowing spot-contract rate gap, will likely heighten the risk of disruption this year.

Key Takeaways:

  • Routing guide disruption increased despite stable demand, emphasizing that capacity remains a primary driver of market tightening.

  • Dry van and reefer tender rejections are trending well above 2023 levels, indicating improved supply-demand balance and the market’s increasing vulnerability to disruption.

  • Rates rose following winter storms Blair and Cora but are expected to stabilize in the coming weeks.

  • The East and Gulf Coast port strike was averted, preventing additional market volatility.
  • Both the economy and consumer activity remain resilient, indicating stable to upward demand trends as 2025 begins.

Market Indicators

Holiday tightening.

Trucking Capacity

Correction continues.

Demand Outlook

Indicators are strong.

Market By Mode

Simplified LTL classification.

Rates

Decline slowed.

Economic Outlook

Inflation is sticky.

Market Indicators

What’s Happening: Capacity tightened during the Holidays.

Why It Matters: Increased routing guide disruption drove more freight to the spot market.

The Morgan Stanley Dry Van Freight Index is another measure of relative supply; the higher the index, the tighter the market conditions. The black line with triangle markers on the chart provides a great view of what directional trends would be in line with normal seasonality based on historical data dating back to 2007. The data deviated from the 10-year average toward the end of 2024; in fact, only 2021 ended the year with a higher reading, indicating market conditions are the tightest they’ve been since early 2022.

Morgan Stanley Dry Van Truckload Freight Index

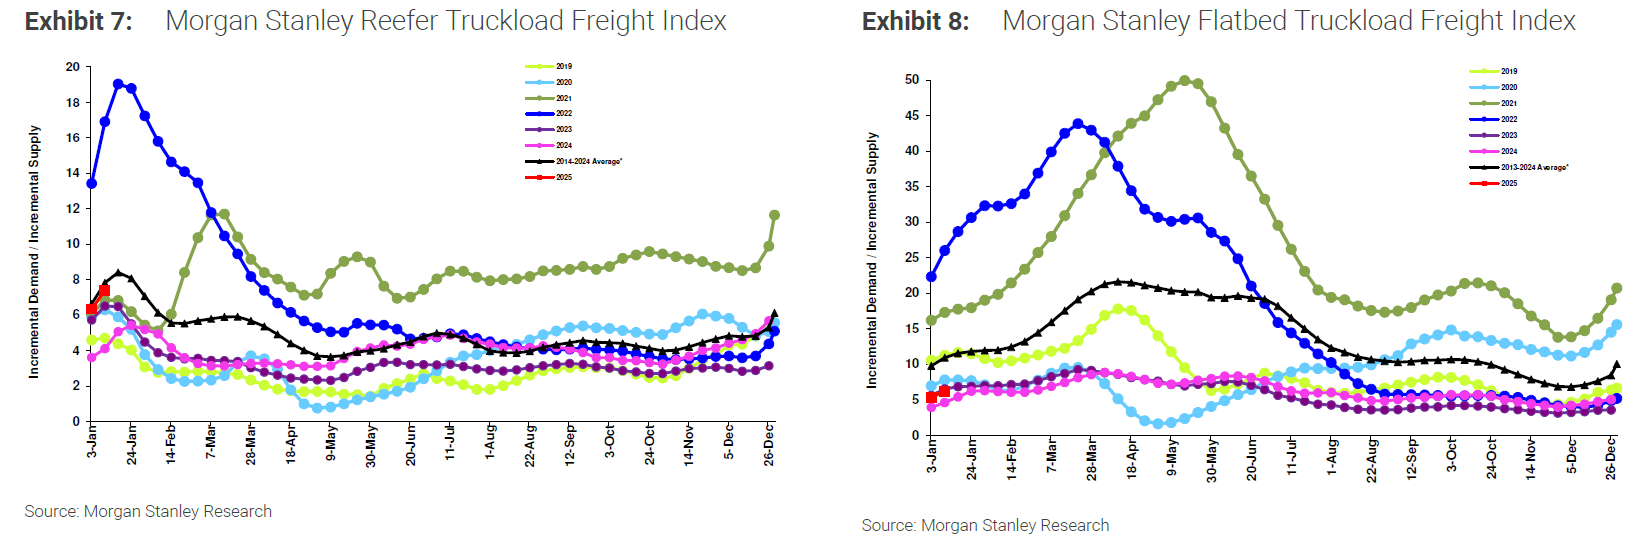
Morgan Stanley Reefer and Flatbed Truckload Freight Indices

The latest ACT For-Hire Trucking Supply-Demand Balance Index reading showed conditions tightened from October to November due to increasing freight volume and declining capacity. ACT also reported that the expansion of private fleets remains a primary driver of the prolonged equilibrium cycle.

Class 8 tractor sales have slowed further, yet another indicator that the market will continue to rebalance in the coming months. If the U.S. economy grows as expected, freight volumes should increase and drive tighter market conditions in 2025 than in 2024.

ACT For-Hire Trucking Survey

Data continues to indicate that the freight market has passed the bottom and is more vulnerable to disruption. As 2025 continues, stretches of seasonality and volatility will likely have a more pronounced impact.

The Sonar Outbound Tender Reject Index (OTRI), which measures the rate at which carriers reject the freight they are contractually required to take, was up nearly 100% year-over-year around Christmas. As we forecasted last month, tender rejections surpassed 10% for the first time since April 2022 before falling to around 8% by year-end. Rejection rates remained relatively high in early 2025 as winter storms wreaked havoc in the Midwest and Southeast regions.

In the full history of the FreightWaves Sonar OTRI, the measure has only risen above 10% when a market disruption was in progress or conditions were primed for one with the right catalyst. For example, in 2019, rejection rates peaked at roughly 14% over Christmas week. A few months later, pandemic-related buying patterns sent the market on a multi-year bull run. While that was an extraordinary black swan event and one unlikely to occur again in the next few months, it does highlight that OTRI volatility leading up to the 2020 disruption indicated market vulnerability.

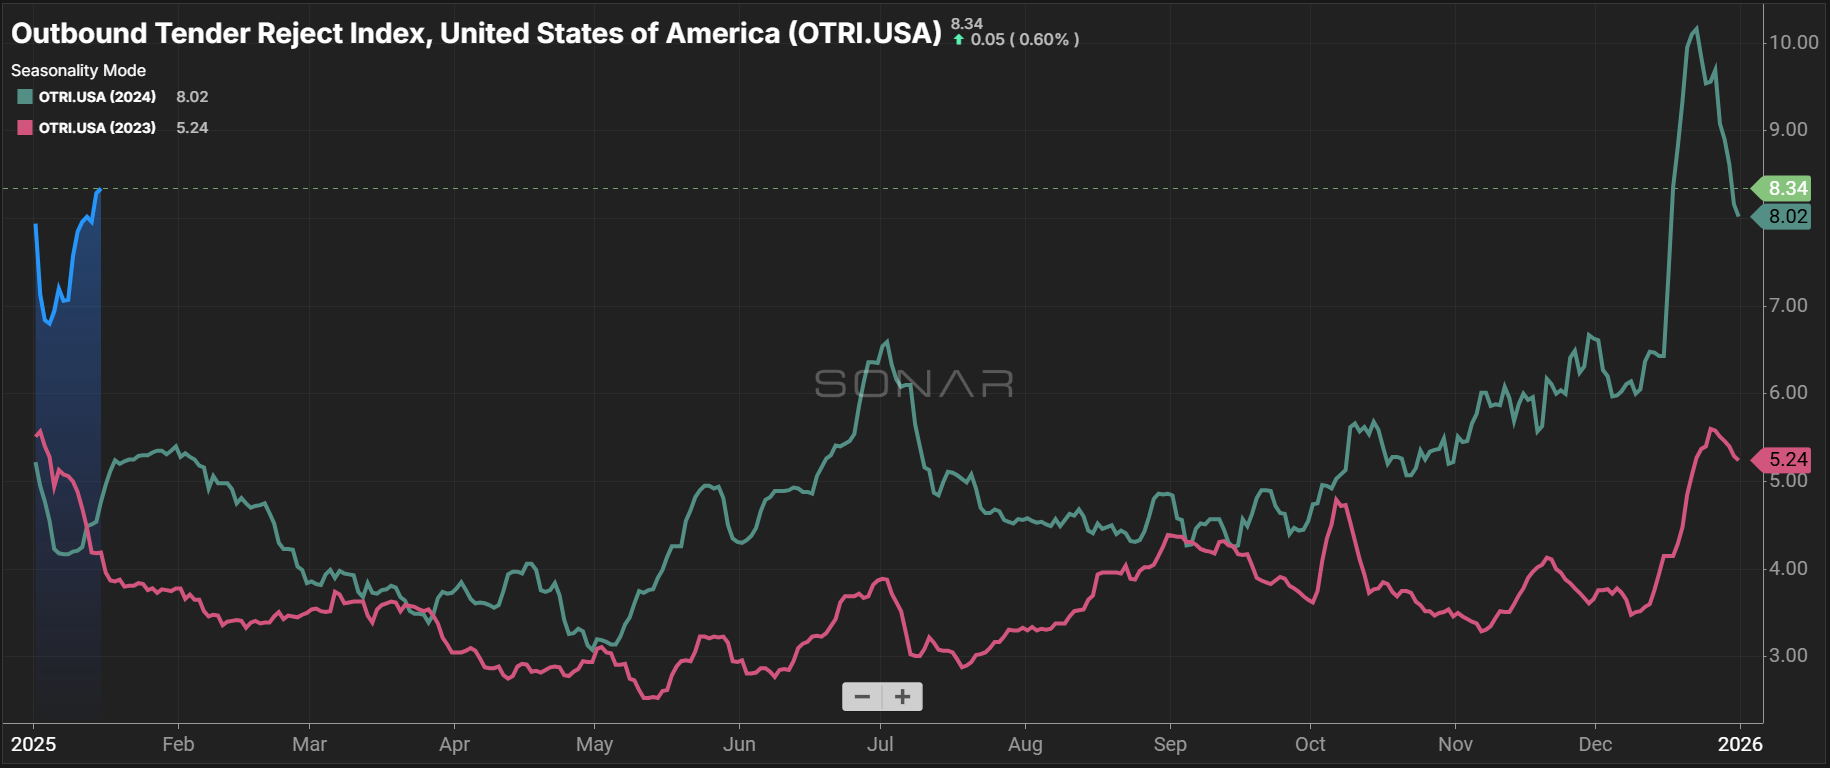
Outbound Tender Reject Index (SONAR)

Dry van-specific tender rejections approached 9% around Christmas, fell below 8% by year-end, and spiked again in early January amid highly disruptive winter storms. Today, rejection rates are ahead of what they were around the 2024 summer peak and well above the highest level in 2023, confirming that routing guides are becoming more sensitive to disruption.

Van & Reefer Outbound Tender Reject Indices

Reefer rejection rates surpassed 20% for the first time in over two years around Christmas and remain above 18% amid the ongoing impact of winter storms. A similar trend emerged last year as consecutive winter storms drove reefer rejection rates above 10%. Given the forecast for more cold temperatures, reefer rejection rates could create additional spot rate volatility for most of January before likely declining later in Q1.

The DAT Load-to-Truck Ratio (L/T) measures the total number of loads relative to the total number of trucks posted on its spot board. In December, the dry van ratio increased significantly month-over-month and was up 82% year-over-year, the highest level since February 2022. Though less pronounced than dry van, the reefer ratio was nearly 9, its highest point since February 2022. This data mirrors tender rejection trends and our overall market narrative.

DAT Van Load-to-Truck Ratio

DAT Reefer Load-to-Truck Ratio

Trucking Capacity

What’s Happening: The capacity correction continues as revocations tick up.

Why It Matters: Increased capacity constraints should continue to influence market vulnerability.

Over 1,800 carrier revocations occurred last month, the most since early 2024. The resulting tightening is reflected in the December tender rejection and load-to-truck ratio data. As the carrier pool continues to shrink, spot capacity will decline and vulnerability to disruption from a sudden spot demand shock will increase.

FTR’s Carrier Revocations, New Carriers & Net Change in Carrier Population

We continue to monitor the evolving role of private fleets as they increase their share of the for-hire market despite volume declines. With less freight available, for-hire carriers are negotiating rates aggressively to maintain volume and revenue, putting downward pressure on spot rates. If this trend persists, it could extend the current rate environment deeper into 2025 than initially expected.

US Truckload Market Mix Shifts, ACT Research & Cass Freight Index

According to the latest data from ACT Research on U.S. Class 8 tractors, the backlog-to-build (BL/BU) ratio increased from 6.5 months in November to 7.0 months in December. The backlog also grew by more than 12,000 units to reach 87,000 in December. ACT Research reports lower build rates largely supported this growth as manufacturers continue to prioritize vocational production over tractor production. With rates still low, significant near-term growth remains unlikely.

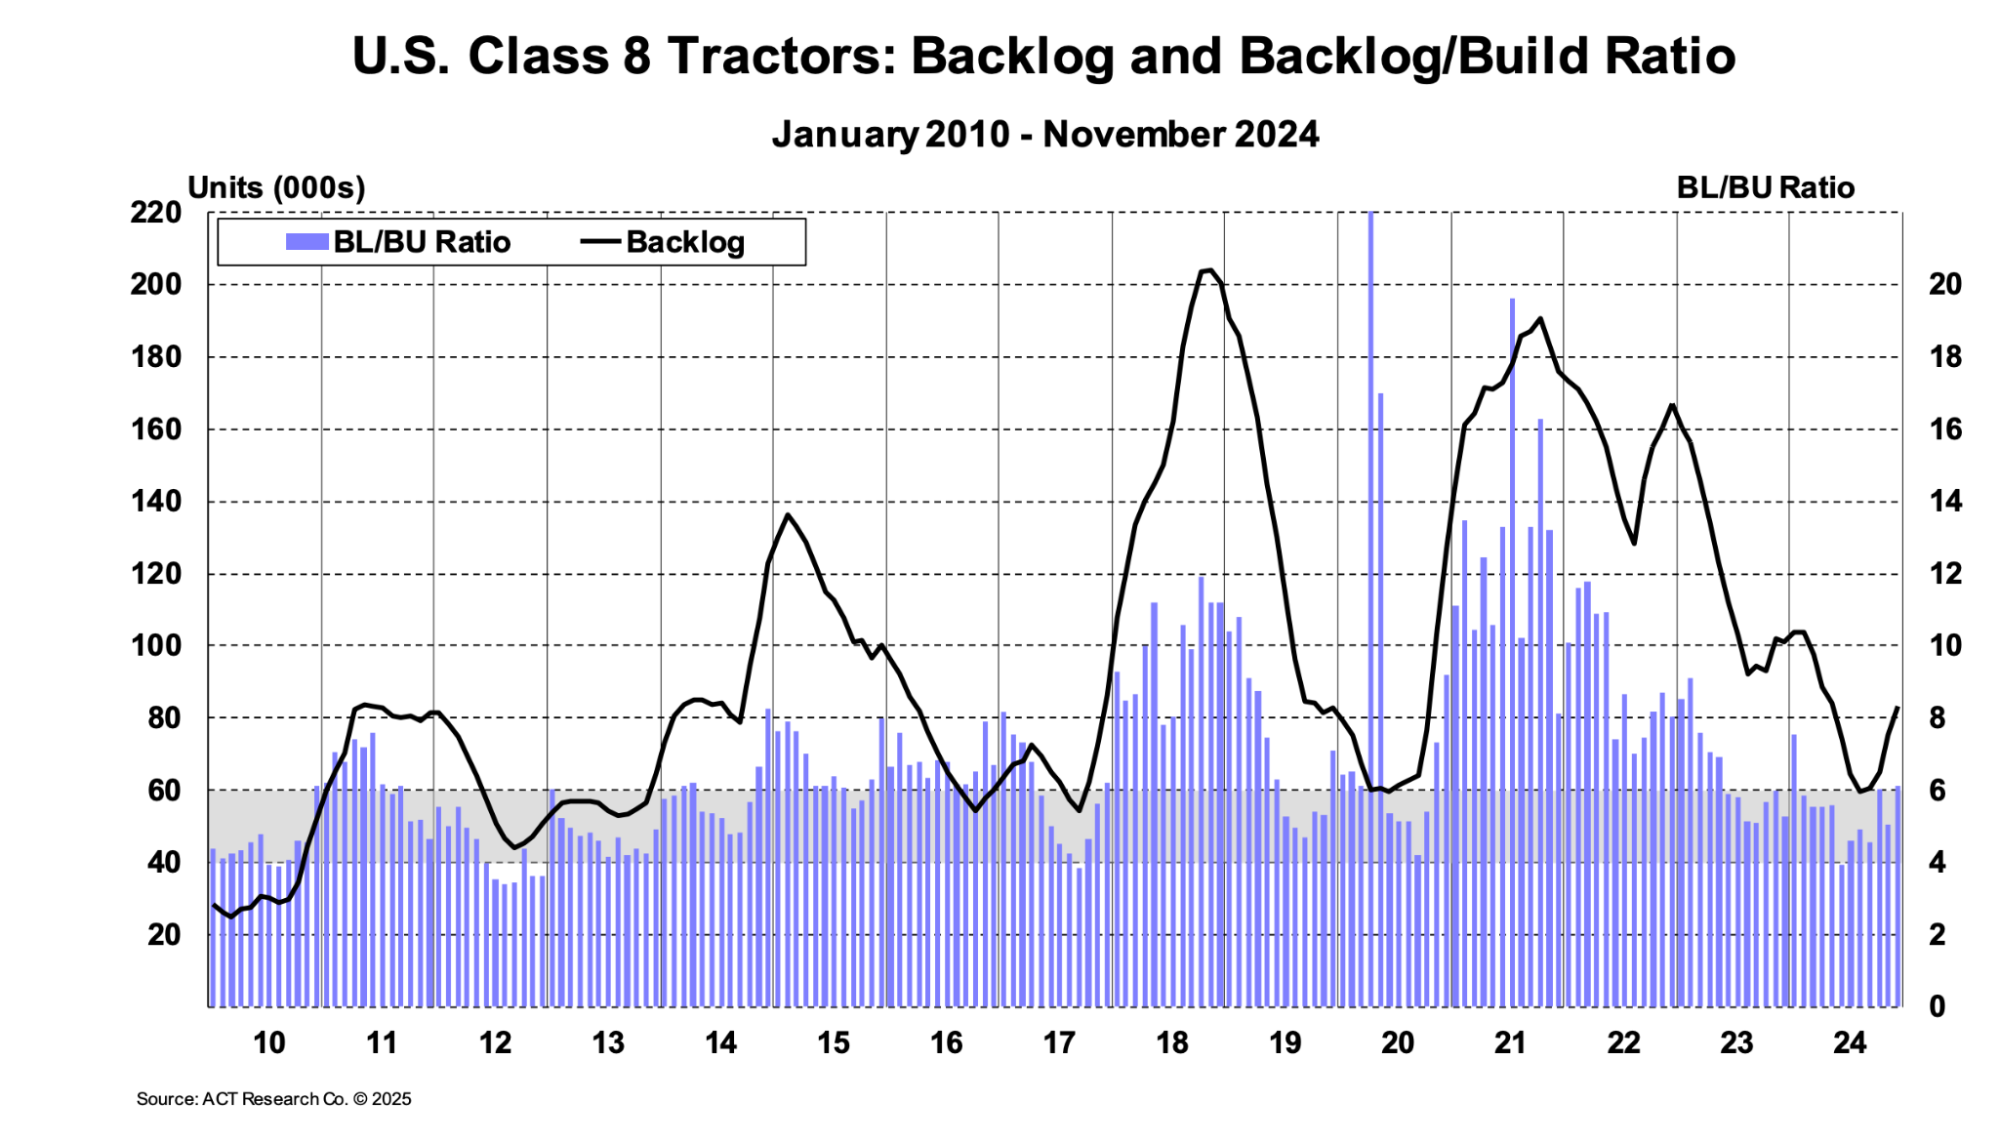
ACT Research, U.S. Class 8 Tractors: Backlog and Backlog/Build Ratio

According to ACT’s Driver Availability Index, the driver market remains sufficient to service demand. The most recent reading of 52.8 in November marked the 30th consecutive month of easing driver availability.

ACT For-Hire Trucking Index: Driver Availability

The December trucking jobs report showed a seasonally adjusted decline of 800 jobs, and downward revisions for October and November resulted in 800 and 2,000 fewer jobs, respectively. Total employment fell by only 500 jobs over the past four months, suggesting relative stability; however, jobs were down 5,900 year-over-year in December and 42,000 below the July 2022 peak.

Factoring that stability into the significant year-over-year drop reflects how the rate environment has leveled out and started shifting toward inflation over the past year. A stable operating environment for carriers typically supports employment stability, a positive sign for trucking companies if current conditions hold or improve.

Looking ahead, while demand uncertainty remains, overall market conditions are expected to stay relatively steady. Carriers have recently focused on maximizing asset utilization and operational efficiency. Should rates rise significantly later in the year, that focus may shift toward expansion, potentially driving job growth. However, meaningful gains may not materialize until mid-year or beyond, suggesting the most severe job losses are likely behind us in this market cycle.

Monthly Change in Trucking Jobs, FRED Economic Data

Demand Outlook

What’s Happening: Volume indicators remain strong.

Why It Matters: Positive indicators bode well for 2025 demand.

With the holiday season well behind us, demand volatility will likely settle over the next few months. While there remains uncertainty about how potential tariffs may impact the freight market, averting the port strike alleviated some concerns heading into the new year. With that said, our outlook still calls for flat to slow demand growth in 2025.

While ports have yet to release final December import numbers, the National Retail Federation estimates that 2.24 million TEUs hit shore, up over 19% from December 2023. If these numbers hold, 25.6 million TEUs would have been imported in 2024, up 15.2% year-over-year. The current NRF forecast calls for 2.16 million TEUs this month, which would be a 10% increase from January 2024.

The potential for East and Gulf Coast port strikes likely spurred a pull-forward event that increased import volumes toward the end of 2024. How that will impact volumes in 2025 remains to be seen, but so far, the NRF projects that February will be the only month with year-over-year import declines in the first five months of the year.
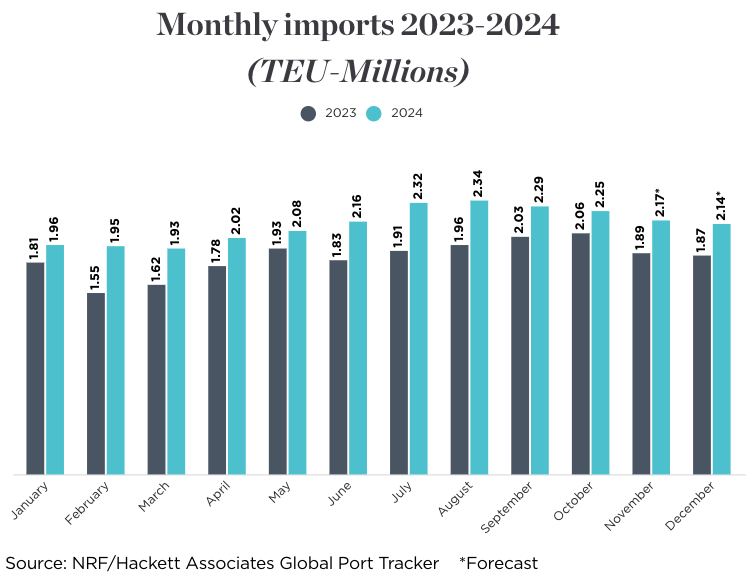
NRF Monthly Imports

December DAT data showed spot postings were up 17% month-over-month and over 23% year-over-year, further supporting the narrative that the market is more balanced than a year ago. The large reduction in truck postings is also a strong indicator of the tightening capacity environment that led to increased routing guide challenges through the year-end push.

DAT Trendlines

Market by Mode

Cross-Border Canada

What’s Happening: Capacity constraints and rate volatility were prevalent during the holidays.

Why It Matters: Market conditions are expected to stabilize as driver availability improves in Q1 2025.

  • Driver capacity remains tight as many are still on holiday, with some carriers operating well below their normal fleet levels.
  • Rates are rising quickly for both inbound and outbound freight, putting pressure on both ends of the market.
  • The most significant rate increases are in California and Texas, especially for reefer freight out of California.
  • Rates are expected to stabilize as capacity returns, but current conditions are causing noticeable disruptions.
  • Severe capacity challenges in California have made it difficult to secure coverage, even after loads were offered to a wide network of brokers, reflecting the strain on the market.

Cross-Border Mexico

What’s Happening: Cross-border demand is rising due to tariff concerns, security risks, and rising fuel costs.

Why It Matters: Higher costs and capacity strain may ease later than expected in Q1 2025.

  • Shippers are frontloading cross-border shipments in response to proposed U.S. tariffs on Mexican imports, which will increase activity on the MX/US trade lane through mid-January.
  • Companies are shifting capacity closer to the U.S.-Mexico border to reduce cargo and auto theft risks, raising cross-border trade costs in central Mexico, especially in EM, DF and Puebla.
  • Logistics providers are investing in border infrastructure — such as truck terminals, rail yards and warehouses — to support long-term growth in cross-border trade.
  • Mexico’s 4.5% year-over-year diesel cost increase is raising concerns about transportation cost volatility heading into Q2 2025.
  • Shippers are pushing to lock in contract rates before the end of Q1 to mitigate the impact of rising fuel and transportation costs.

Temp Controlled

What’s Happening: Regional capacity remains tight in key markets, with varying demand across the U.S.

Why It Matters: Market conditions are expected to gradually stabilize throughout Q1.

East Coast

  • Southeast markets remain soft due to low seasonal produce demand.
  • Seafood shipments in the Northeast are steady, but inbound Midwest and West Coast rates remain low.
  • Major snowstorms could disrupt this otherwise stable market.

Midwest

  • Capacity is tightening in meat-producing hubs like Kansas, Iowa, Missouri and Nebraska.
  • Reefer demand is rising due to protect-from-freeze shipments.
  • Outbound rates remain elevated.

South

  • Capacity is available across most markets, but same-day load coverage is tight in McAllen, Texas and El Paso, Texas.
  • Overall, demand is steady, with no significant seasonal spikes.

West

  • California markets remain soft.
  • Arizona is tightening due to increasing produce volumes.
  • Outbound Los Angeles freight may cause localized tightness near the Arizona border.

Pacific Northwest (PNW)

  • Rates remain elevated, and tight capacity is expected through mid-February.
  • Protect-from-freeze freight is driving steady demand, especially for seasonal goods.

LTL Insights

What’s Happening: The NMFTA is shifting to a simplified, density-based freight classification system.

Why It Matters: This change will make freight classification easier and more accurately reflect shipping costs.

  • The NMFTA is simplifying its 90-year-old rating system to adopt a more density-based approach.
  • This change will streamline freight classification and better reflect actual shipping costs.
  • Overall, LTL rates and demand remain steady.

Open Deck

What’s Happening: Flatbed rates and demand are rising due to infrastructure spending, weather disruptions and seasonal demand.

Why It Matters: Moderate rate growth and capacity shifts are likely to continue into early 2025.

  • Flatbed contract rates rose to $2.59 per mile, up $2.00 per mile month-over-month and 3.2% year-over-year.
  • Infrastructure spending and construction recovery are driving steady rate growth.
  • The flatbed trailer market is projected to grow from $44.25 million in 2025 to $53.71 million by 2030.
  • New capacity and drop trailer solutions are becoming more common.
  • Spot rates and volumes are rising after severe weather and seasonal demand.
  • Midwest capacity may tighten as European drivers leave for Orthodox Christmas.

Rates

What’s Happening: Rates continue to rise in early 2025.

Why It Matters: Consecutive storms have slowed the typical post-holiday rate decline.

According to weekly spot market data provided by Truckstop, which we believe provides the best view of week-to-week seasonal volatility, this year’s holiday peak season van and reefer rates followed trends similar to those in 2023. Reefer rates rose by nearly 15% in three weeks to reach the highest mark since the final week of 2023. Dry van rates ticked up nearly 7% in the same time frame, hitting the highest weekly mark since late January 2024. Rates will likely remain elevated before declining towards the end of January and into February.

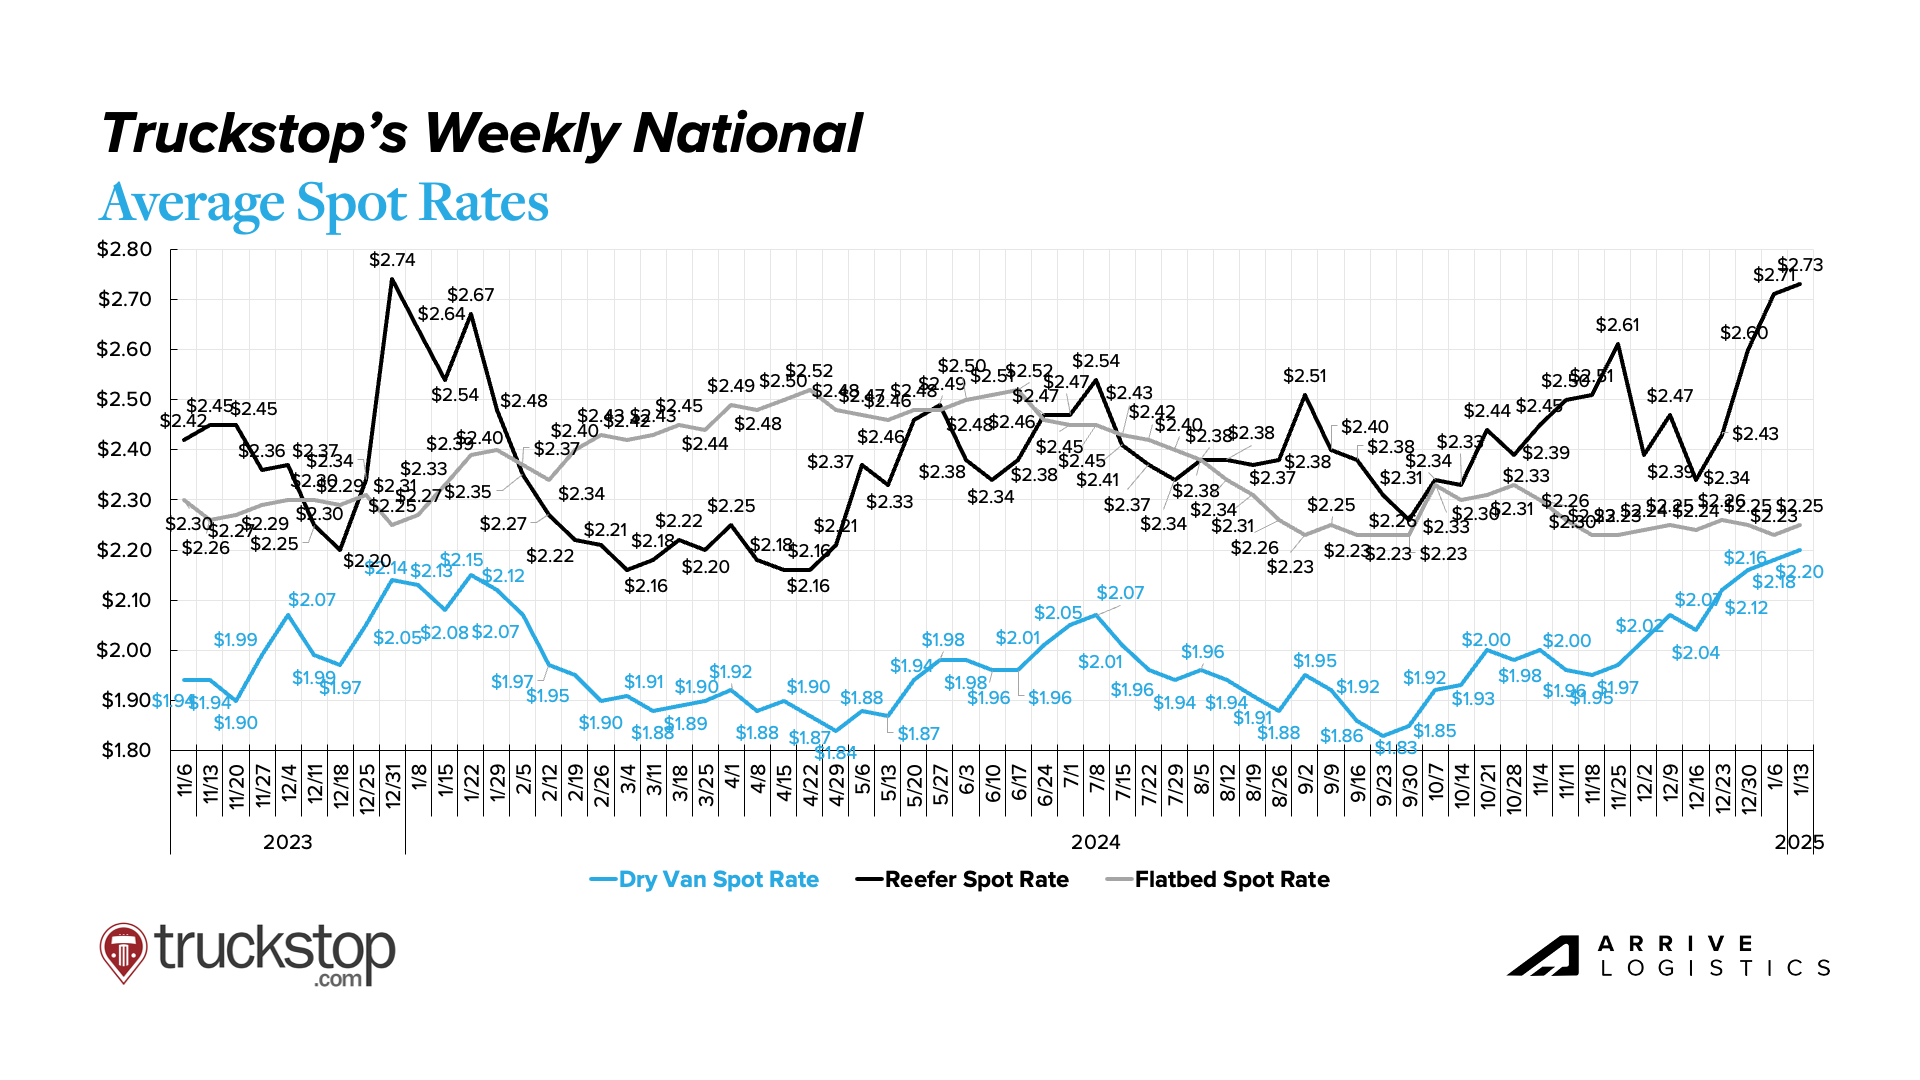
Truckstop Weekly National Spot Rate Average

National diesel prices continued ticking down through the year-end, with the December average landing at $3.49 per gallon. Low fuel prices continue to benefit carriers who are navigating high operating costs amid low revenues. The EIA’s fuel outlook remains favorable for carriers, calling for an average price of $3.61 per gallon in 2025, down from $3.78 per gallon in 2024.
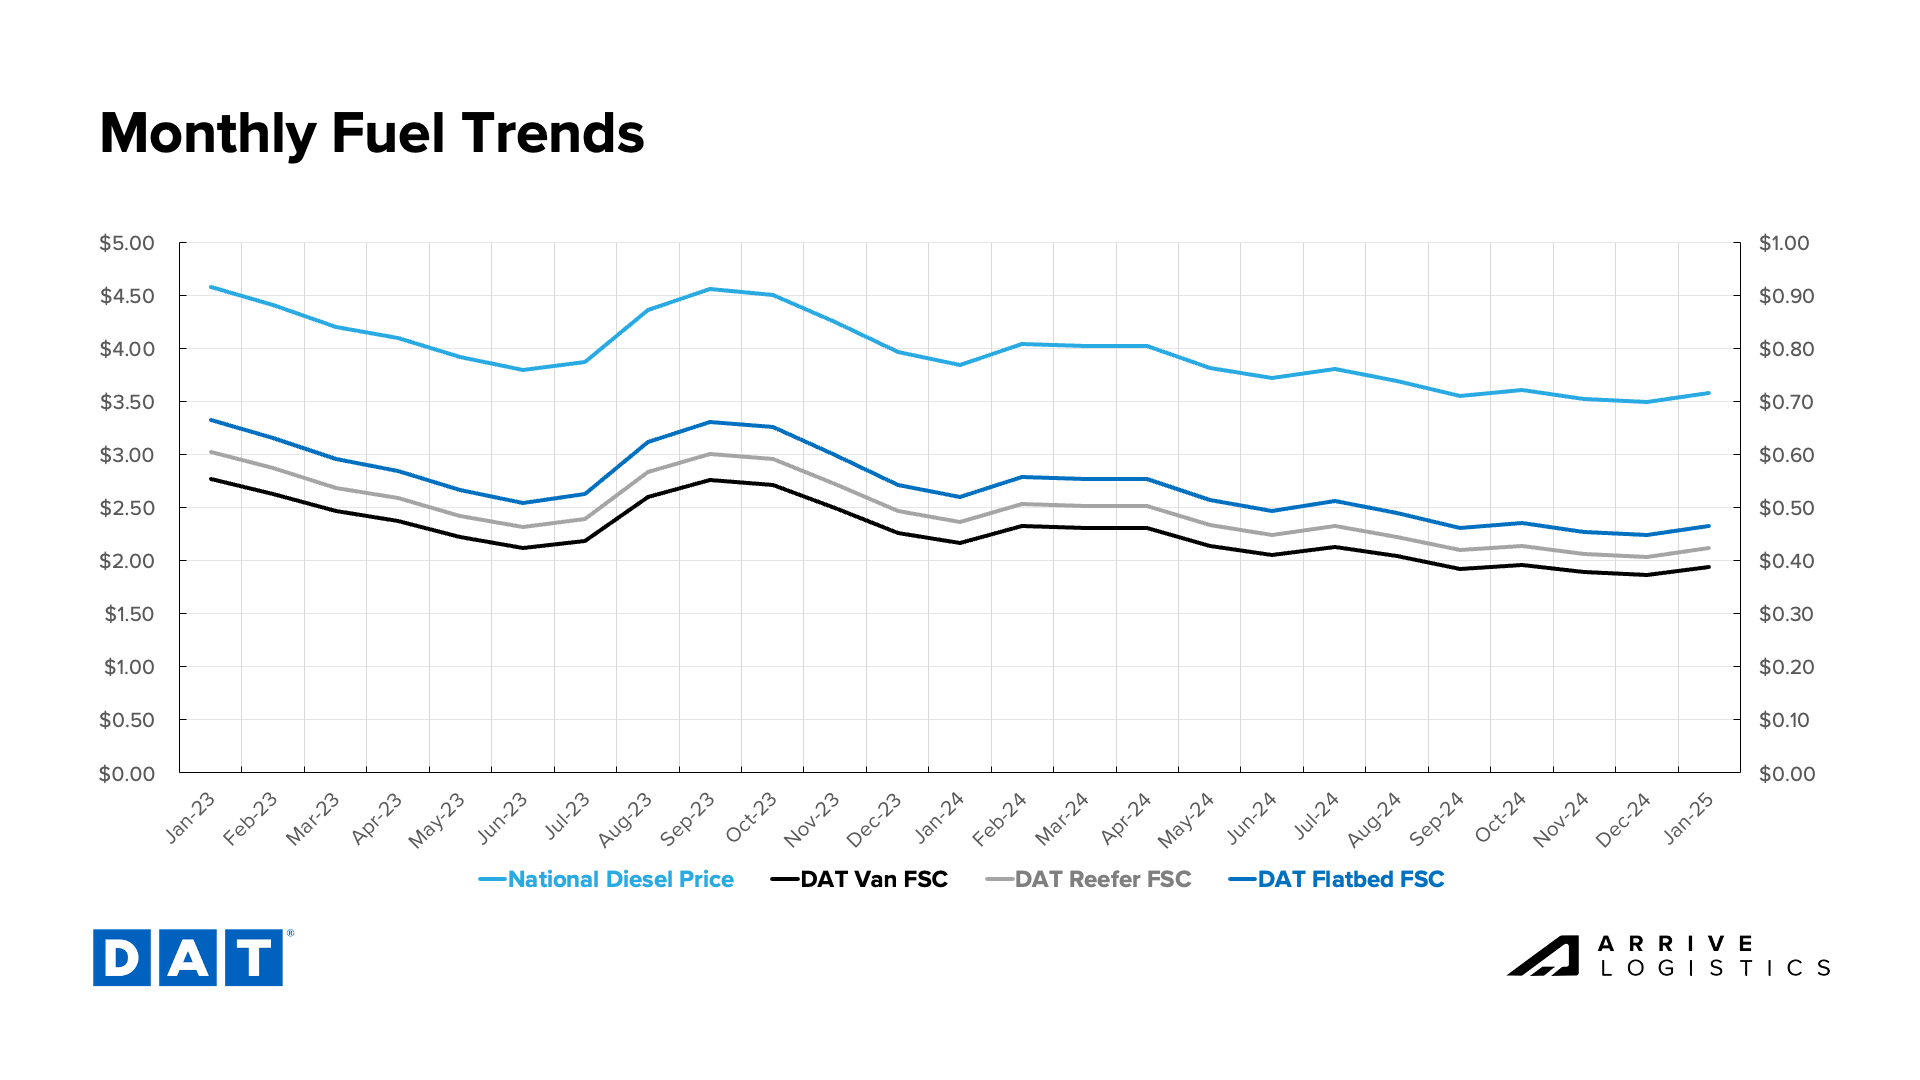
DAT Fuel Trends

DAT December dry van data provides further evidence of a strong 2024 holiday peak season. Spot rates reached $1.74 per mile, excluding fuel, the highest monthly average since January 2023. Rates were also up $0.09 per mile from December 2023. Notably, the spot-contract rate gap closed to $0.26 per mile, the smallest spread since March 2022. The spot-contract rate gap has a strong inverse correlation to market vulnerability and shows the most sensitive conditions in two years.

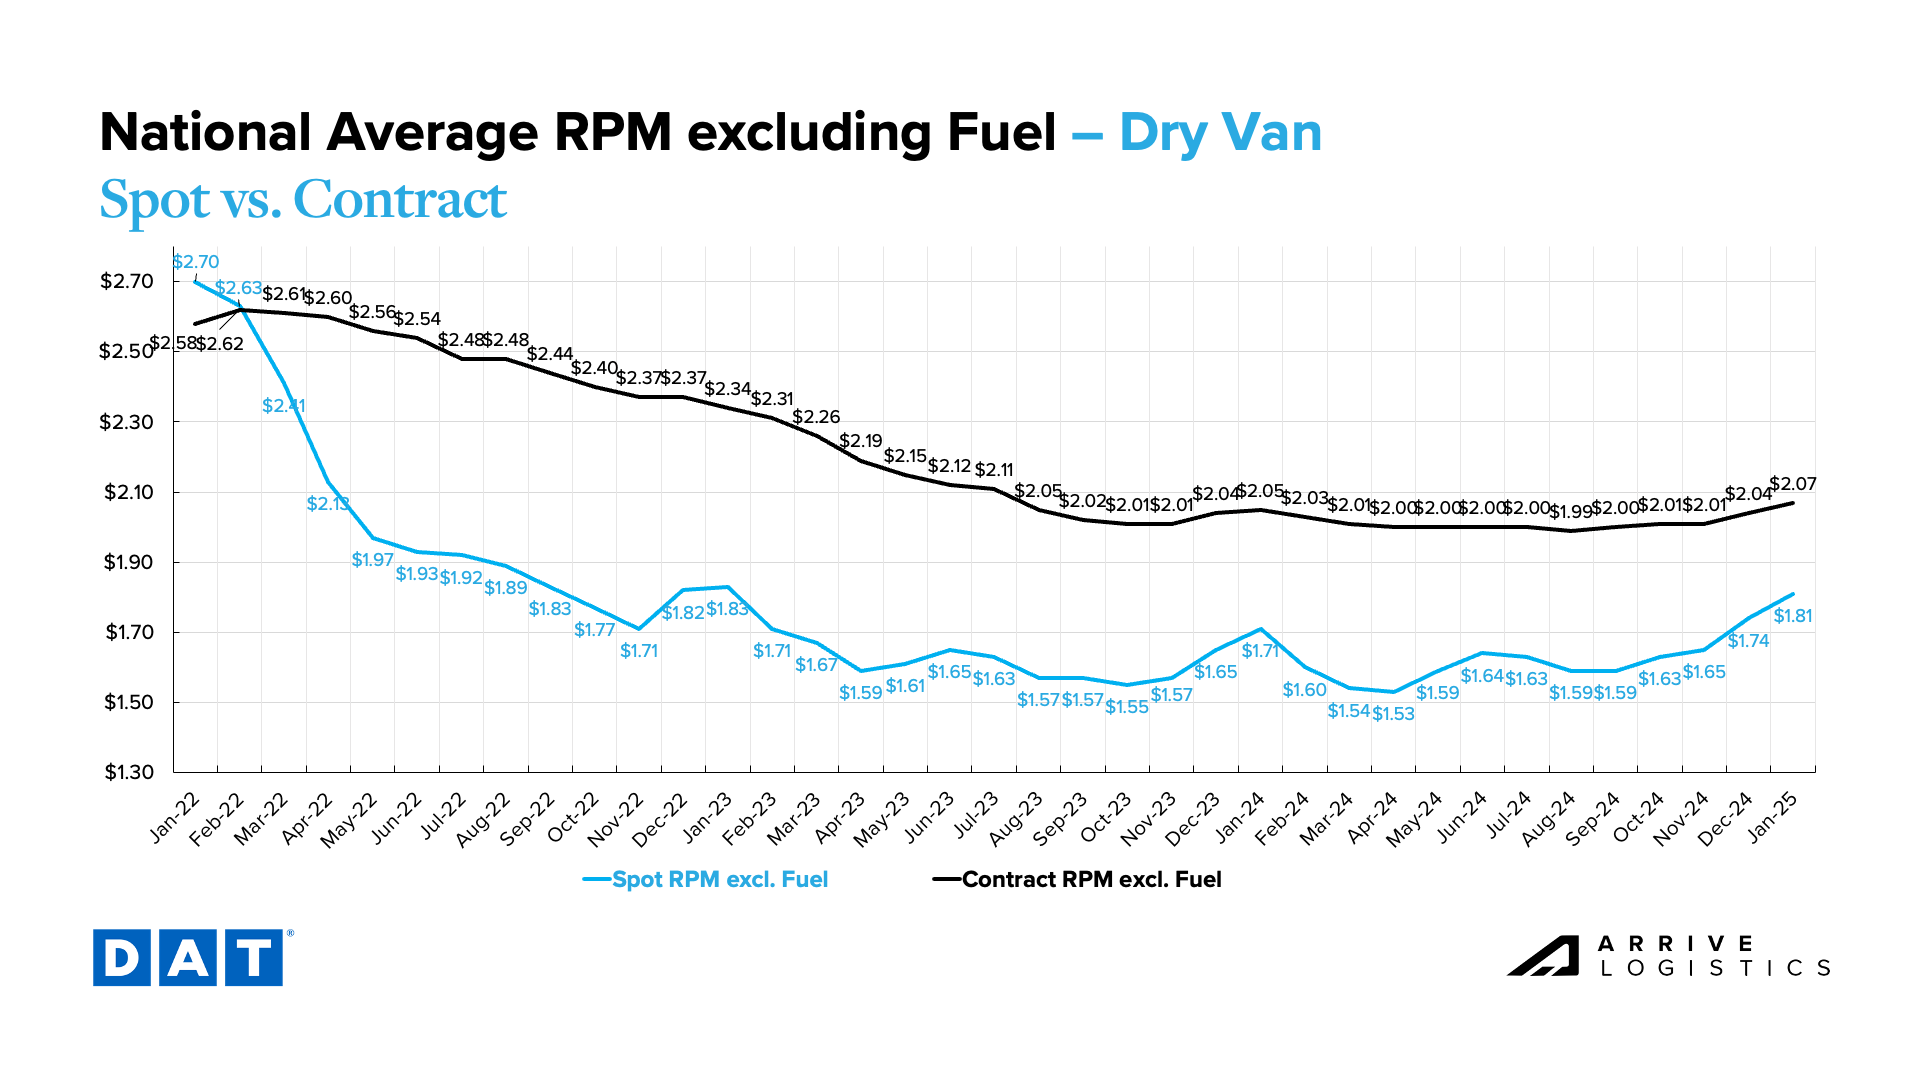
DAT Dry Van National Average RPM Spot vs. Contract

Reefer spot rates, excluding fuel, rose by $0.03 per mile from November to December, while contract rates, excluding fuel, increased by just $0.01 to $2.33 per mile. These trends closely reflect those of November and December 2023. This year, spot rates increased by $0.12 per mile from December to January, but the current rate of $2.18 per mile is higher than in 2024 and the same as in 2023. This year’s rate inflation likely resulted from winter storms Blair and Cora.

Flatbed spot and contract rates, excluding fuel, rose in December to $1.95 per mile and $2.60 per mile, respectively. Rates continue to rise in January, and the spread remains high at $0.63 per mile. Overall, the flatbed market continues to show more stability than dry van and reefer markets.

DAT Temp Control National Average RPM Spot vs. Contract

Economic Outlook

What’s Happening: Inflation remains sticky and above the 2% target rate.

Why It Matters: Future rate cuts are likely and could boost freight demand in late 2025.

Inflation ticked up to 2.9% in December. Inflation remaining above the Federal Reserve’s target rate of 2% increases the possibility of additional interest rate cuts in the first half of 2025. However, the strong jobs data released earlier this month seems to indicate a “higher for longer” interest rate environment, which would deliver no meaningful benefit to freight demand in 2025.

New York Times Inflation Data

Recent Bank of America credit card data shows that spending per household increased by 2.2% year-over-year in December and was up 0.7% from November. While these numbers bode well for the overall economy, the impact on the freight market will likely be muted as service spending continues to rise faster than retail.

Bank of America, Total Card Spending per Household

Conclusion

Disruptions during this year’s peak holiday season were more pronounced than in 2023. Tender rejections reached the highest levels since early 2022 and remain elevated as of mid-January. Spot market activity increased in turn, leaving the market more vulnerable to disruption as 2025 continues. Demand remains flat to down amid contracting supply, suggesting that peak season trends were largely driven by tightening capacity.

As the spot-contract rate gap continues to shrink, the likelihood of an inflationary market shift increases. While we are not yet ready to predict widespread disruption, the market should become more reactive to unexpected events throughout the year. For now, we will continue to monitor how tariffs, labor and capacity might cause abrupt market changes in 2025.

About the Carrier Market Update

The Arrive Carrier Market Outlook, created by Arrive Insights™, is a report that analyzes data from multiple sources, including but not limited to FreightWaves SONAR, DAT, FTR Transportation Intelligence, Morgan Stanley Research, Bank of America Internal Data, ACT Research, Journal of Commerce, Stephens Research, National Retail Federation and FRED Economic Data from the past month as well as year-over-year. We know market data is vital in making real-time business decisions. At Arrive Logistics, we are committed to giving you the data and insights you need to better manage your freight.

Request Arrive's SOC 2 Report

"*" indicates required fields

Scott Sandager,
Chief Administrative Officer 

Scott Sandager is the Chief Administrative Officer at Arrive Logistics. He joined Arrive in 2018, bringing over 14 years of logistics and brokerage experience, with expertise in project and change management, organizational design, talent development and customer satisfaction. Scott previously held many diverse roles of increasing responsibility with AFN, a Chicago-based freight brokerage.

Subscribe to receive freight market updates​​

"*" indicates required fields


Quick Apply

"*" indicates required fields

Max. file size: 50 MB.

Arrive Carrier Requirements

Please have the following info ready to complete registration

  • MC, MX, DOT, or state reg #
  • Tax ID & W9 info
  • Cert of Insurance: $100k cargo, $1M Auto, & $1M commercial general liability coverage
  • Active Common or Contract Authority (365+ days)
  • Safety Rating of at least Satisfactory (or None)

Fraud Prevention

Freight fraud continues to impact our industry. We encourage shippers and carriers to reach out to Arrive immediately if there is ever a shipment in question that may be subject to fraud. Arrive will not ask you to pay upfront for any dedicated lane or committed capacity program. If the offer you are receiving sounds too good to be true or unrealistic, it may be fraud. Arrive Logistics recommends verifying all communications come from our registered email domain is @arrivelogistics.com. Our 24/7 phone number is 888-861-0650 and our leadership team can also be reached at feedback@arrivelogistics.com.

Use of Cookies

We use cookies to enhance your browsing experience, serve personalized ads or content, and analyze site traffic. By continuing to use this website, you acknowledge and consent to our use of cookies as detailed in our privacy policy.

Get Access to the Shipper Portal

Current Customers

Already shipping with Arrive?

Connect with your representative to get access to your ARRIVEnow Shipper Portal. Can’t connect with your rep? Use this form to reach out.

New Customers

Not shipping with Arrive yet?

If you’re not an Arrive customer, please join our network to access the portal.

Carrier Scorecard Feedback

Contact Us

"*" indicates required fields

Matt Pyatt, Chief Executive Officer

Matt Pyatt is the Chief Executive Officer of Arrive Logistics. He co-founded Arrive with President Eric Dunigan in 2014 after building his career at Command Transportation. As CEO, he is responsible for overseeing the company’s financial health, strategic vision and culture, as well as building a scalable leadership team to support Arrive’s growth.

Tim Denoyer,
VP and Senior Analyst at ACT Research

As VP and Senior Analyst at ACT Research, Tim analyzes commercial vehicle demand and alternative powertrain development (i.e. electrification), and authors the ACT Freight Forecast, U.S. Rate and Volume Outlook. He previously spent fifteen years in equity research focused primarily on the transportation, machinery, and automotive industries, and co-founded leading equity research firm Wolfe Research.

Eric Dunigan,
President & Co-Founder

Eric Dunigan is the President of Arrive Logistics. He began his career at Command Transportation before co-founding Arrive with Matt Pyatt in 2014. As president, he is responsible for driving revenue and growth, as well as leading the Strategic Partnerships team — a veteran group of supply chain experts who work with Arrive’s customers to reimagine their shipping strategy.

Arrive Logistics VP of Market Intelligence David Spencer Headshot

David Spencer,
VP of Market Intelligence

David Spencer is the Vice President of Market Intelligence at Arrive Logistics. David joined Arrive in 2017 after spending six years at AFN focused on business intelligence. His department provides critical market data and expert analysis to internal teams and publishes monthly market updates for shippers and carriers under the Arrive Insights banner.

Andrew Clarke, Board Chair,
Arrive Logistics and Global Critical Logistics

Andrew Clarke is Board Chairman for Global Critical and DCLI, Inc., and a board member for Arrive Logistics and Element Fleet Management Corp. His 20 years of global transportation and logistics experience include time as CFO of C.H. Robinson, CEO of Panther Expedited Services, Inc. and SVP and CFO roles at Forward Air Corporation.

Dean Croke,
Principal Analyst
at DAT Freight and Analytics

Dean Croke is a Market Analyst at DAT Solutions, where he focuses on freight market intelligence and data analytics. His 35 years of experience with data analytics, transportation, supply chain management, mining and insurance risk management include time as co-founder of FleetRisk Advisors and in a number of other high-level roles with FreightWaves, Spireon, Lancer Insurance, Omnitracs Analytics (formerly Qualcomm) and more.

Asanka Jayasuriya,
CTO and Partner at 8VC

Asanka Jayasuriya is the CTO at 8VC. He is an accomplished engineering and product leader with 20+ years of experience in the cloud. He has a strong background in enterprise SaaS, PLG products, infrastructure, and security. Notably, he served as CTO and SVP of Engineering at SailPoint, leading their successful transition to the cloud and successful exit event. He also held senior leadership roles at InVision, Atlassian, and Amazon, driving growth, operational excellence, and innovation. At 8VC, Asanka works with the entrepreneurs and leaders in our portfolio as a virtual CTO supporting their growth.

Chad Eichelberger,
President at Reliance Partners

Chad Eichelberger is the President of Reliance Partners. Since 2015, he’s leveraged his extensive experience in risk management, compliance, best practices and contracts to lead the company’s logistics and truck insurance strategy and operations. Chad was previously the President of Access America Transport, where he led the company from $8M to over $600M in revenue.

Barry Conlon,
CEO & Founder at Overhaul

Barry Conlon is the CEO and founder of Overhaul, the global leader in active supply chain risk management and intelligence. With a remarkable career spanning over 30 years in supply chain security, he is widely regarded as a trailblazer in modern-day supply chain security standards and best practices.

Download this Report

"*" indicates required fields

Add me to the monthly distribution