


The Morgan Stanley Dry Van Freight Index is another measure of relative supply; the higher the index, the tighter the market conditions. The black line with triangle markers on the chart provides a great view of what directional trends would be in line with normal seasonality based on historical data dating back to 2007.
As expected, conditions have tightened in line with normal seasonality since mid-May, but still remain below historical levels. This largely aligns with contract tender rejection trends and indicates that despite recent market volatility, supply is still sufficient to support overall demand. Overall conditions remained relatively stable through the July 4th holiday and will likely fall in line with seasonal trends moving forward.
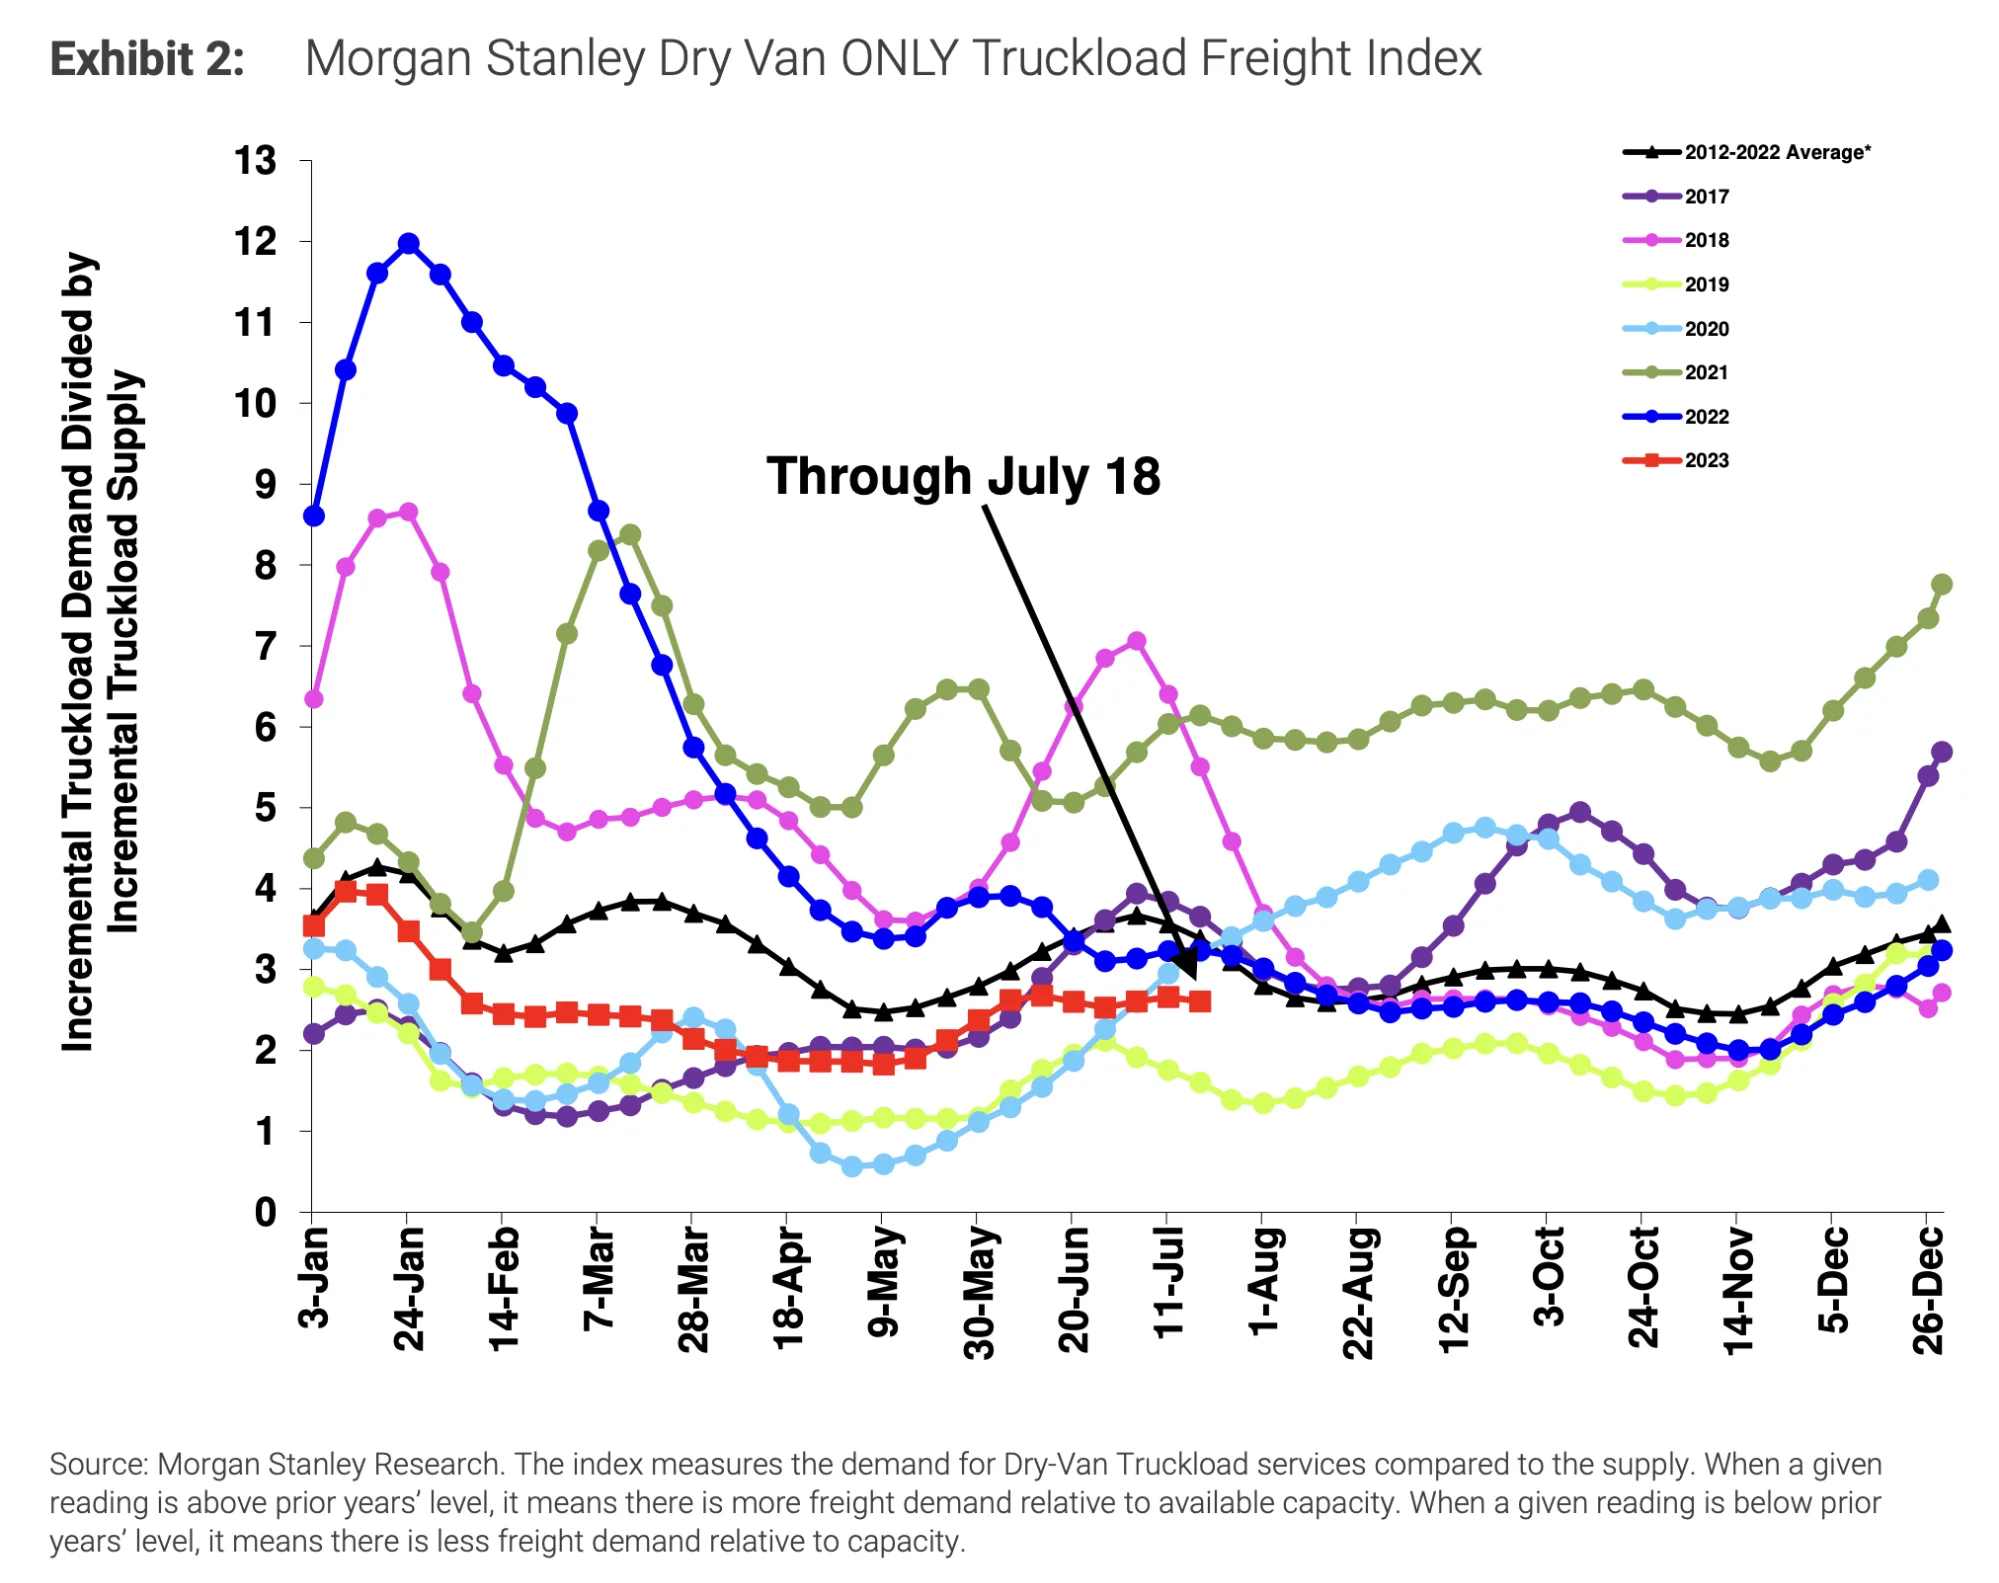 Figure 1: Morgan Stanley Dry Van Truckload Freight Index
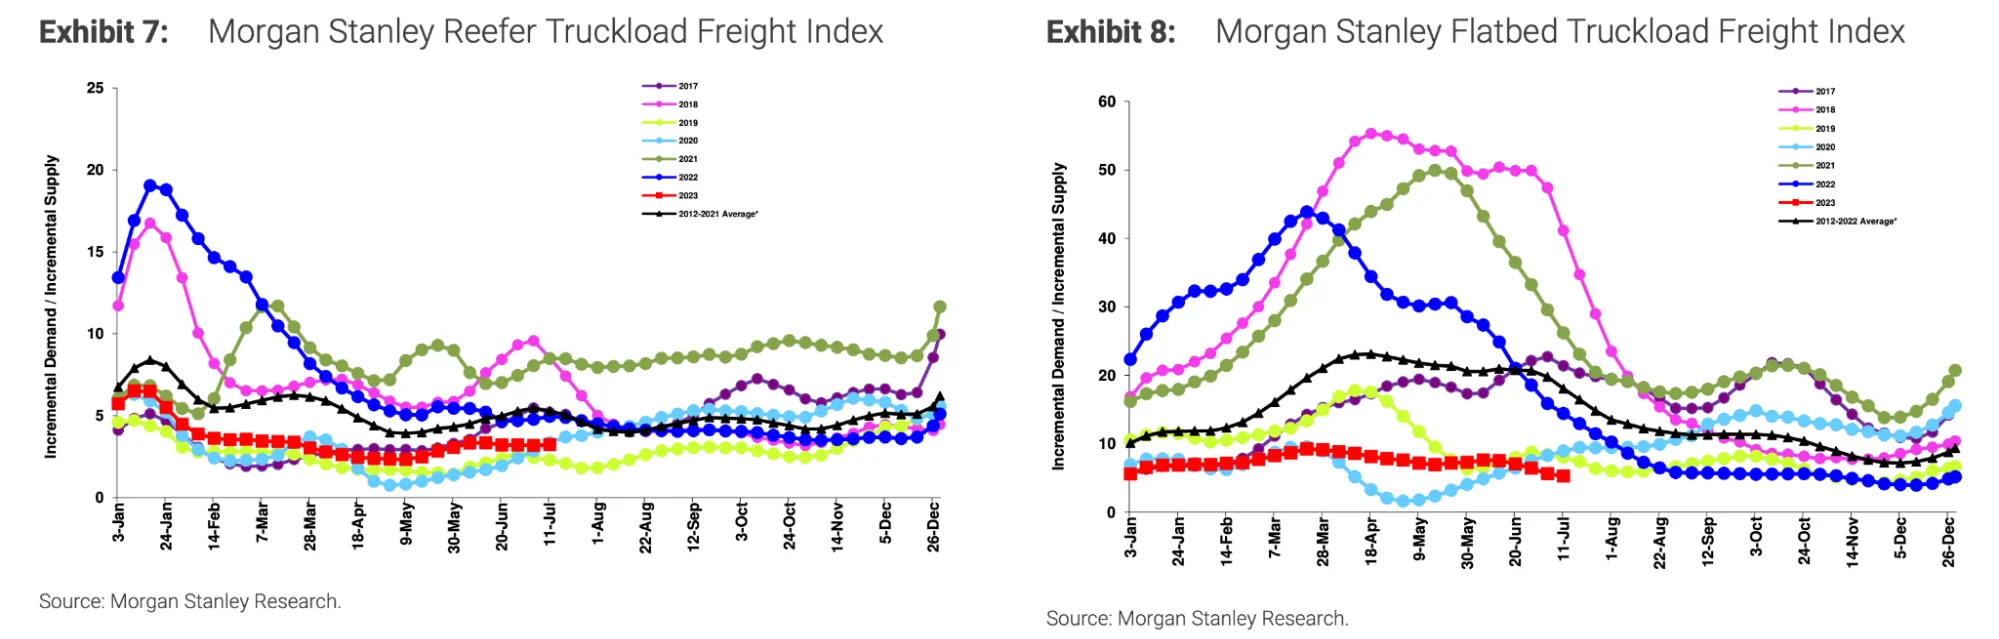 Figures 2 & 3: Morgan Stanley Reefer and Flatbed Truckload Freight Indices
ACT’s For-Hire Index of Supply and Demand represents overall market sentiment. The most recent reading came in at 49.8 for May. Higher freight volumes and tighter capacity conditions were behind the significant month-over-month increase (up from 34.6 in April 2023). However, it was still the 15th consecutive reading indicating loosening conditions, and the highest in 14 months, leading us to believe tighter conditions are on the horizon.
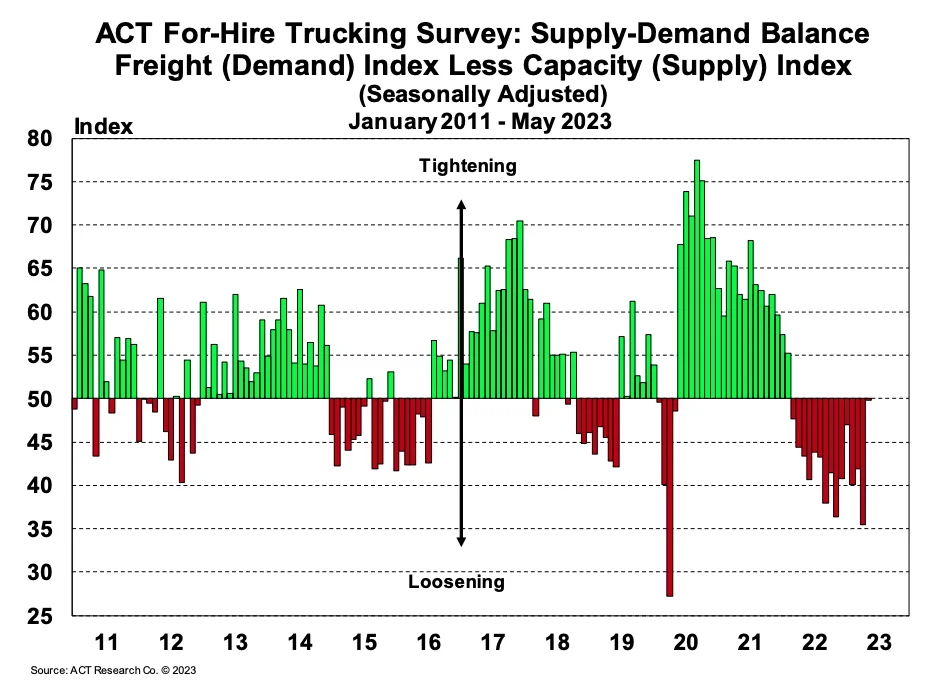 Figure 4: ACT For-Hire Trucking Survey
This year’s summer peak season revealed where the capacity correction cycle stands. As expected, certain pockets and regions experienced some spot rate volatility, but it had little impact on tender acceptance and service for shippers at the national level.
Carriers had good reason to show strong interest in and ability to support current contractual freight demand — rejections are already declining following July Fourth, a sign that conditions should remain soft, barring any unforeseen events.
The Sonar Outbound Tender Reject Index (OTRI) measures the rate at which carriers reject the freight they are contractually required to take. June numbers fluctuated between a low of 2.7% and a high of 3.9%, indicating routing guide compliance on shippers’ contractual freight remained historically high.
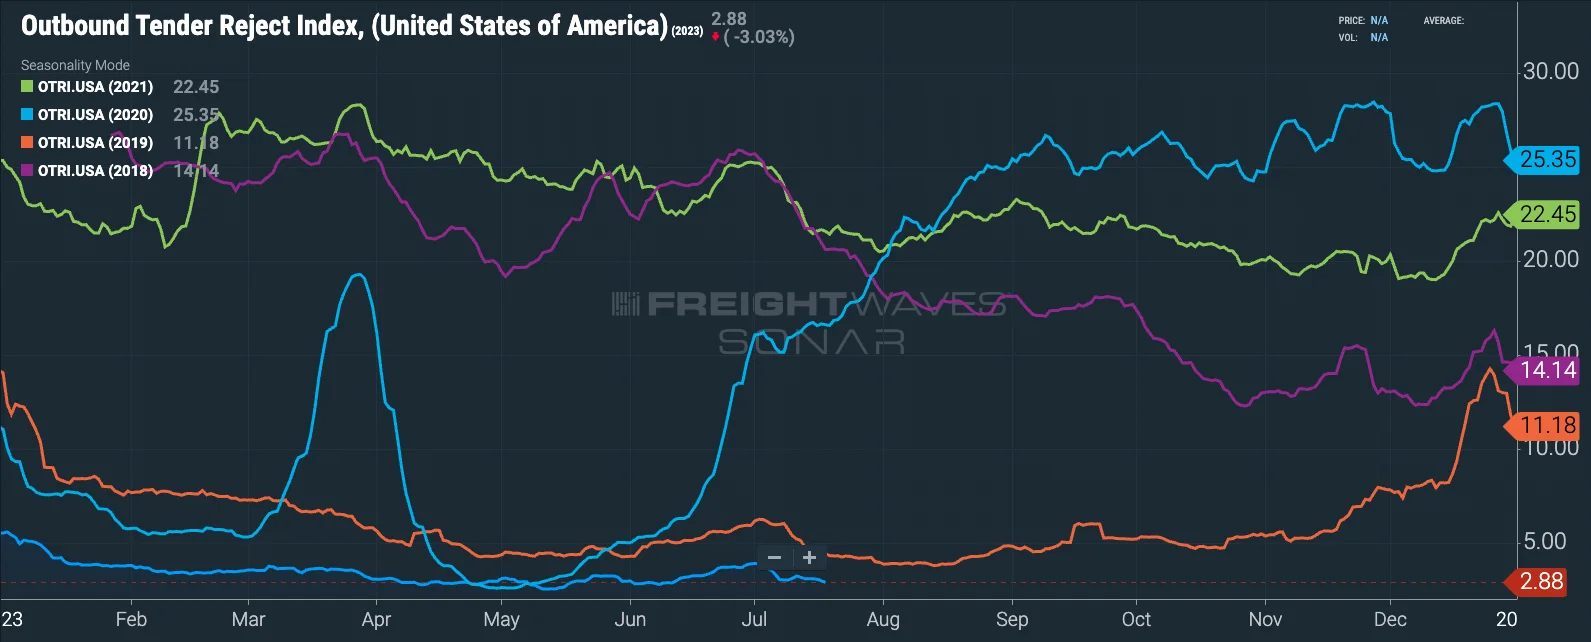 Figure 5: Outbound Tender Reject Index (SONAR)
The FreightWaves SONAR Outbound Tender Volume Index (OTVI), which measures contract tender volumes across all modes, was down 17.4% year-over-year, or 13.6% when measuring accepted volumes after the significant tender rejection rate decline. Accepted volumes were down 4.0% month-over-month, driven by a 6.8% increase in accepted reefer tenders and a 14% decrease in accepted dry van tenders. The accepted contract volume pullback from May is closely in line with declining spot demand and directionally aligned with the shipment slowdown, per Cass.
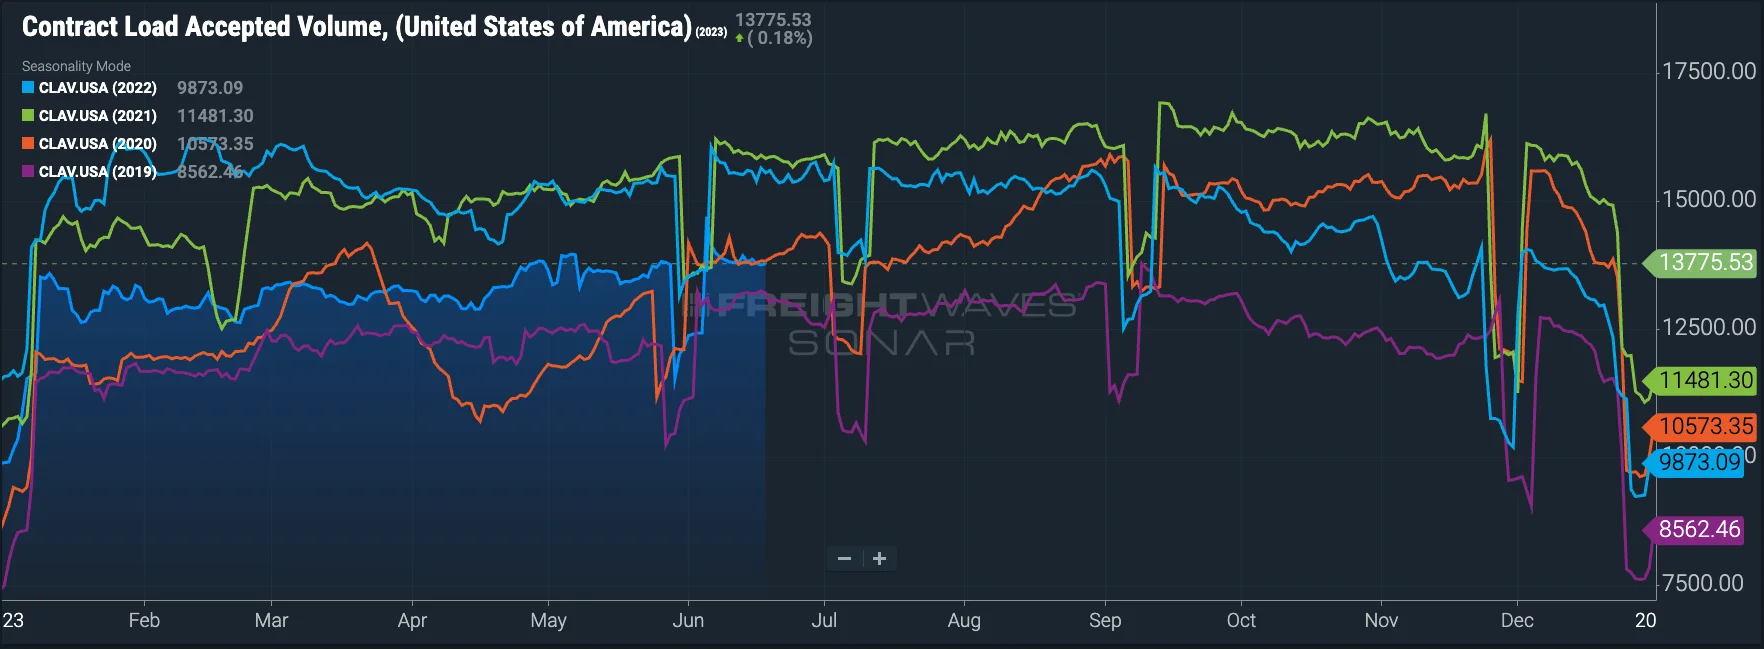 Figure 6: Contract Load Accepted Volume (SONAR)
The DAT Load-to-Truck Ratio measures the total number of loads relative to the total number of trucks posted on their spot board. June data showed tightness despite declining load posts, indicating truck posts were also down. The Dry Van Load-to-Truck Ratio was up 3.4% month-over-month but remains down 33.3% year-over-year, and the Reefer Load-to-Truck Ratio was up 5.7% month-over-month but down 45.6% year-over-year.
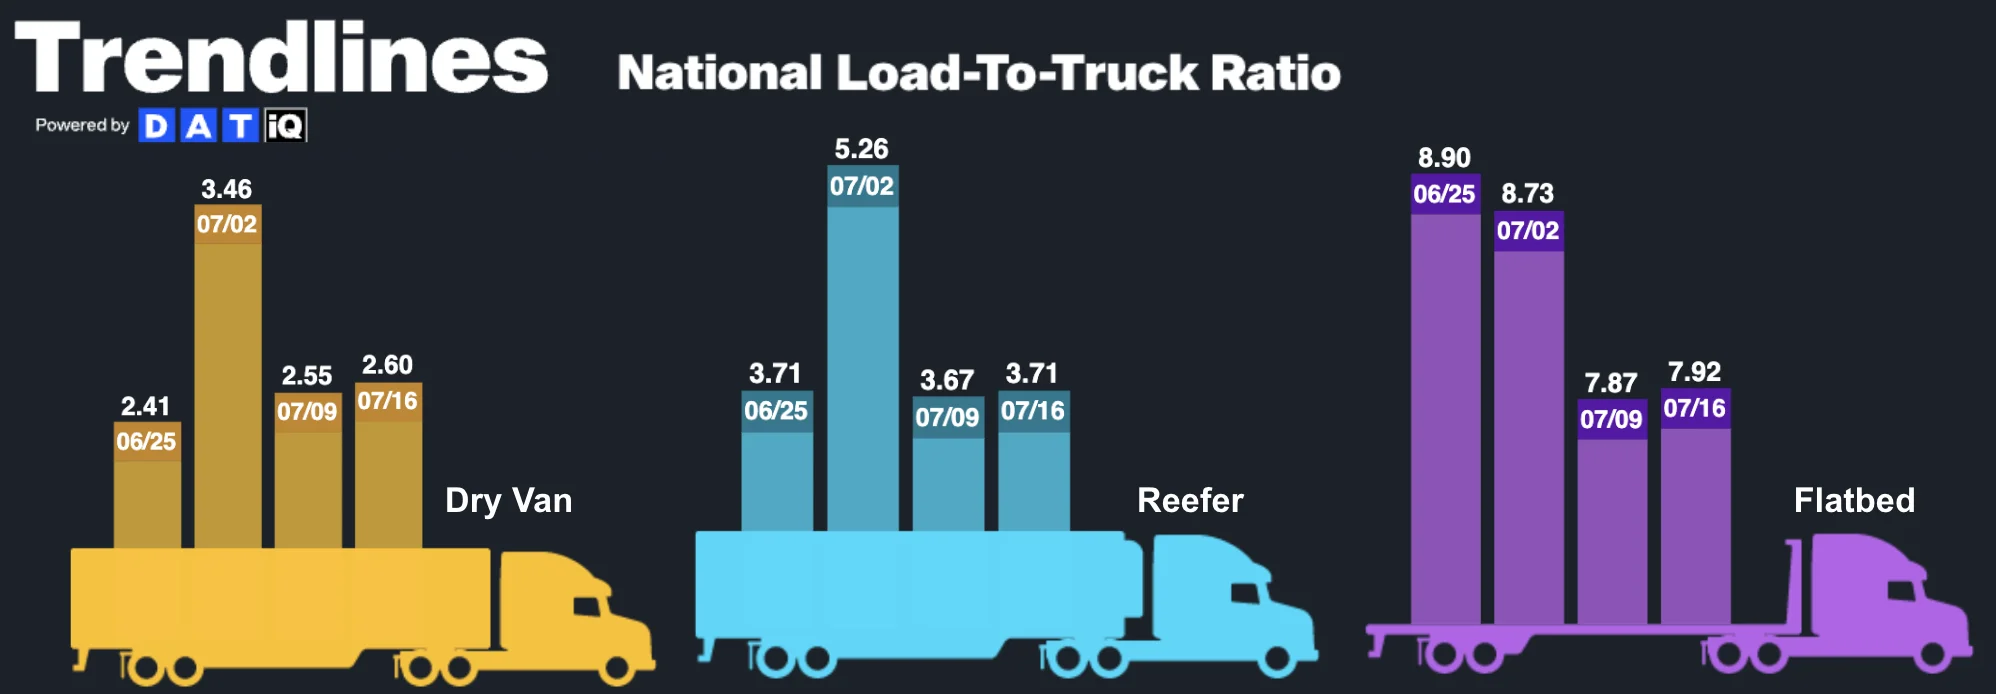 Figure 7: DAT Trendlines, National Load-To-Truck Ratio
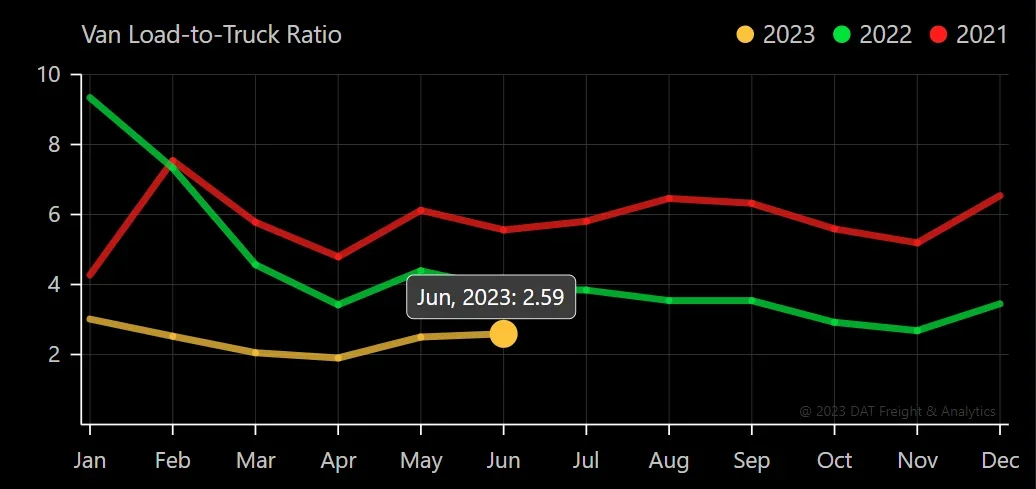 Figure 8: DAT Van Load-To-Truck Ratio
 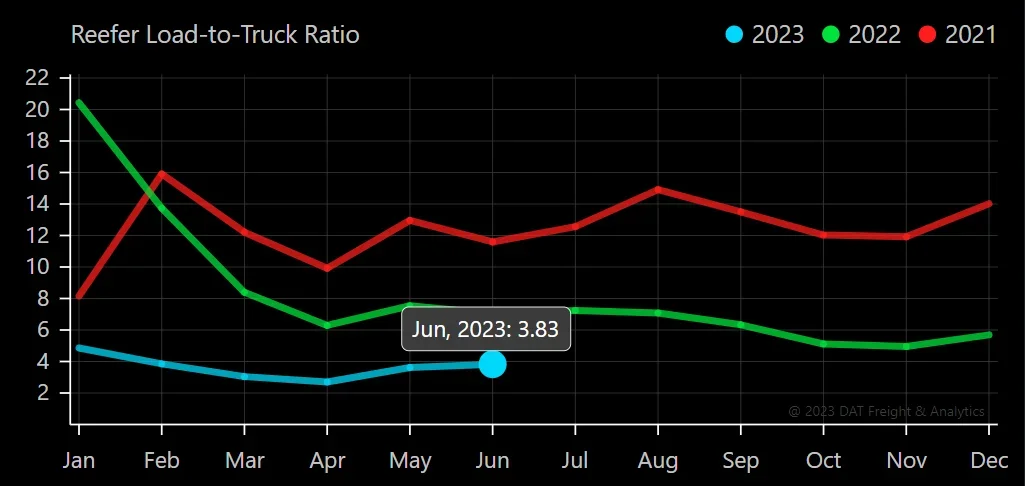 Figure 9: DAT Reefer Load-To-Truck Ratio
A key trend we’re still watching is revocations outpacing new carriers entering the market for eight of the last nine months, reducing the total number of carriers. A significant amount of capacity that entered the market over the last few years remains unutilized, so we expect this disparity to continue for at least the near term.
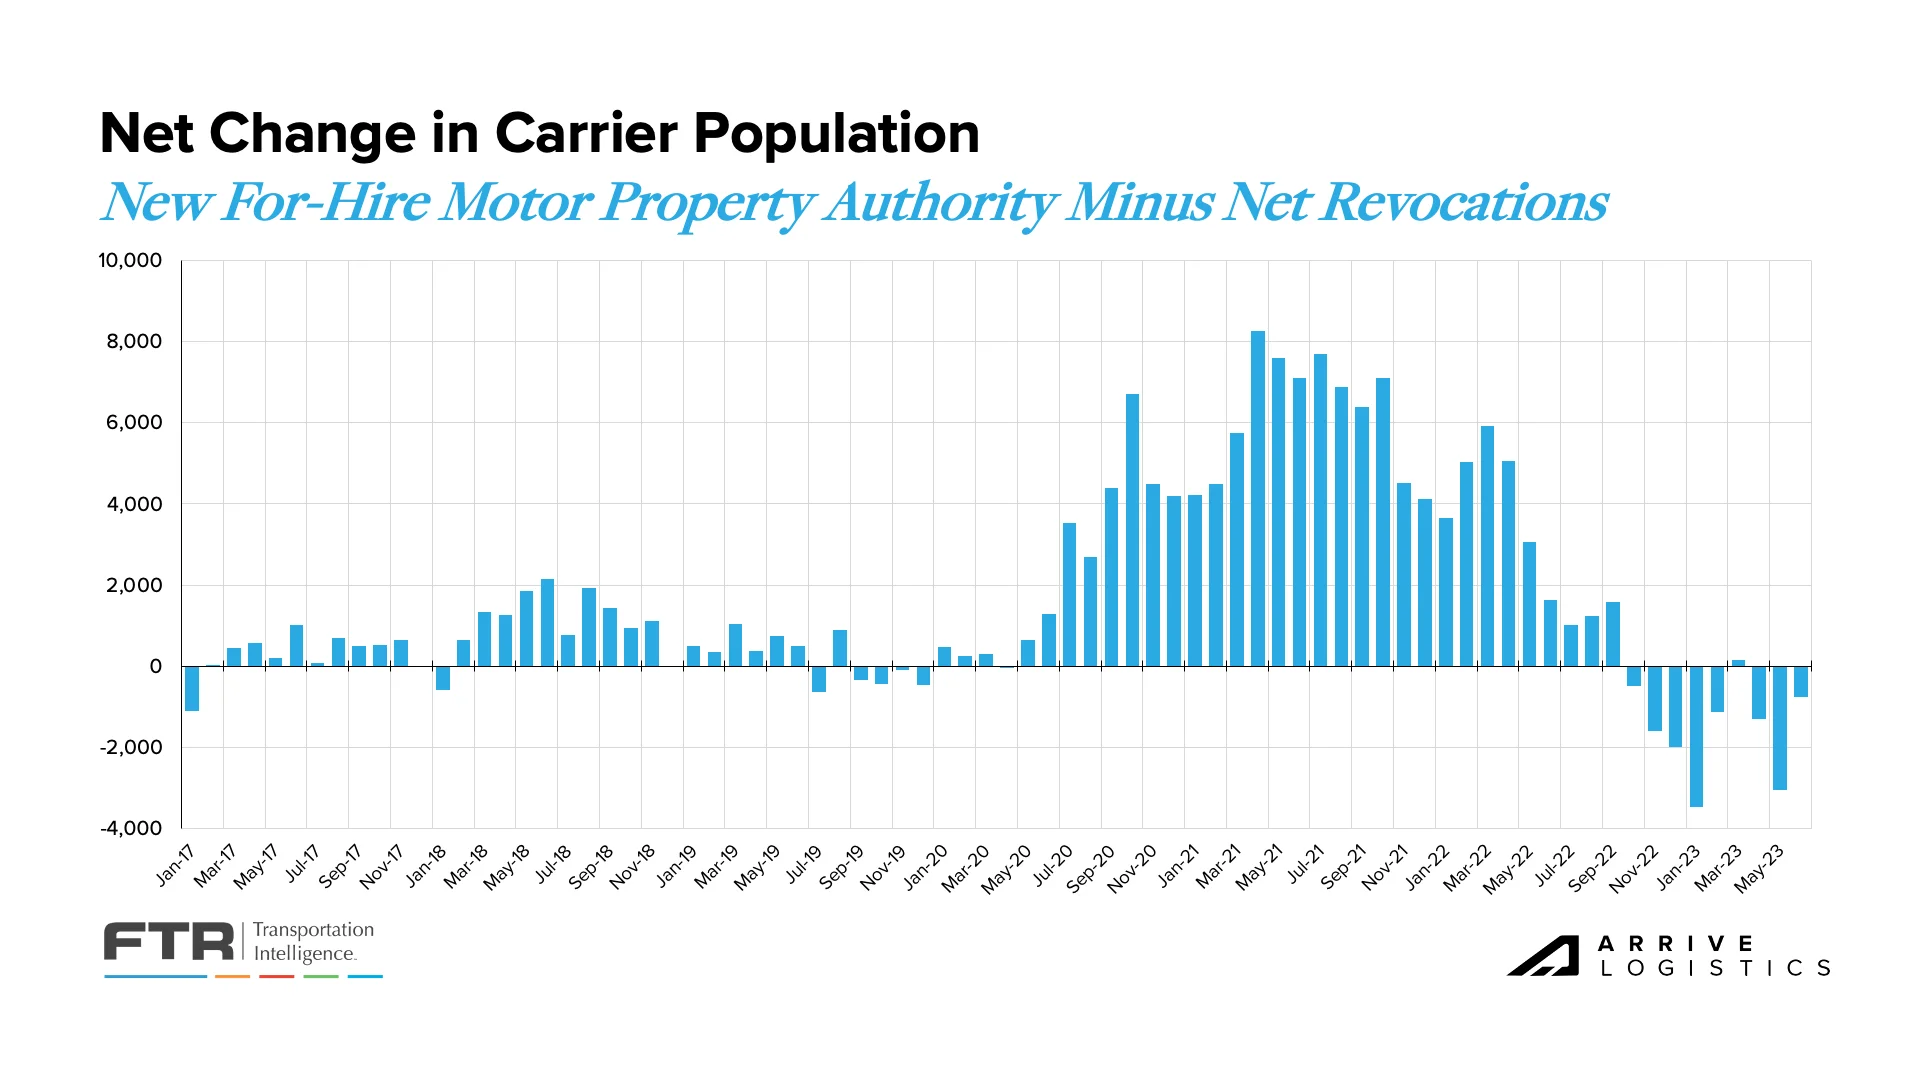 Figure 10: Net Change in Carrier Population: FTR Analysis of FMCSA Data
According to the most recent reading from ACT Research, the Class 8 Tractor backlog fell by about 10,700 units in June, and the overall backlog dropped to approximately 112,500 as production outpaced orders. Likewise, the backlog-to-build ratio fell from 6.9 months in May to 6.3 months in June. A similar month-over-month decline is likely through Q3 and into Q4 as build rates keep improving.
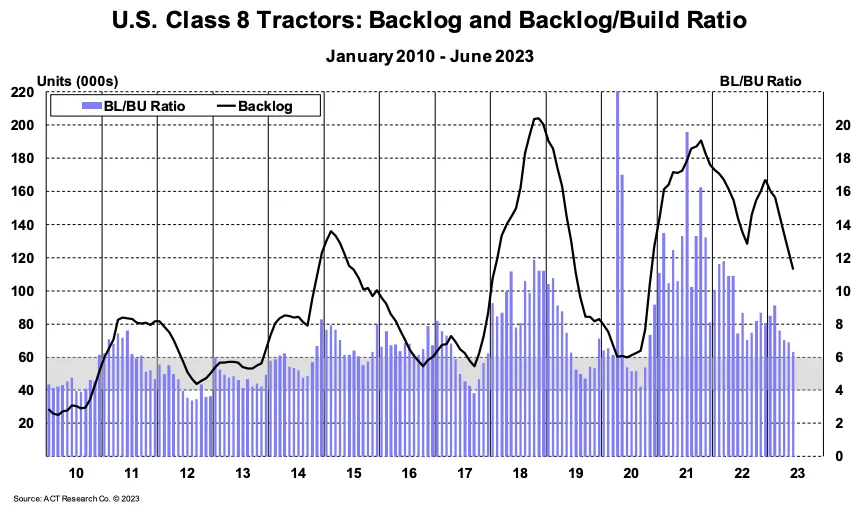 Figure 11: ACT U.S. Class 8 Tractors Backlog
June truck orders exceeded expectations but remained below replacement levels for the third straight month. Historically, orders falling below replacement indicate a soft market, but there is reason to believe this decline is simply the result of full build slots. Regardless, the low order numbers and high production rates should reduce backlogs and wait times for future orders.
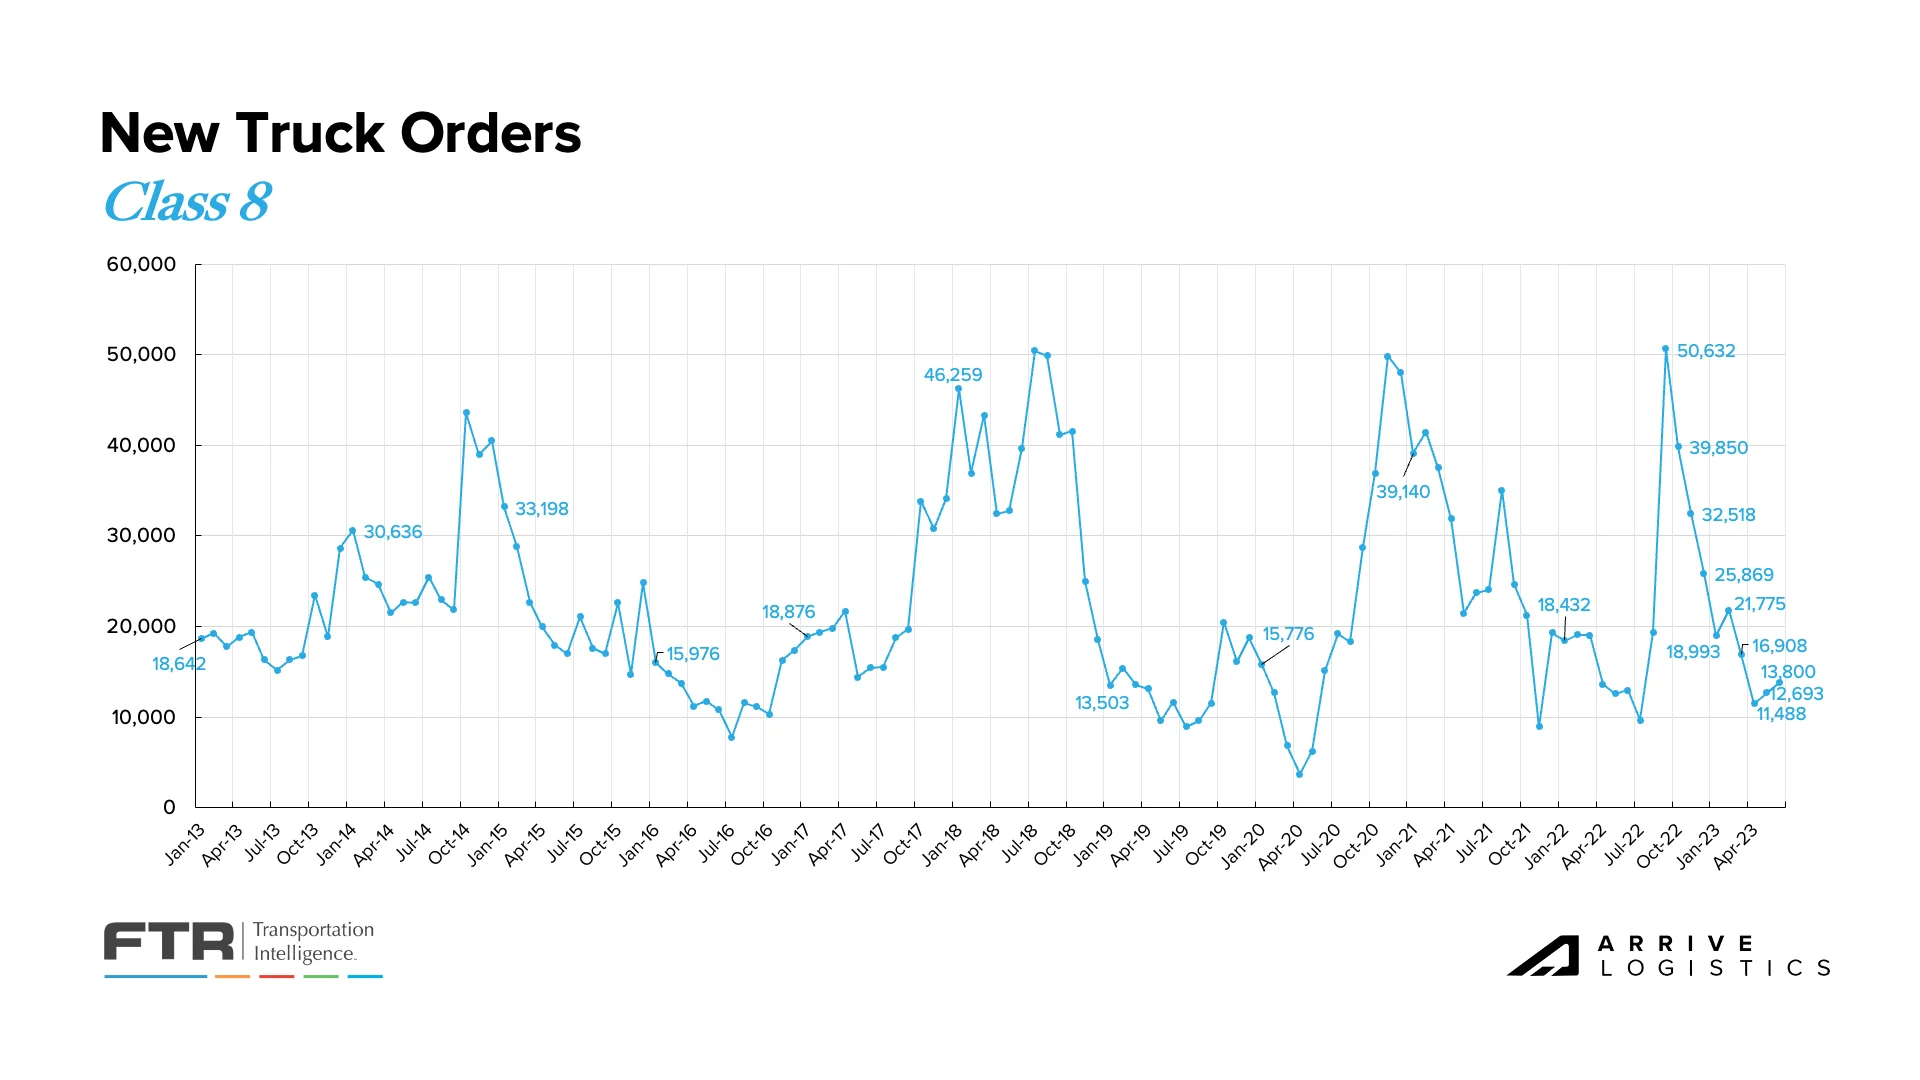 Figure 12: New Class 8 Truck Orders: DataSource: FTR
The ACT For-Hire Capacity Index showed no expansion for the first time in 19 months, dropping 2.6 points from April to land at 50.0 in May. Capacity growth has stabilized as new market entrants are declining and fleets continue to sell off aging equipment. However, it is important to remember that this data primarily consists of larger fleets and may not directly reflect the experience of smaller and mid-sized fleets.
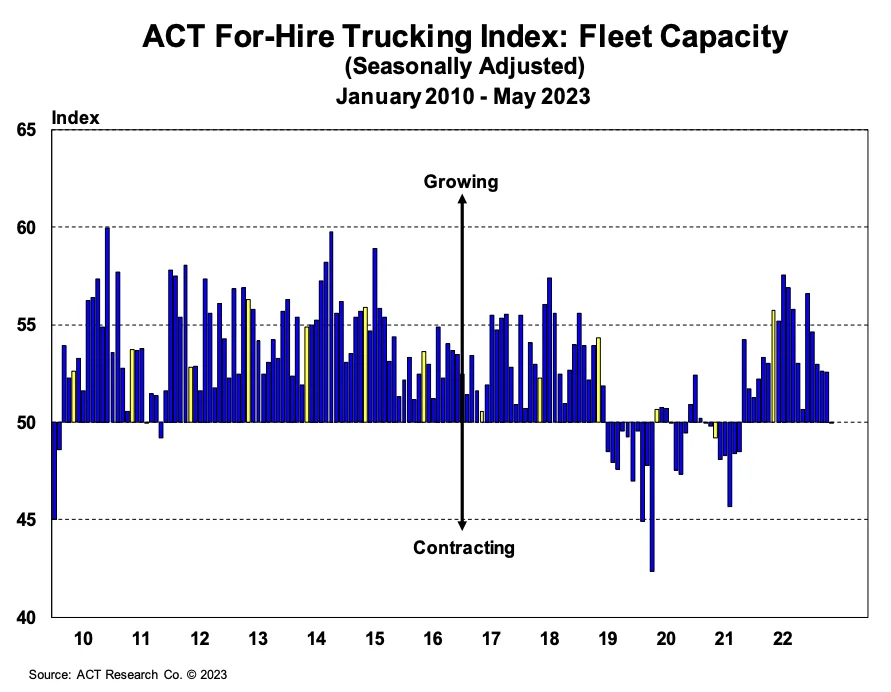 Figure 13: ACT For-Hire Trucking Index: Fleet Capacity
The trucking sector job market declined by 200 jobs month-over-month in June. However, it’s important to note that although total employment is down 1,700 jobs from the high mark in January, we are still above any level recorded in 2022. Given the declining truckload rate environment, the trucking employment plateau observed throughout the first half of 2023 defied expectations. Carriers are clearly focused on retaining drivers, but the longer current conditions persist, the more likely it is that overall employment begins to fall.
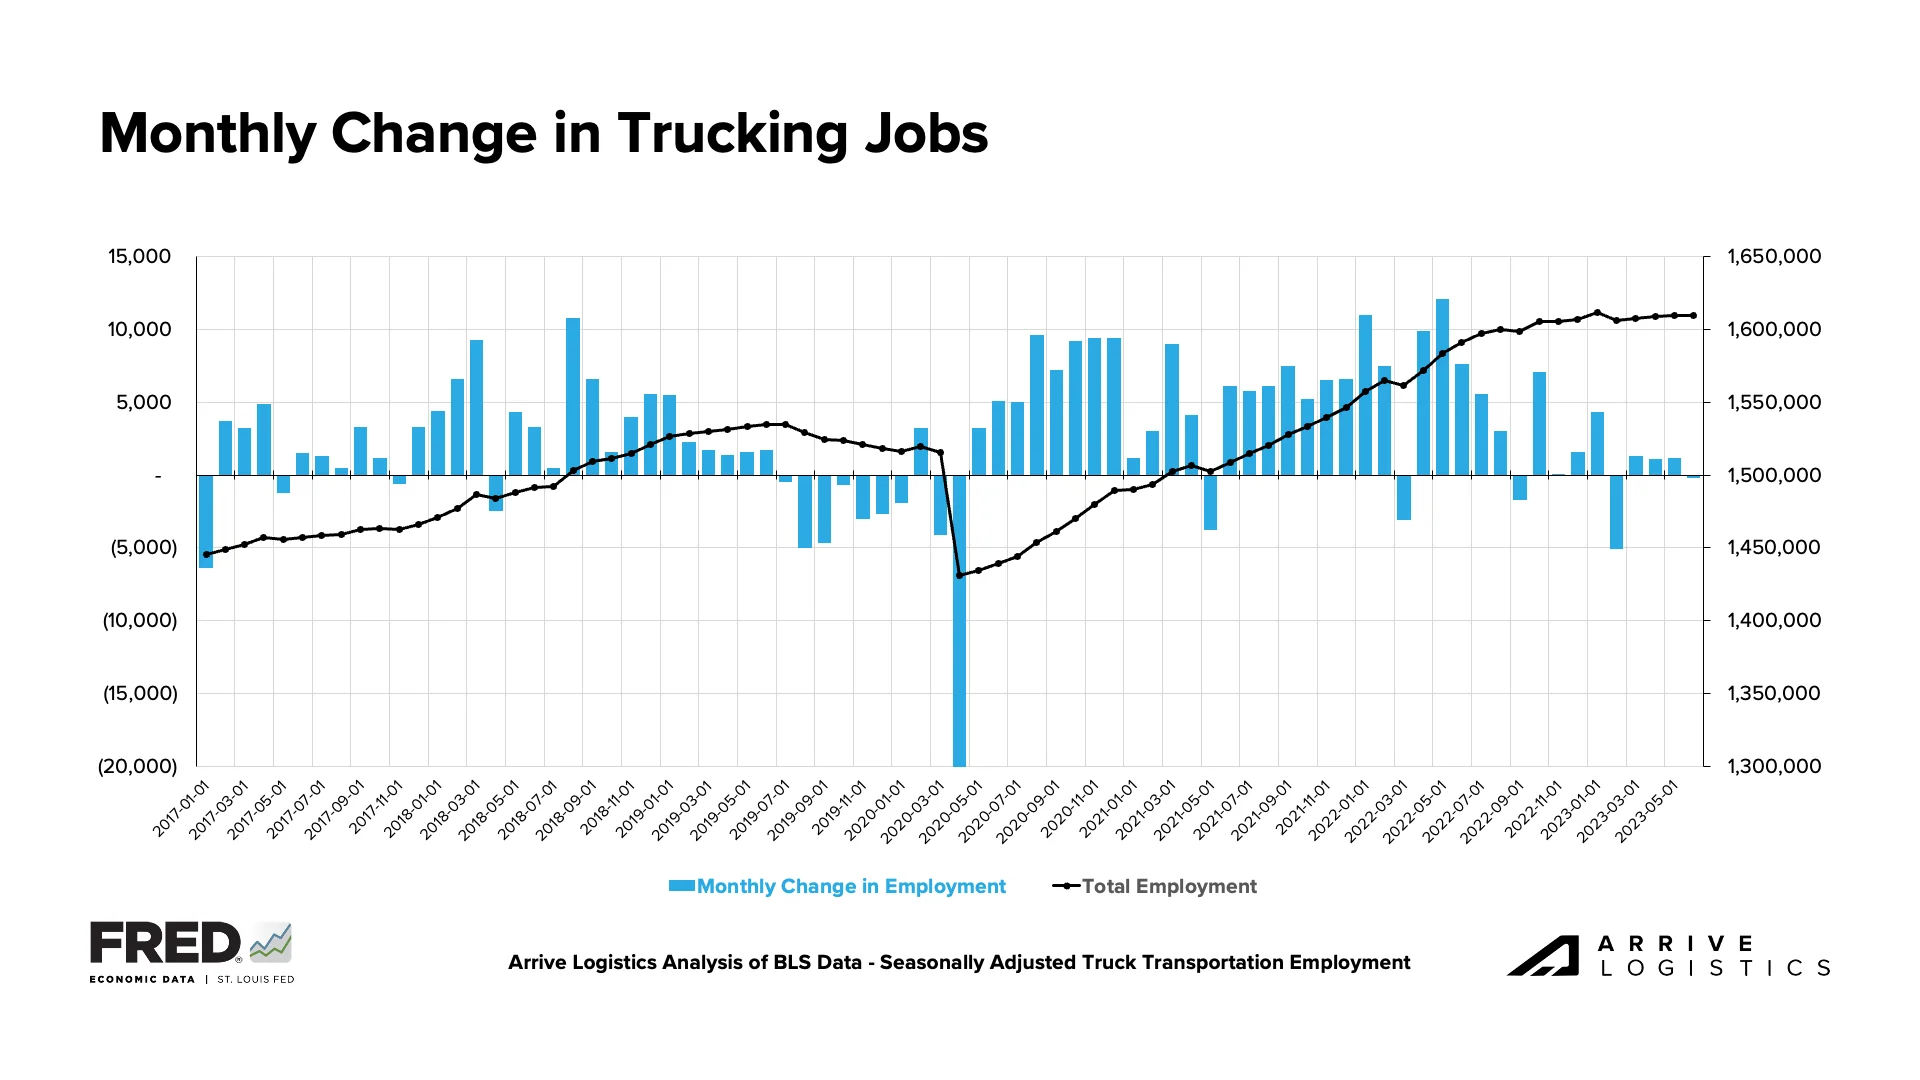 Figure 14: FTR’s Monthly Change in Trucking Jobs
The surge of spot rate opportunities carriers experienced through the summer peak season is likely starting to subside for many. This ebb and flow of rates through normal seasonal cycles reflects how the spot market will likely look through at least early 2024 as the rebalancing of supply and demand continues in the freight market.
As more capacity exits the market, it will become increasingly vulnerable to disruptions. Last month we noted FTR’s Avery Vise’s comments: “During the first five months of 2022,10 for-hire trucking firms with 100 or more trucks lost authority. During the same period in 2023, 31 carriers with 100 or more trucks lost authority.”
While one or two truck operations going under is bad, it is safe to assume that capacity will mostly stay in the market and eventually be absorbed by other firms. However, when a 100-truck operation folds, the impact is much more significant and points to how tough this landscape is for carriers.
In June, high revocation numbers again resulted in a negative net carrier population change, indicating the correction has begun. Strong contract service numbers prove there is still a long way to go, but this trend will inevitably lead to a capacity crunch, as it always does in the market cycle.
Increased operating expenses are the primary culprit causing carriers to close, as overall rates are still high compared with historical (pre-pandemic) levels. This trend continues to drive historically high revocations of authority, with June numbers reaching another top 10 all-time mark for the highest number of carrier exits.
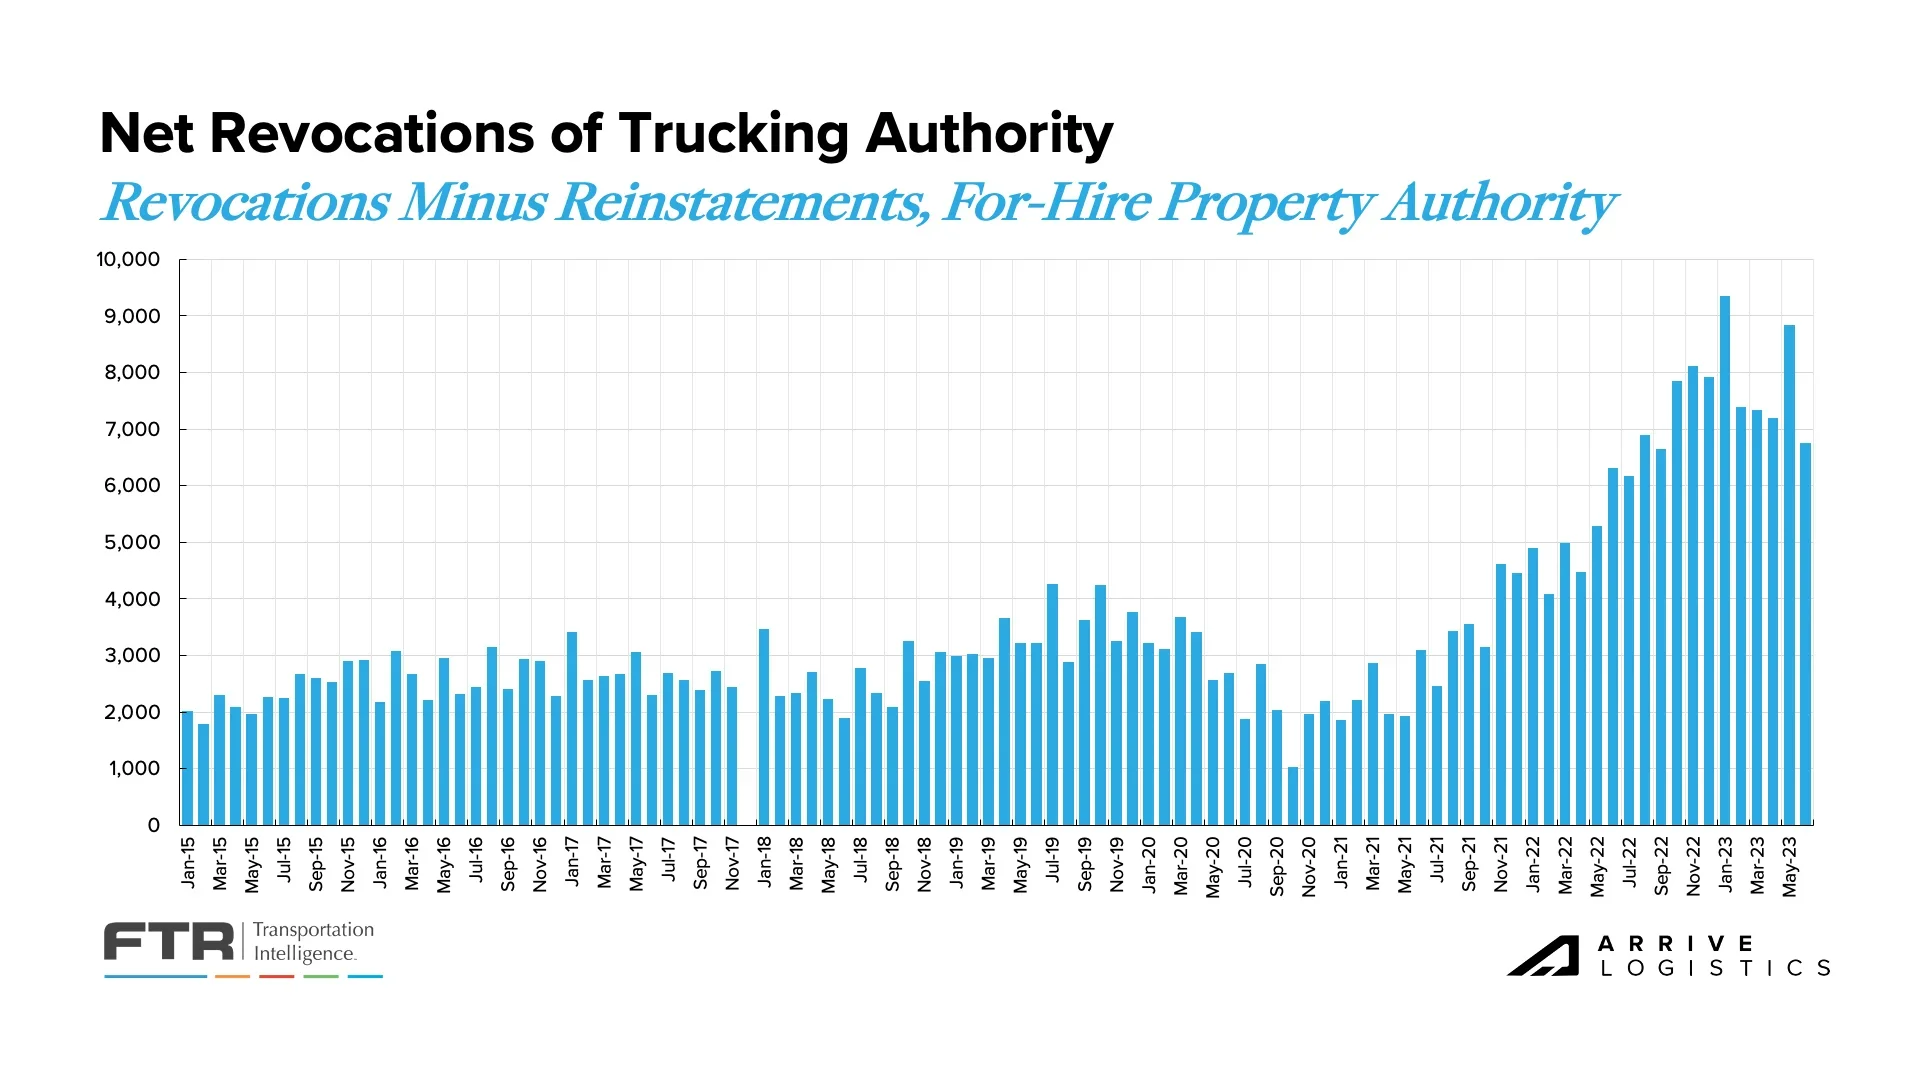 Figure 15: Net Revocations: FTR Analysis of FMCSA Data
ACT’s Driver Availability Index hit a new high of 61.5 in May, marking the 12th consecutive reading above 50. This is now the longest streak in the index’s 5-year history, and the new record indicates that the market remains very loose despite seasonal trends. However, it is important to note that this data mostly accounts for medium and large-sized fleets that may be taking on drivers who left smaller operations. Low spot rates and other conditions will likely keep the driver population under control for the foreseeable future.
We continue to report on retail and manufacturing trends due to their significant impact on domestic freight demand. Recent data showed some encouraging signs for the retail sector, but manufacturing remains a concern after contracting for the eighth consecutive month in June. Although imports have declined significantly from the record-setting levels observed a year ago, forecasts show that year-over-year imports may turn positive by November.
The National Retail Federation (NRF) recently reported that once June numbers are finalized, import cargo volumes at the nation’s major container ports could potentially show a decline of 17.5% through the first half of 2023 compared to the previous year. The Q3 forecast shows a year-over-year decline of just 8.5%, highlighting the steady improvement in year-over-year comps. The NRF pointed to the continued strength of the consumer and progress with inventory destocking as reasons for the optimism around future growth.
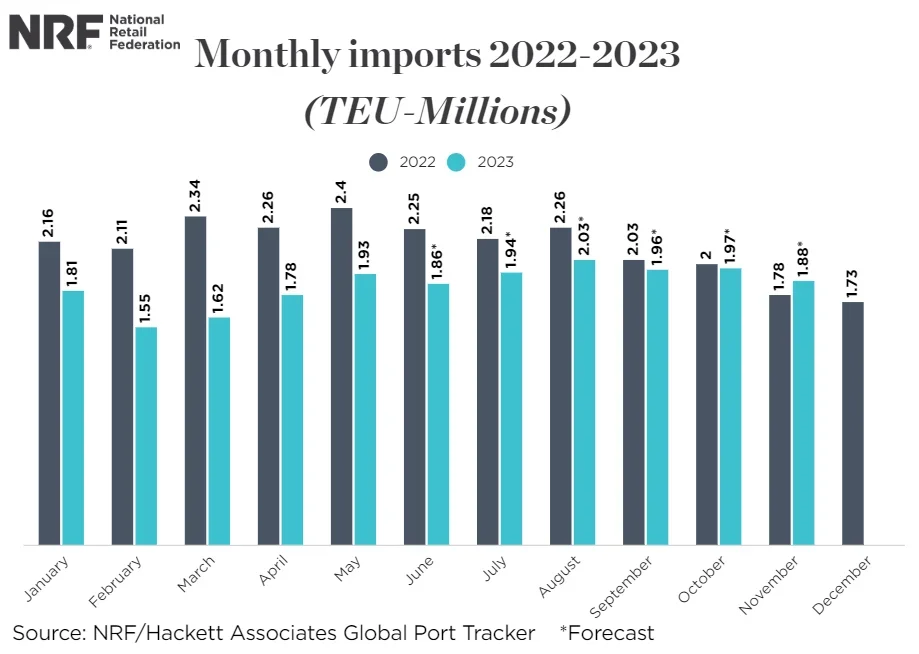 Figure 17: NRF Monthly Imports
The contract versus spot market story stayed mostly consistent in May and June. Shippers still heavily favored contractual freight, and spot posts contracted by over 6.1% month-over-month. Rather stagnant volumes coupled with abundant capacity indicate that spot posts will likely remain well below 2022 levels for the near future.
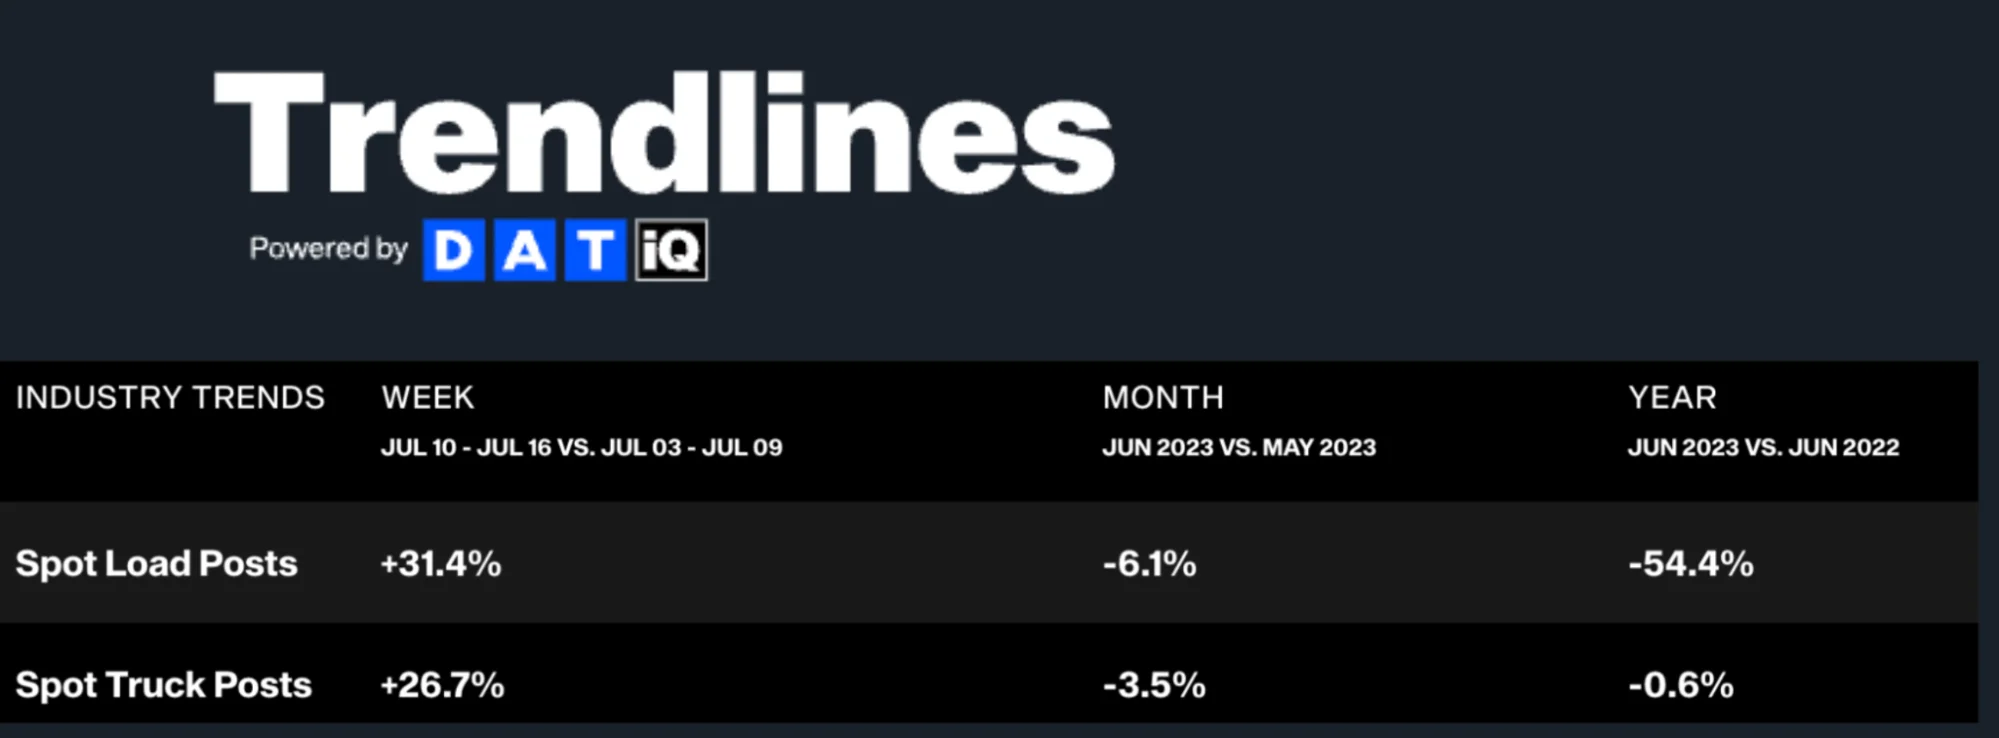 Figure 18: DAT Trendlines
Spot rates continue to stabilize but remain well below operating costs for public carriers, leading to the third straight quarter in which public carriers are seeing negative margins on spot loads. This trend is likely to affect owner-operators and carriers with high spot exposure, potentially leading them to close their business or join larger fleets. Historically we would see a quick rise in spot rates when this occurs. However, capacity remains high despite this trend, indicating that conditions could remain rough in the near future.
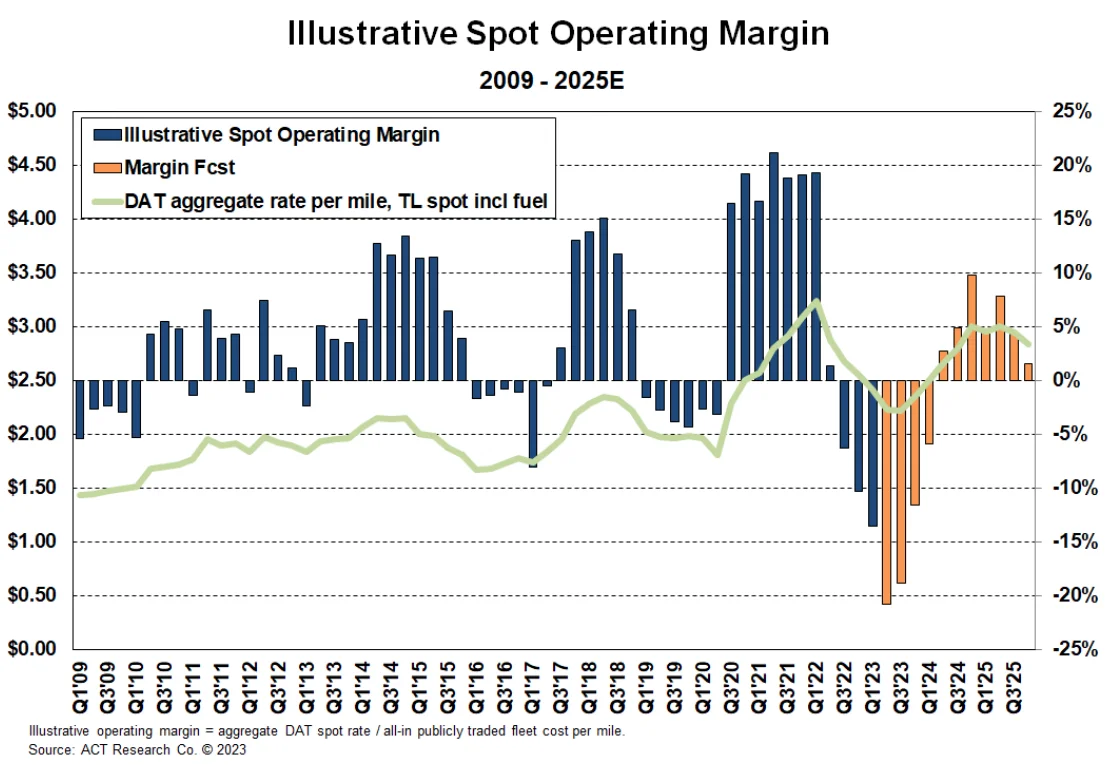 Figure 19: ACT Illustrative Spot Operating Margin
When looking at the full scope of public carriers’ businesses, 2022 margins were strong but notably down from the last two years. As rates fall further in 2023, the revenue per mile and cost per mile gap will continue to shrink, meaning margins for large carriers might also drop. However, fuel prices continue to decline, which ultimately decreases costs and could help support margins for all carriers.
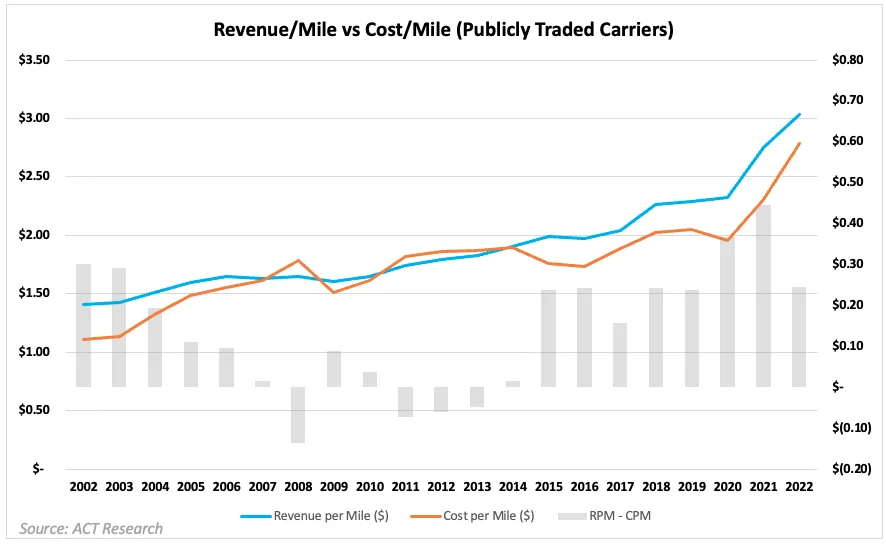 Figure 20: ACT Revenue/Mile vs. Cost/Mile (Publicly Traded Carriers)
July MTD data for spot and contract rates was relatively flat month-over-month. Spot linehaul rates held relatively steady at $1.65 per mile, while contract linehaul rates dropped by $0.01 to $2.14 per mile. In turn, the rate spread closed by $0.01 to land at $0.49. Downward pressure on contract rates should continue for the foreseeable future, even if the market experiences seasonal pressures.
Dry van rates are still well below last year’s levels. All-in spot rates are down 15.1% year-over-year to $2.08 per mile. The contract side shows a similar story, with all-in rates down 16.0% year-over-year to $2.57 per mile.
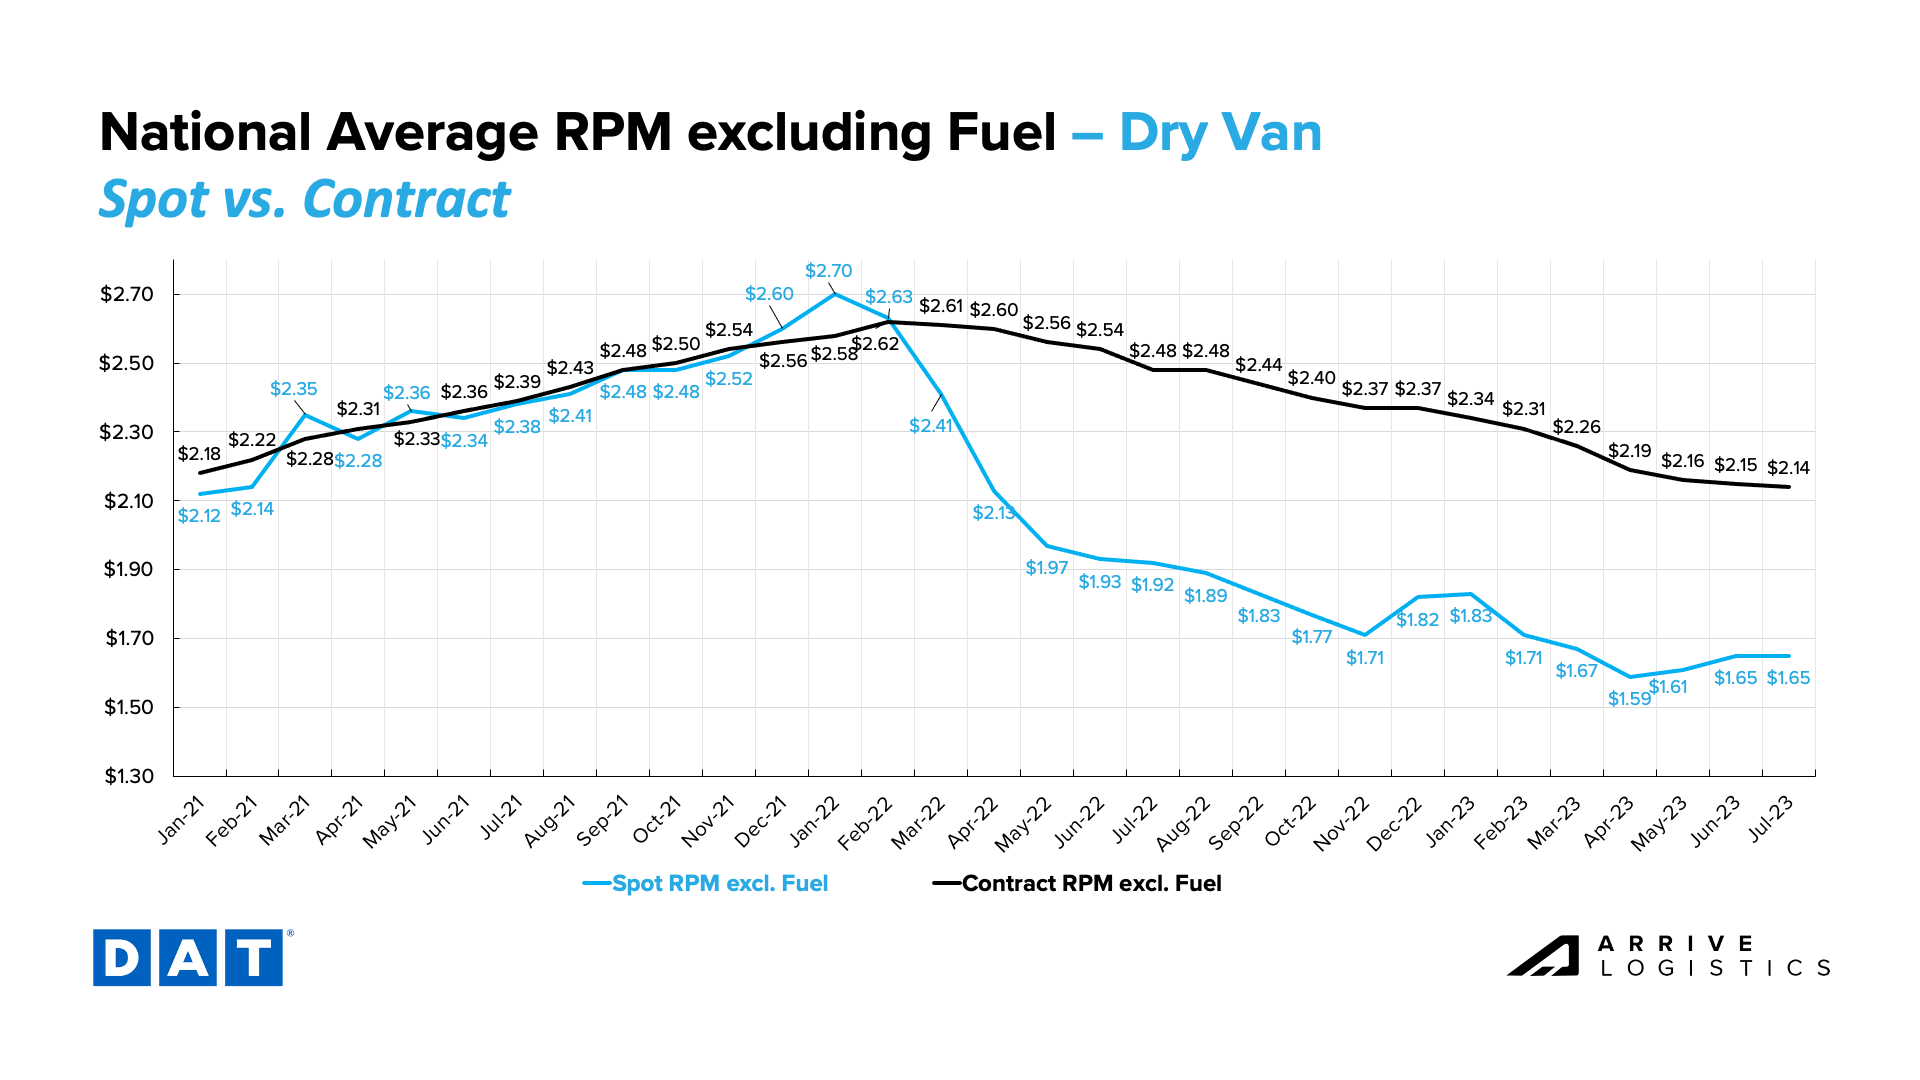 Figure 21: DAT Dry Van National Average RPM Spot vs. Contract
Some areas of the country are still experiencing rate volatility. Weekly spot linehaul data from DAT showed that Billings, MT and Missoula, MT, were among the top five week-over-week movers, with rates increasing by $0.24 per mile and $0.14 per mile, respectively. The largest outbound rate percentage increase was in Medford, OR, where rates jumped 23%, or $0.34 per mile.
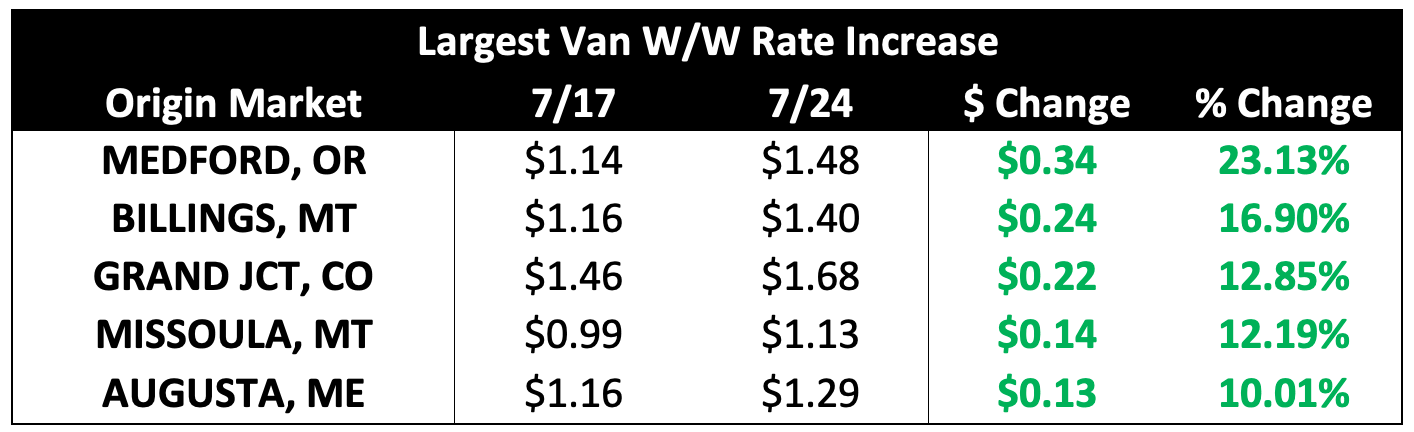 Figure 22: Largest Van W/W Rate Increases
Some markets also experienced sizable week-over-week dry van rate declines. Week-over-week rates dropped by over 10% in Cape Girardeau, MO, Savannah, GA, and San Antonio, TX, and $0.18 per mile and $0.16 per mile in Fargo, ND and Reno, NV, respectively.
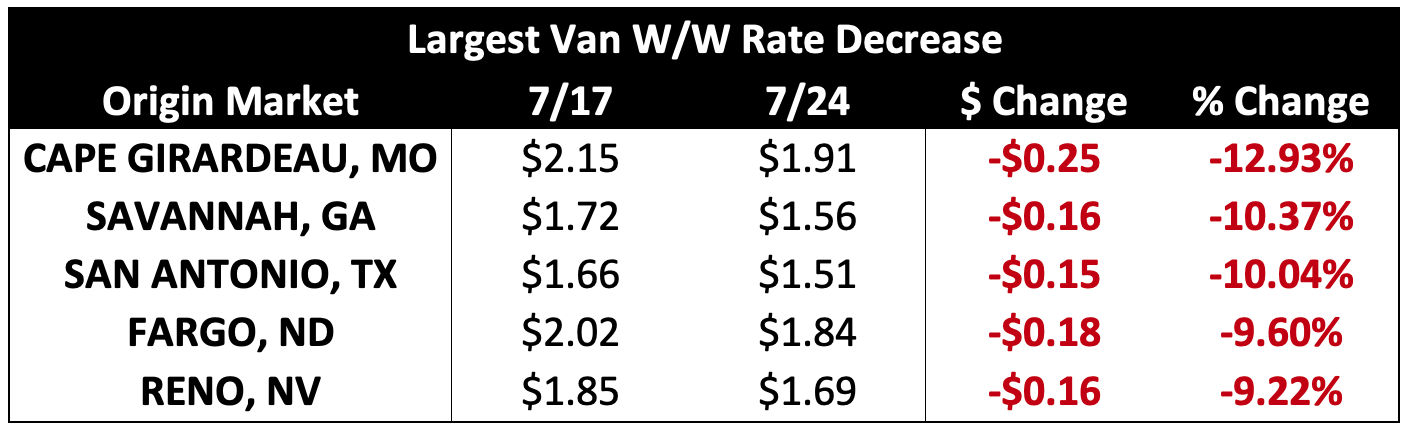 Figure 23: Largest Van W/W Rate Decreases
Reefer linehaul spot and contract rates both dropped month-over-month. Spot declined by 2.5% to $1.97 per mile, excluding fuel, and contract declined by 1.2%, with linehaul rates landing at $2.40 per mile. Linehaul spot and contract rates remain well below where they were last year, down 11.3% and 11.8%, respectively.
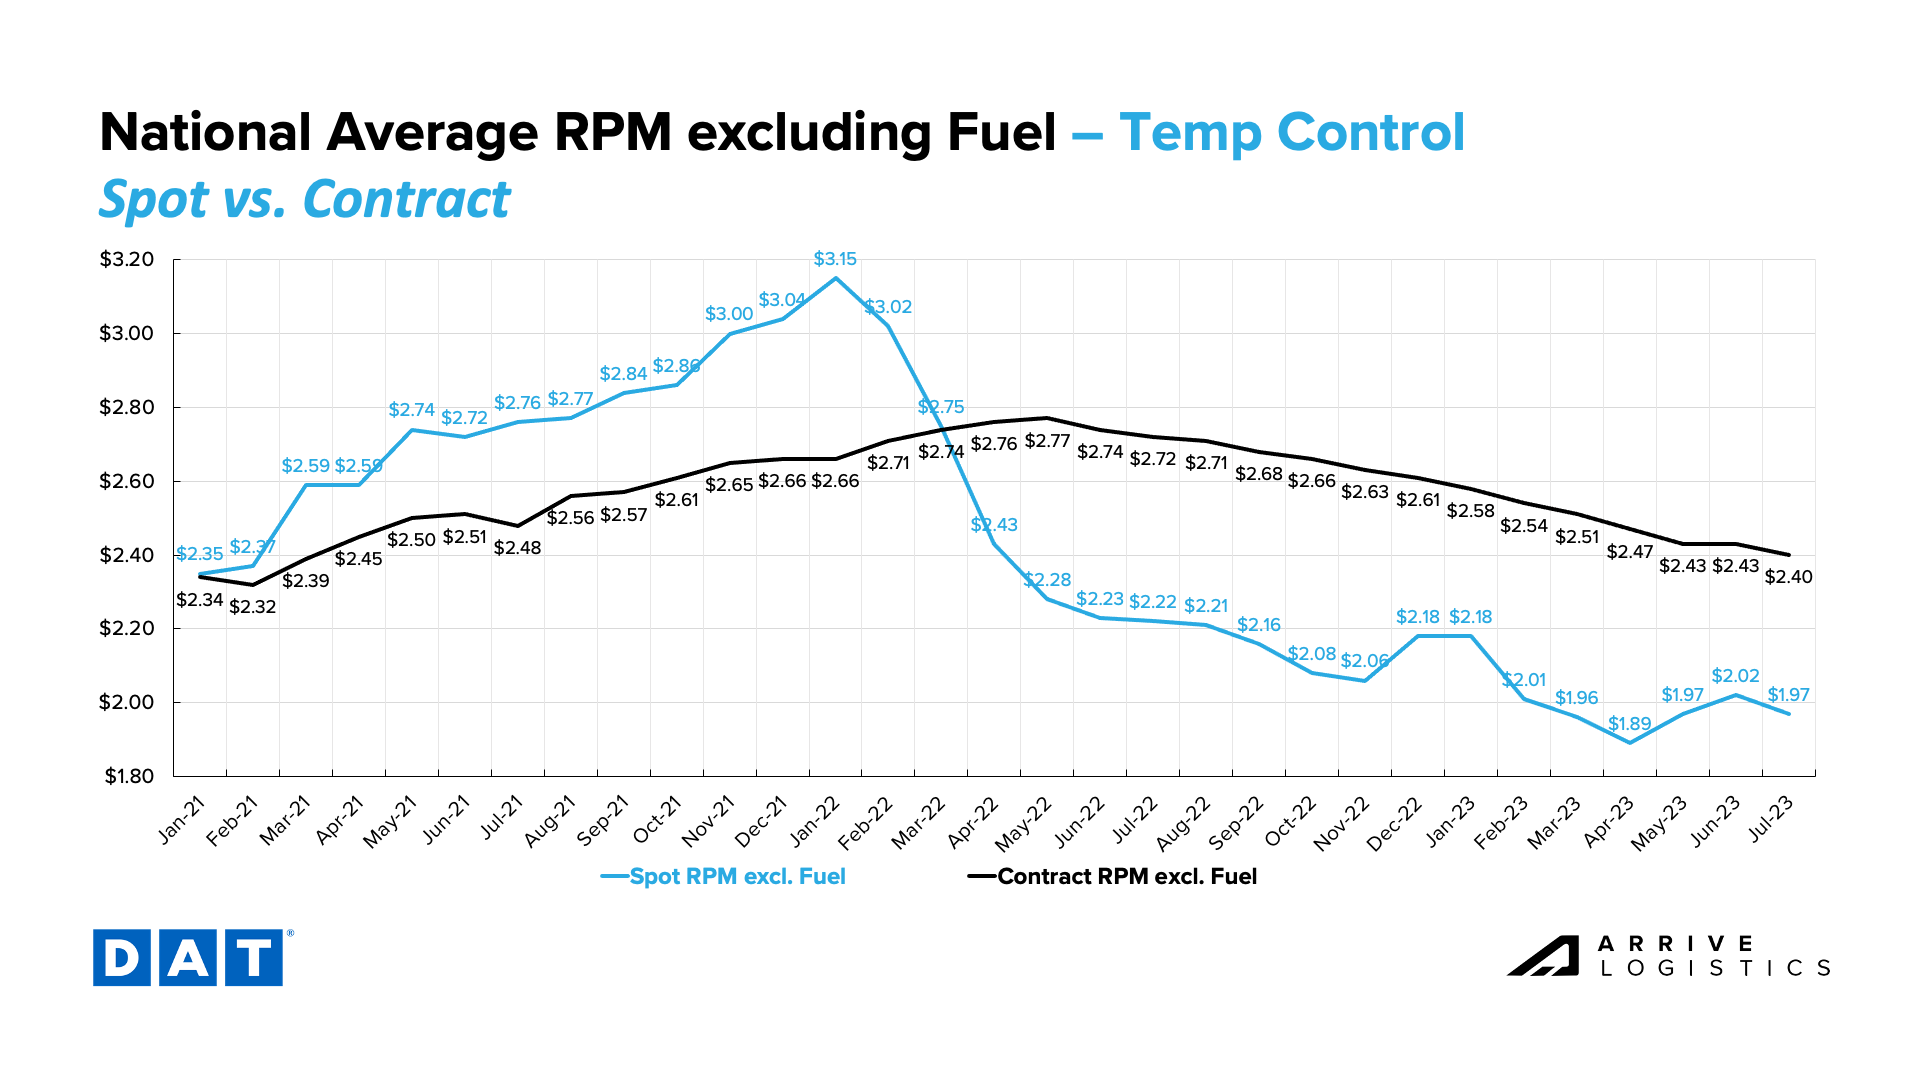 Figure 24: DAT Temp Control National Average RPM Spot vs. Contract
As expected, reefer rates have been more volatile than dry van rates due to freight type and seasonality. Over the past week, reefer rates out of Bristol, NH, experienced a $0.69 per mile increase. Pittsburgh, PA and Macon, GA, also had large rate increases, with outbound linehaul rates increasing by $0.72 per mile and $0.64 per mile, respectively.
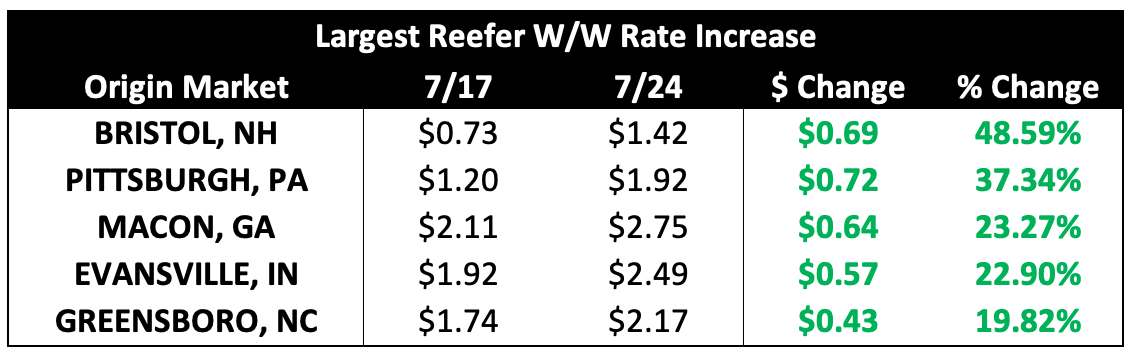 Figure 25: Largest Reefer W/W Rate Increases
Conversely, reefer rates fell in several markets, declining by 45% in Brooklyn, NY, and nearly 25% in Knoxville, TN and Amarillo, TX. Reefer rates out of San Antonio, TX, also declined by $0.33 per mile, and dry van rates followed suit with a sizeable decrease, possibly indicating loosening conditions in Central Texas.
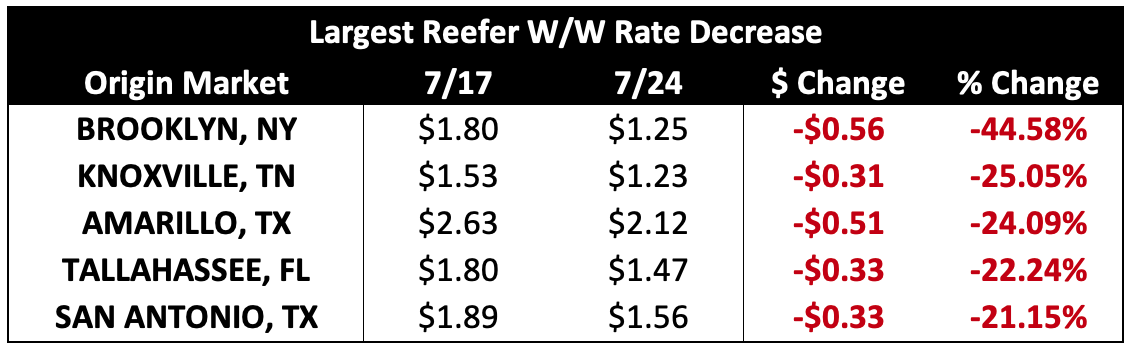 Figure 26: Largest Reefer W/W Rate Decreases
Flatbed rates told a different story. All-in spot rates so far in July have dropped $0.06 to $2.54 per mile. However, all-in contract rates rose by $0.05 to $3.23 per mile.
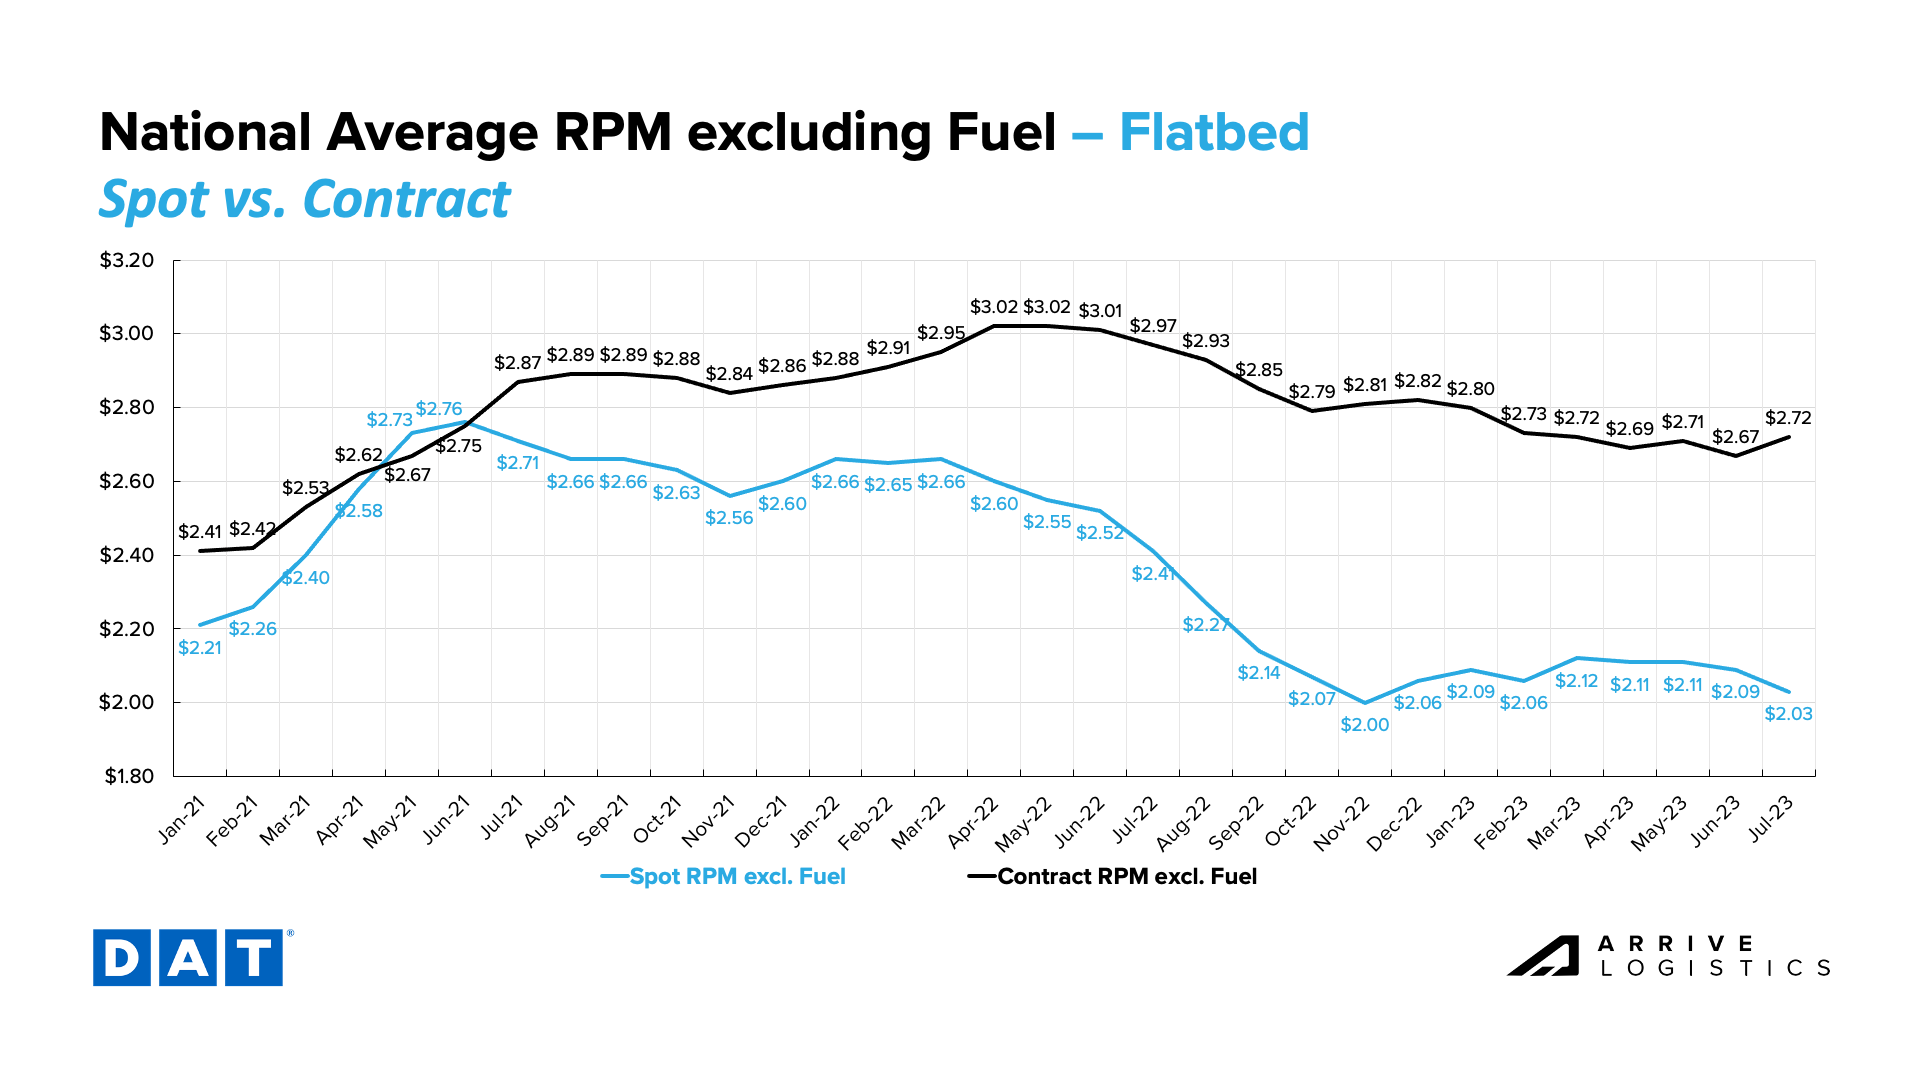 Figure 27: DAT Flatbed National Average RPM Spot vs. Contract
June CPI data showed inflation slowed for the twelfth consecutive month, falling to 3.0% year-over-year growth (4.8% excluding food and energy). Both of these figures came in below expectations, which is good news for consumers as it means the Fed will have more to think about ahead of their meetings in late July. The consensus ahead of the data release was that they would raise interest rates, but now we are seeing some indication that the pause in rate hikes could be extended. Ultimately, slowing or reversing course on rate hikes positively affects future freight demand.
Fuel prices continue to drop, a sharp contrast from this time last year. The national diesel average has consistently declined over the past four months and now sits at $3.815 per gallon. As global crude oil prices fall, fuel prices will continue to experience slight declines in the near future.
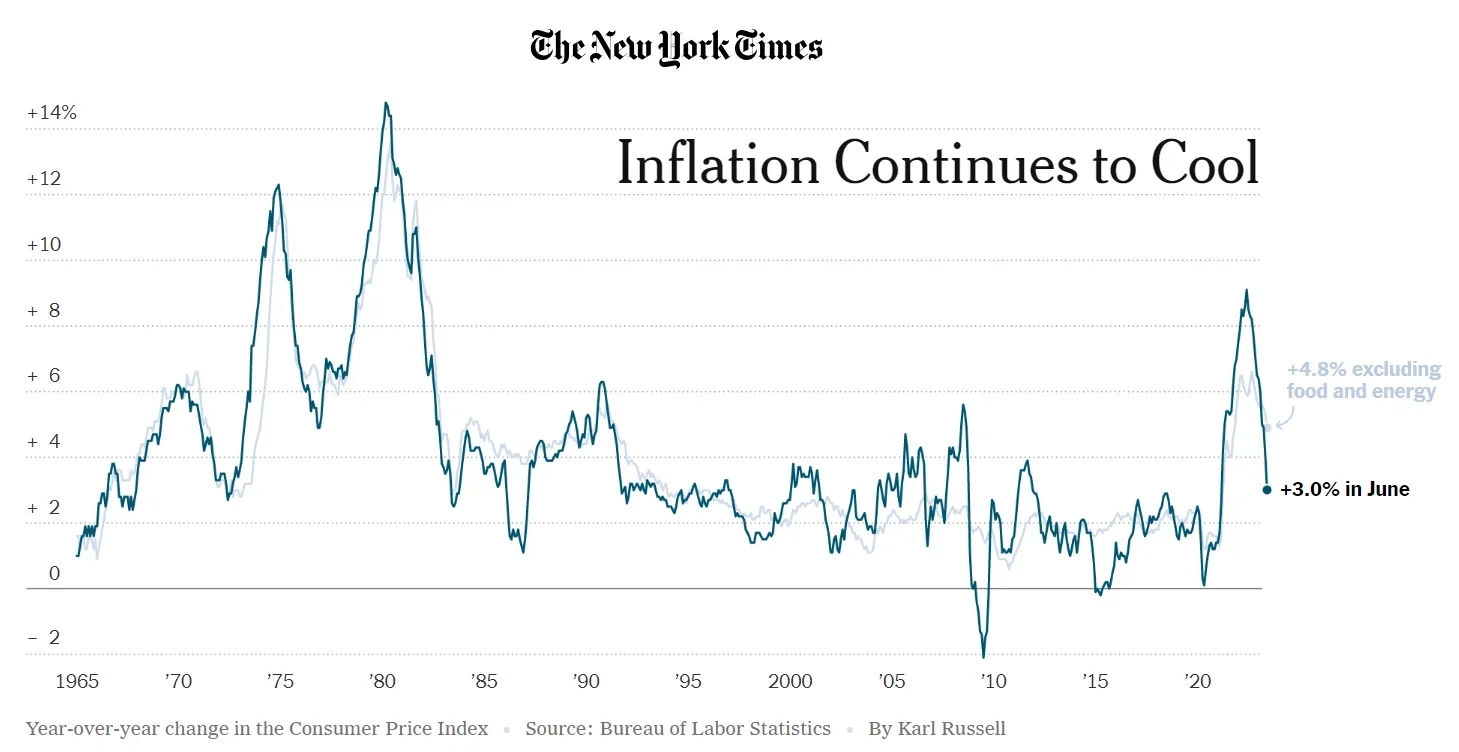 Figure 28: New York Times Inflation Data
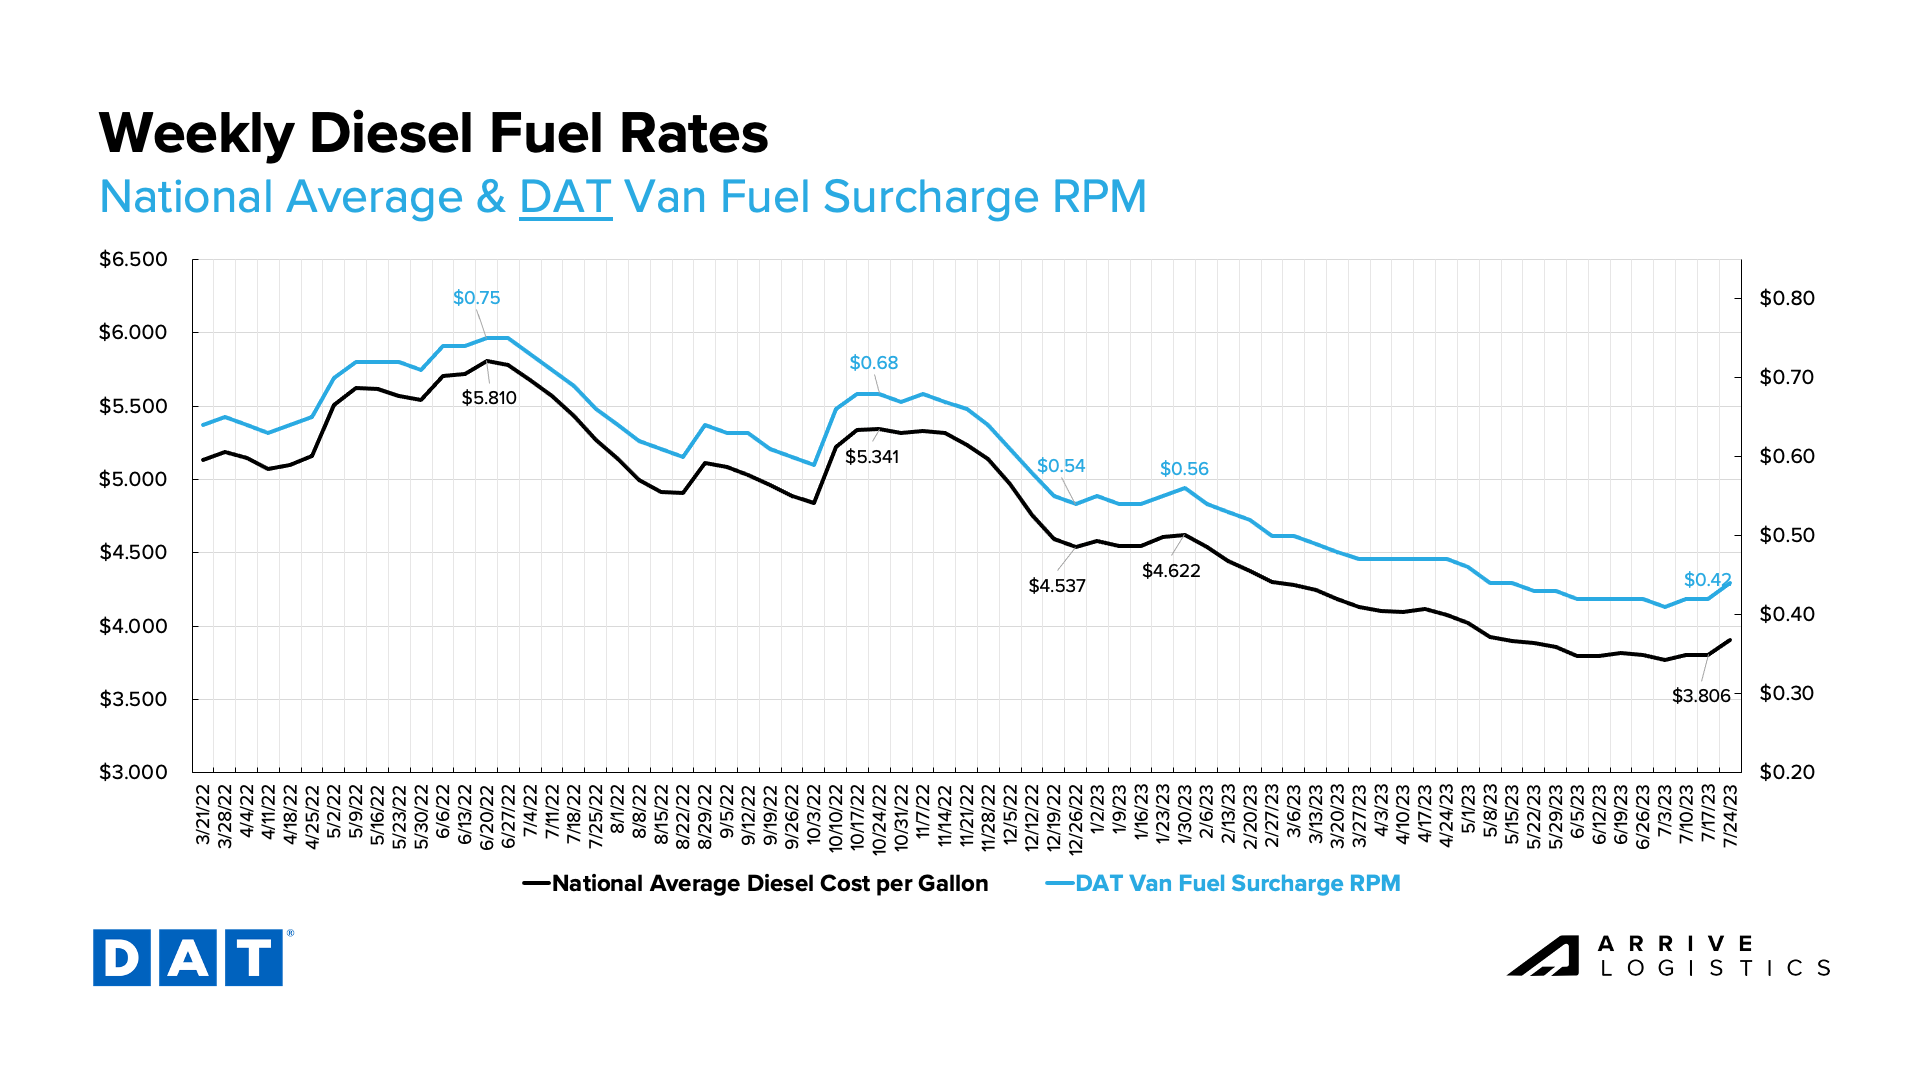 Figure 29: National Average Diesel Rates & DAT Fuel Surcharge RPM


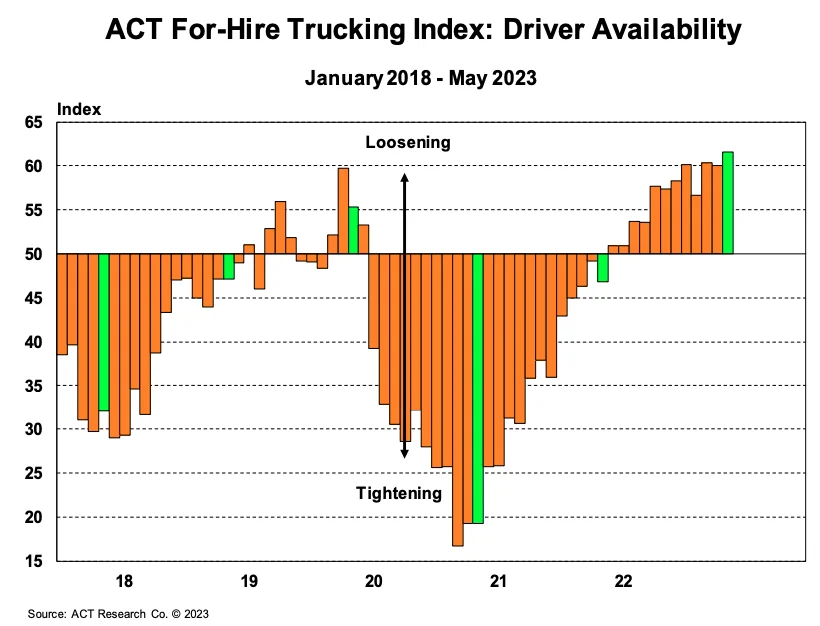 Figure 16: