
"*" indicates required fields
"*" indicates required fields
"*" indicates required fields


May and June trends followed seasonal expectations, with some volatility in typical areas. Demand trends ticked up slightly compared to April, and capacity remained steady. Overall, DOT Week and Memorial Day led to some increased volatility and elevated spot rates, which was a welcome relief to carriers. Rates are expected to remain elevated through the Fourth of July and decline afterward.
Below are the key takeaways from this month’s carrier update:
Spot rates ticked up across the country due to seasonal tightness.
Demand indicators are trending positive but remain down year-over-year.
Capacity continues to exit the market, albeit at a slower pace than in previous downcycles. Carriers with heavy spot market exposure continue to experience the most significant impact.
Summer import forecasts remain strong, with two million TEUs expected to move through the ports each month.
Inflation continues to cool, increasing the likelihood that the Fed will cut interest rates this year.
What’s Happening: Demand continues to grow in line with seasonal expectations.
Why It Matters: Increased demand has caused volatility in certain regions.
The Morgan Stanley Dry Van Freight Index measures relative supply; the higher the index, the tighter the market conditions. The black line with triangle markers on the chart provides a great view of what directional trends would be in line with normal seasonality based on historical data dating back to 2007.
Early June readings indicated the market is tightening faster than some historical data shows but at a similar pace as last year. However, the most recent reading in mid-June indicated that conditions have leveled off slightly. The reefer index showed a similar trend, moving at the same rate as in 2023, albeit in a slightly tighter environment. On the flatbed side, the index looks almost identical to last year.
Moving forward, we expect trends to largely reflect 2023, flattening after the Fourth of July and remaining relatively stable through the second half of the year.


The most recent (April) ACT Supply-Demand Index reading was 47.5, down from 48.5 in March and marking the second consecutive month of loosening conditions. However, the trend will likely be short-lived as summer demand is expected to grow and cost economics continue to pressure carriers.

The Sonar Outbound Tender Reject Index (OTRI), which measures the rate at which carriers reject the freight they are contractually required to take, shows more volatility now than at this time last year. However, with the index still below 5%, it is safe to say the market environment remains soft overall. We believe that slowly shrinking supply and the spot-contract gap closing during periods of elevated spot rates are driving this trend. Conditions should continue to follow normal seasonality, but the impact will be muted relative to historical trends.


The DAT Load-to-Truck Ratio measures the total number of loads relative to the total number of trucks posted on its spot board. The May reading ticked up for the third consecutive month, rising to 4.39. Such month-over-month increases are typical in May — in fact, this year’s load-to-truck reading was almost identical to May 2022. The Reefer load-to-truck ratio increased month-over-month but not as significantly, reaching 6.28. It was also up year-over-year from May 2023 but below May 2022.
What’s Happening: Supply remains abundant despite recent volatility.
Why It Matters: Resilient capacity makes the market less vulnerable to disruptions.
With slower-than-expected truckload demand growth due to the high number of new carriers entering the market amid gradually declining volume, capacity levels are returning to balance. Compounding these conditions are private fleets continuing to place new truck orders despite persistently low rates, a trend that differs from typical carrier activity in a down market. Ultimately, capacity remains resilient, which could keep rates low and extend the downcycle.
The most recent revocations report supports this view, indicating that the for-hire carrier population continued to decline over the past few months but at a significantly slower rate than in years past. This was largely due to an increase in new market entrants and slowing revocations of authority, which, according to FTR, could indicate that the weakest capacity has already left the market.
While this data isn’t the most accurate indicator of true capacity levels as it measures companies, not trucks, it does illustrate overall carrier sentiment.

Carrier margins continued to sink in Q1 amid declining revenues and high operating costs. Net income margins for ACT’s ‘core carriers’ dropped to nearly 3% and had the largest year-over-year decline since at least 2010.
With spot market rates almost 25% lower than contract rates, carriers with heavy spot exposure are experiencing the greatest impact. Meanwhile, contract-driven fleets are still generating relatively strong revenues, and private fleets continue to increase capacity.
As challenging conditions drive more carriers out of the market, supply will shrink, and rates will rise, ultimately triggering inflationary conditions.

According to ACT Research, the preliminary Class 8 backlog-to-build ratio dropped from 5.6 in April to 5.5 in May. After rising consistently toward the end of 2023 and into early 2024, the backlog level has declined to 85,000 units, the lowest point in three years. However, production rates have also slowed, indicating that backlogs may start to level out again.

The latest ACT Driver Availability Index reading fell from 56.0 in March to 51.0 in April, indicating soft market conditions and strong driver availability. However, with rates low and wages decreasing, sectors such as manufacturing and construction may start offering higher salaries, potentially drawing drivers away from the trucking industry.
According to ACT, drivers continue to work past retirement age due to persistent inflation. If this trend is widespread, the driver retirement rate could spike once inflation falls and the Fed cuts interest rates, shocking the market and leading to rapid rate increases.

What’s Happening: Import volumes will likely remain strong through the summer and fall.
Why It Matters: Elevated imports could drive up freight demand and rates.
Our demand outlook has upside and downside indicators. The National Retail Federation’s (NRF) summer-fall import outlook remains strong and is one major upside. U.S. ports handled 2.02 million TEUs in April, a 13.2% year-over-year increase and a 4.6% increase from March. The ports handled an estimated 12.1 million total TEUs in the first half of the year, up 15% from the same time frame last year.
The NRF also projects that ports will handle over two million TEUs monthly from April 2024 to October 2024. Increased imports indicate that retailers are restocking inventories before the holiday season in anticipation of increased consumer demand. While this data is encouraging, we caution that retail orders are not always a true indicator of what is to come for retail spending. If retail executives ove rorder, the result will be another stockpile of inventories that need to be worked down, similar to the post-COVID era, which would have a deflationary impact on the market.
NRF Monthly Imports
DAT reported an 18.7% increase in spot load posts from April to May. Though significant, this movement is in line with typical seasonality. Despite strong month-over-month growth, spot load posts declined 2.6% year-over-year. The decline is due to seasonal conditions similar to last year’s and the continued increase in spot capacity sourced through new methods, such as rate APIs.
Carriers are also posting fewer trucks and spending more time searching for loads, indicated by spot truck postings declining by 22% year-over-year. This data does not necessarily mean there is 22% less capacity on the roads than a year ago, it simply supports the idea that the capacity correction is significantly further compared to this time last year.
What’s Happening: Conditions are soft overall as the market awaits a decision on the rail strike.
Why It Matters: Rates remain low, but the potential strike could increase volatility.
What’s Happening: The conversion rate of the U.S. Dollar (USD) to Mexican Peso (MEX) has risen quickly following the recent presidential election in Mexico.
Why It Matters: Carriers paid in USD have additional revenue and could offer lower rates to secure volumes.
What’s Happening: LTL activity will likely be muted this summer.
Why It Matters: This allows shippers to focus on their sourcing plans while carriers aim to move more volume.
What’s Happening: Demand is following normal seasonal patterns in the Southeast and California.
Why It Matters: Increased tightness is driving up rates in these areas.
East Coast
Midwest
South Central
West
Pacific Northwest
What’s Happening: Flatbed demand remains steady.
Why It Matters: Rates are following typical seasonality.
What’s Happening: Rates increased in May.
Why It Matters: They will likely continue rising until after the Fourth of July.
Rates followed typical seasonality in May and early June, increasing due to DOT Week and Memorial Day and easing through the first half of June. As the end of the month, quarter and the Fourth of July approaches, we expect meaningful rate increases in the Southeast, Southwest and California. Based on 2023 and earlier historical trends, rates should decline after the Fourth of July and continue to follow muted seasonal patterns.
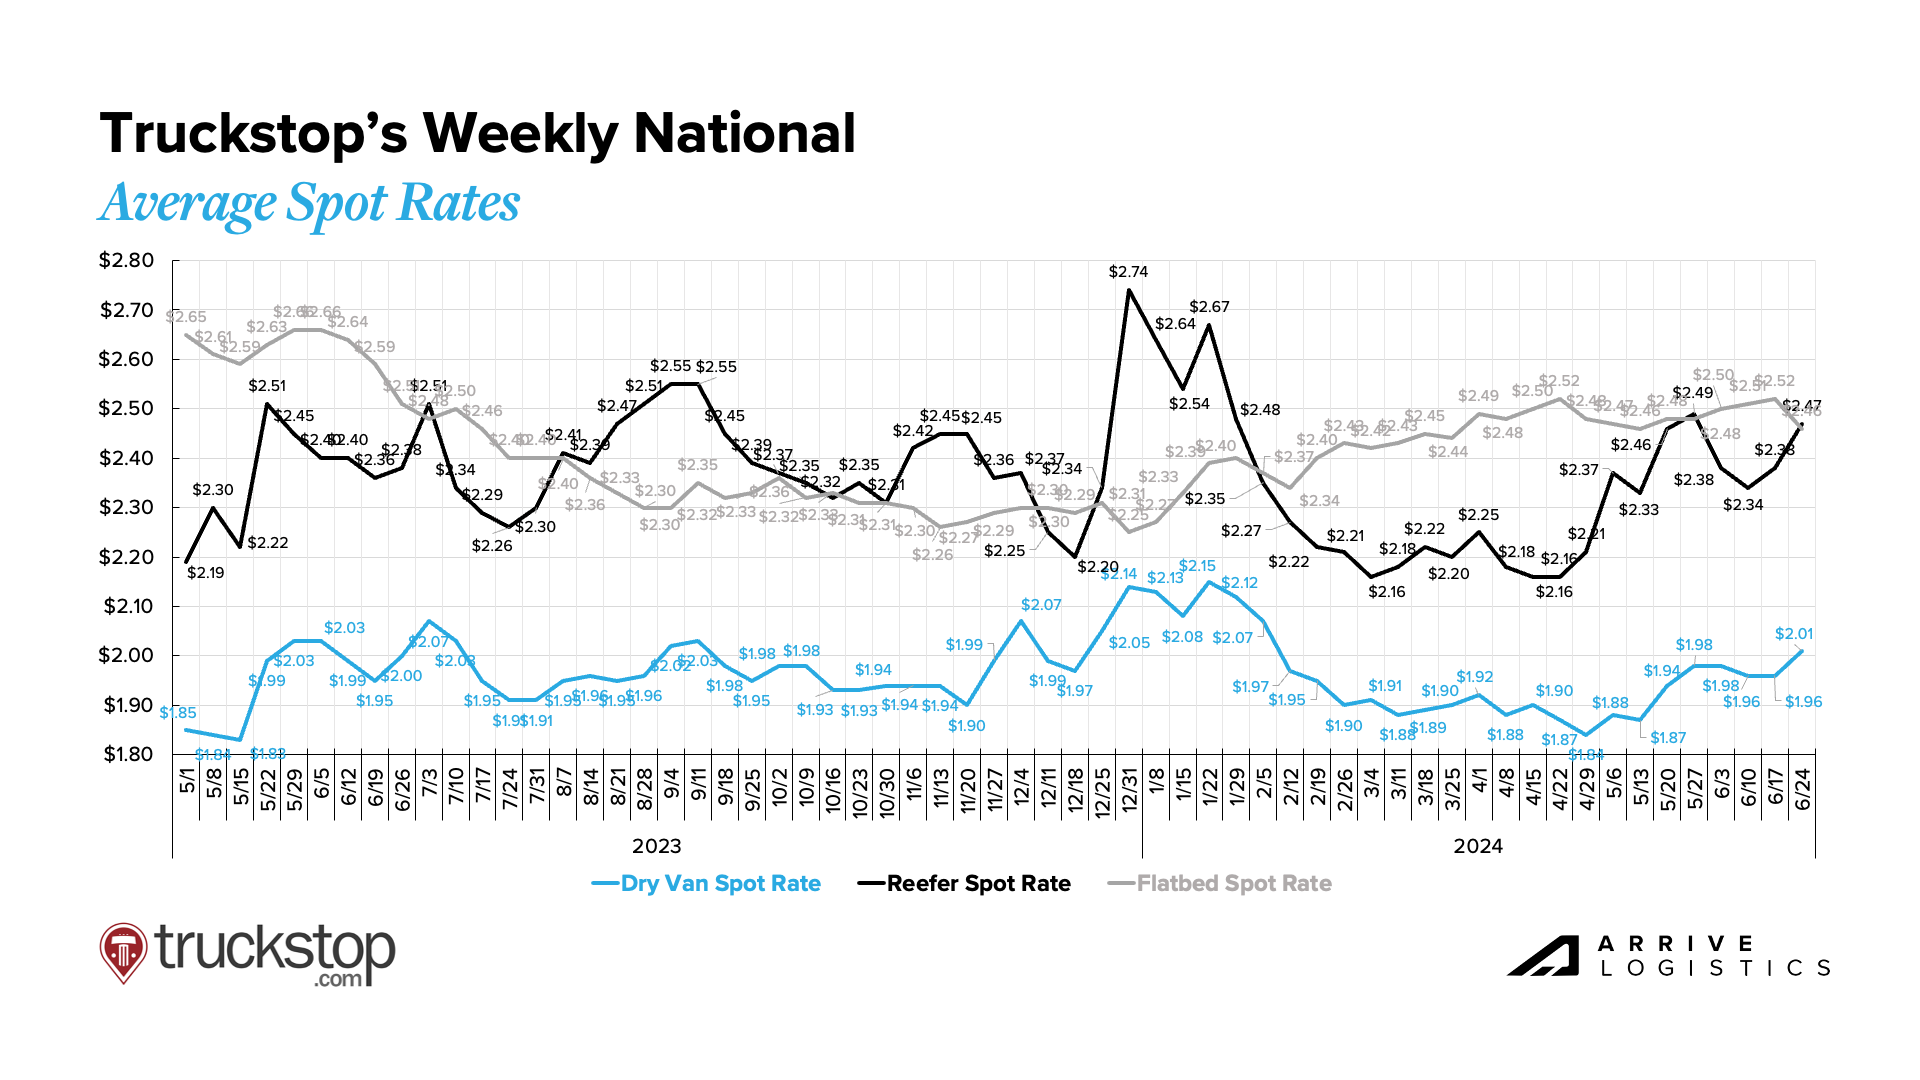
Truckstop’s Weekly National Average spot rates provide a detailed view of week-to-week movements and a real-time look into the current environment. Rates are very similar to this time last year and continue to follow seasonal expectations, increasing for all three modes around Memorial Day. Reefer rates pulled back significantly following Memorial Day, while flatbed and dry van rates held steady.
However, it is also worth noting that year-over-year van rates are now inflationary by $0.01 for the first time in over two years. These rates will ebb and flow with seasonality but are a clear sign the market continues to move along the bottom
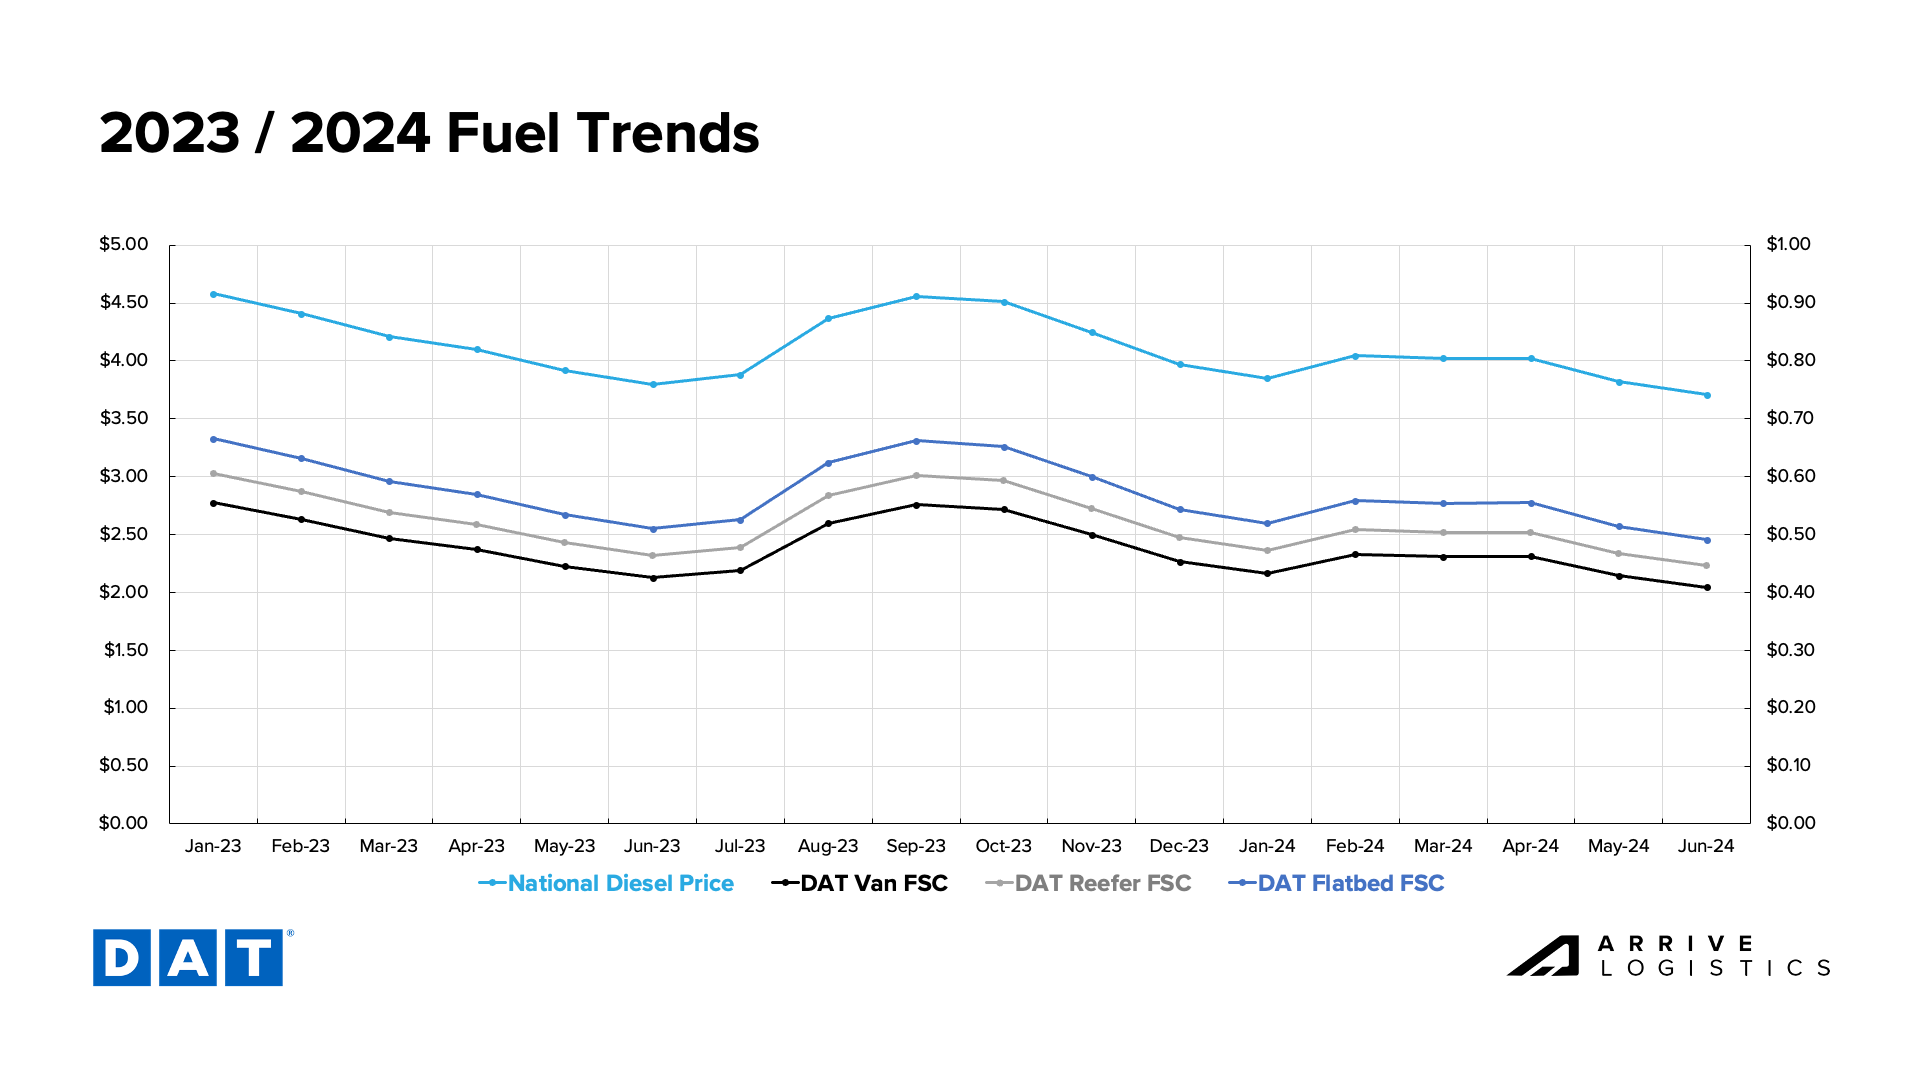
National diesel prices continued to decline in May and into June, averaging $3.71 per gallon through the first three weeks of this month. Lower fuel prices have been a welcome relief for carriers as high operating costs persist. However, June 17 marked the first increase after ten consecutive week-over-week declines, and prices could continue rising as summer demand increases ahead of the Fourth of July.
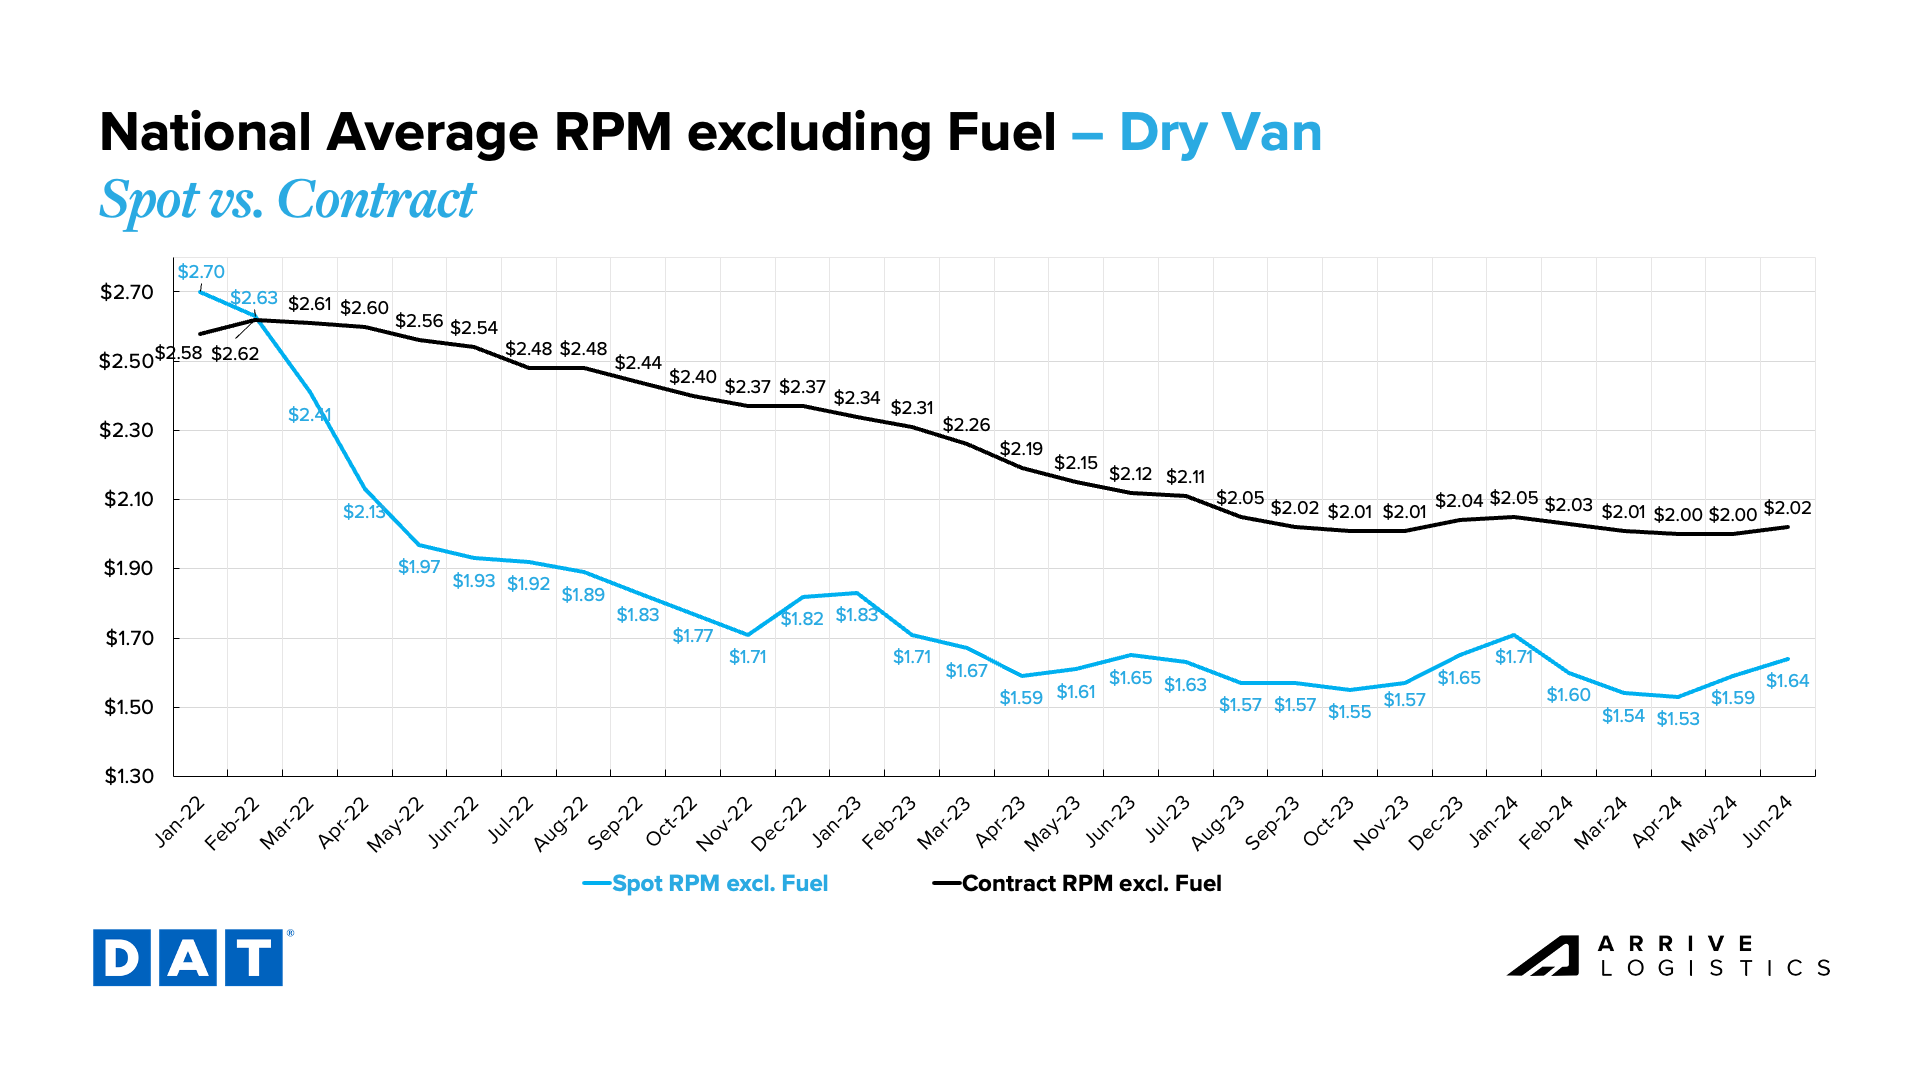
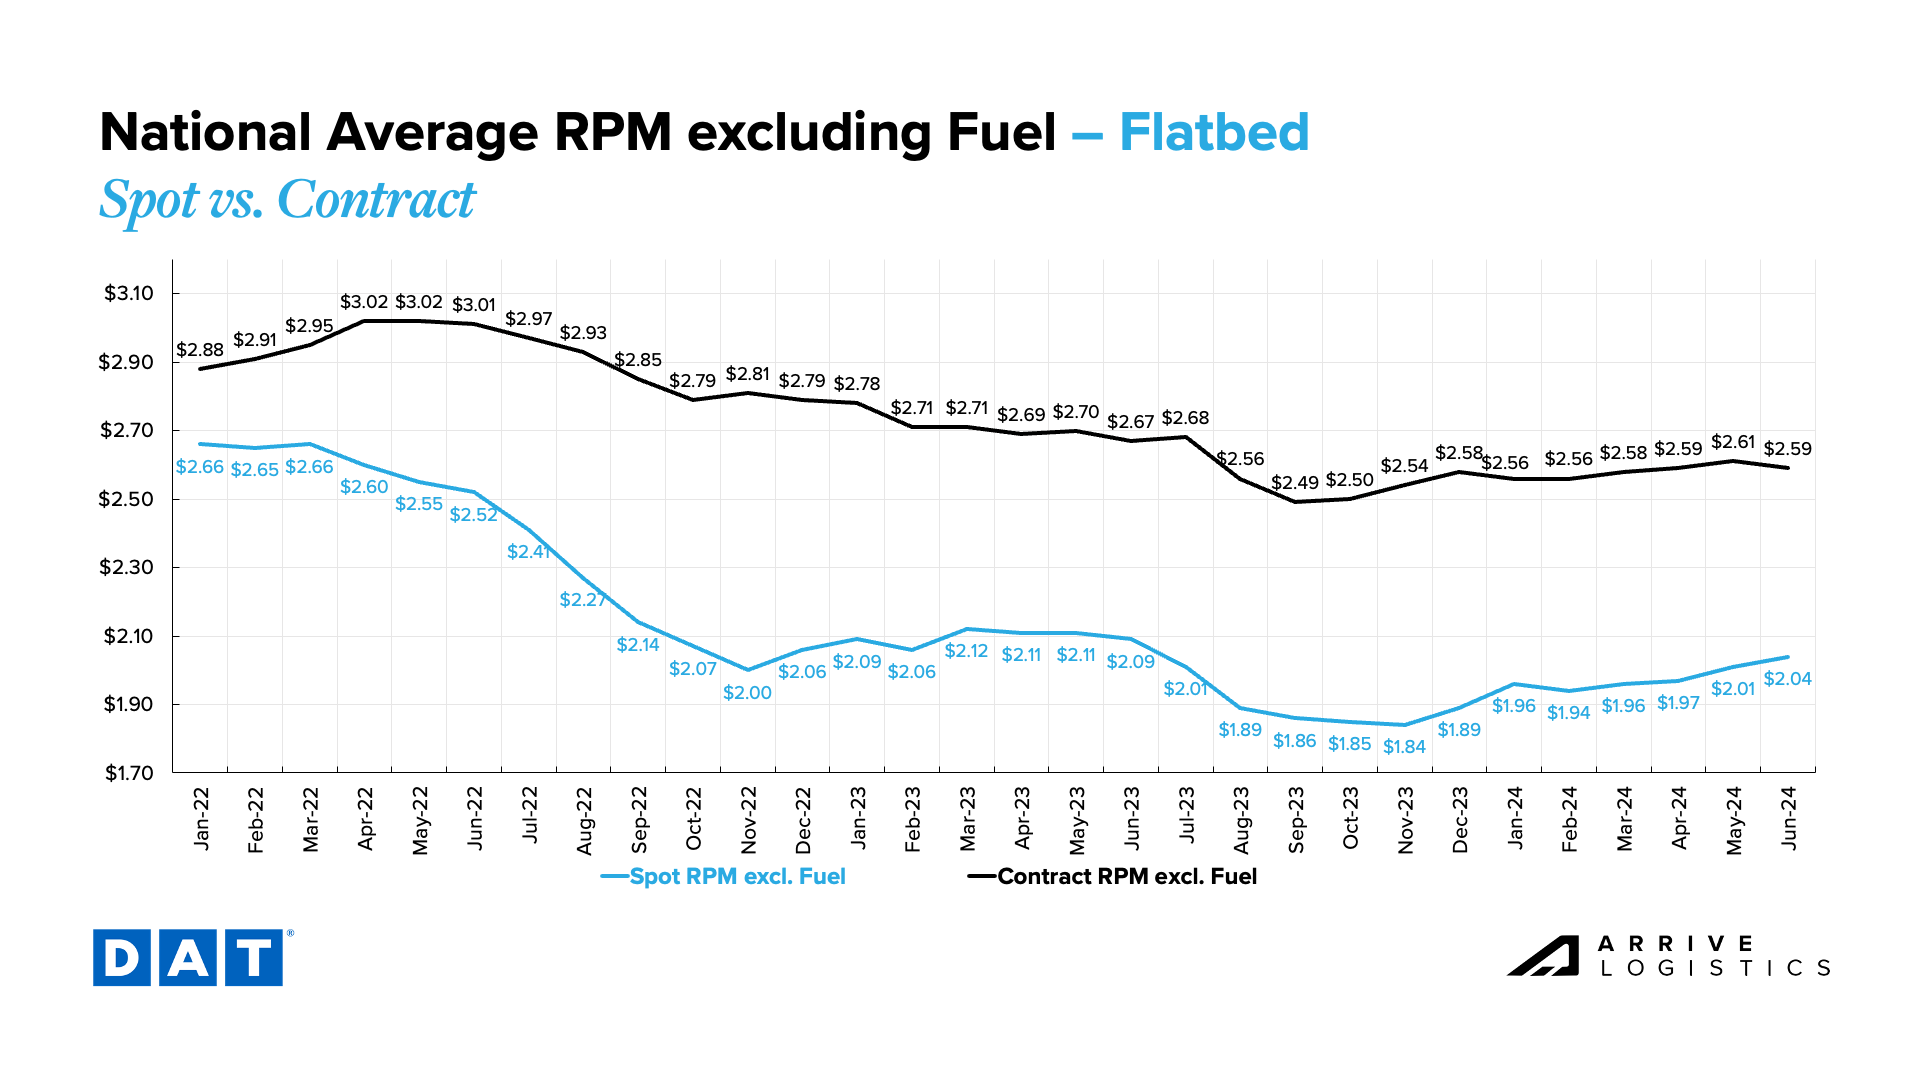
DAT data continues to show line-haul spot rate increases. Rates ticked up $0.05 per mile from April to May, and data from mid-June shows another $0.06 per mile increase. Contract rates remained flat in May and are up $0.01 per mile as of mid-June. These trends look similar to last year, albeit with smaller increases.
Despite rising month-over-month, May linehaul spot rates were still down $0.03 per mile year-over-year, and June rates are down $0.01 per mile year-over-year. Contract rates have also decreased by $0.11 per mile year-over-year.
With these seasonal spot rate increases amid relatively stable contract rates, the spot-contract spread has dipped to $0.37, excluding fuel — its lowest point since January 2024 and second lowest since early 2022. While still historically high, the $0.47 improvement from a year ago indicates the market’s steadily increasing vulnerability.
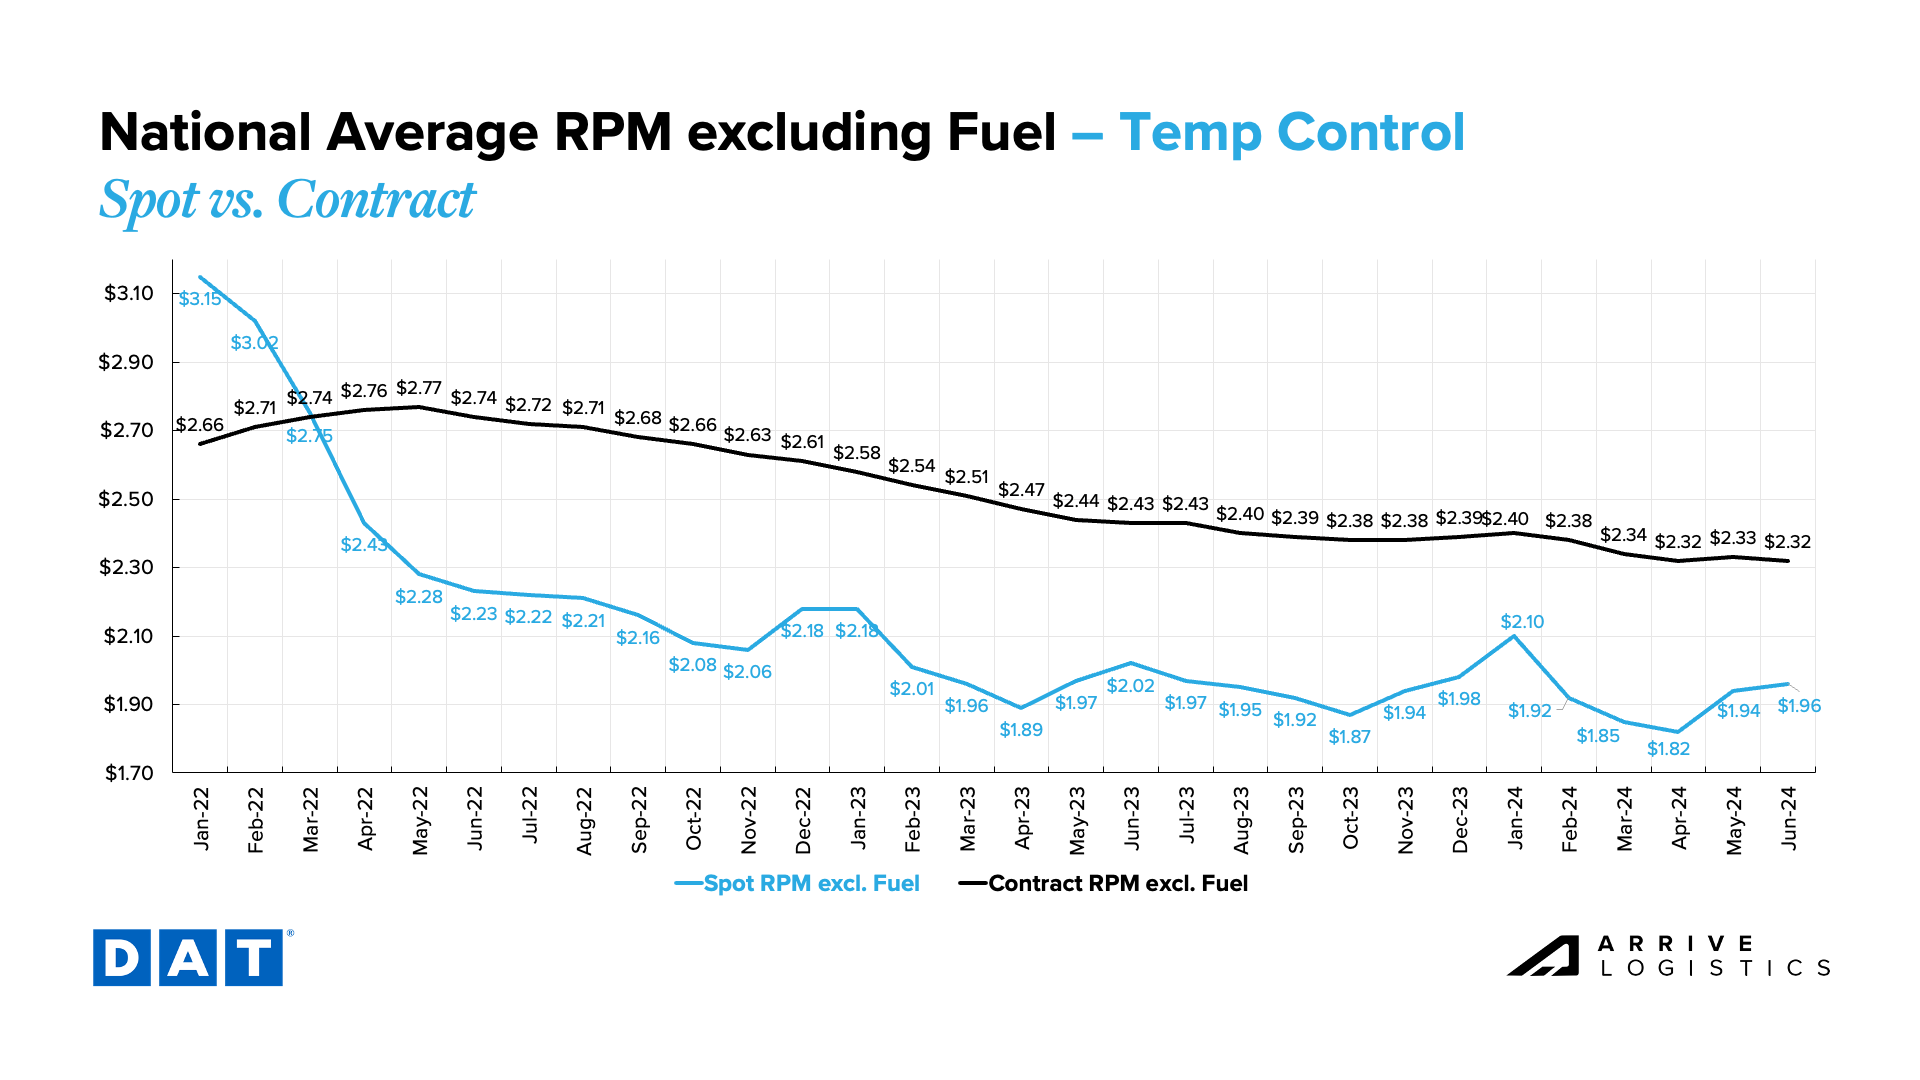
Reefer linehaul rate trends have also matched seasonal expectations, with month-over-month spot rate increases in May and June. The $0.12 per mile jump from April to May was the largest month-over-month increase since January 2024. As of mid-June, reefer spot rates have flattened slightly to $1.96 per mile, excluding fuel. Despite increased volatility, reefer spot rates remain down year-over-year. Rates continue to decline slowly on the contract side, averaging $2.32 per mile in June, $0.12 per mile lower than last year.
Flatbed spot rates ticked up for the fourth consecutive month, while contract rates declined for the first time since January 2024. The spot rate increase comes amid growing demand for heavy equipment and project-based freight. In June 2023, rates rose before dropping relatively quickly over the following months. While a similar drop is unlikely this year, spot rates could begin to flatten.
What’s Happening: Inflation cooled following the Fed’s indication of potential rate cuts later this year.
Why It Matters: Rate cuts would increase spending activity and, in turn, drive freight demand.
CPI data was down from 3.4% in April to 3.3% in May, which is good news for consumers. The Fed announced that a single rate cut is likely in 2024, indicating that they believe that inflation will continue to cool. Rate cuts will likely trigger an increase in economic activity and spending as the cost of borrowing money declines. Ultimately, this will lead to increased freight demand, but it will still be several months before that demand materializes. We caution against this being a trend of focus as it is likely that other less positive economic data will accompany rate cuts, which could more than offset any gains that would come from slight interest rate declines.
Bank of America card data shows overall spending increased by 0.7% year-over-year, marking the fourth consecutive month of positive year-over-year growth. Retail spending, excluding restaurants, remained down year-over-year but showed positive growth from April. On the other hand, services spending increased year-over-year despite a small pullback from April. Bank of America notes that Gen Z and Millenials accounted for about 30% of overall spending and 32% of households. In comparison, Gen X only accounted for 27% of total households but 34% of overall spending.

May and early June market trends unfolded as expected. Although volatility increased during DOT Week and Memorial Day, the impact was relatively subdued. Rate fluctuations followed typical seasonal patterns and remained well below historical highs.
Thus, the freight market downcycle persists. Despite low rates, the carrier population remains robust, and truckload demand conditions have shown no significant changes.
Our outlook for rate conditions remains consistent: In the short term, rates will follow normal seasonal trends, rising before the Fourth of July and declining shortly after. Our longer-term forecast calls for downward pressure on contract rates, leading the spot-contract rate gap to close further and prompting more carriers and brokers to exit the market. This is the next phase of the market cycle and could create conditions for more sustained routing guide disruption in 2025.
The Arrive Carrier Market Outlook, created by Arrive Insights™, is a report that analyzes data from multiple sources, including but not limited to FreightWaves SONAR, DAT, FTR Transportation Intelligence, Morgan Stanley Research, Bank of America Internal Data, ACT Research, Journal of Commerce, Stephens Research, National Retail Federation and FRED Economic Data from the past month as well as year-over-year. We know market data is vital in making real-time business decisions. At Arrive Logistics, we are committed to giving you the data and insights you need to better manage your freight.

