


The Morgan Stanley Dry Van Freight Index is another measure of relative supply; the higher the index, the tighter the market conditions. The black line with triangle markers on the chart provides a great view of what directional trends would be in line with normal seasonality based on historical data dating back to 2007.
The most recent reading showed a small demand increase relative to supply in April. Though a slight deviation from seasonal expectations, this aligns with DAT spot posting data. As DOT Week concluded, the index remained in line with the historical averages for this time of year. Reefer data shows a similar deviation but is almost identical to 2023 from a year-over-year perspective.
 Morgan Stanley Dry Van Truckload Freight Index
 Morgan Stanley Reefer and Flatbed Truckload Freight Indices
The most recent (March) ACT Supply-Demand Index reading was 48.7, down from 53.5 in February, breaking a seven-month-streak of tightening conditions. Overall, rate movement in the for-hire market was similar, with spot rates hitting cycle lows. However, the market will likely continue to tighten through the 100 Days of Summer.
Though tracking total capacity is challenging, recent load-to-truck ratios and the April Outbound Tender Rejection Index reading indicate supply and demand are moving toward balance, leaving the market more vulnerable to seasonal pressures. Routing guides will see increased challenges due to the improved market balance but will remain intact overall and return to baseline after the Fourth of July.
The latest Sonar Outbound Tender Reject Index (OTRI), which measures the rate at which carriers reject freight they are contractually required to take, confirms that the market is more vulnerable to disruption than a year ago. Trends are approaching what they were in 2020, meaning the summer peak season could have a greater impact. However, recent rejection rate growth is unlikely to last beyond peak season due to the oversupplied market.
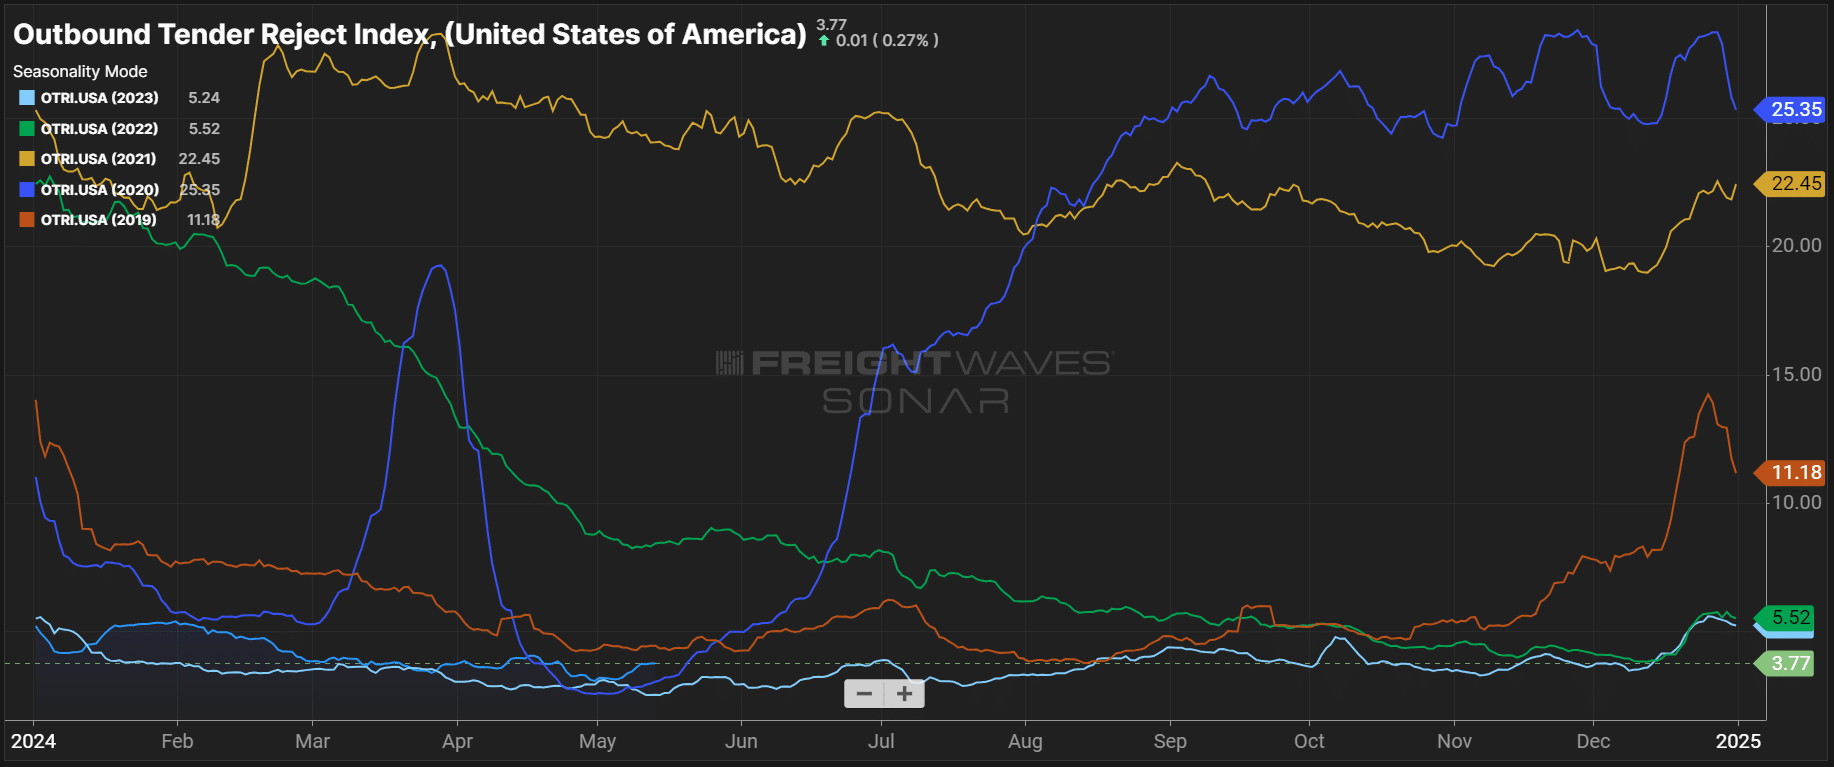 Outbound Tender Reject Index (SONAR)
 Van & Reefer Outbound Tender Reject Indices
The DAT Load-to-Truck Ratio measures the total number of loads relative to the total number of trucks posted on its spot board. The April reading rose to 3.54 on the van side, slightly higher than April 2023 and in line with April 2022. Reefer load-to-truck ratios remained relatively flat month-over-month and slightly elevated year-over-year.
According to the latest revocations report, the for-hire carrier population has declined in 17 of 19 months. Though significant, the streak is still well short of The Great Recession, when the population fell in 28 of 30 months between October 2007 and March 2010. Despite the steady decline, there are 92,000 more active for-hire trucking firms today than before July 2020, when a massive wave of new carriers entered the market.
 FTR’s Carrier Revocations, New Carriers & Net Change in Carrier Population
According to ACT Research, Class 8 Tractor sales have returned to replacement levels. While the for-hire market seems to have stopped adding capacity, private fleets still are. However, increasing cost pressures and low revenues continue to strain carriers’ financial health, indicating that new tractor orders may continue to decline this year. Ultimately, this trend would create tightness and drive rates up.
 ACT Research U.S. Class 8 Tractors, Retail Sales
Carrier margins continued to sink in Q1 amid declining revenues and high operating costs. Net income margins for ACT’s ‘core carriers’ dropped to nearly 3% and had the largest year-over-year decline since at least 2010. With spot market rates almost 25% lower than contract, carriers with heavy spot exposure are feeling the greatest impact. Meanwhile, contract-driven fleets are still generating relatively strong revenues and private fleets continue to add capacity. As challenging conditions drive more carriers out of the market, rising rates amid shrinking supply will ultimately trigger inflationary conditions.
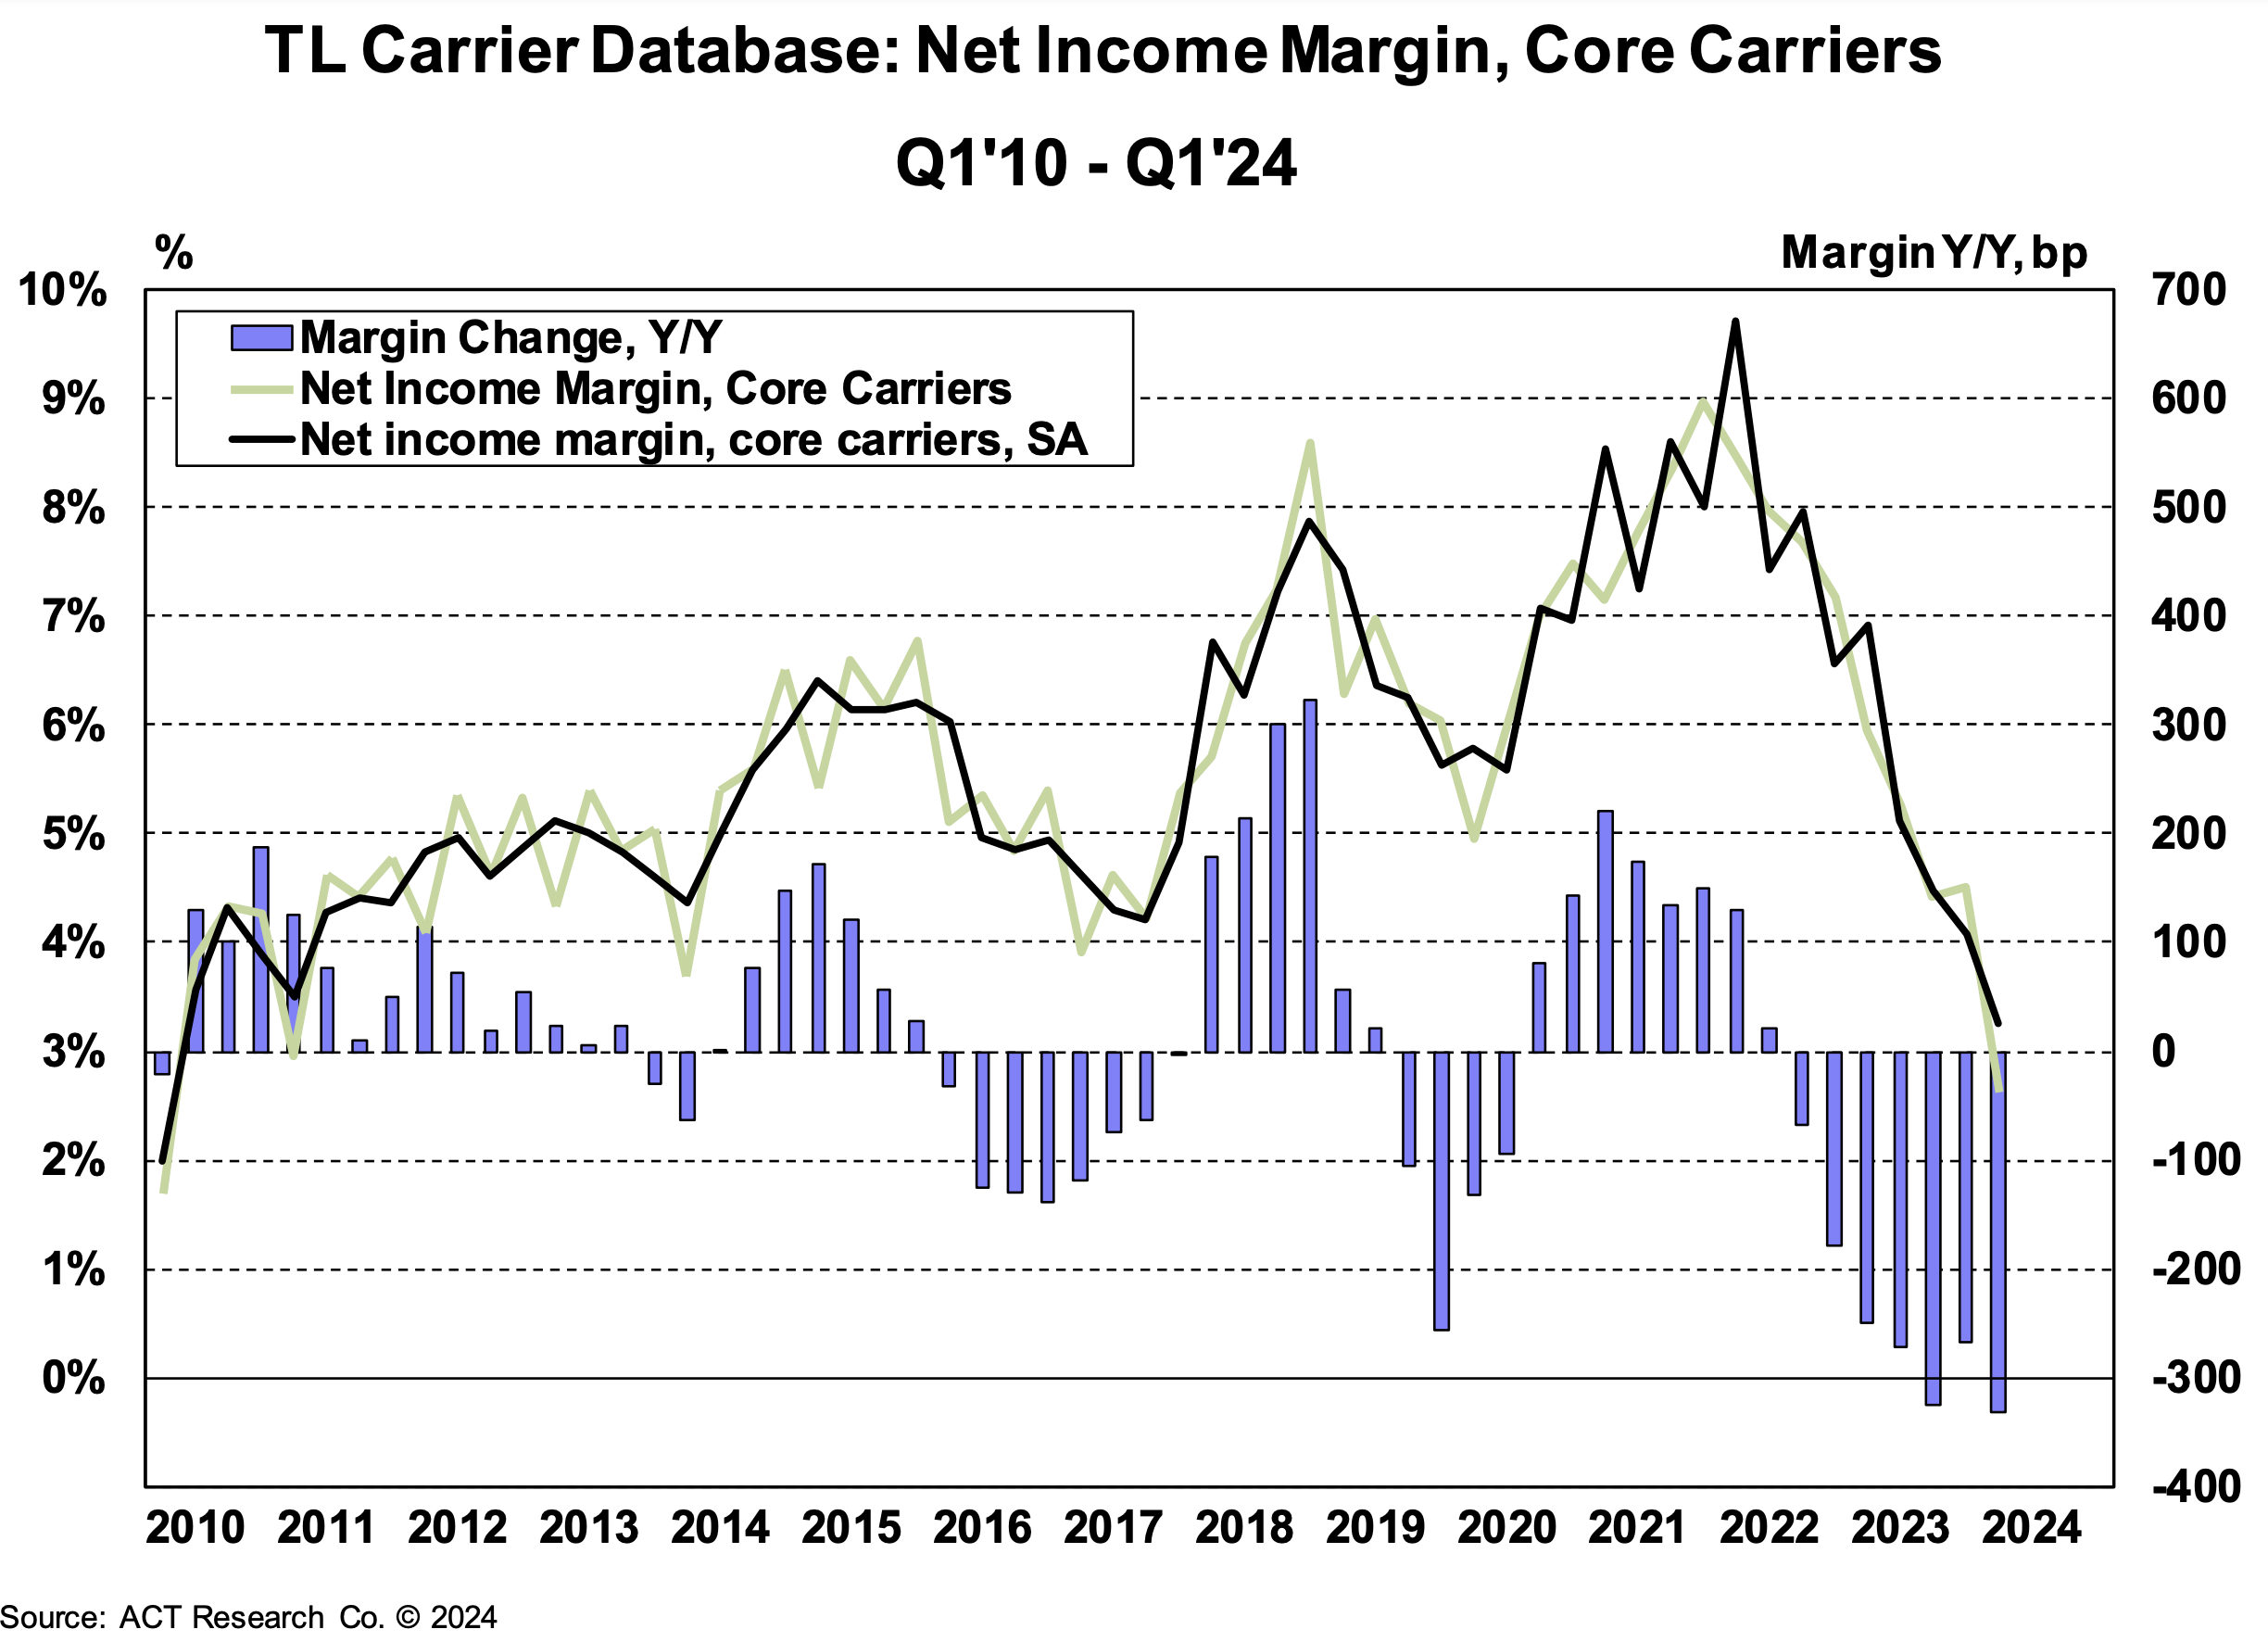 ACT Research, Net Income Margin, Core Carriers
According to ACT Research, the preliminary Class 8 Backlog-to-Build ratio rose from 5.5 in March to 5.9 in April. After rising consistently towards the end of 2023 and into early 2024, the backlog has decreased for consecutive months, reaching 91,000 units, the lowest level in the last three and a half years.
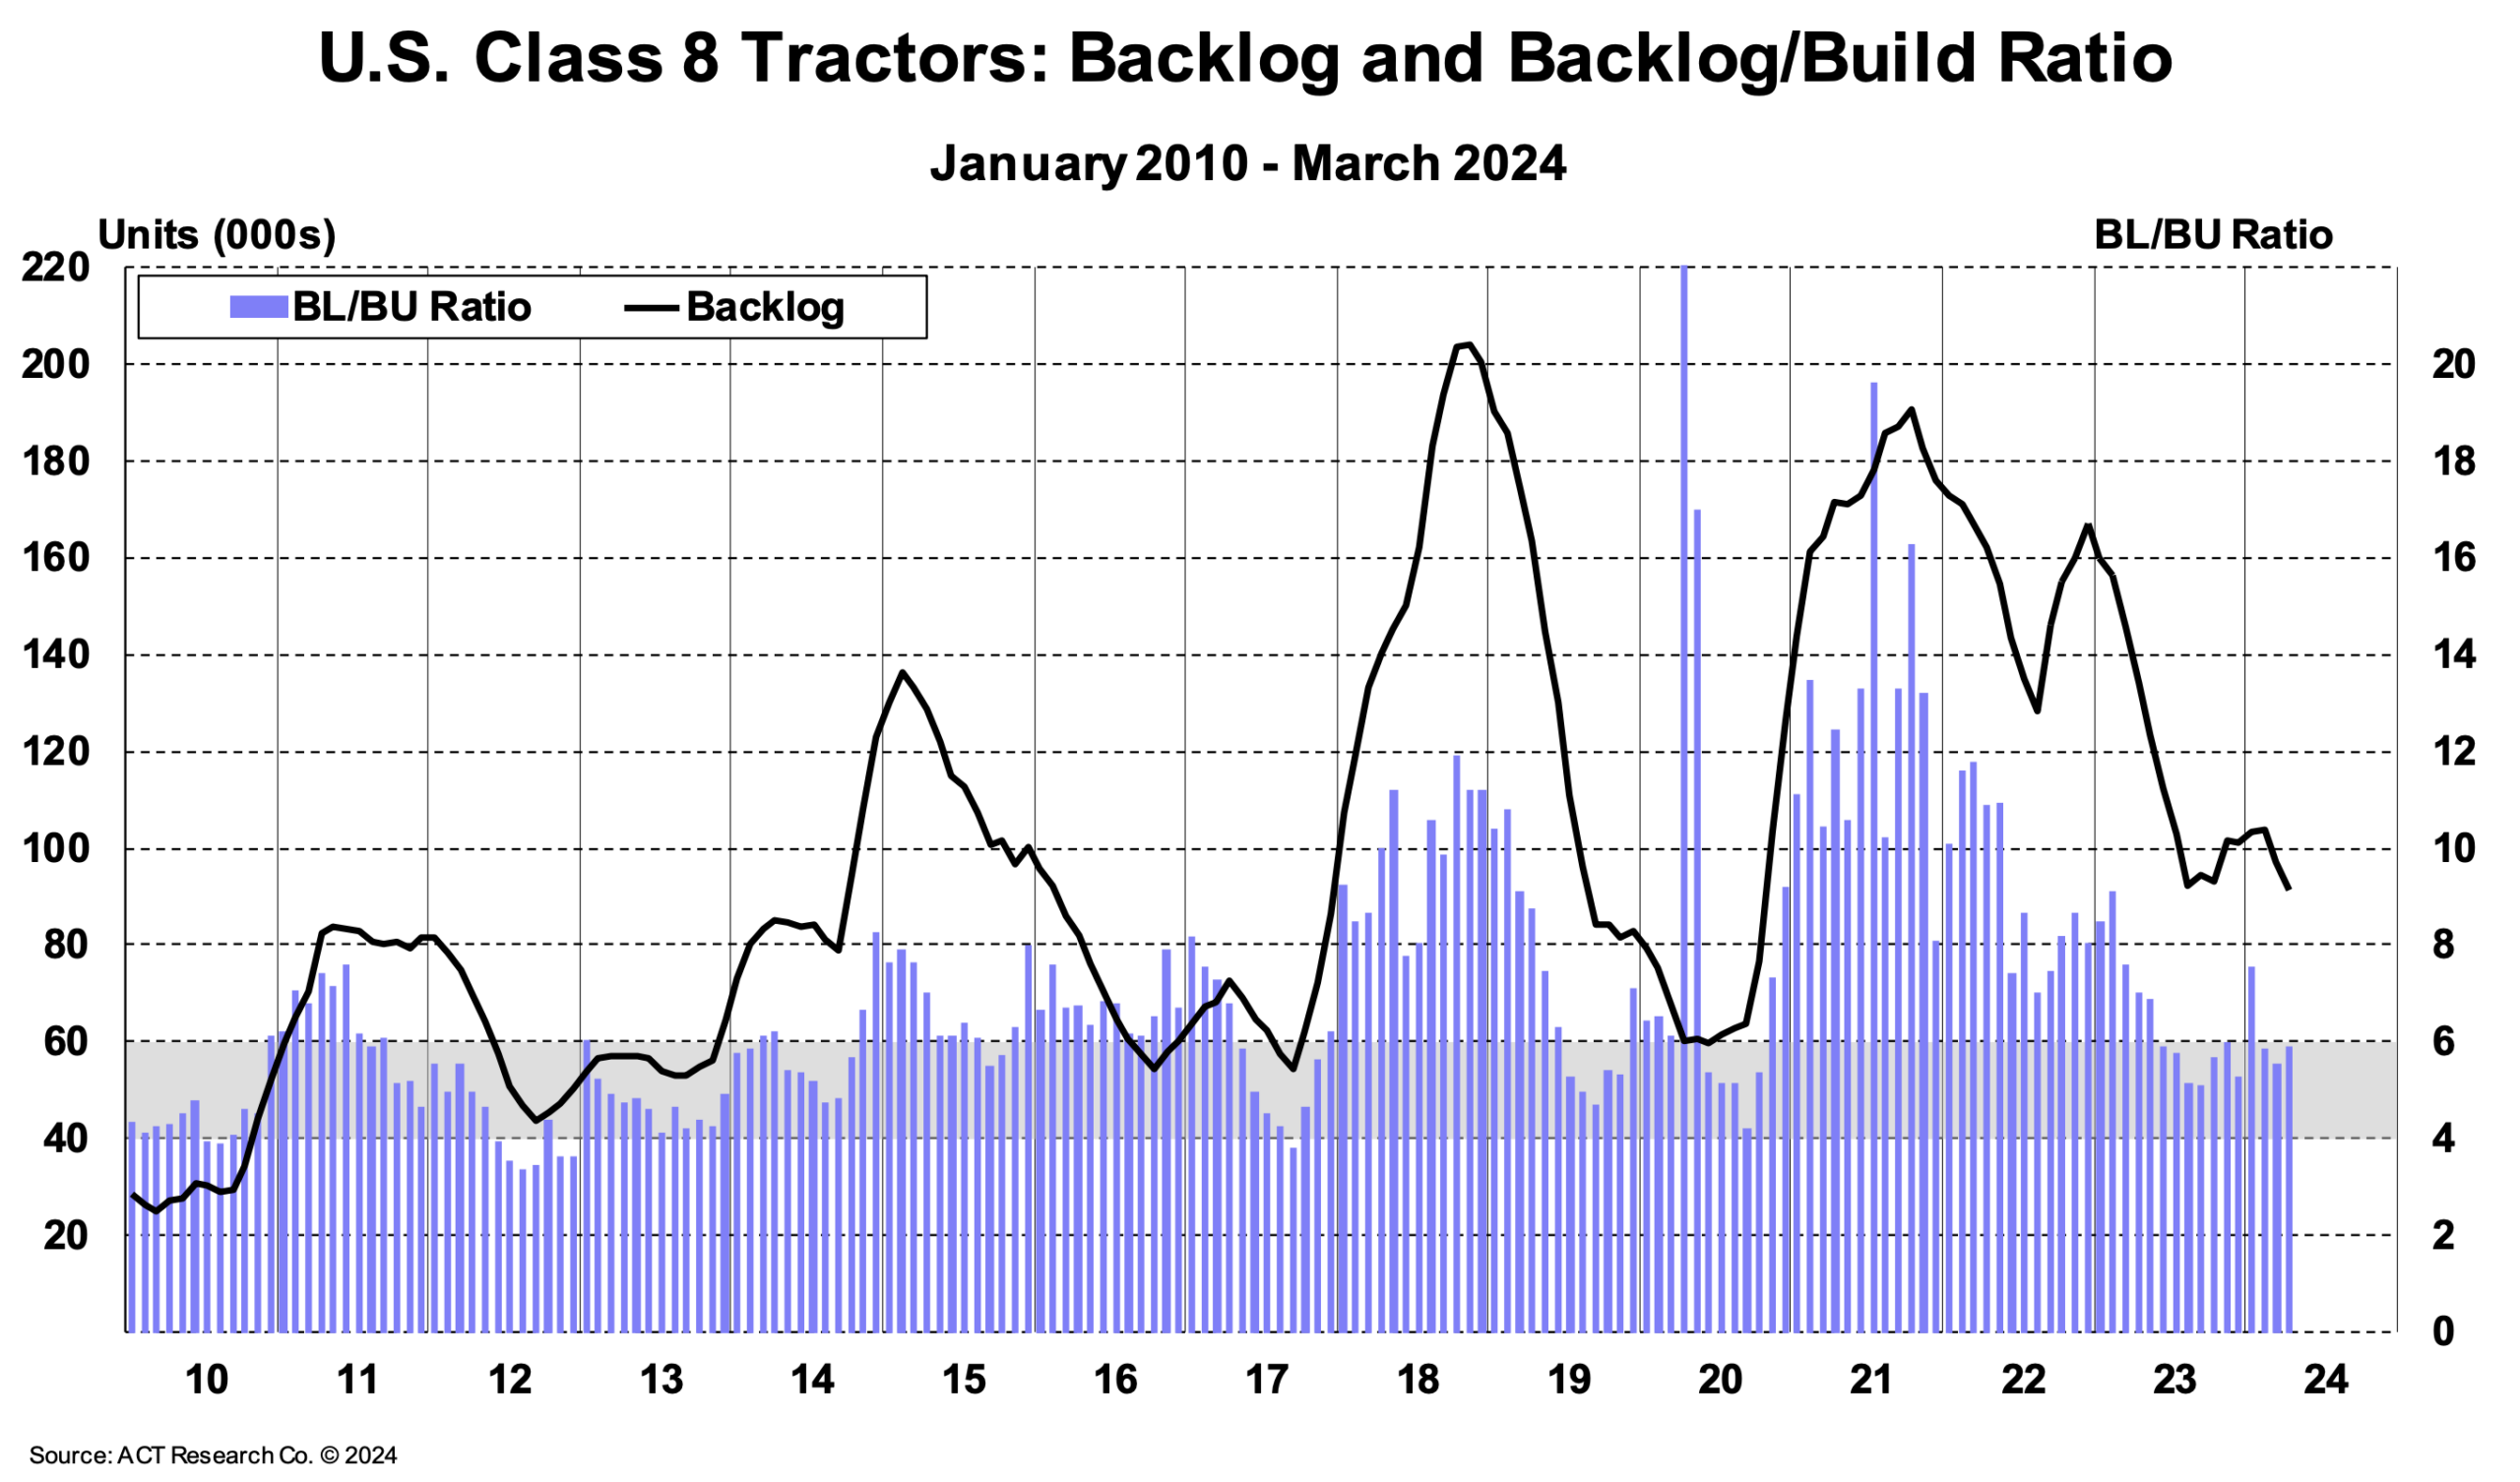 ACT Research, U.S. Class 8 Tractors, Backlog & Backlog/Build Ratio
The latest (March) ACT Driver Availability Index reading was 56.0, up from 55.4 in February. This marginal increase indicates that driver availability remains strong, and there is no driver shortage. However, with rates low and wages decreasing, other sectors such as manufacturing and construction may start offering higher salaries, potentially drawing drivers away from the industry.
According to ACT, drivers continue to work past retirement age due to persistent inflation. If this trend is widespread, many drivers could retire simultaneously once inflation falls and interest rates are cut. This potential exodus could shock the market and lead to quicker-than-expected rate increases.
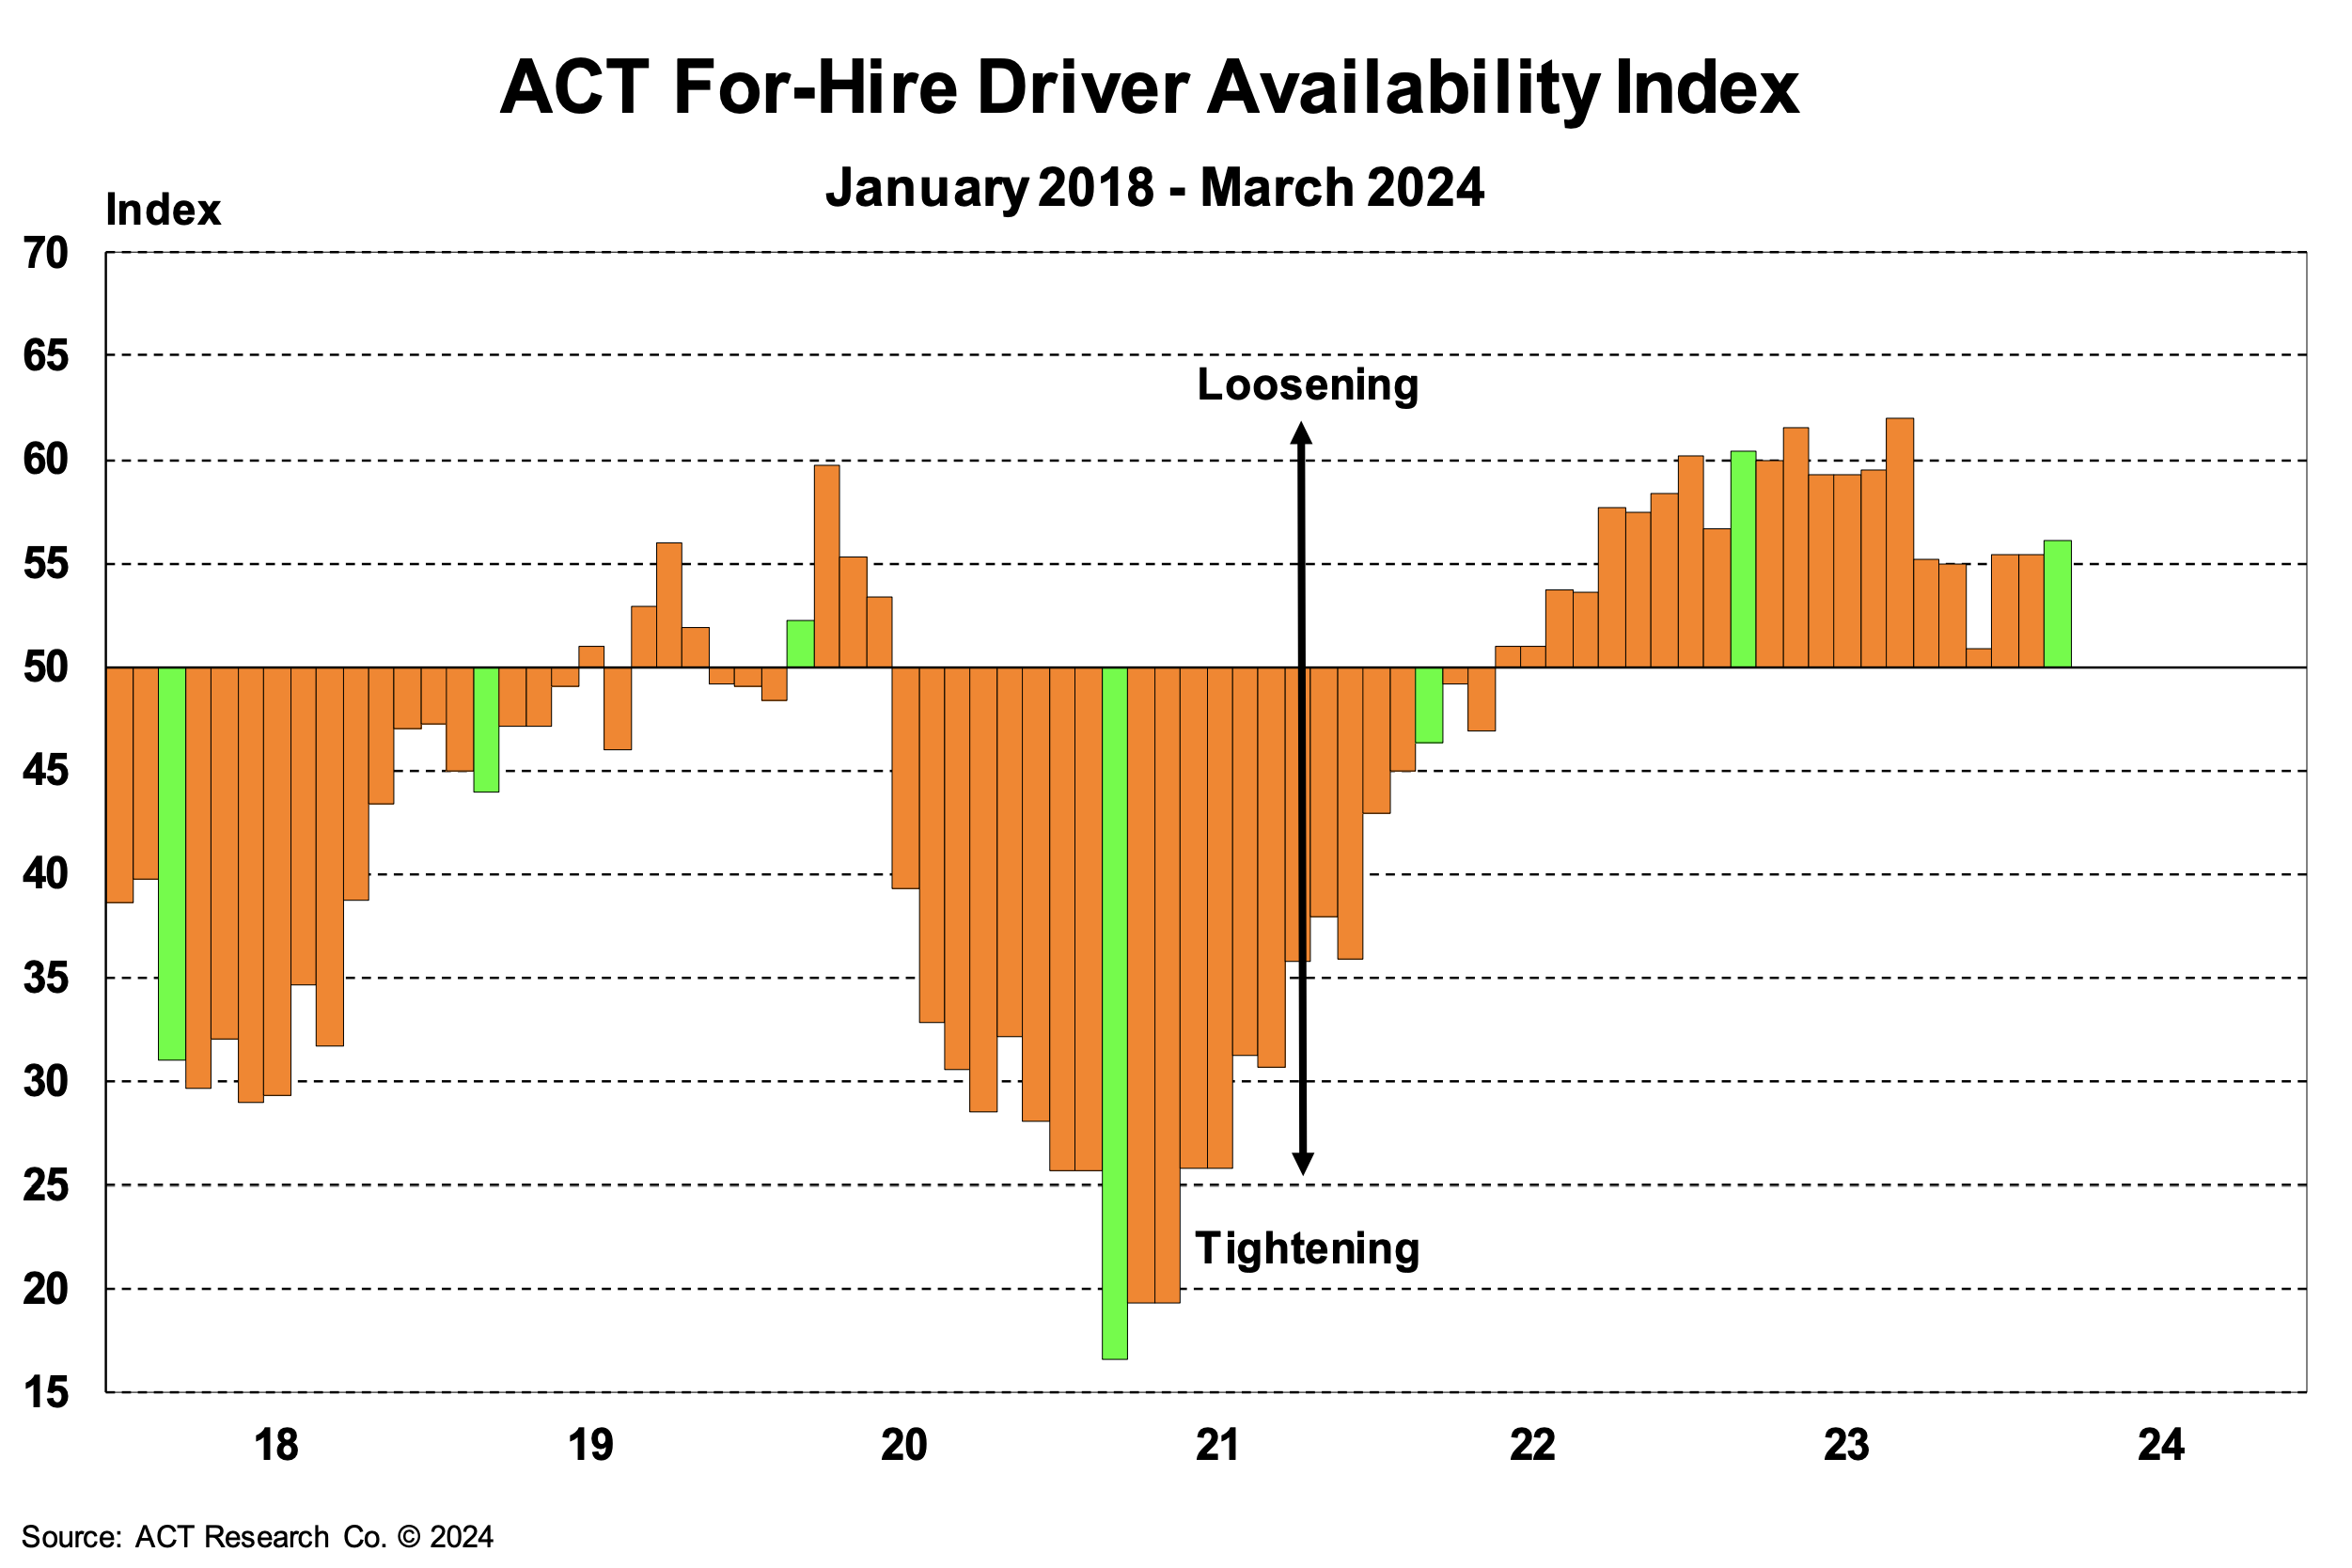 ACT For-Hire Trucking Index: Driver Availability
The National Retail Federation (NRF) import outlook remains positive for the summer and fall, forecasting over two million monthly TEUs. The most recent (March) import data showed U.S. ports handled around 1.93 million TEUs, down 1.4% from February but up 18.7% year-over-year.
While the large year-over-year increase is encouraging, it is important to note that Asian exports were slow in March 2023 due to the Lunar New Year. Nonetheless, the optimistic import forecast indicates retailers continue to order merchandise to meet strong consumer demand.
![]() NRF Monthly Imports
NRF Monthly Imports
According to DAT, spot market activity ticked up month-over-month and year-over-year in April, indicating a slight demand increase compared to the same period last year. Truck postings declined by nearly 19% amid ongoing capacity attrition and strong contract tender compliance.
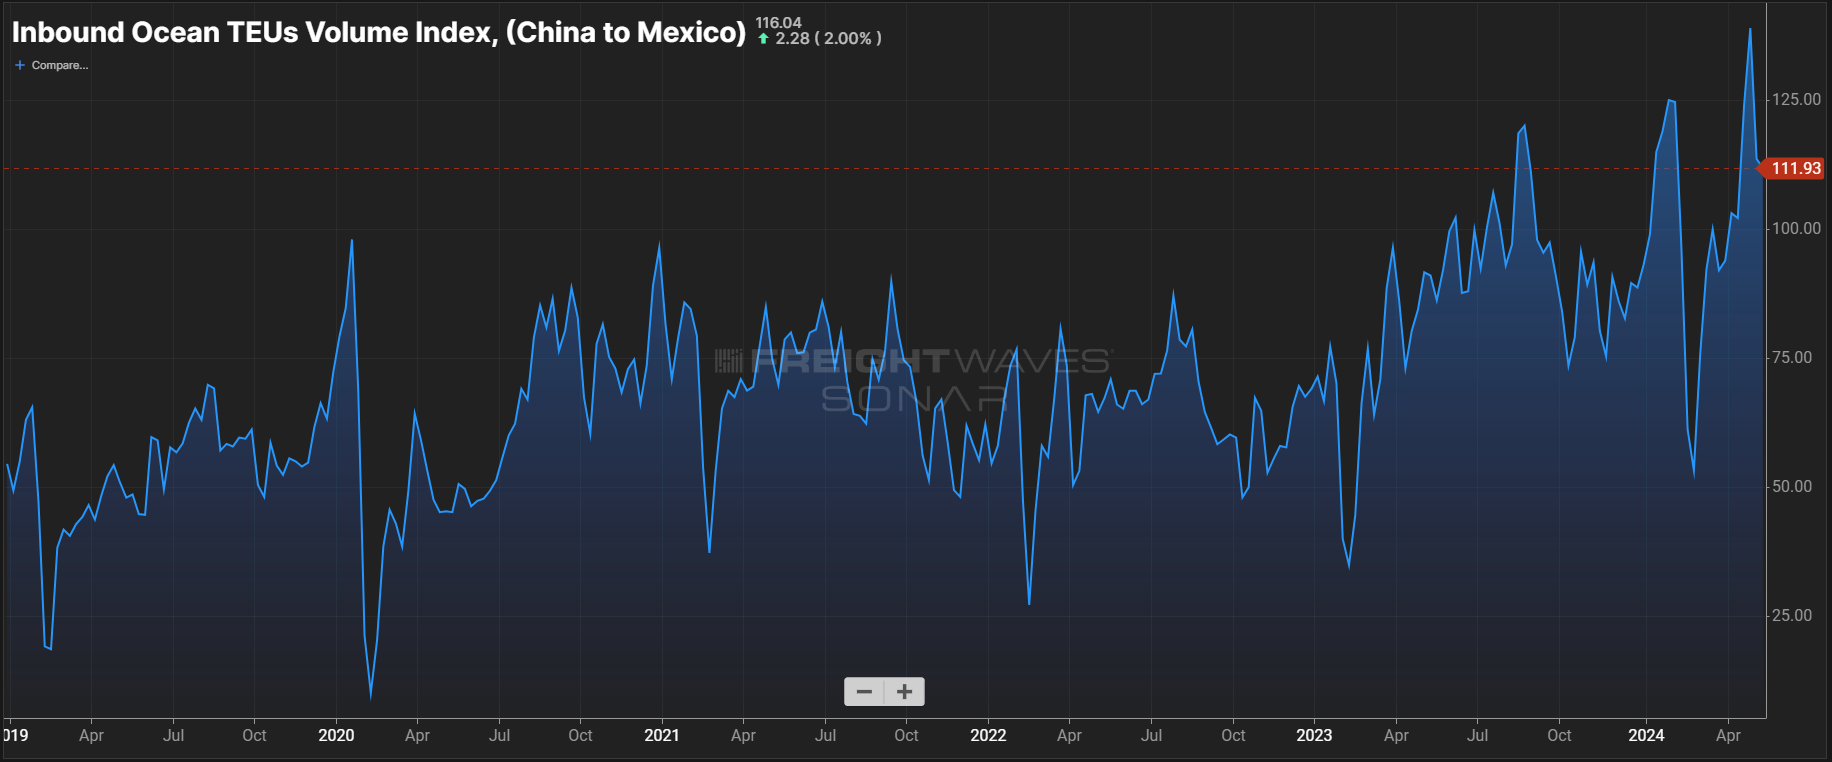 Inbound Ocean TEUs Volume Index, China to Mexico, SONAR
DOT Week spurred regional rate volatility, particularly for reefer capacity. It is unclear how high rates will rise from here, but based on 2023 trends, we anticipate a return to normal seasonality by July rather than a sustained disruption.
Truckstop’s Weekly National Average Spot Rates provide a detailed view of week-to-week movements and a real-time look into the current environment. Rates for all three equipment types are strikingly similar to this time last year, with van and reefer falling within just a few cents of 2023 levels. Given the year-over-year similarity of tender rejection and volume levels, rates will likely tick up this month, decline slightly in early June, and rise again around the Fourth of July and end of Q2. From there, rates should return to baseline levels as seasonal demand subsides.
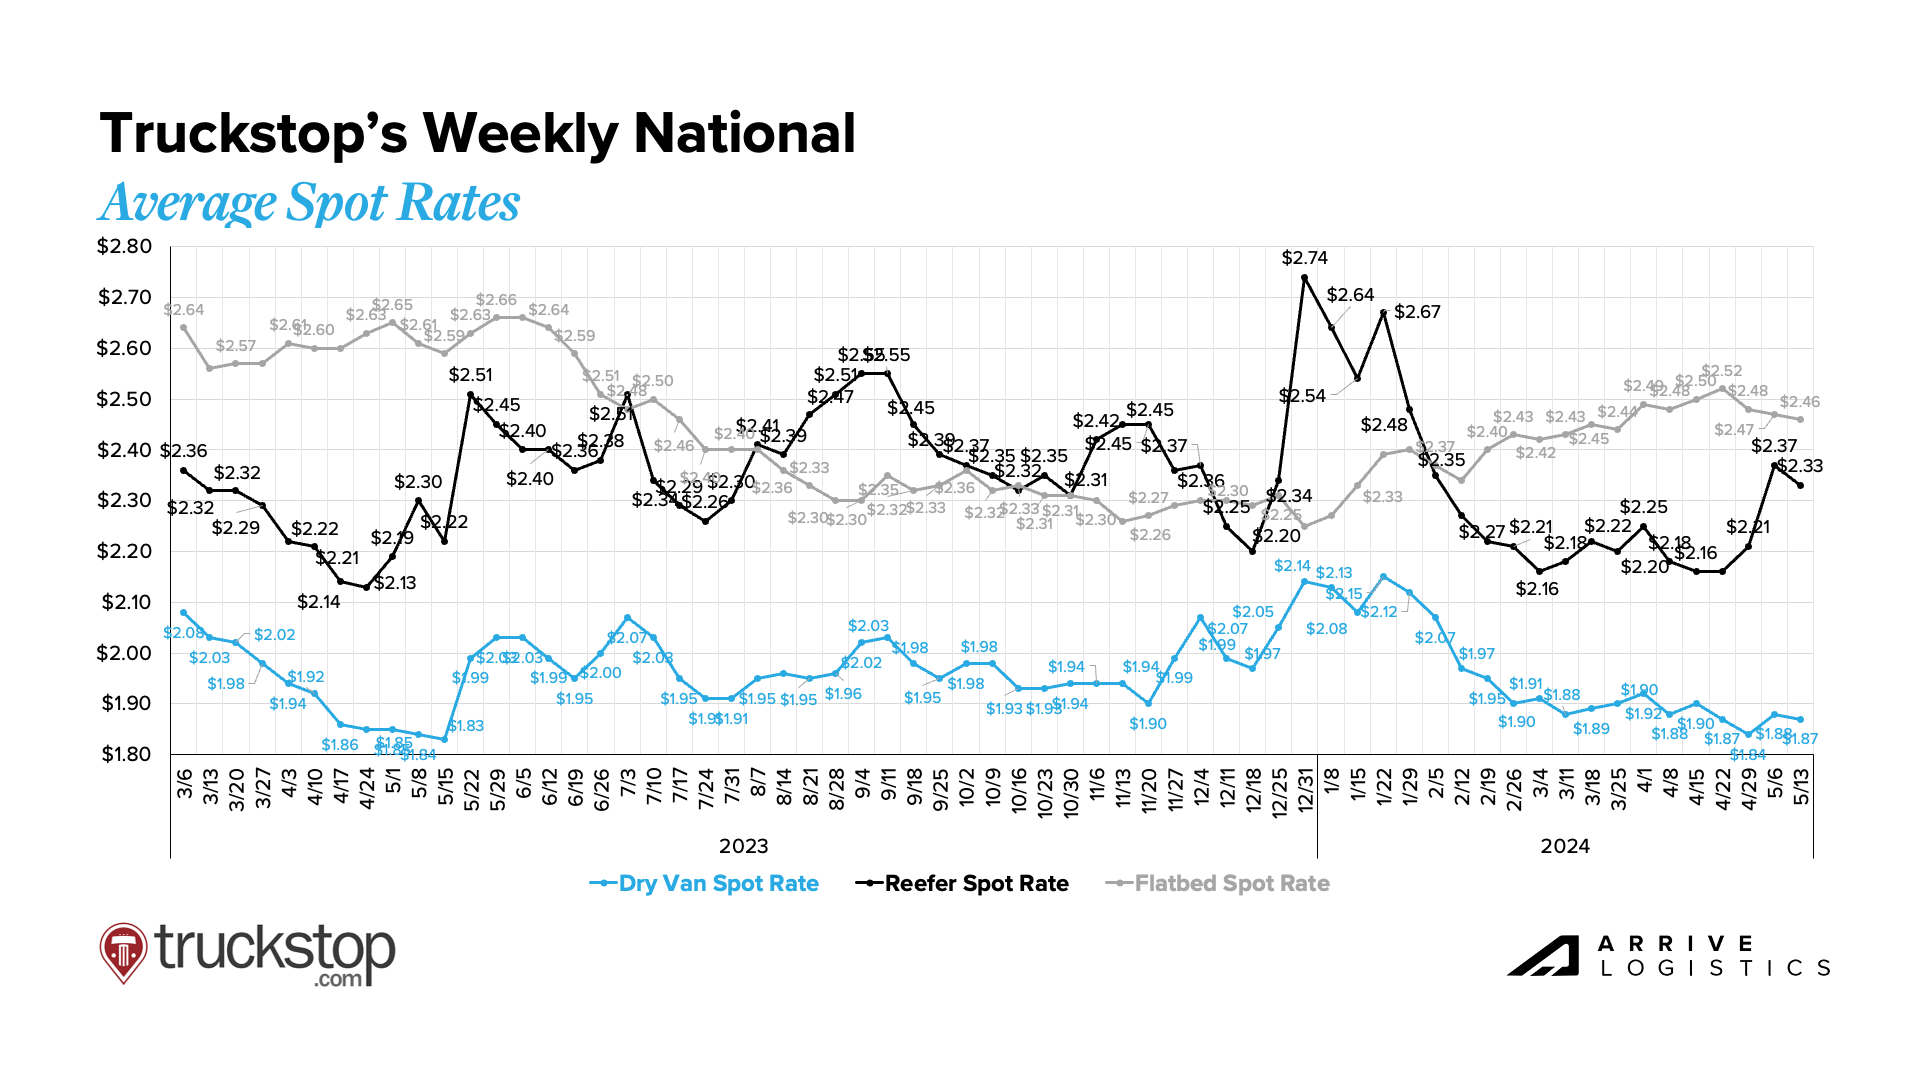 Truckstop Weekly National Spot Rate Average
National diesel prices started to decline again in early May, with the average falling below $4.00 per gallon for the first time since January. Declining fuel costs benefit carriers facing financial pressure due to increased operating costs and low revenue. However, prices could increase again as summer demand ramps up and tensions in the Middle East escalate.
 DAT Fuel Trends
DAT data shows dry van spot rates increased by $0.02 per mile to $1.55 per mile in May, excluding fuel. Contract rates also rose by $0.01 per mile to $2.00 per mile. While national data shows minimal rate movement overall, there is still volatility on a lane-by-lane basis, such as on outbound freight in the Southeast. On the contrary, inbound Southeast rates have decreased as carriers look to capitalize on opportunities in the region.
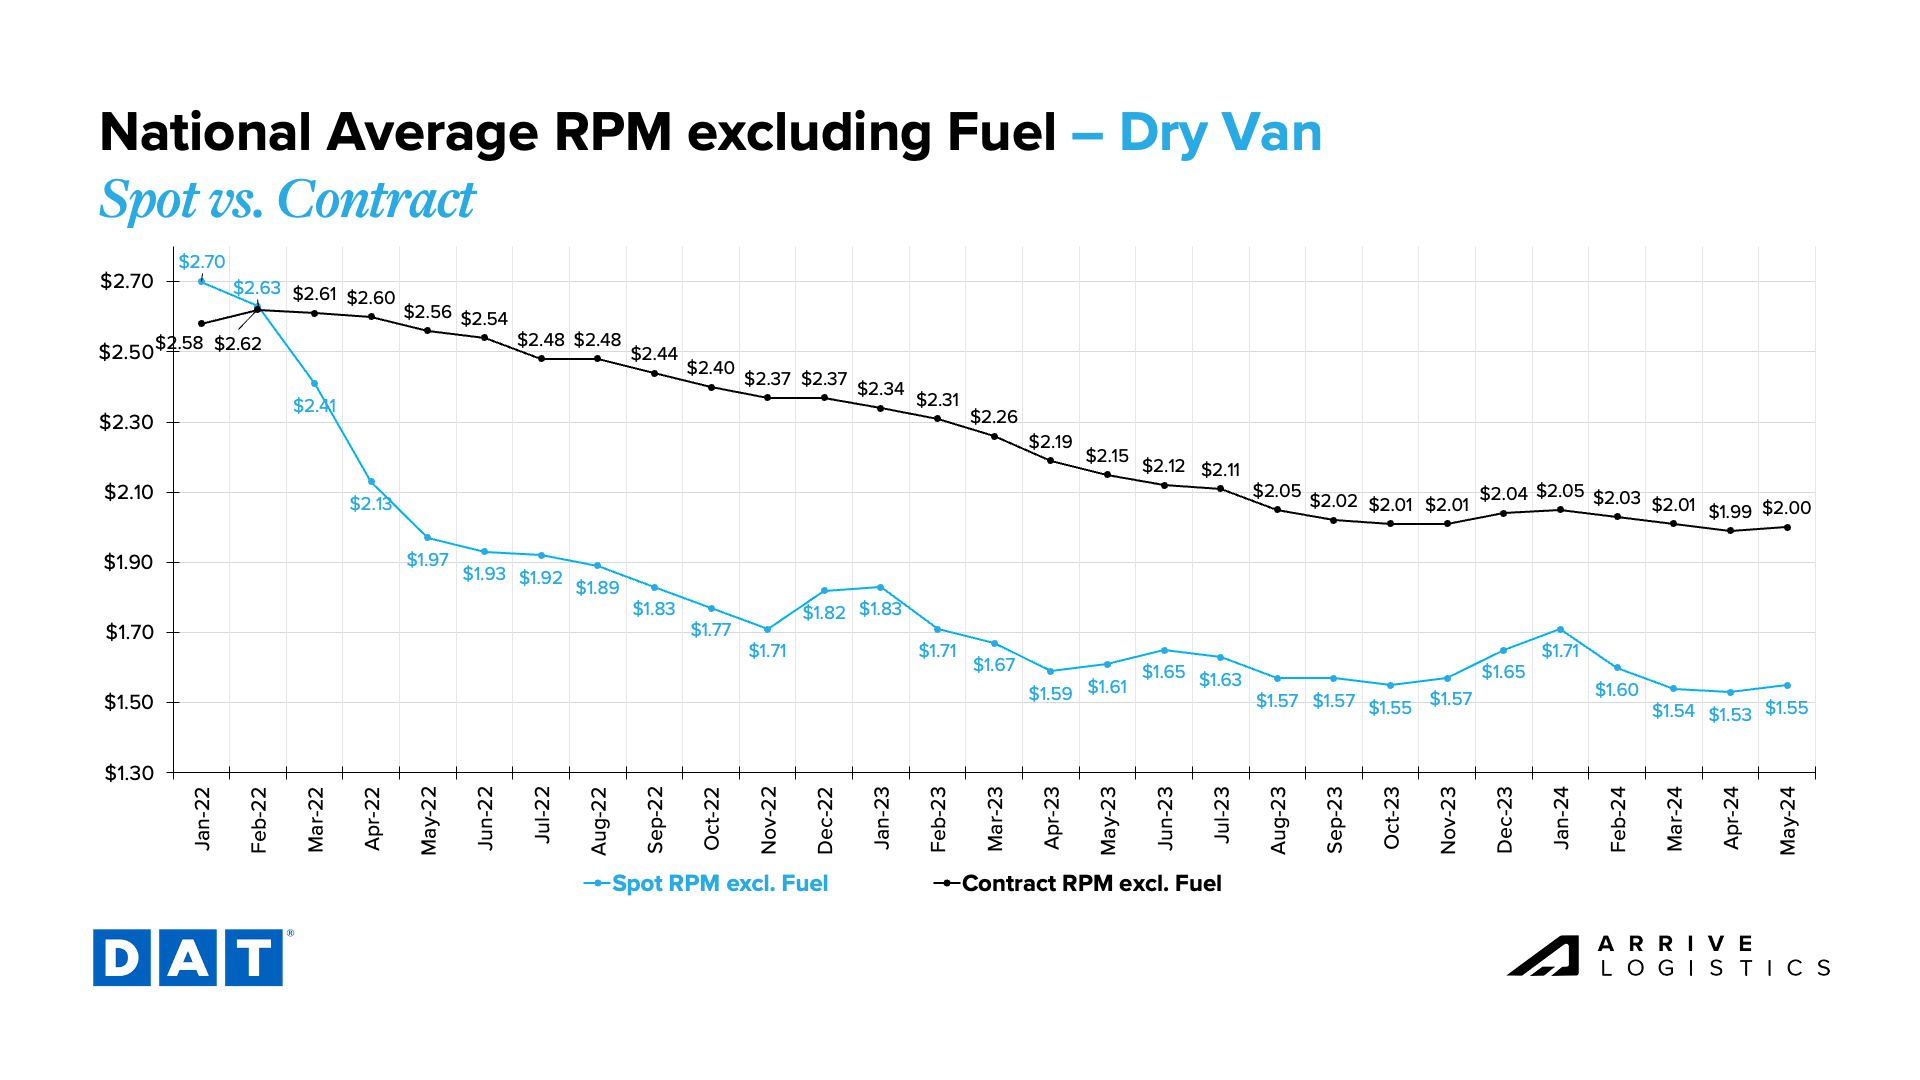 DAT Dry Van National Average RPM Spot vs. Contract
Reefer linehaul spot rates increased by $0.07 per mile to $1.89 per mile in May, aligning with typical seasonal trends for this time of year. Contract rates were flat at $2.32 per mile, excluding fuel. Like dry van, some lanes were more volatile than others; rates out of California and other parts of the West Coast are rising, while inbound rates for the same region declined.
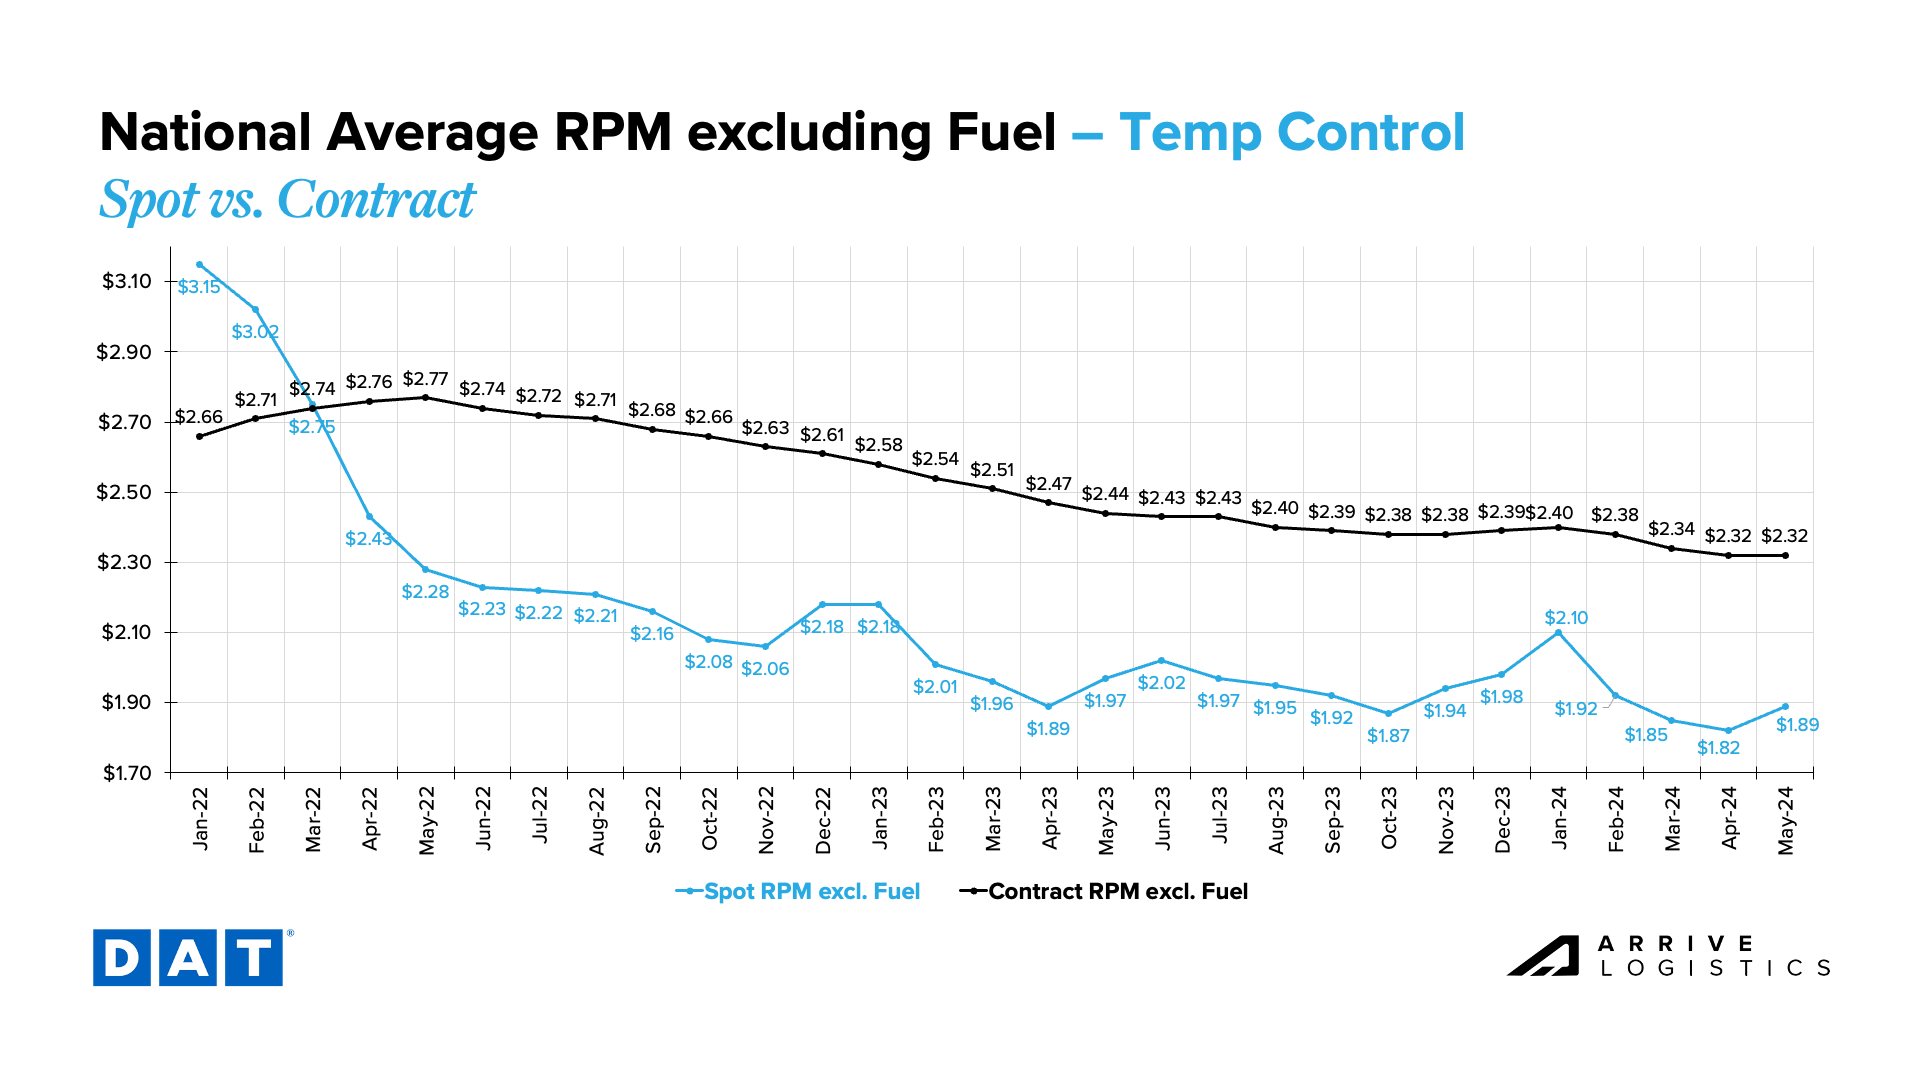 DAT Temp Control National Average RPM Spot vs. Contract
During the first half of May, flatbed spot and contract rates rose by $0.03 per mile and $0.02 per mile, respectively, driven by increased project-related freight demand for heavy equipment and commodities like steel. The gap between spot and contract rates remains large.
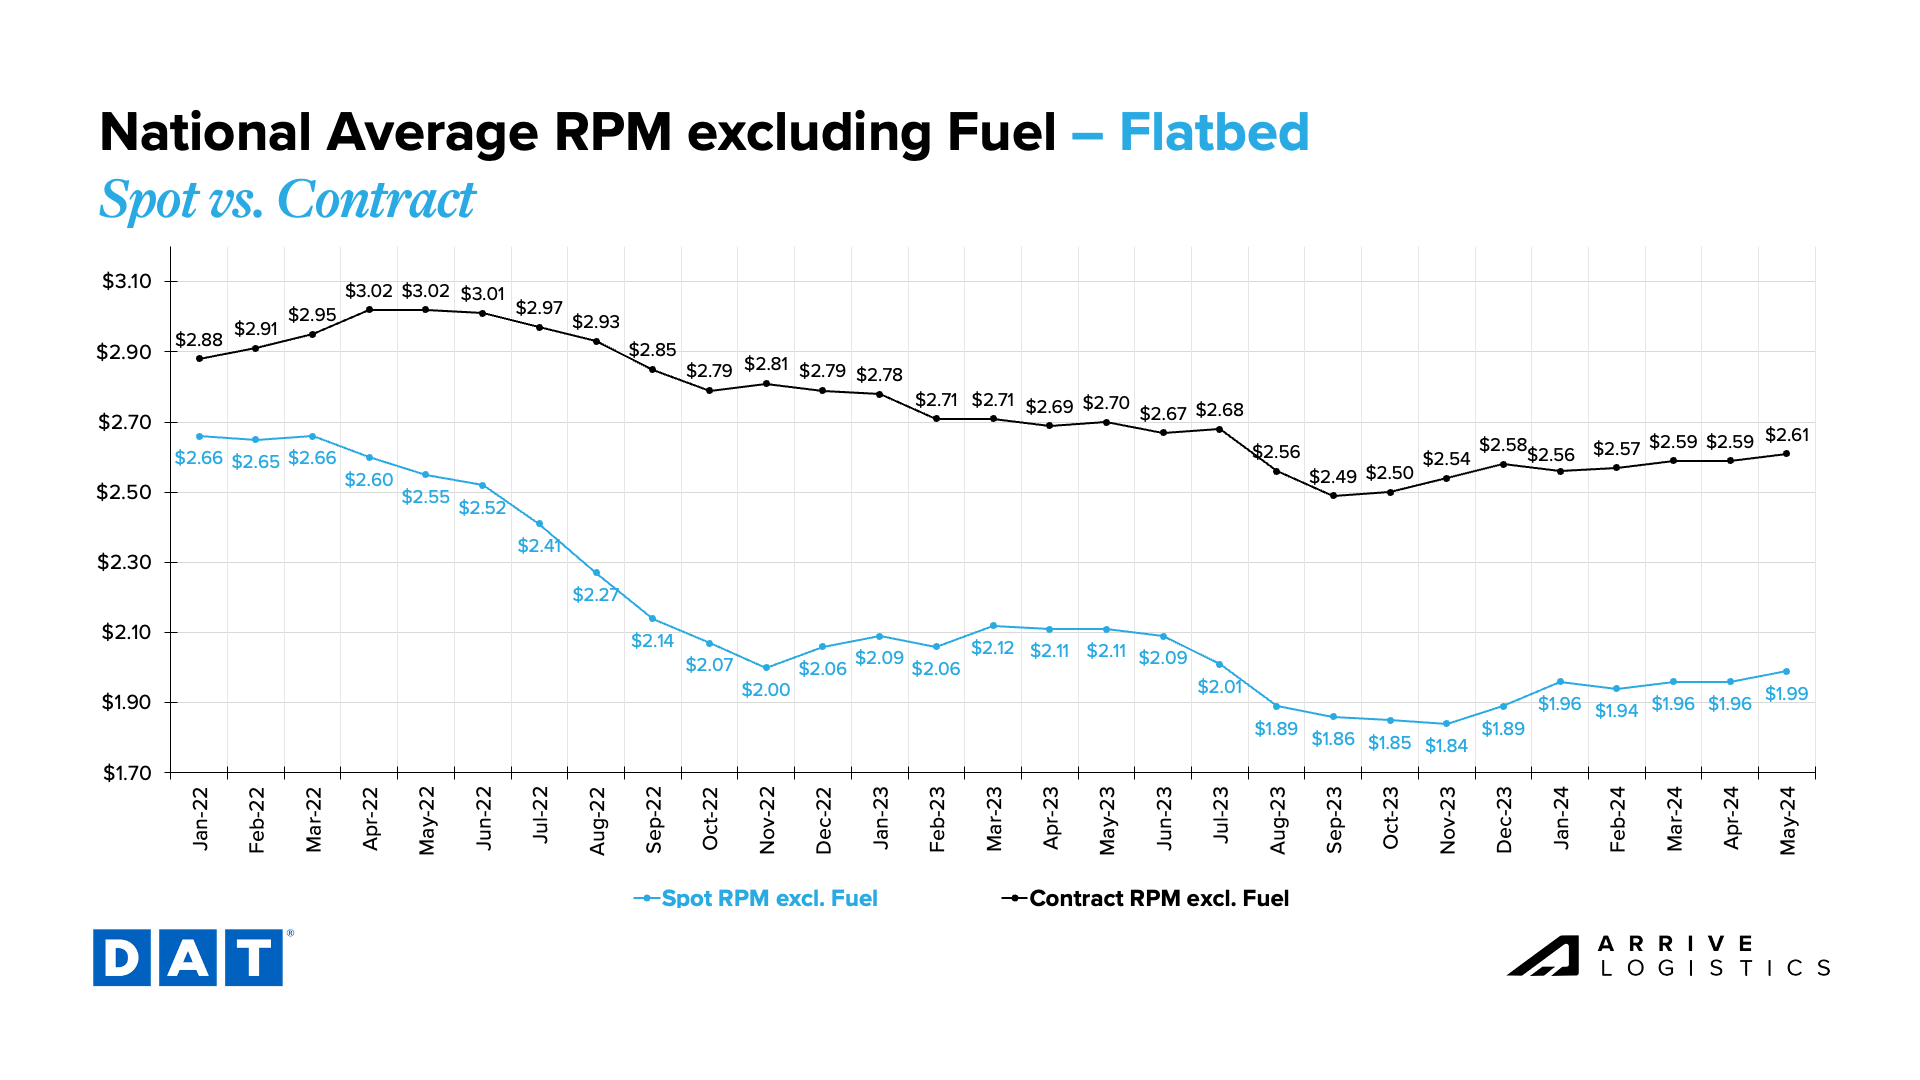 DAT Flatbed National Average RPM Spot vs. Contract
April CPI data cooled to 3.4% from 3.5% in March, which may indicate interest rate cuts are still possible this year, but it is far from certain. Volatile energy costs like gasoline were the primary inflation drivers, while the cost of vehicles and some food items offset those increases. Housing inflation remained flat in April, which may concern policymakers who expected a better result.
Overall, the data is trending in the right direction. More positive readings could lead to interest rate cuts and drive freight demand. However, any near-term cuts are unlikely and could point to broader economic challenges. For now, the best-case scenario is sustained economic strength that allows for adjustment to higher interest rates and recovery in slow sectors.
Bank of America card data showed a 1% year-over-year increase, with spending rising in the service and retail sectors, which should support a strong freight environment. Lower-income households’ after-tax wages and salaries increased, leading the growth rate to outpace middle and upper-tier income households. While encouraging, the cooling labor market could soon present new challenges, such as reduced spending on non-essential goods.
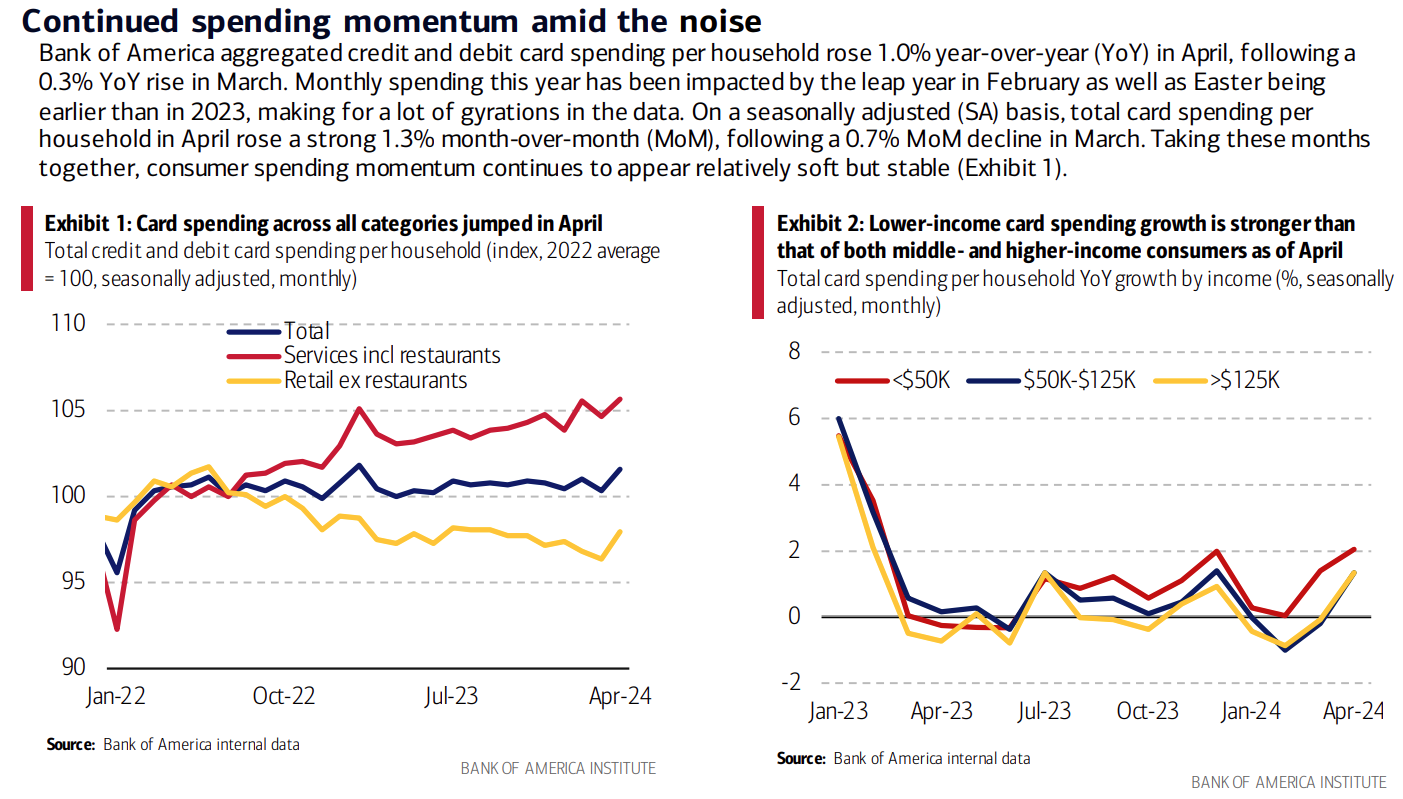 Bank of America, Total Card Spending per Household


