


The Morgan Stanley Dry Van Freight Index measures relative supply; the higher the index, the tighter the market conditions. The black line with triangle markers on the chart provides a great view of what directional trends would be in line with normal seasonality based on historical data dating back to 2007.
Conditions were relatively stable throughout September, underperforming historical seasonality and indicating supply is still largely sufficient to support demand. Historical data points to potential easing conditions through Thanksgiving before tightening through the end of the year.
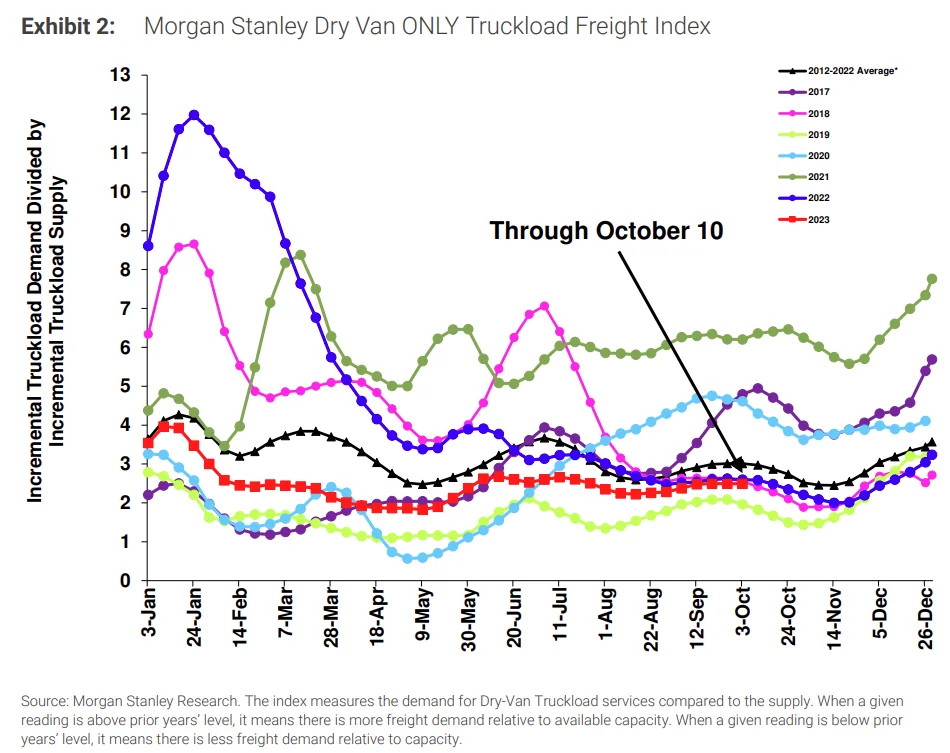 Figure 1: Morgan Stanley Dry Van Truckload Freight Index
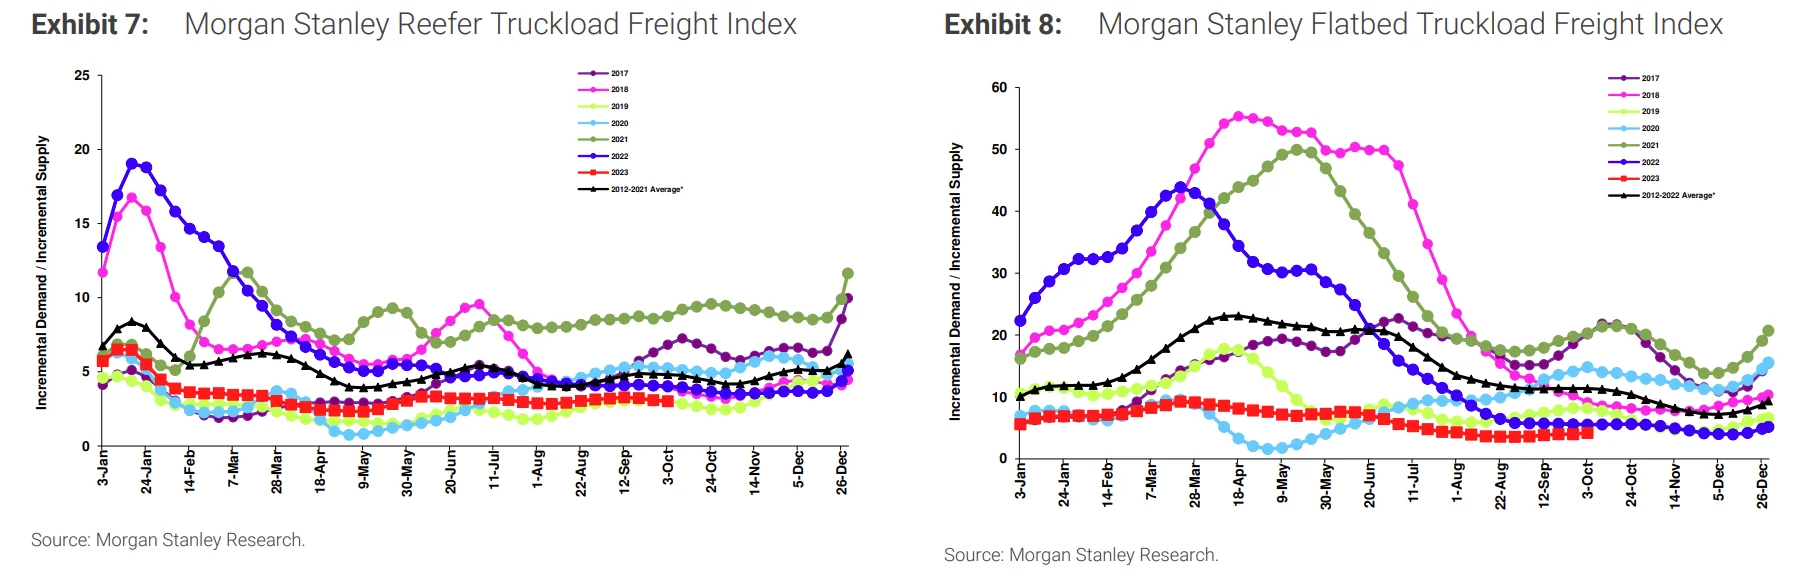 Figures 2 & 3: Morgan Stanley Reefer and Flatbed Truckload Freight Indices
Last month, Arrive launched a new survey designed to help our team better understand the carrier experience in today’s market. The questions gauged sentiment on various economic indicators and asked for predictions on how the next 90 days will unfold. When questioned about the state of the market, over 50% of respondents reported that current conditions are relatively loose, and 25% said they are tight or very tight.
Those results changed when looking 90 days down the road — the consensus was market conditions would either look much like they do today or slightly tighter. 40% of respondents believe conditions will still be loose, and over a quarter say we will be experiencing intermediate conditions. 21% of respondents believe we will be in a tight market, while 12% expect very tight conditions.
 Figure 4: Current Market Conditions, Arrive Carrier Market Survey, October 2023
ACT’s Supply-Demand Index indicated tightening conditions for the first time in 18 months, jumping from 42.2 in July to 55.6 in August due to increased volumes before Labor Day and more carriers exiting the market. However, it is important to note that this index indicates the market’s general direction, not its current state — the market is still soft and will not flip until significant demand or capacity changes occur.
 Figure 5: ACT For-Hire Trucking Survey
At a national level, conditions have eased following the consecutive impacts of Hurricane Idalia and Labor Day, though they are still not as soft as earlier in the year. This is especially true for reefer equipment, which is currently seeing tender rejections at nearly double the rate of van equipment.
The Sonar Outbound Tender Reject Index (OTRI) measures the rate at which carriers reject the freight they are contractually required to take. The numbers fluctuated between a high of 4.38% on the first day of the month and a low of 3.65% by month-end, indicating routing guide compliance on shippers’ contractual freight continually improved from already historically high levels.
 Figure 6: Outbound Tender Reject Index (SONAR)
Tender rejections followed a similar pattern for reefer equipment but spiked as high as 10.9% in early September and finished the month at about 8.5%. With a current value of 7.28%, it is clear that the early Q4 lull is affecting reefer equipment.
As stated a month ago, we agree with those forecasting a muted peak season as Q4 begins; however, the reefer environment could become more challenging as we approach Thanksgiving and Christmas.
 Figures 7 & 8: Van and Reefer Outbound Tender Reject Indices, SONAR
The market is in a demand lull, but volumes will likely rise ahead of the Q4 holiday retail push as we move from October to November. Contract volumes shrank in early October but have since settled. While the Contract Load Accepted Volume (CLAV) index reading is the lowest non-holiday reading since mid-July, it is expected to rise as we approach the holidays.
 Figure 9: Contract Load Accepted Volume Index, SONAR
The DAT Load-to-Truck Ratio measures the total number of loads relative to the total number of trucks posted on their spot board. Despite a meaningful spot load decrease, September data showed relatively flat conditions, indicating truck posts were also down.
The Dry Van Load-to-Truck Ratio was down 1.7% month-over-month and remains down 21% year-over-year, whereas the Reefer Load-to-Truck Ratio was down 22% month-over-month and 45.8% year-over-year. This may seem like a divergence from reefer contract rejection trends, but overall, easing rejections means lower spot demand. So, even though reefer rejections were higher, the fact that they were dropping throughout the month is the likely culprit of declining reefer load-to-truck ratios.
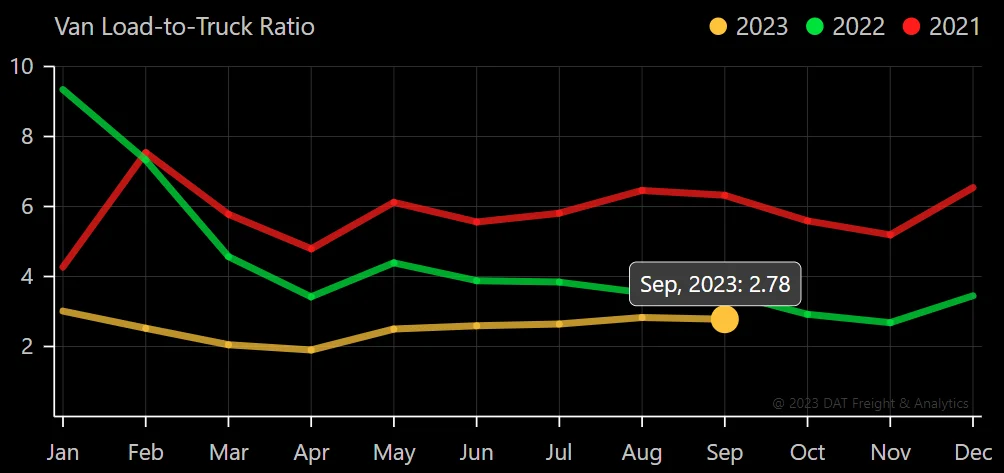 Figure 10: DAT Van Load-To-Truck Ratio
 Figure 11: DAT Reefer Load-To-Truck Ratio
Monthly revocations continue to ease from this year’s peaks but remain highly elevated compared to historical norms. This month, significant revocations again led to a negative net change in the carrier population. Strong contract service numbers indicate the correction is far from over, but this trend will inevitably lead to a capacity crunch, as it always does in the market cycle.
Increased operating expenses are the primary reason for carriers leaving the market. This trend continues to drive record-high revocations of authority, although October totals were the lowest in more than a year at just under 6,400 carriers.
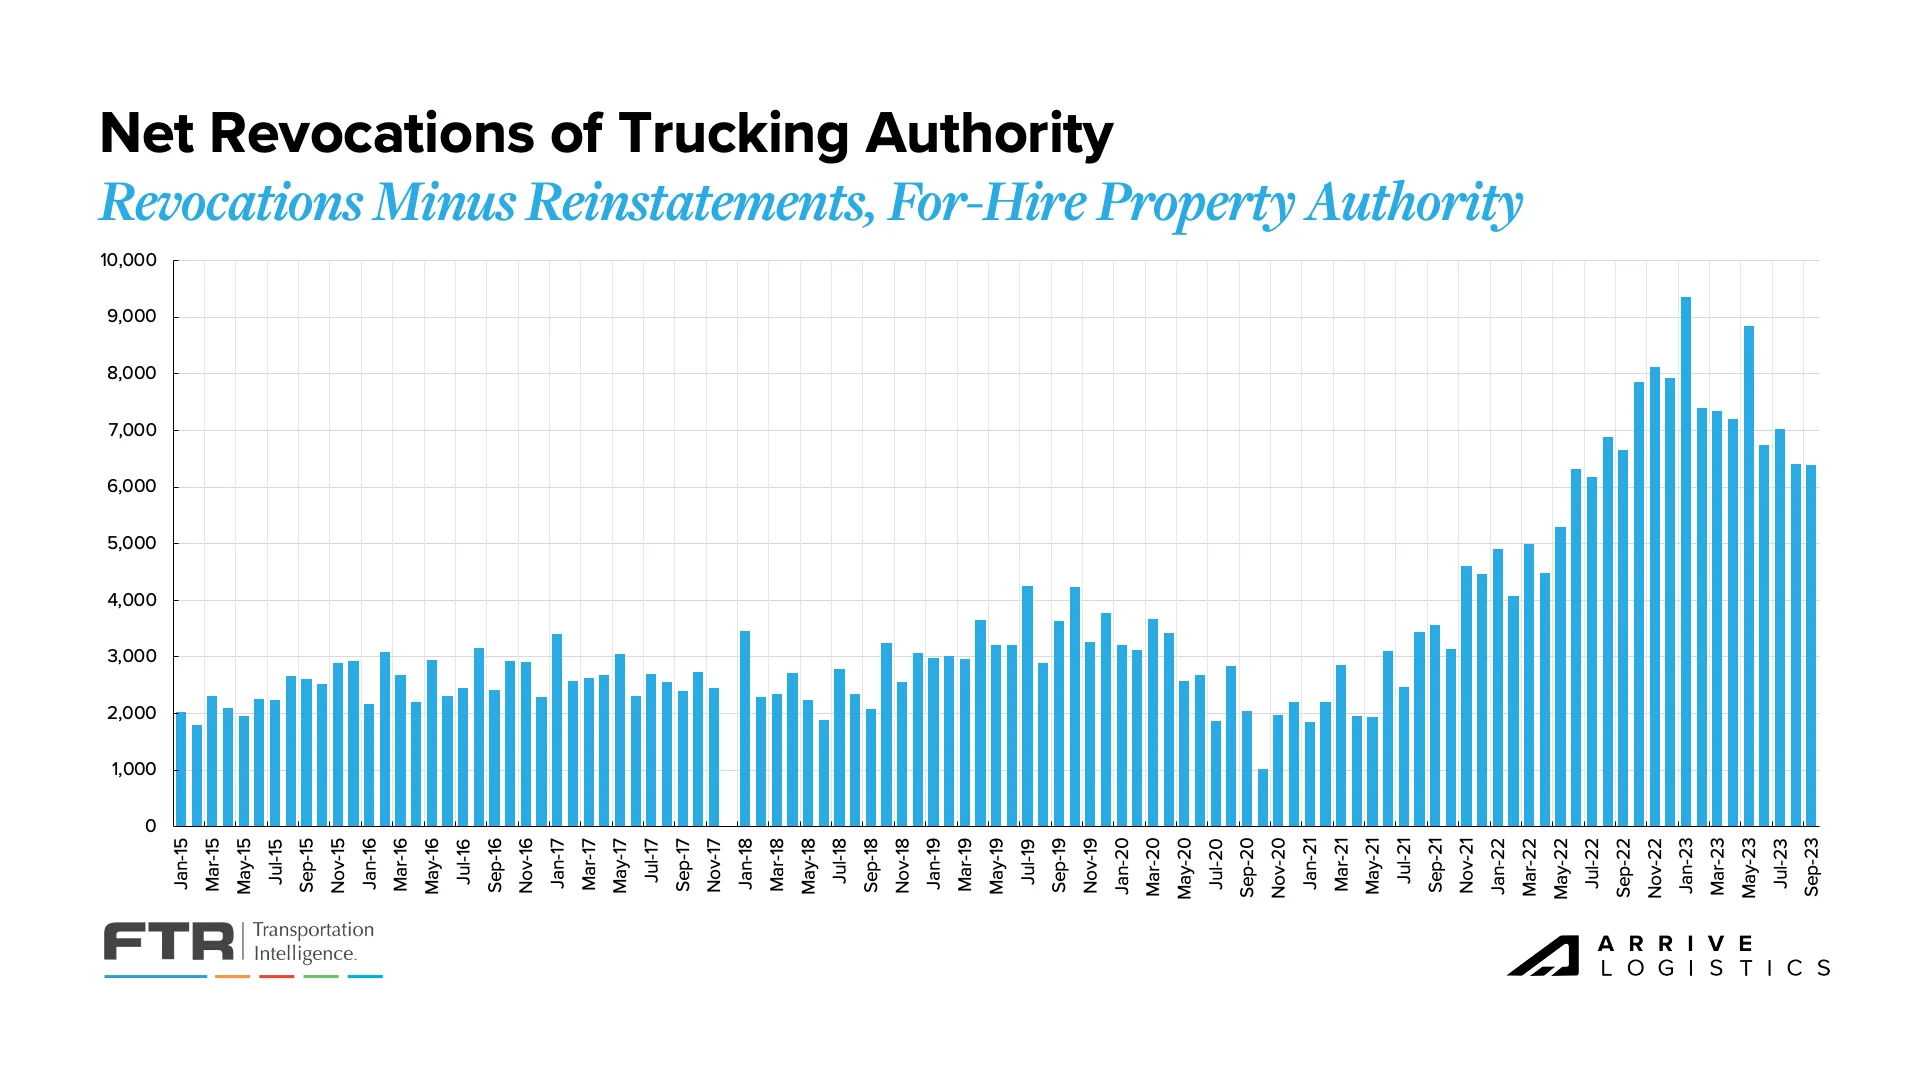 Figure 12: Net Revocations of Trucking Authority: FTR Analysis of FMCSA Data
A key trend we’re still watching is revocations outpacing new carriers entering the market for 11 of the last 12 months, reducing the total number of carriers. A significant amount of capacity that entered the market over the last few years remains under-utilized, so we expect this disparity to continue for at least the near term.
 Figure 13: Net Change in Carrier Population: FTR Analysis of FMCSA Data
According to FTR, September Class 8 Truck orders shot up to 31,200, more than double the August reading of nearly 15,000. The jump is primarily due to 2024 build slots opening; however, it also indicates financially healthy carriers are willing to invest in new equipment despite lower margins. While how many of these orders are for replacement purposes remains to be seen, it is safe to assume that certain carriers are ordering equipment to prepare for the next market upcycle.
 Figure 14: New Truck Order, Class 8: FTR Analysis of FMCSA Data
Class 8 Tractor backlogs saw the first uptick of 2023 in September as 2024 build slots opened. ACT Research estimates that the backlog rose to 101,500 units in September, up 9,300 units from 92,300 in August. It remains to be seen whether the surge will continue into 2024.
The backlog-to-build ratio also rose from 5.1 months in August to 6.1 months in September, driven primarily by the surge in new orders. It will likely level out as production continues to operate at full capacity.
 Figure 15: ACT U.S. Class 8 Tractors Backlog
ACT’s Driver Availability index reported near-record readings again as employment held steady amid declining truckload demand. The index primarily represents larger fleets and thus may not be as accurate for owner-operators or smaller fleets. As these drivers continue to join larger fleets to avoid the negative impact of low spot rates, overall driver availability increases, as seen in this index.
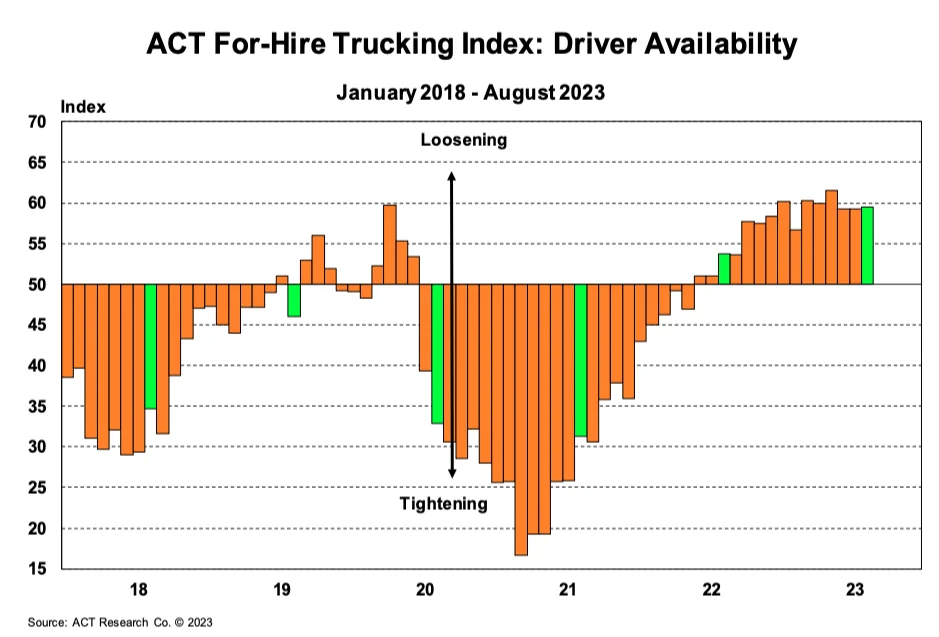 Figure 16: ACT For-Hire Trucking Index: Driver Availability
In the aforementioned survey, we also asked carriers to share their opinions on truckload supply today versus three months from now. 58% of respondents said that truckload supply today is relatively balanced, 16% said it is plentiful, and 30% said it is limited. As for the 90-day forecast, a few more carriers predict capacity will be plentiful, which aligns with our expectations given the current state of available capacity.
 Figure 17: Current Outlook of Truckload Supply, Arrive Carrier Market Survey, October 2023
We also asked carriers for their opinion on current and future truckload demand. 47% said current demand is neutral, 32% said it’s relatively weak, and the remaining 21% said it’s strong. These numbers represent that the current demand market continues to remain in flux, and is weaker than the demand environment experienced over the past few years.
As for the 90-day forecast, more than half (56%) of respondents said demand would be neutral, and 26% said it would be strong. These results align with our expectations that demand will increase through Q4 of 2023, albeit relatively muted compared to the past few years.
 Figure 18: Current Outlook of Truckload Demand, Arrive Carrier Market Survey, October 2023
The National Retail Federation (NRF) recently reported that while the consumer remains strong, spending growth underperformed expectations and may worsen. In turn, low retail import volumes will likely last through year-end.
Consumer behavior through this year’s peak retail season should be a strong indicator of retail import volumes in 2024. NRF Vice President Jonathan Gold said, “Cargo volumes will still be strong the rest of the year, but not as high as we expected a month ago.” This means we are unlikely to see any surprises during peak season.
If import volumes trend as expected through Q4, the 13.5% year-over-year decline in July could flip to a nearly 9% increase in year-over-year import growth by December. This gives some context to how the inventory cycle’s reset could impact demand and just how large a step back retailers took a year ago to correct their overstocked inventories.
![]() Figure 19: NRF Monthly Imports
Figure 19: NRF Monthly Imports
The DAT reports exclusively on spot load trends and noted that posts were down 12.3% from August to September after increasing from July to August. The annual comps still showed a year-over-year decline, with spot load posts regressing slightly from -41.4% in August to -43.4% in September. Of additional note, spot load posts were down 15.7% from the last week of September to the first week of October, highlighting ongoing regression.
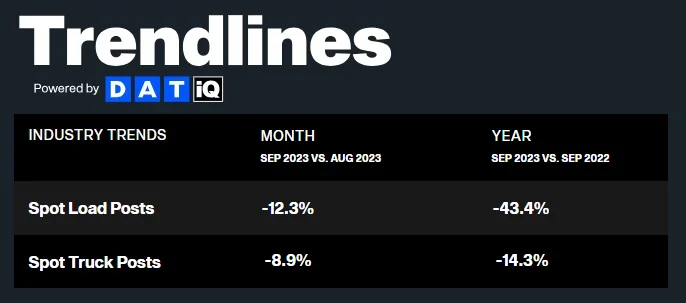 Figure 20: DAT Trendlines
Spot rates continue to stabilize but remain well below operating costs for public carriers, who reported negative margins on spot loads for the third quarter in a row. This trend will likely affect owner-operators and carriers with high spot exposure, potentially leading them to close or join larger fleets. Historically, there would be a rapid rise in spot rates when this occurs. However, capacity is still plentiful despite this trend, indicating that conditions could remain rough in the near term.
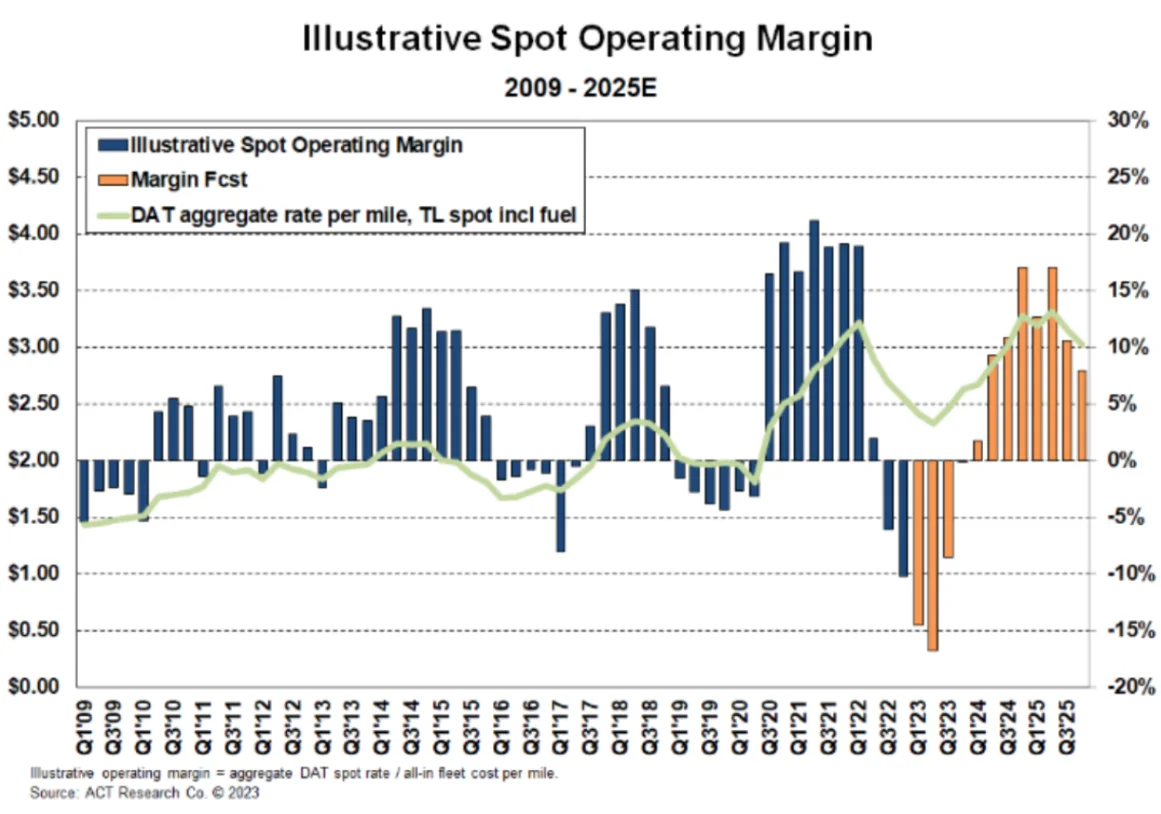 Figure 21: ACT Illustrative Spot Operating Margin
Carriers continue to experience margin compression amid low spot rates and high operating expenses. Net income margins in Q2 2023 dipped below 5% for the first time since the onset of the pandemic. Q2 was also the fourth straight quarter where carriers reported a year-over-year margin decline. As we move through this oversupplied market, conditions will likely be tough for the near term and into early 2024.

Figure 22: ACT TL Carrier Database, Net Income Margin, Core Carriers
According to financial data provided by larger public carriers, operating revenue per mile is still falling faster than cost per mile. This has lowered operating margins to pre-pandemic levels. Despite the sizeable margin decline, large asset carriers are still in a relatively healthy financial position due to having more contract freight. On the flip side, owner-operators and smaller fleets with high spot market exposure are experiencing more margin compression and being forced to either close or join larger fleets.
 Figure 23: ACT Research, Revenue vs. Cost for Large Publicly Traded Carriers
The survey responses regarding current and future driver availability were very similar. In both scenarios, 18% of respondents reported limited driver availability, while over half said it was balanced. Nearly a third of all respondents said driver availability is high today and will still be three months from now. These results indicate capacity is plentiful and will be for some time as drivers with access to contract freight remain healthy and larger fleets continue to absorb capacity from smaller fleets and owner-operators.
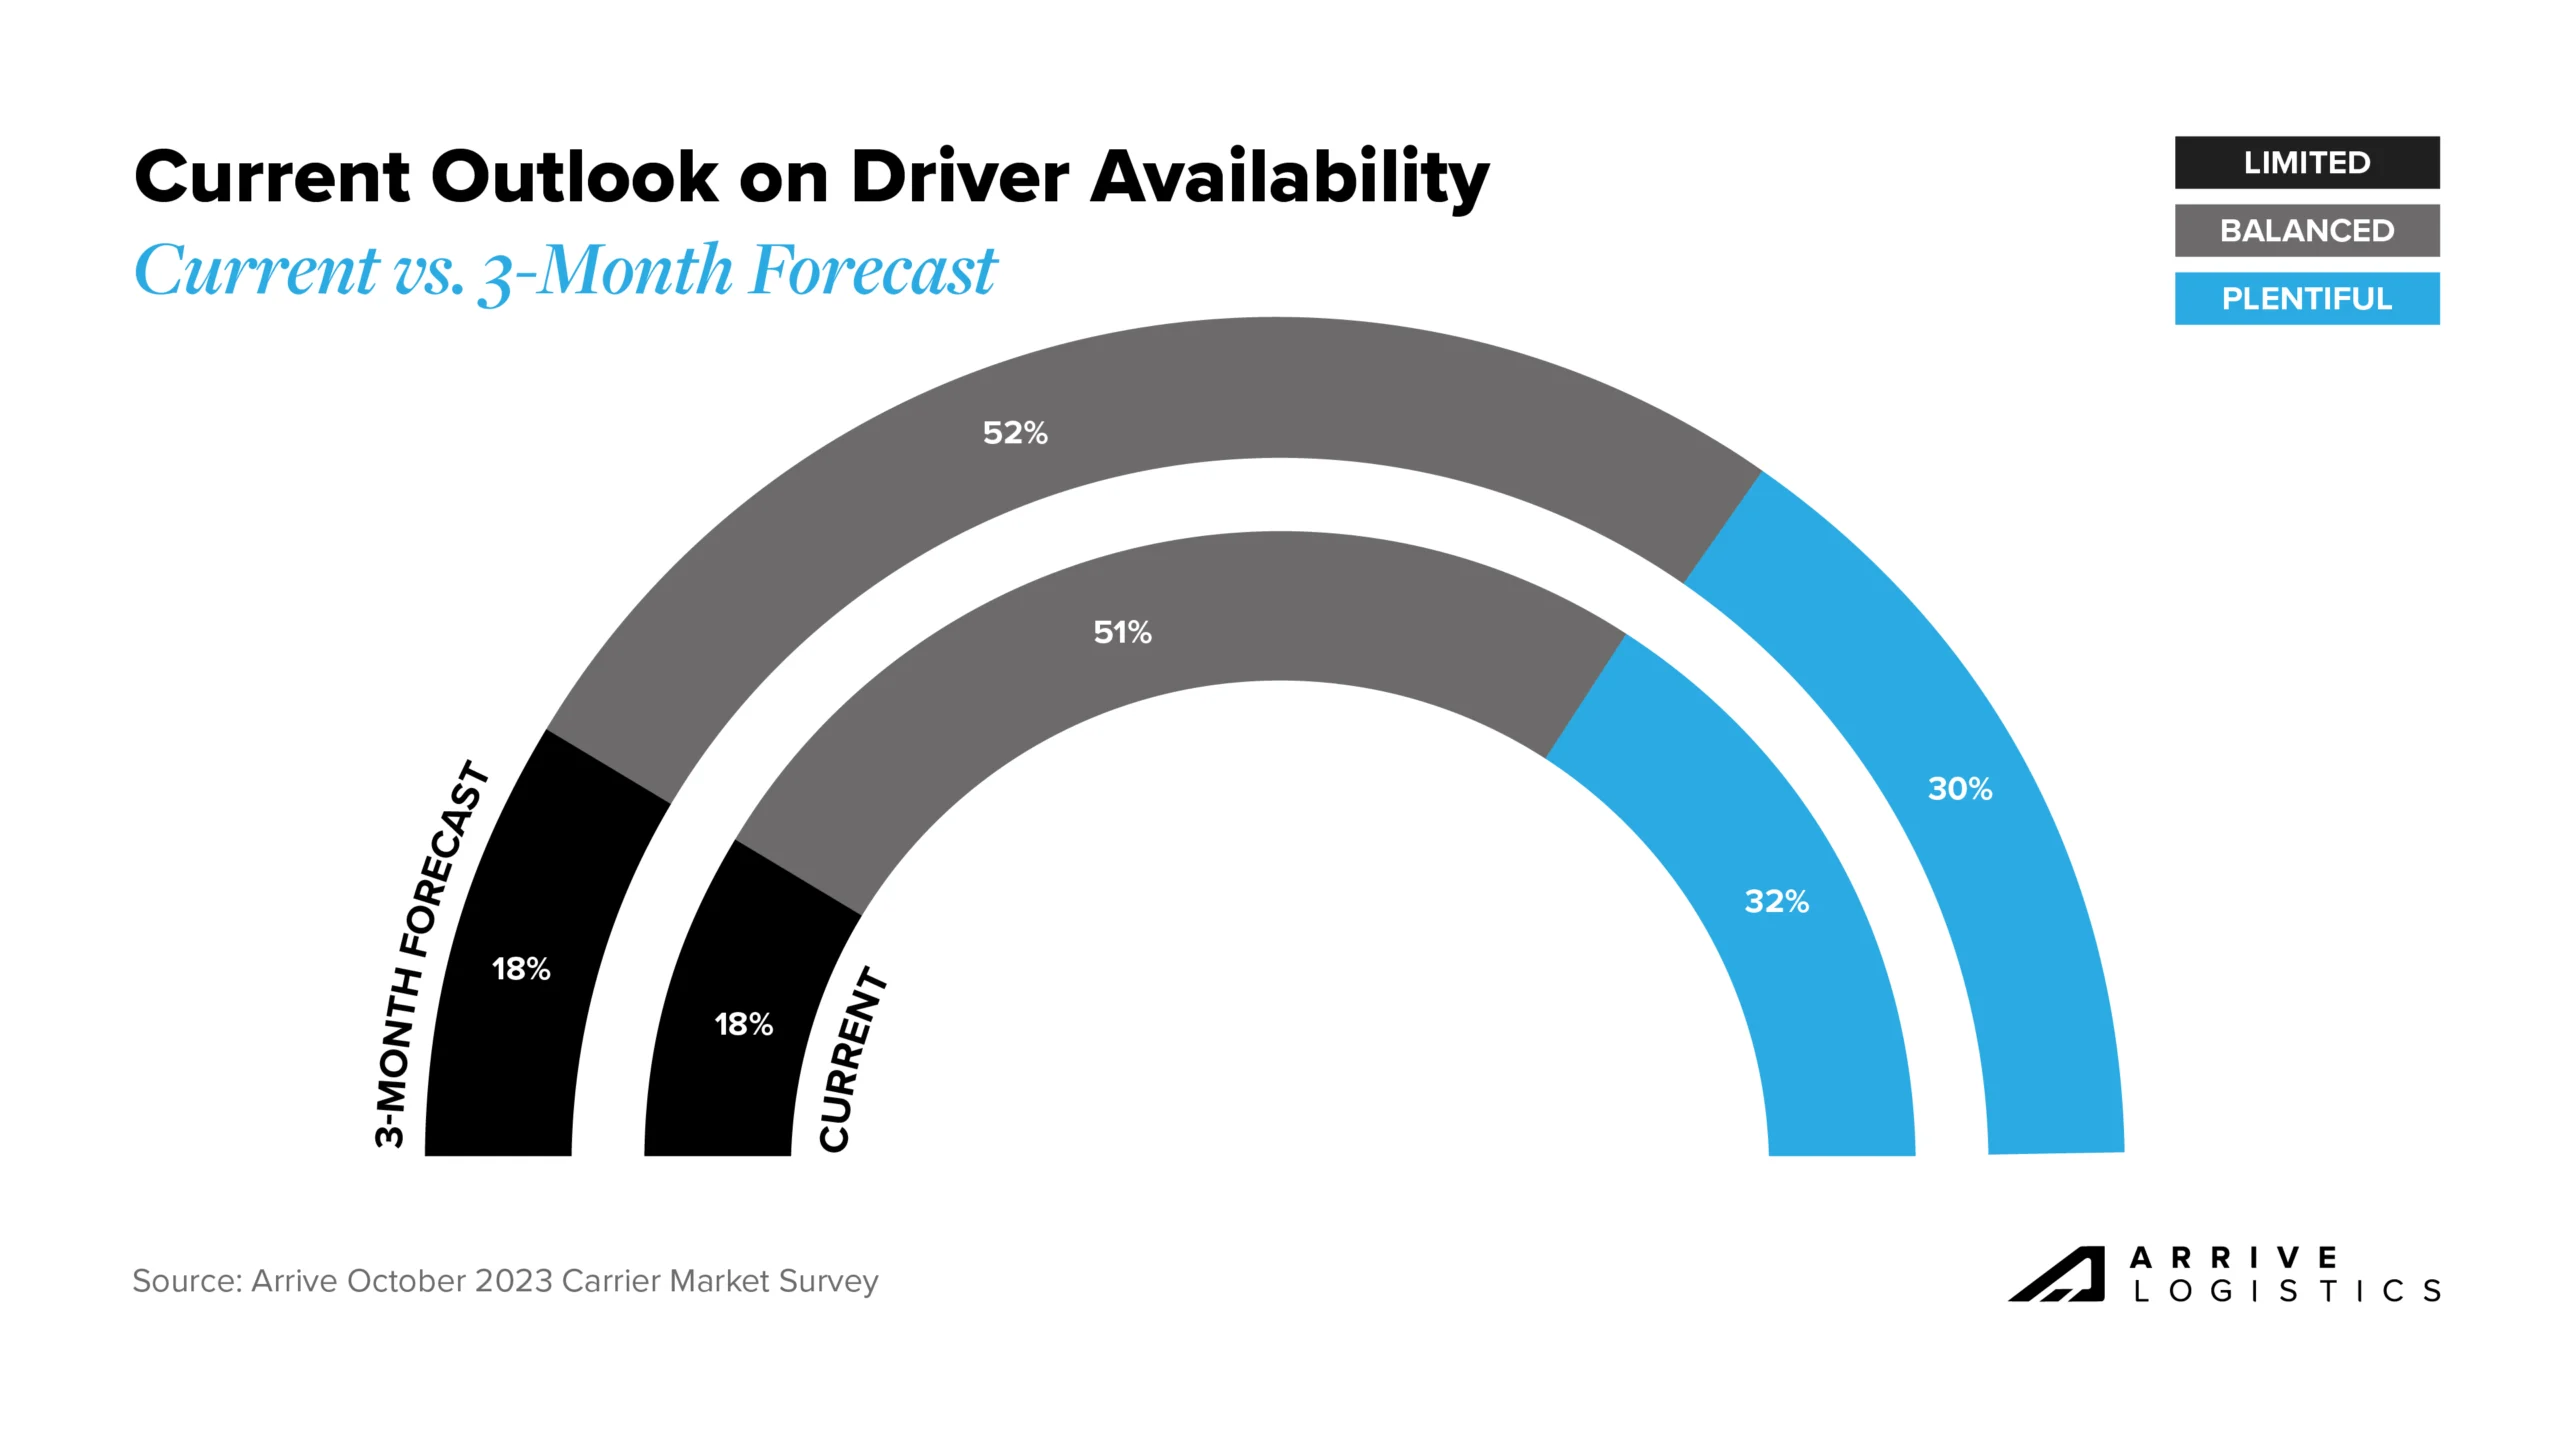 Figure 24: Current Outlook on Driver Availability, Arrive Carrier Market Survey, October 2023
Truckstop’s Weekly National Average Spot Rates index provides a detailed view of week-to-week rate movements and a real-time look into the current rate environment.
Following tender rejection trends, rates for van and reefer equipment show signs of easing early in Q4, while flatbed rates appear to have found a floor. Soft market conditions should continue for all three equipment types through at least mid-November, when peak retail seasonality begins.
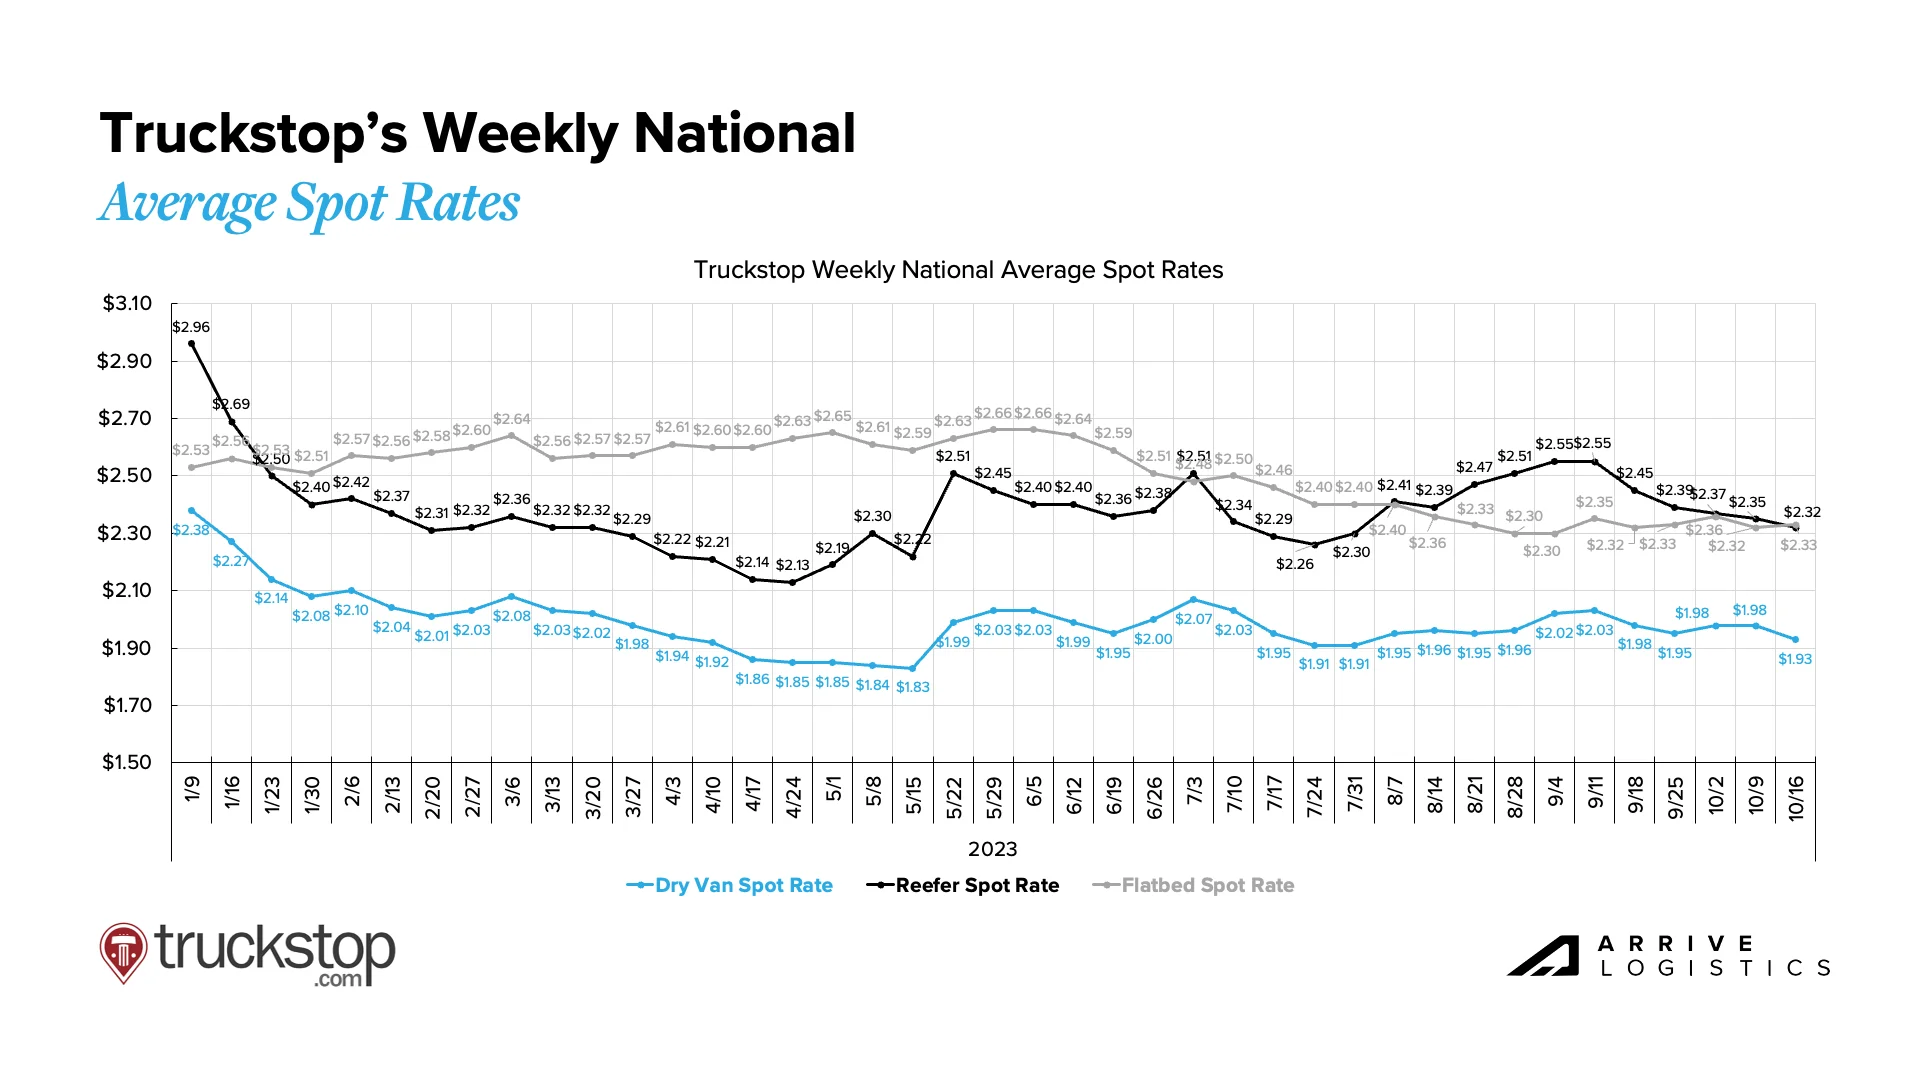
Figure 25: Truckstop Weekly National Average Spot Rates
The month-over-month van rate spread increased slightly from $0.48 in September to $0.50 month-to-date in October.
All-in dry van spot rates are down 13.6% year-over-year in October, while linehaul spot rates are down 11.9%, the lowest negative growth rate since April 2022. All-in dry van contract rates are down 15.0% year-over-year, and linehaul contract rates are down 14.2%. These improvements continue to illustrate that peak deflationary pressures are behind us.
 Figure 26: DAT Dry Van National Average RPM Spot vs. Contract
Monthly reefer rates fell for the fourth consecutive month, pointing to a new floor for spot rates early in October. Though somewhat misleading when considering the weekly rate trends, it still indicates that the market is in a lull typical for this time of year.
After hitting an April high of $0.58, the reefer spot-contract rate spread dipped as low as $0.41 when spot rates peaked in June but is back up to $0.49 in early October. Reefer spot rates will likely find a floor relatively quickly, enabling the gap between spot and contract rates to close again as contract rates continue to undergo downward pressure.
The current reefer contract rate is down 11.3% year-over-year to $2.36 per mile, excluding fuel, while the current reefer spot rate is down 10.1% year-over-year to $1.87 per mile, excluding fuel.
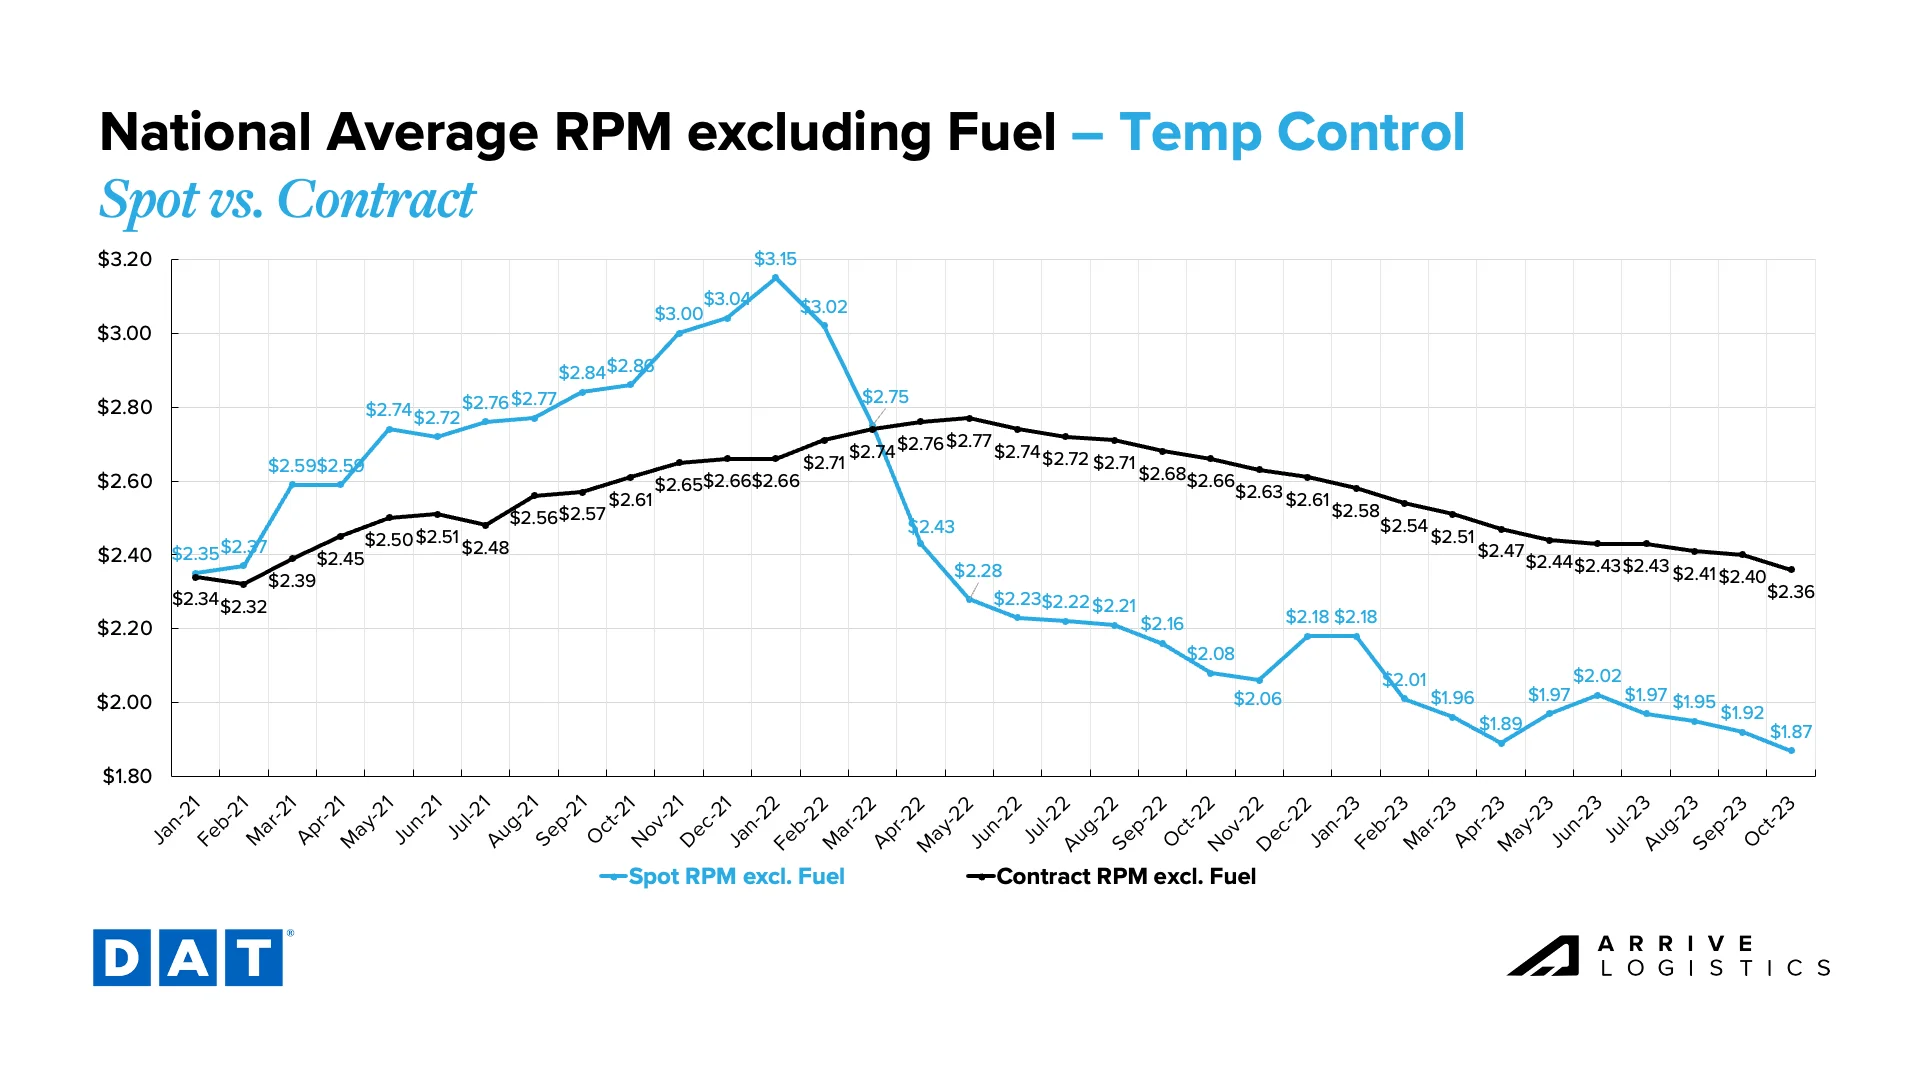 Figure 27: DAT Temp Control National Average RPM Spot vs. Contract
After stabilizing in the first half of 2023, flatbed rates declined rapidly from June through August and have since found a new floor, lower than the cycle low we experienced in April. Contract rates fell at a similar rate, keeping the spot-contract gap near an all-time high of $0.66 per mile. In October, spot rates are currently $1.85 and contract at $2.51 per mile, excluding fuel.
 Figure 28: Flatbed National Average RPM Spot vs. Contract
We also asked carriers about their truckload rates today versus one year ago. Unsurprisingly, 81% of respondents reported rates were down year-over-year, while 14% reported flat rates and 5% reported higher rates.
When asked to share rate trend projections for the next 90 days, over half of respondents said rates will decline, 21% said they will be flat, and 21% believe increases are coming. This range of responses accurately depicts the collective uncertainty about current market conditions and whether the holiday demand push will be strong or muted.
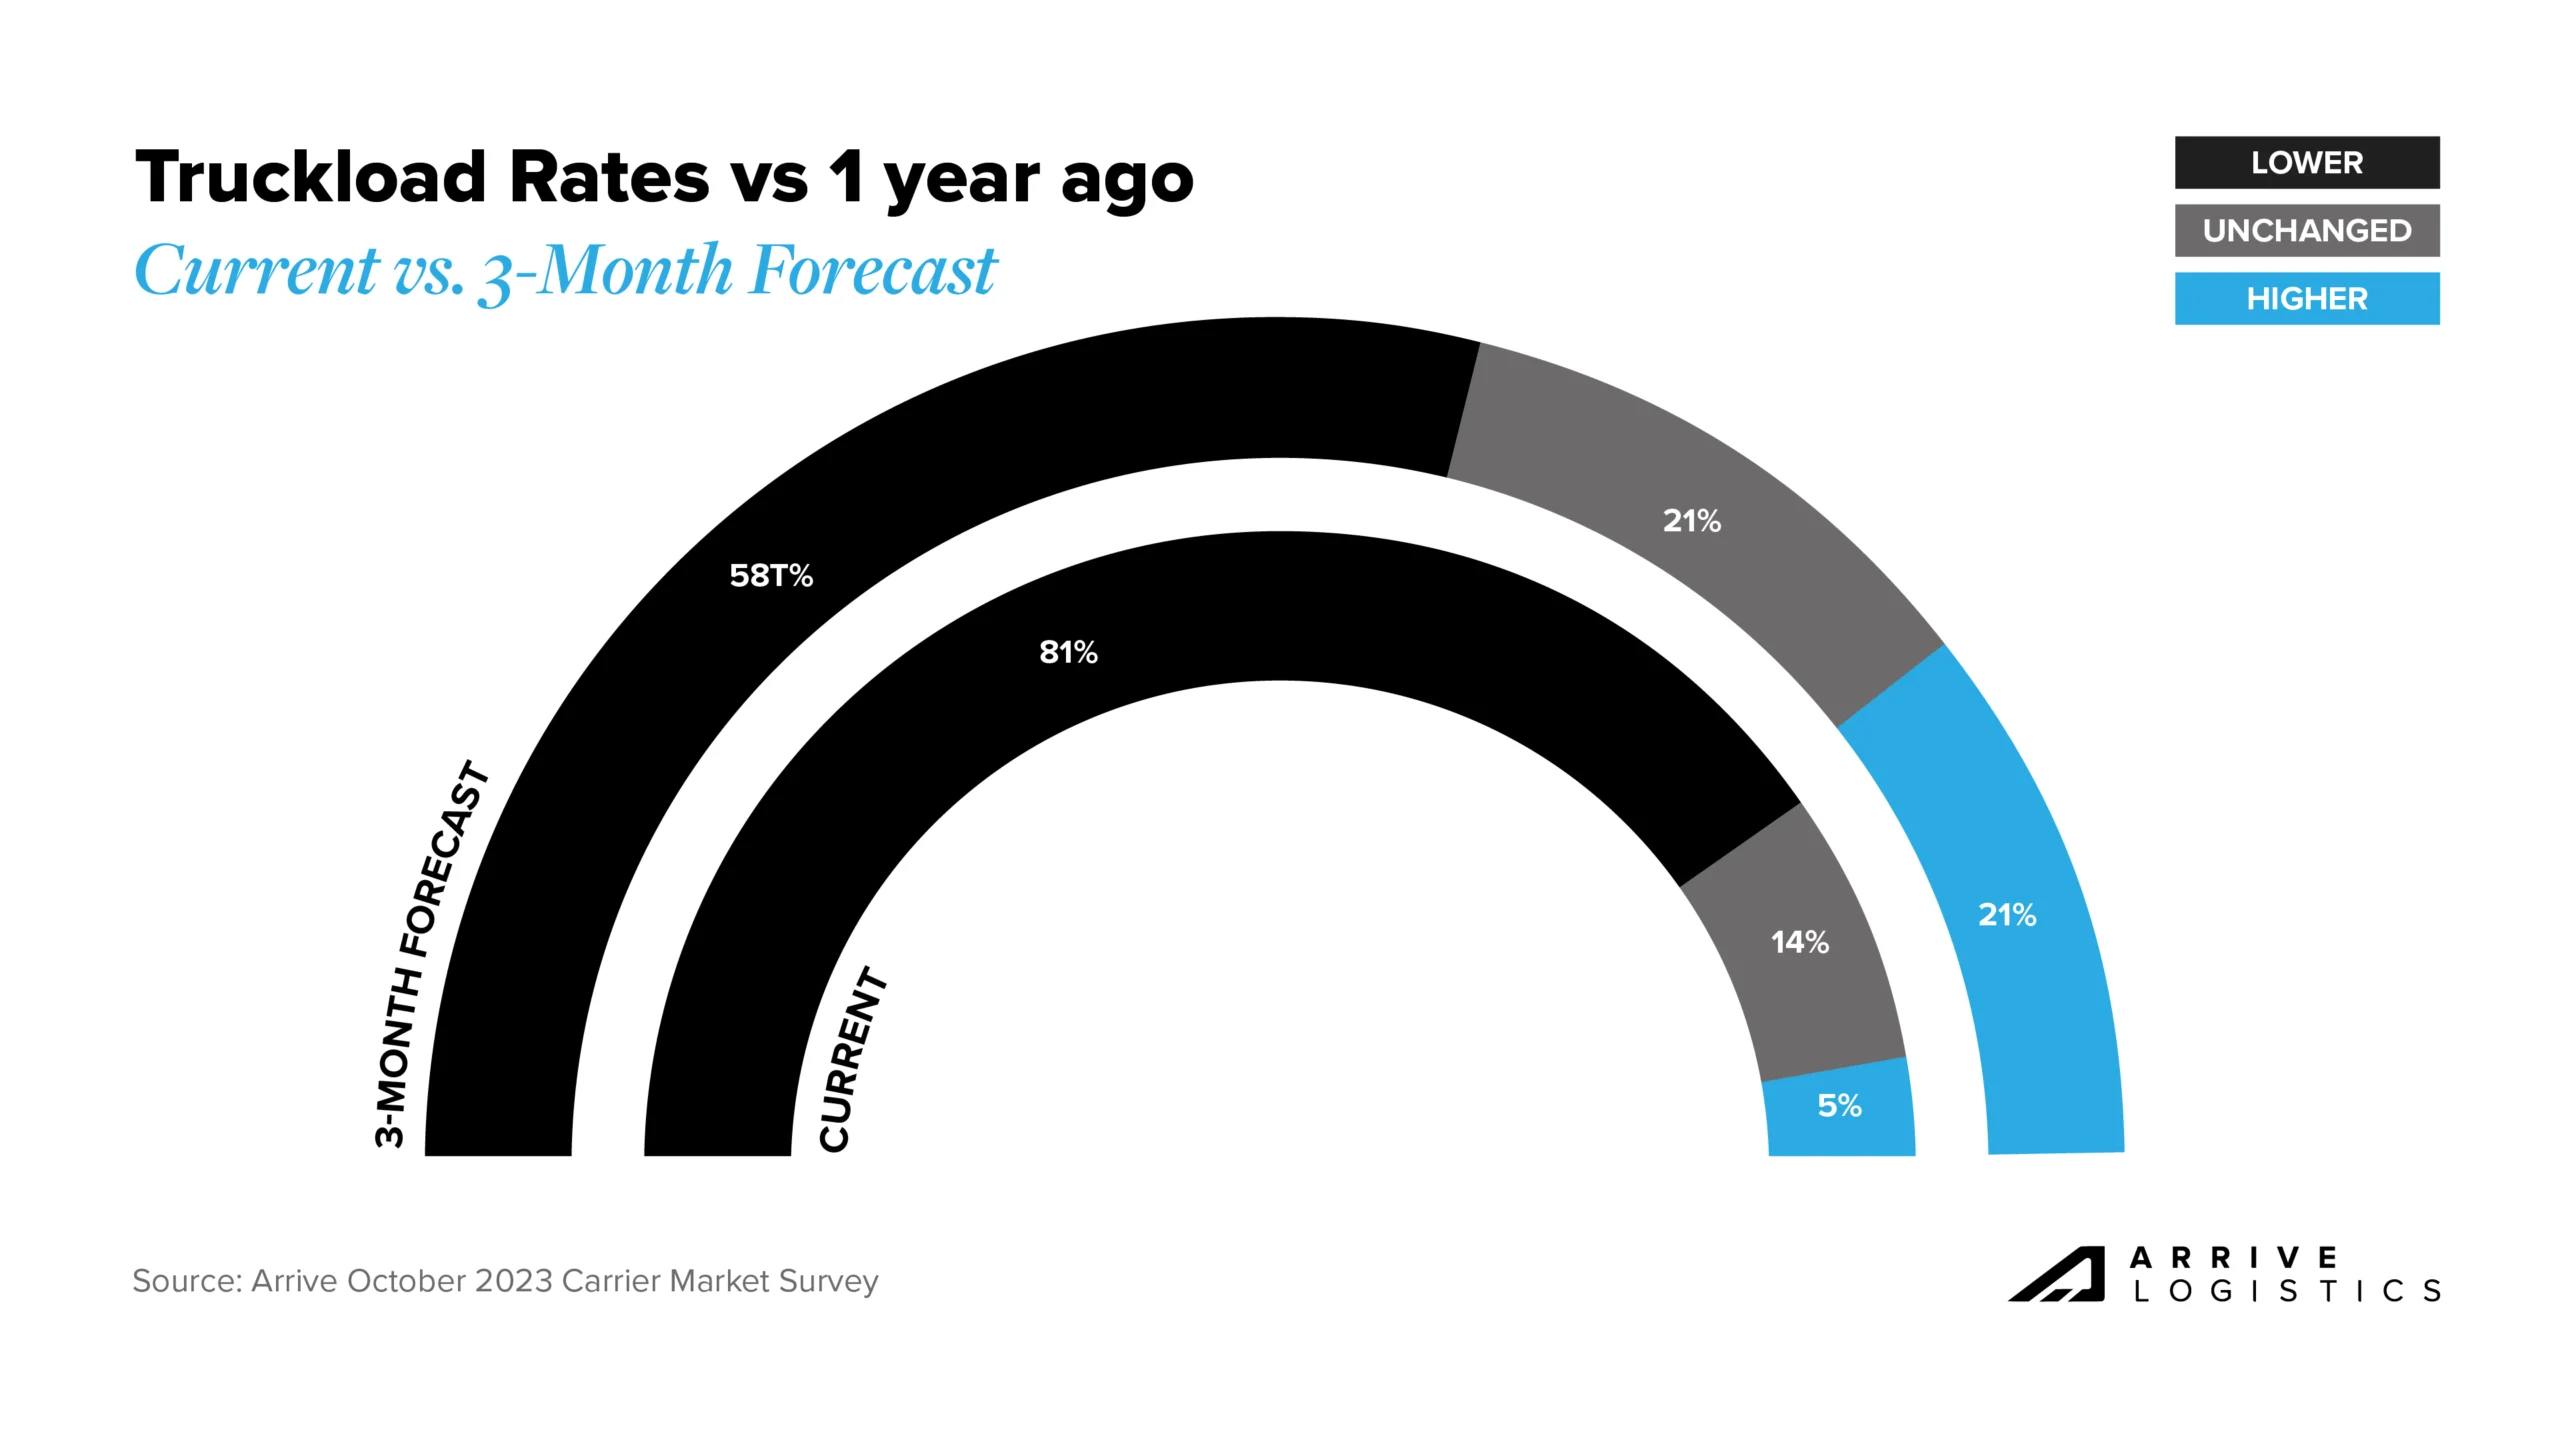 Figure 29: Truckload Rates vs. 1 year Ago, Arrive Carrier Market Survey, October 2023
September CPI data showed that inflation will likely remain sticky even though price increases have cooled notably. This is a concern heading into 2024 because while there is no direct relationship to truckload demand, it is easy to make a connection between elevated interest rates and slowing freight volumes.
The Fed is unlikely to lower interest rates if inflation remains above the target, leaving questions about whether the inventory cycle reset will be enough to stabilize freight volumes. But if inflation eases, the Fed could lower interest rates, which may bolster housing activity and manufacturing investment — two currently slumping sectors that contribute meaningfully to freight demand.
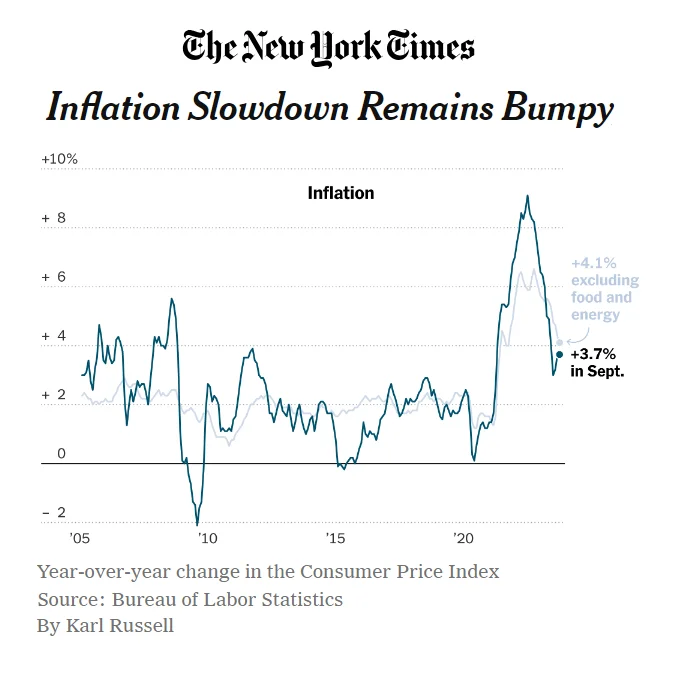 Figure 30: New York Times Inflation Data
National diesel prices have declined steadily over the past month, following large increases during the second half of summer. The price increases can be attributed to historically high demand and production cuts by Saudi Arabia and other OPEC countries. As demand dwindled over the second half of September and into October, so did prices.
Fuel prices are connected to geopolitical events. Soon after Russia invaded Ukraine, fuel prices saw a historic elevation that took several months to settle, which is why we are now monitoring the impact of rising tensions in the Middle East. While Israel and Palestine are not significant oil providers, the Middle East region directly impacts prices in the United States. If the conflict were to affect other areas in the Middle East, another large spike in fuel prices would likely result.
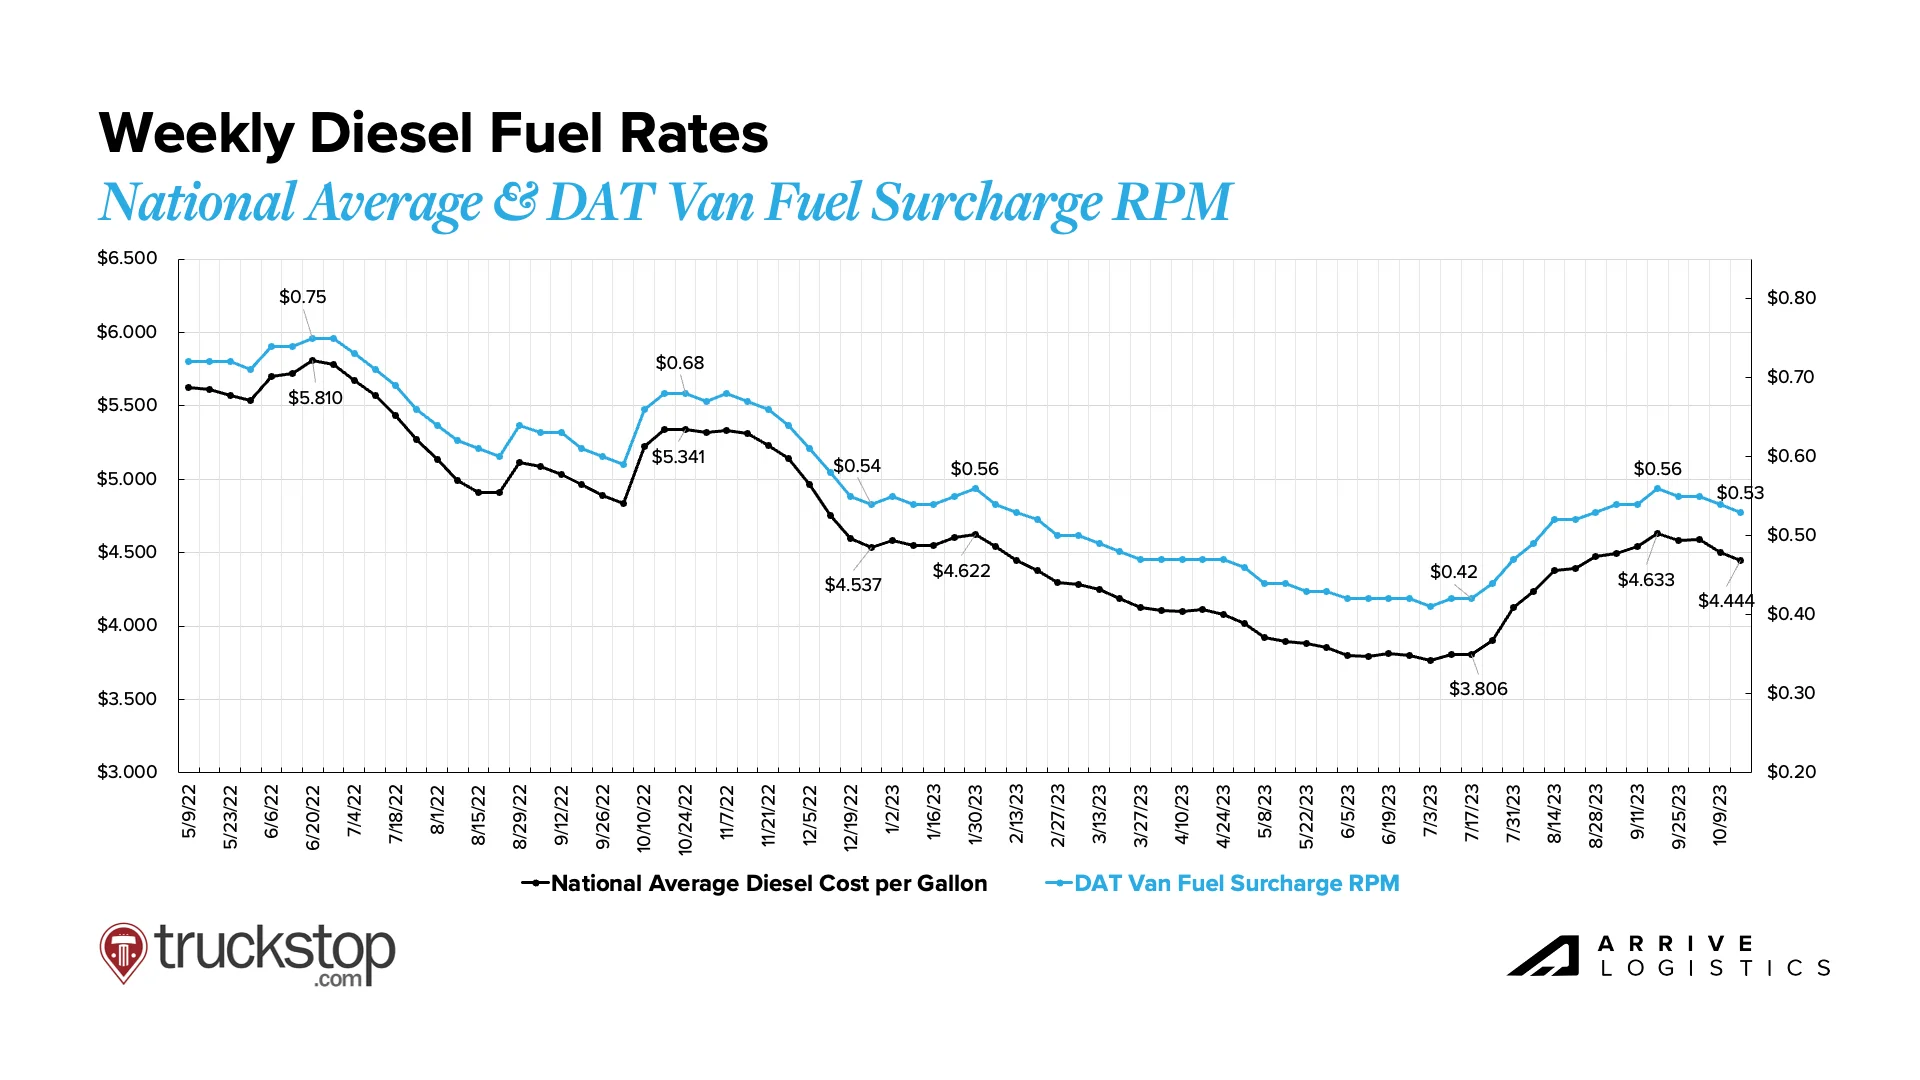
Figure 31: National Average Diesel Rates & DAT Fuel Surcharge RPM


