Need Help
close button

How can we help?

Select One:

Freight Market Update – April 2024

Author: rwalter@arrivelogistics.com
Shape

April Theme: Rinse and Repeat

Freight Market Update - April 2024

Arrive Insights™

Arrive Logistics VP of Market Intelligence David Spencer Headshot
David Spencer
VP of Market Intelligence
Aryan Shah
Senior Research Analyst

Market conditions remained soft in March due to slow capacity exits, flat demand and no significant disruptions. Dry van and reefer rates reached new cycle lows in April, while open deck rates rose on the heels of increasing demand.

Thus, our forecast remains the same: We expect regional volatility as the produce season begins and the 100 Days of Summer draws near, with rates potentially increasing by over 10% in some areas.

Truckload Demand

Low but steady.

Truckload Supply

Surplus continues.

Truckload Rates​

New cycle lows.

Multimodal Notes

Prepping for summer.

Cross Border

Produce season begins.

Capacity Outlook

Slow exits continue.

Volume Outlook

Imports are still strong.

Consumer Sentiment

Mostly optimistic.

Download Market Update

Insights Delivered To You

Key Takeaways

  • Van tender rejections were flat throughout March, indicating loose market conditions and relatively low vulnerability to disruptions.

  • Reefer tender rejections of around 5% indicate loose conditions despite volatility earlier in the year.

  • The carrier population remains resilient — revocations declined as new entrants increased.

  • Van and reefer rates reached new cycle lows, increasing the spot-contract gap and indicating that a market flip is not imminent.

  • Carriers got some relief as diesel prices flattened over the past few weeks following sharp increases earlier this year.

  • Import volumes are still strong despite Red Sea disruptions.

  • The rerouting of shipments due to the Francis Scott Key Bridge collapse in Baltimore is causing some regional volatility.

  • Inflation remains sticky and well above the Fed’s target rate of 2.0%. As a result, interest rates may remain flat longer than expected, which could further extend the down cycle.

Truckload Demand

What’s Happening: Market conditions held steady in March.

Why It Matters: Low demand today could indicate a muted peak summer season.

Conditions in March remained relatively quiet without any major disruptions. Spot load postings increased by 12.3% month-over-month but were down nearly 15% year-over-year. Meanwhile, month-over-month truck postings dropped by 6.1%. These results reflect soft demand conditions.

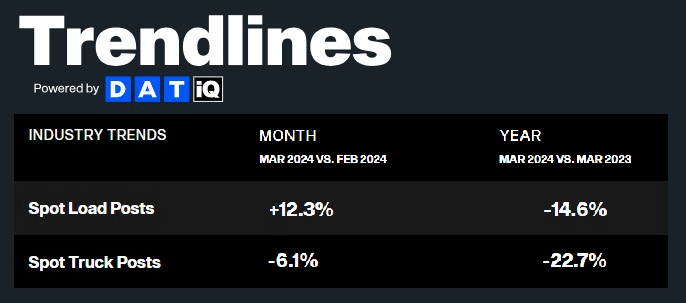
Figure 1: DAT Trendlines

The Cass Freight Index shipments component is a good overall market indicator because it encompasses both spot and contract freight based on bill data. The March reading was down 2.3% month-over-month on a seasonally adjusted basis. It was also down 3.6% from 2023, marking 24 months of year-over-year declines despite slowing destocking trends.

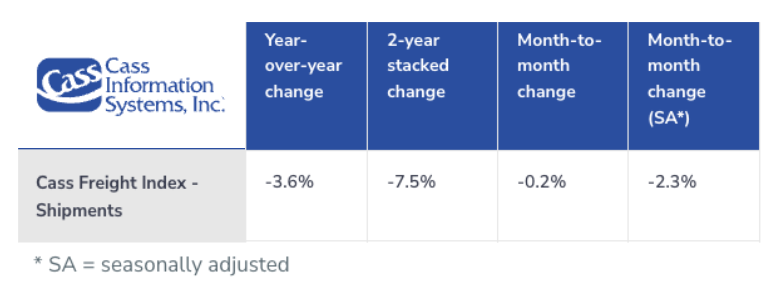
Figure 2: Cass Freight Index Report – March 2024

Truckload Supply

What’s Happening: February trends continued in March.

Why It Matters: The market is calm as produce season begins.

Soft demand amid a surplus of capacity continues to elongate the downcycle. The Sonar Outbound Tender Reject Index (OTRI), which measures the rate at which carriers reject freight they are contractually required to take, has hovered around 5% since early March. Van tender rejections have stayed below 4% for the past few months and are now slightly higher than in early April. Reefer tender rejections are flat, staying around 5%. While rejection levels today are slightly higher than during this time last year, they are still significantly lower than in 2021 and 2022 and will likely remain stable as the 100 Days of Summer approaches.

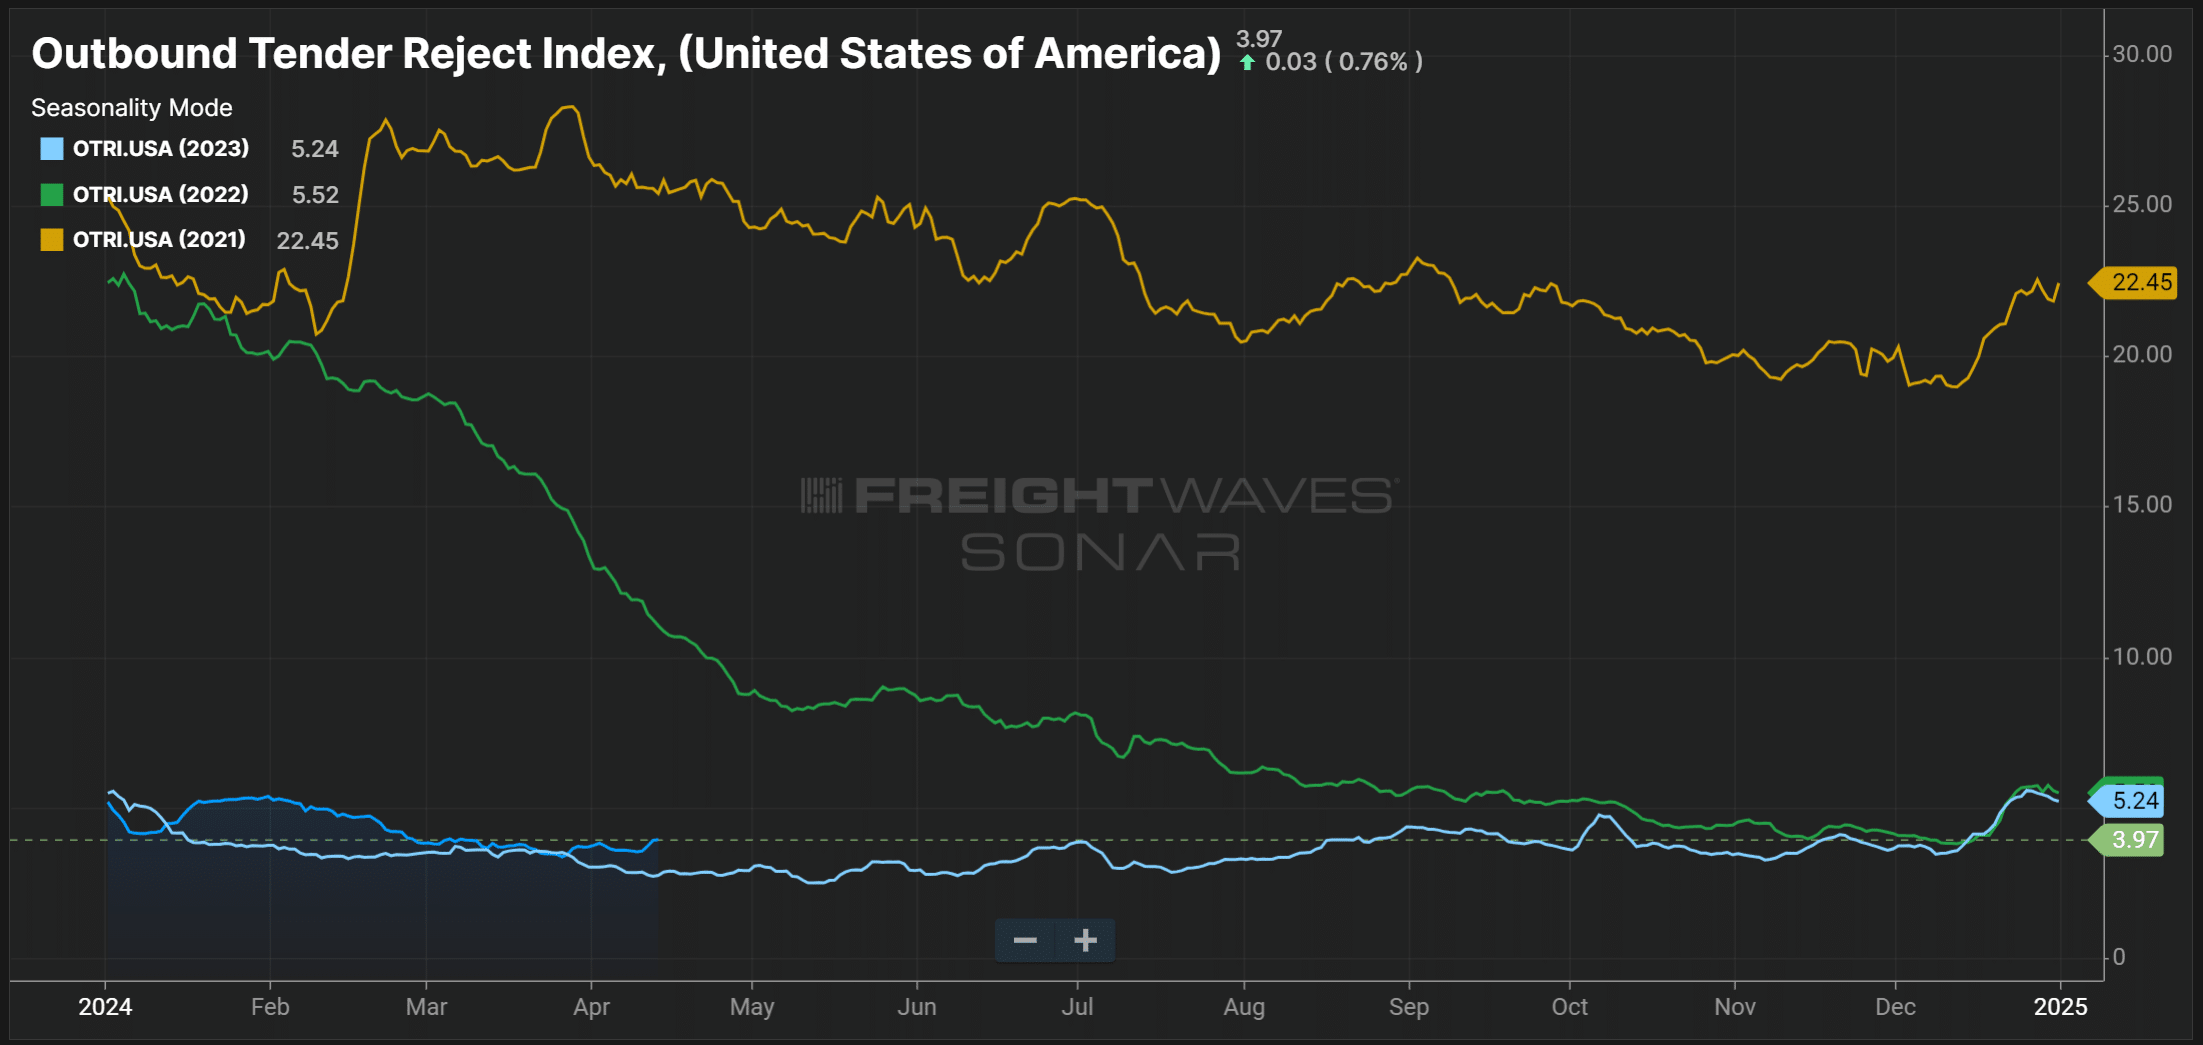
Figure 3: Outbound Tender Reject Index, SONAR: OTRI remains in line with 2023 levels at around 5%, indicating capacity is still sufficient to support demand. Carriers are protecting their contract freight as spot rates fall.

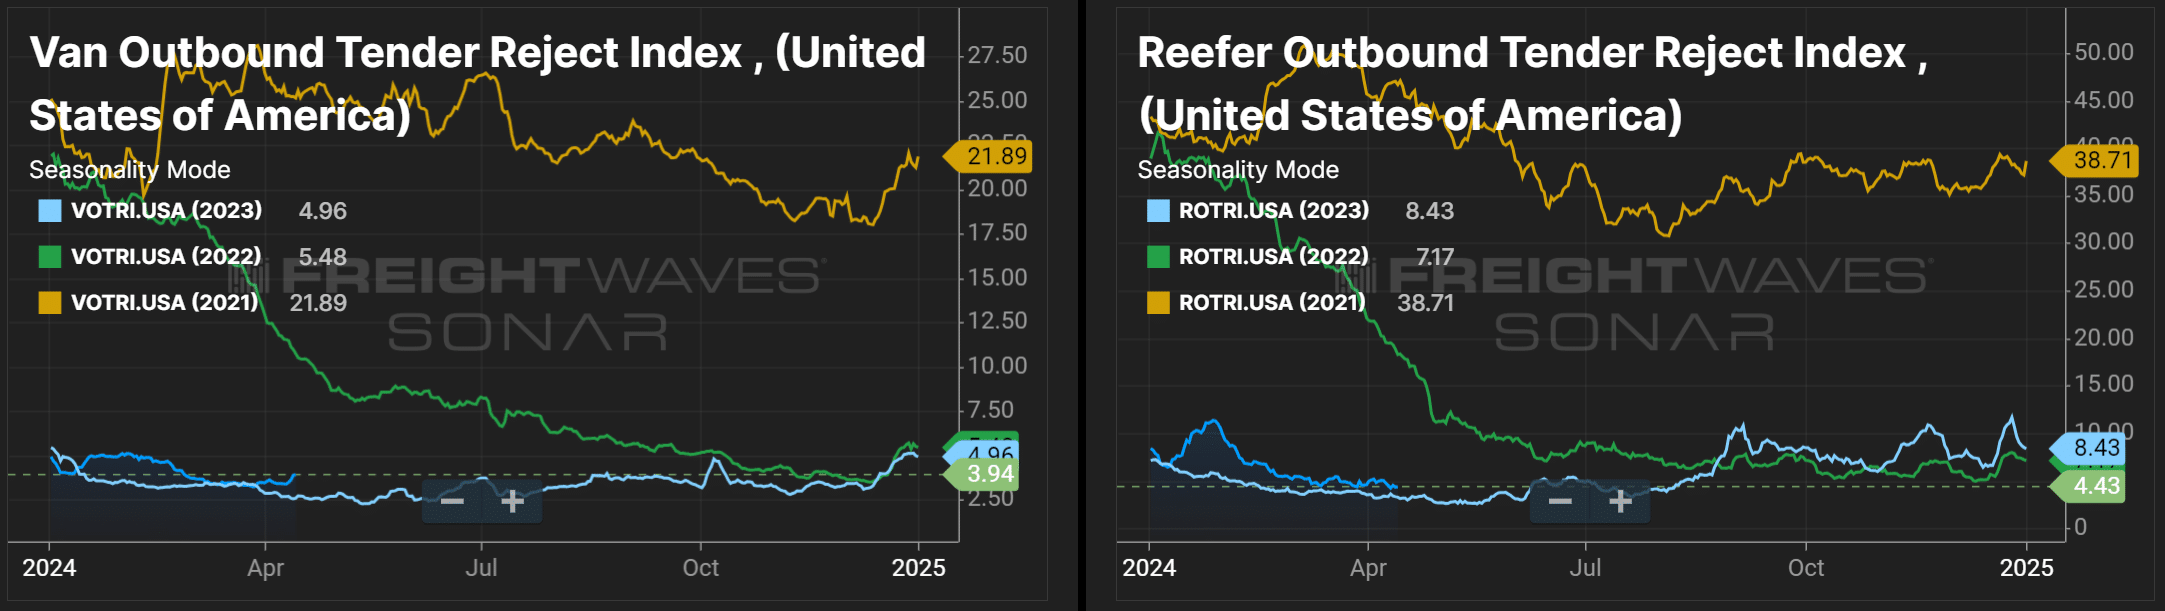
Figures 4 & 5: Van and Reefer Outbound Tender Reject Indices, SONAR: Dry van and reefer tender rejections were flat in March and continue to hover around 2023 levels.

The DAT Load-to-Truck Ratio, which measures the total number of loads relative to the total number of trucks posted on their spot board, rose slightly to 3.13 on the van side in March, just slightly above the same period in 2023. Reefer data revealed a similar trend, with the March ratio landing just north of the 2023 reading at 4.83.

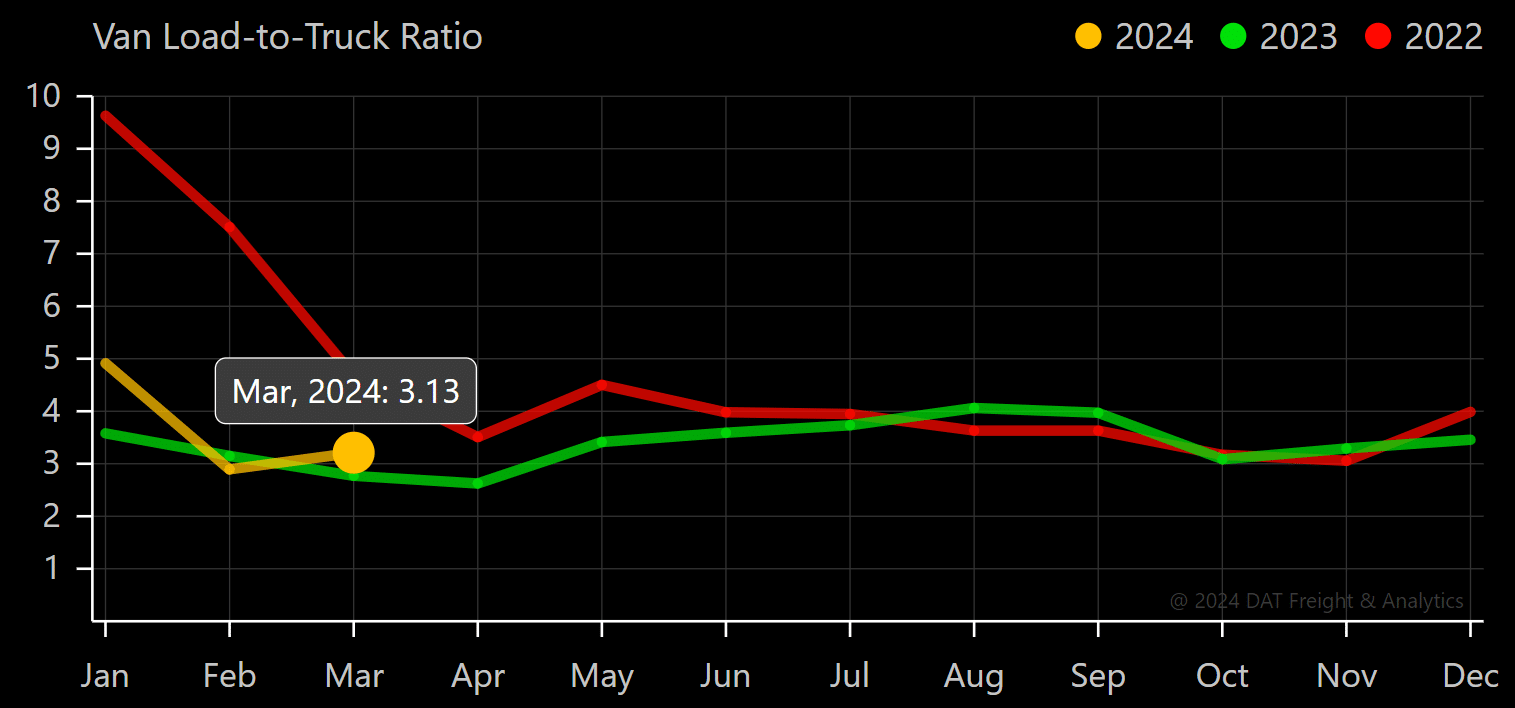
Figure 6: DAT Van Load-To-Truck Ratio

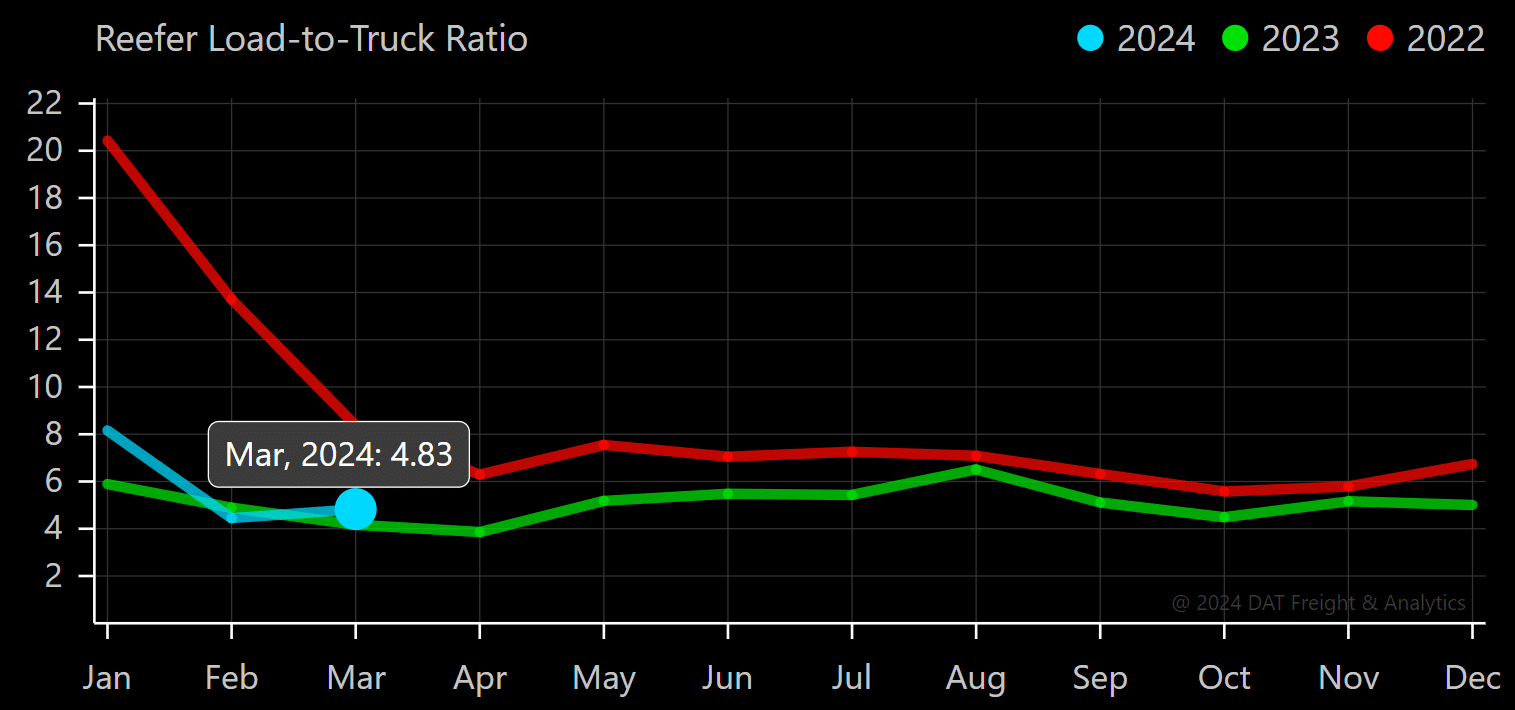
Figure 7: DAT Reefer Load-To-Truck Ratio

The Morgan Stanley Dry Van Freight Index is another measure of relative supply; the higher the index, the tighter the market conditions. The black line with triangle markers on the chart provides a great view of what directional trends would be in line with normal seasonality based on historical data dating back to 2007.

Market conditions remained relatively flat in March. The slight uptick in the Morgan Stanley reading differed from the 10-year trend, which typically shows softening conditions during this time of year. Conditions will likely remain relatively flat ahead of the 100 Days of Summer and start to tighten as produce and other in-demand summer products hit the roads.

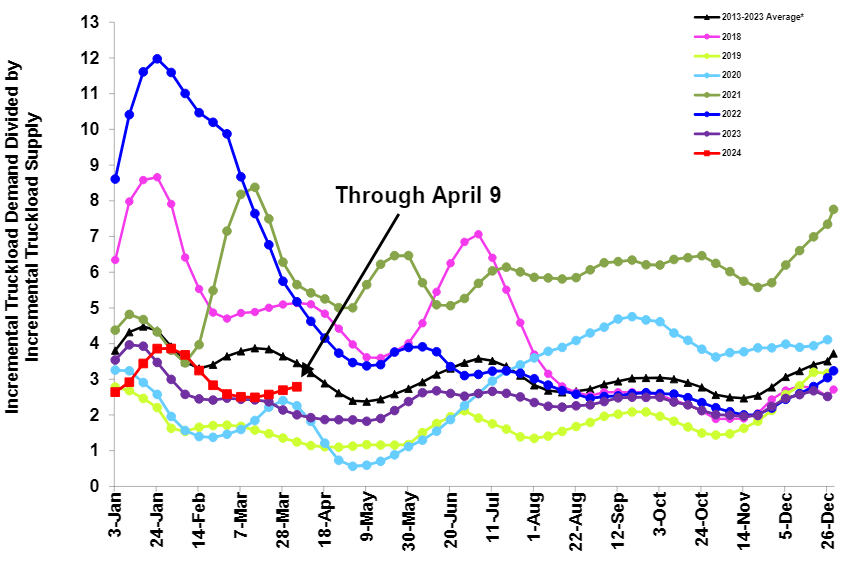
Figure 8: Morgan Stanley Dry Van Truckload Freight Index

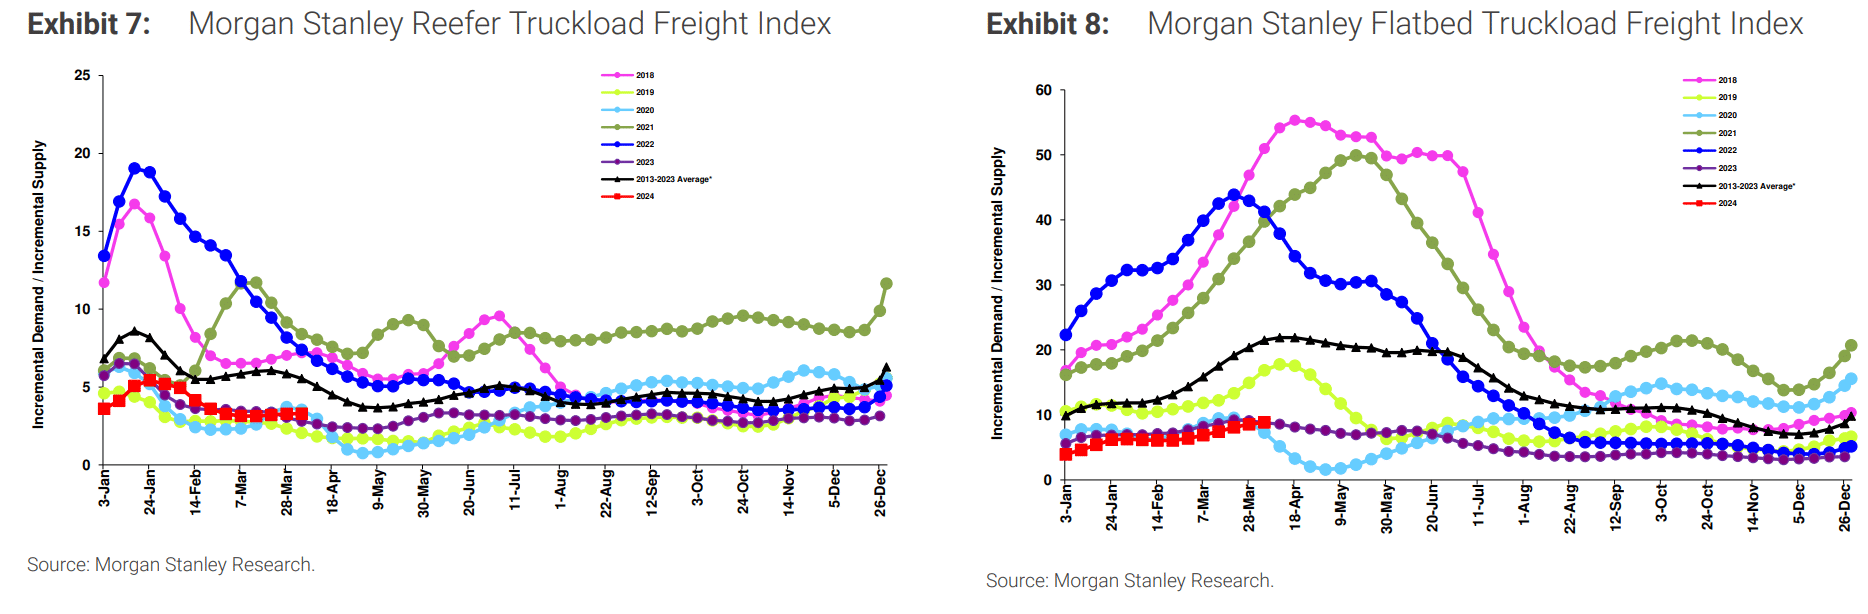
Figures 9 & 10: Morgan Stanley Reefer and Flatbed Truckload Freight Indices

Truckload Rates

What’s Happening: Rates continue to fall to new cycle lows.

Why it Matters: Declining carrier revenues could drive more capacity out of the market.

Truckstop’s Weekly National Average Spot Rates provide a detailed view of week-to-week movements and a real-time look into the current environment. In early April, dry van spot rates fell to $1.88 per mile, matching the cycle low set in mid-March, and reefer rates were $2.18 per mile, just $0.02 higher than the cycle low reported in early March. Flatbed rates continue to trend upward as construction season gets underway.

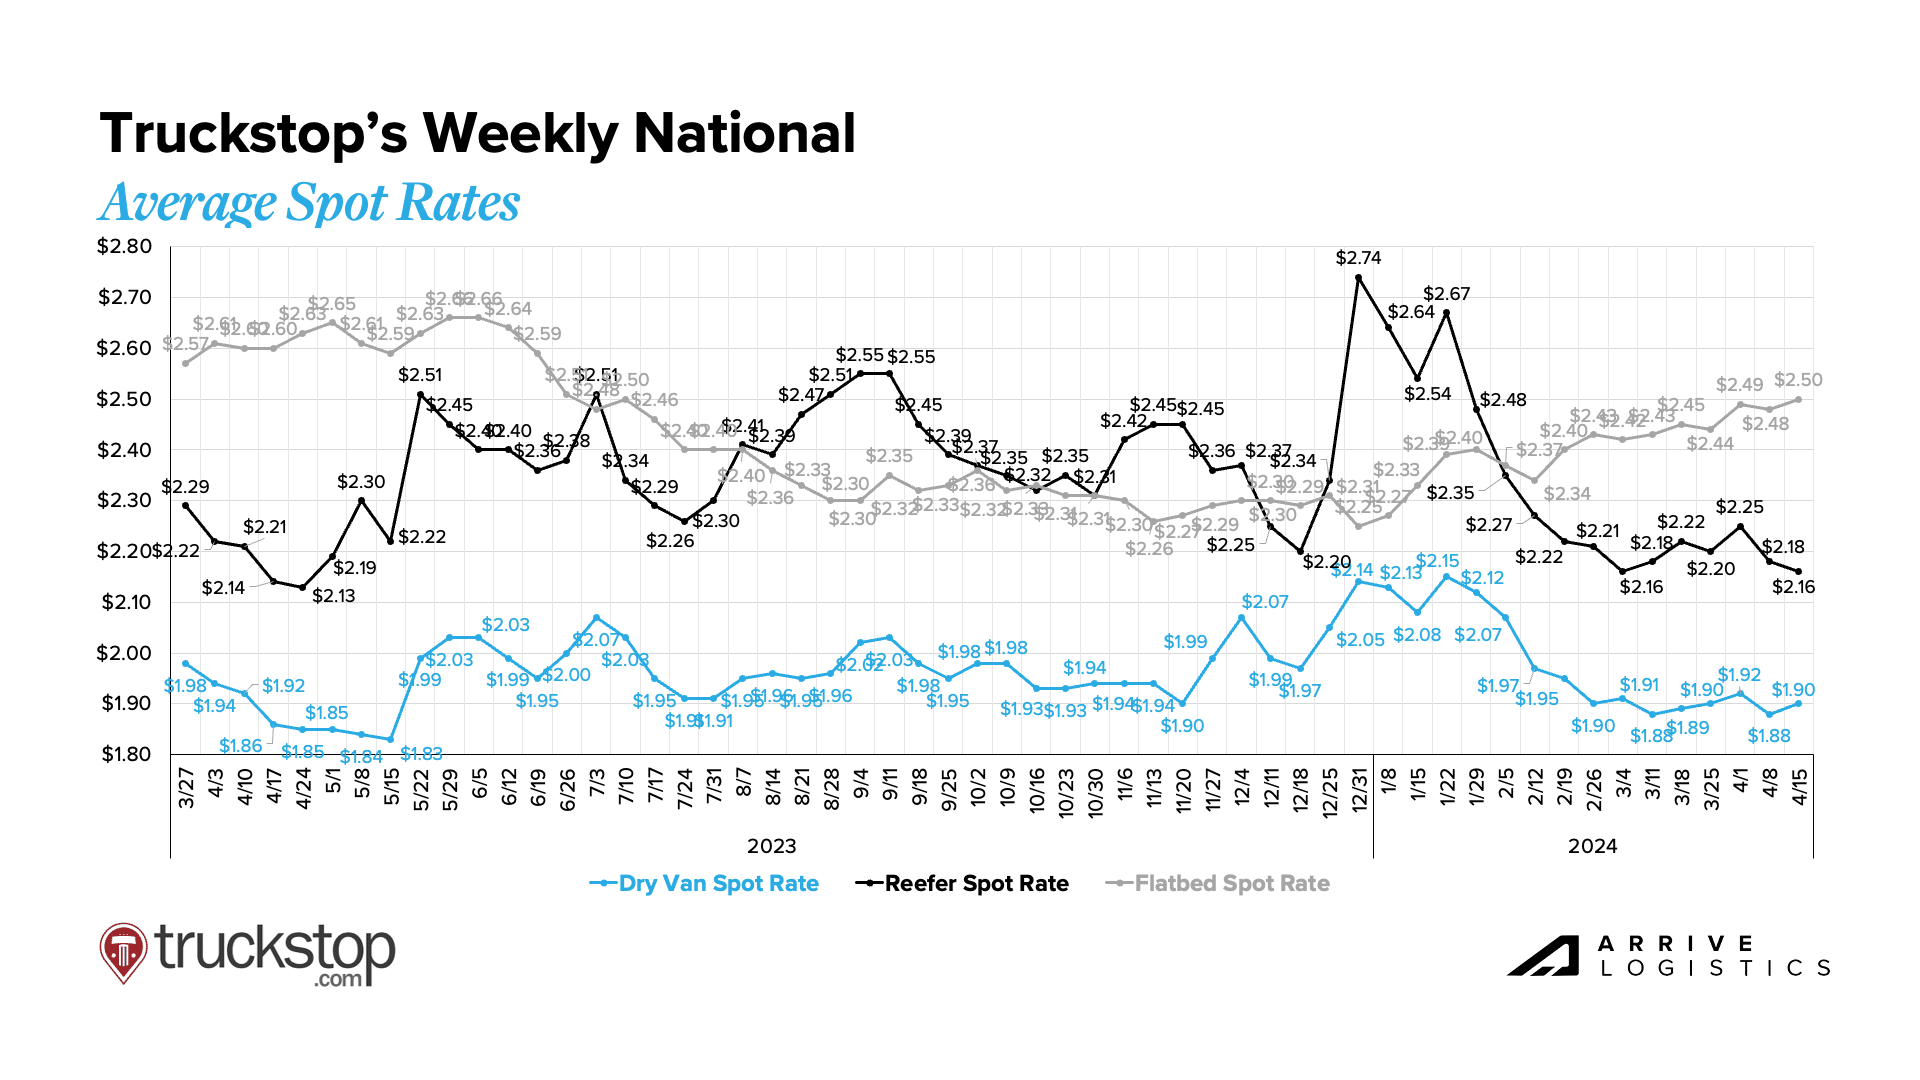
Figure 11: Truckstop’s Weekly National Average Spot Rates

DAT reports that national dry van rates declined by $0.05 per mile from February to March, and reefer national spot rates declined by $0.06 per mile in that same time frame. Flatbed national spot rates increased by $0.02 per mile from February to March, which aligns with seasonal expectations for that equipment type.

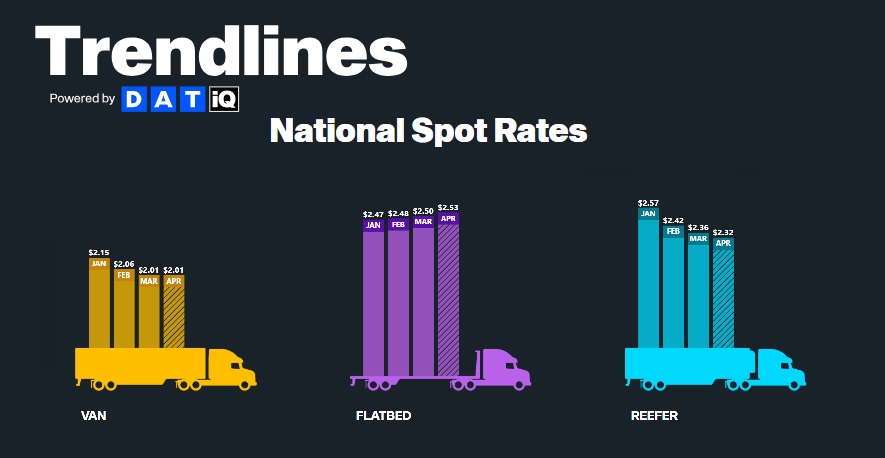
Figure 12: DAT Monthly Rate Trends

National diesel prices have leveled out over the past two months, with relatively minimal weekly fluctuation. The average price through the first half of April was $4.02 a gallon, matching the March average. Fuel surcharges have remained relatively steady, but with tensions mounting in the Middle East, there remains a very real chance for increases in the upcoming months.

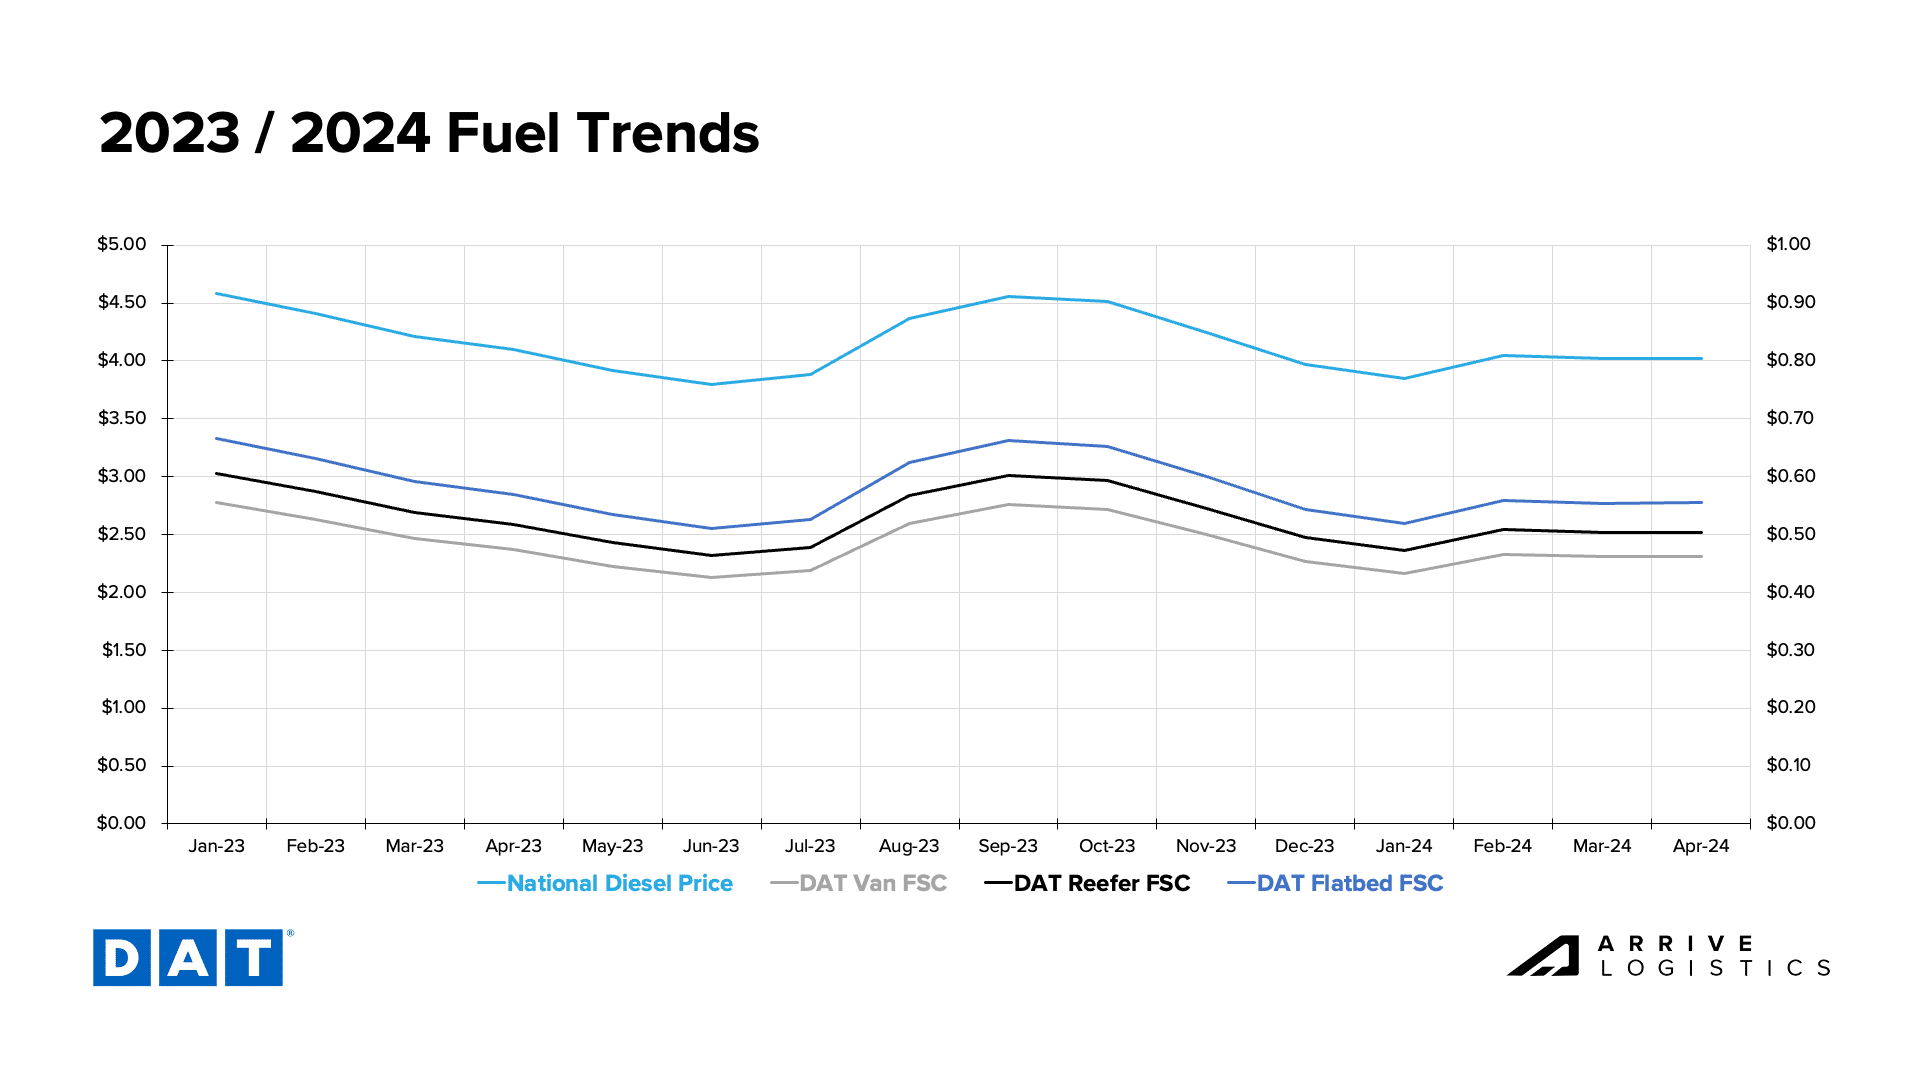
Figure 13: DAT Fuel Trends

DAT data shows dry van spot rates are down year-over-year and well below January 2024 highs. In March, spot rates set a new cycle low of $1.54 per mile, excluding fuel. Early April data shows similar numbers, with the national spot average increasing by $0.01. National contract rates for dry van have slowly declined as spot rates apply downward pressure. If early April averages remain flat throughout the month, contract rates could reach $2.00 per mile, excluding fuel, a new cycle low.

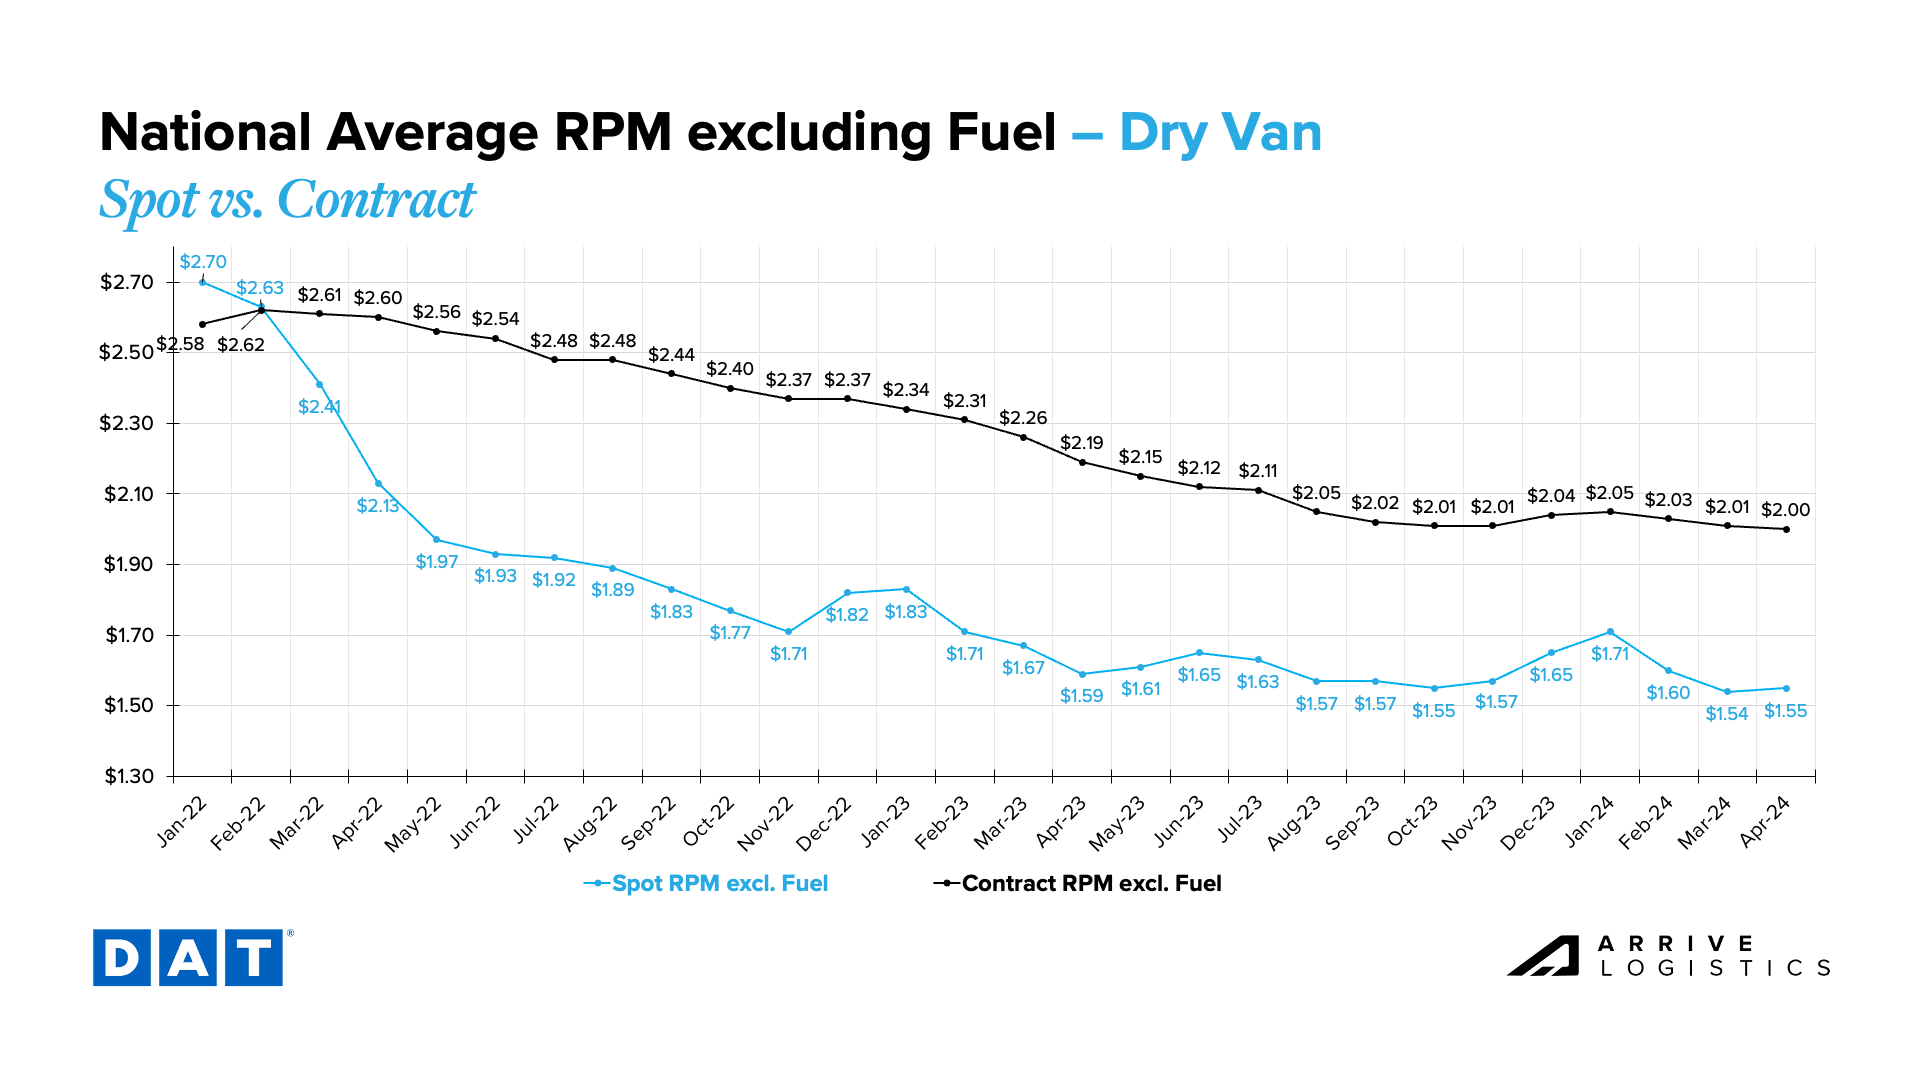
Figure 14: DAT Dry Van National Average RPM Spot vs. Contract

Reefer rates continue to trend down. If early April data holds true for the rest of the month, spot and contract rates could reach new cycle lows. Spot rates currently sit at $1.81 per mile, excluding fuel; that’s $0.04 below the prior cycle low of $1.85 per mile set in March. Reefer contract rates have declined by $0.02 per mile to $2.33 per mile in April, excluding fuel. The spot-contract gap also increased to $0.52 per mile.

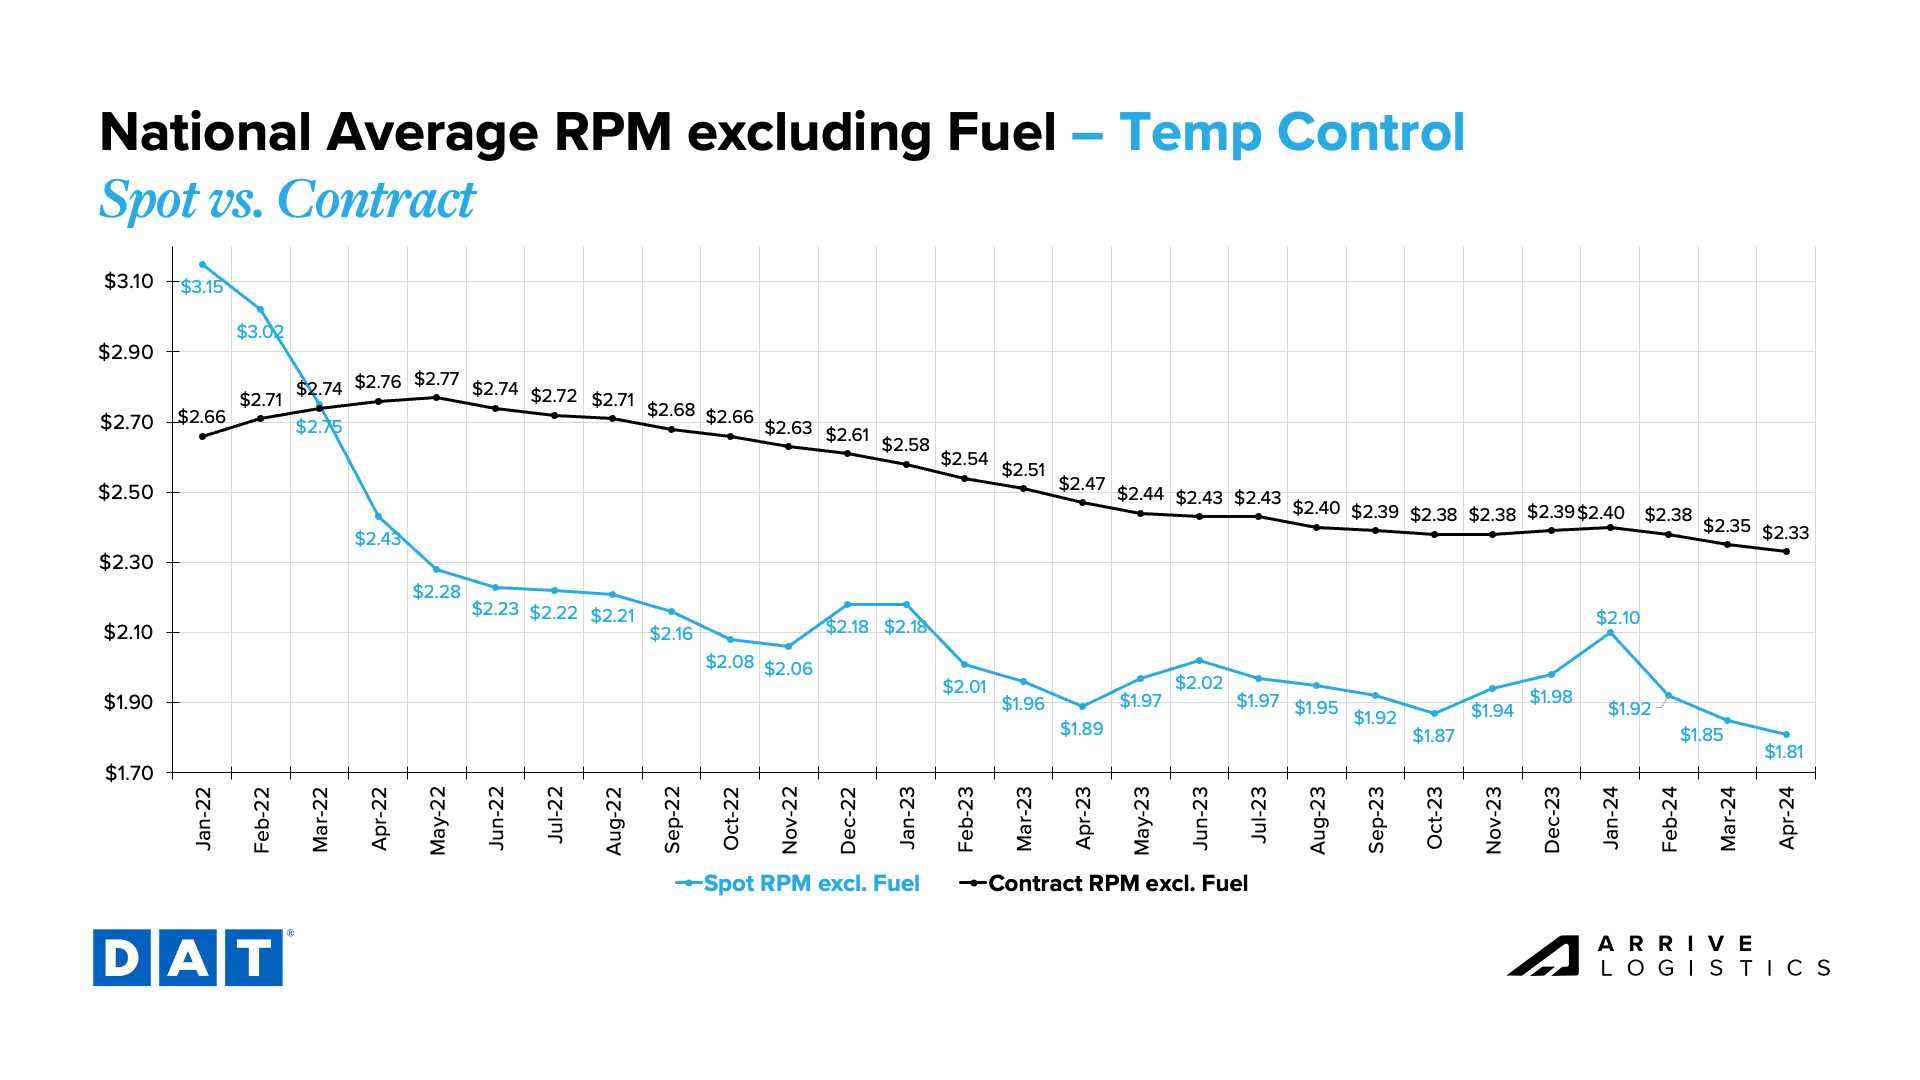
Figure 15: DAT Temp Control National Average RPM Spot vs. Contract

Flatbed rates rose to $1.98 per mile in early April, excluding fuel, the highest since mid-summer 2023. Contract rates also rose to $2.65 per mile, excluding fuel, also the highest since mid-summer last year.

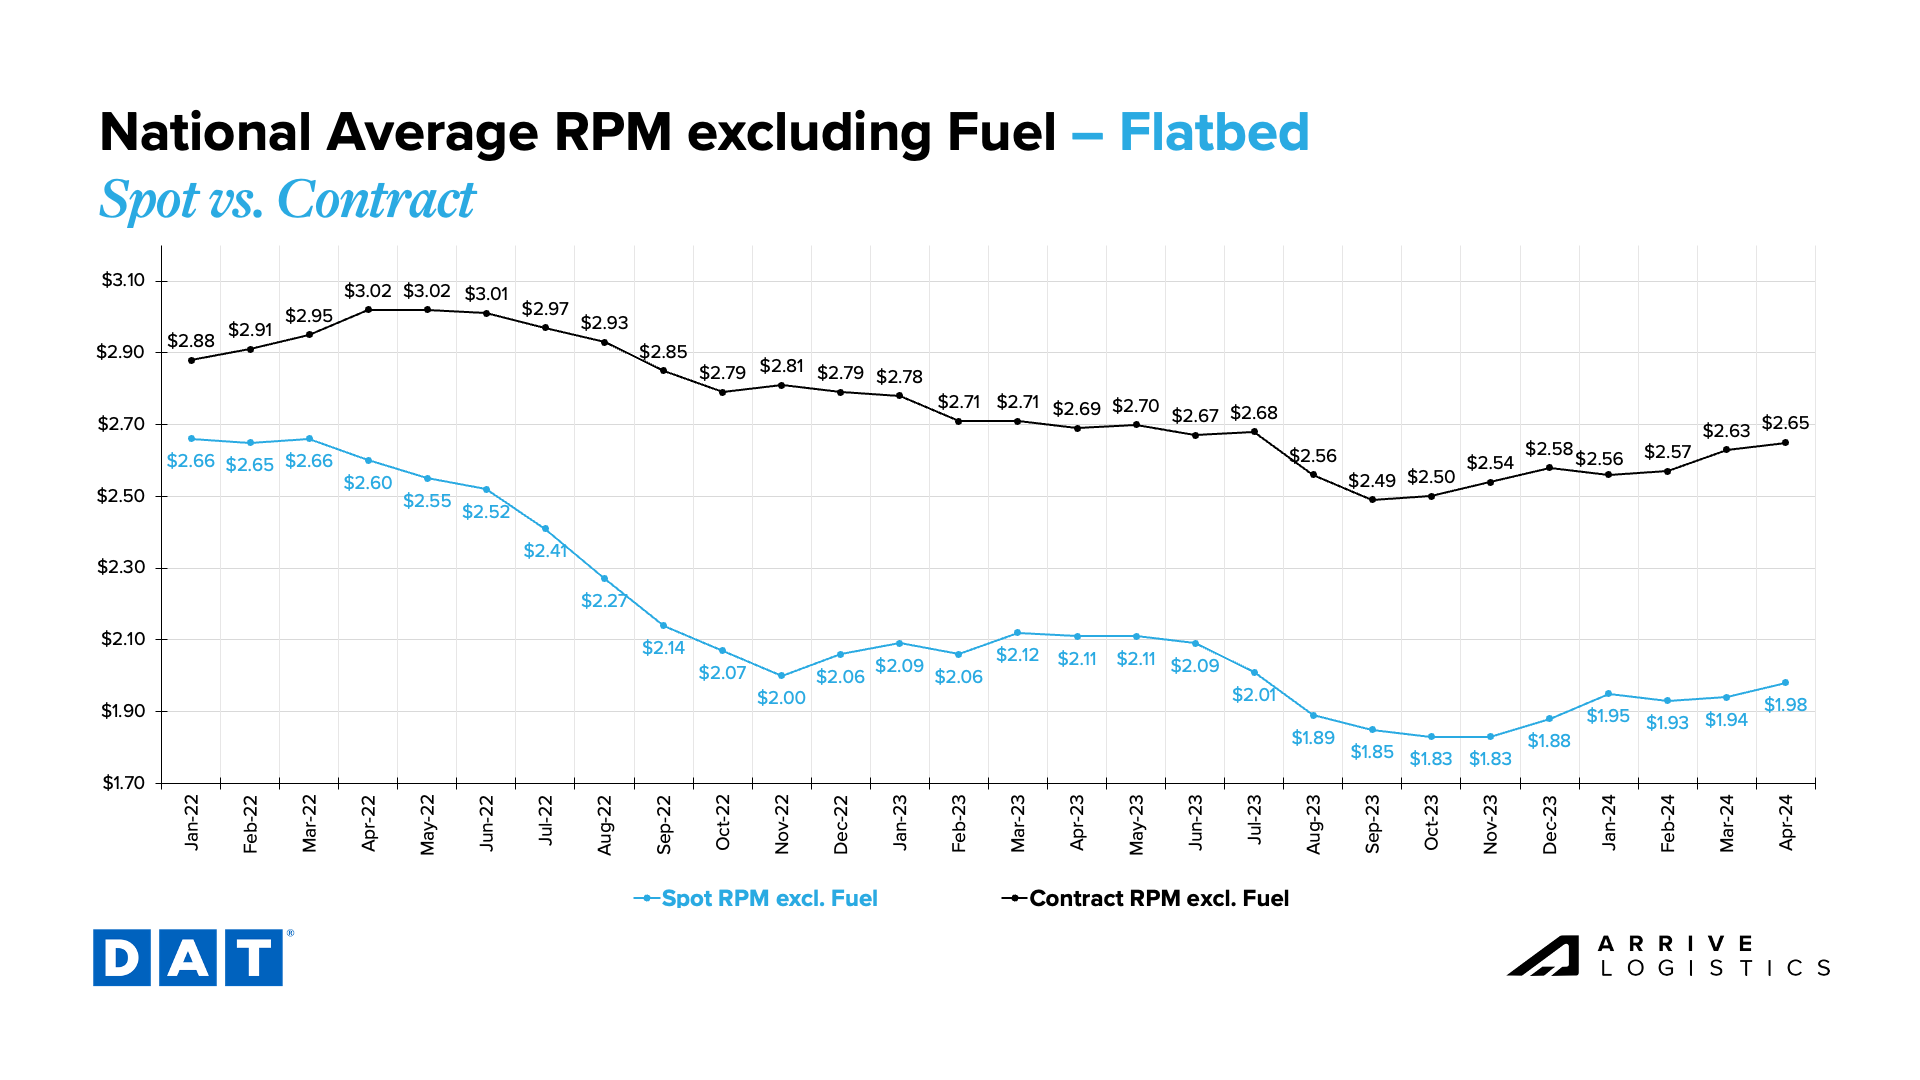
Figure 16: DAT Flatbed National Average RPM Spot vs. Contract

Market By Mode

Cross-Border Canada

What’s Happening: Cross-border Canada freight slowed in March.

Why It Matters: Rates remained steady amid a surplus of capacity.

  • The cross-border Canada market continued to slow and soften in early Q2.
  • Capacity remains sufficient to support demand.
  • Rates remain at cycle lows. 
  • The carbon tax is going into effect, which should apply upward pressure on rates as operating expenses will likely increase.

Cross-Border Mexico

What’s Happening: Increased cargo theft is creating tightness in Central Mexico.

Why It Matters: Rates are rising on inbound and outbound shipments.

  • The Peso continues to gain strength against the U.S. Dollar, leading some carriers to look for rate increases.
  • Capacity continues to exit Central Mexico around the El Mexiquense and Arco Norte highways, where over 80% of cargo theft occurs; automotive shippers in the region are seeing the greatest impact.
  • Northbound produce demand is starting to pick up, with regional capacity crunches and rate increases of up to 10% in the Bajio region.

LTL Insights

What’s Happening: The LTL market continues to absorb Yellow’s freight.

Why It Matters: “Difficult” freight can impact operating costs.

  • Reports from Q1 LTL earnings have started to come in; FedEx Freight was the first to release earnings and could be a leading indicator for the rest of the LTL market.
  • FedEx Freight reported its shipments and tonnage were down 8.4% year-over-year, and revenue was down 10% year-over-year.
  • FedEx Freight also reported its shipments dropped by 3.4% quarter-over-quarter, while tonnage and revenue dropped by 6.5% and 2.8% quarter-over-quarter, respectively.
  • Yellow’s average total bill count was 35k for long haul and regional shipments; this volume has mostly been distributed based on the geographical footprint of the LTL carriers that opted to absorb it.
  • Many LTL carriers report that April market conditions are thus far mirroring March, but they are looking to re-evaluate their costs due to the shift of the Yellow freight.

Temp Controlled

What’s Happening: Typical seasonality is expected as produce season begins.

Why It Matters: Regional volatility and rate increases are likely.

East Coast

  • Temporary tightness is expected in Florida this spring.
  • Tightness will likely move up the coast into Georgia and the Carolinas as summer approaches.
  • Mid-Atlantic markets are loose for now.

Midwest

  • The Great Plains continue to ship the same commodities as prior months but with reduced weather disruption.
  • Tight conditions witnessed in late 2023 and early 2024 are no longer present as capacity remains abundant.
  • Large late spring winter storms are unlikely but could cause small delays if they occur.

South Central

  • Current regional tightness is likely to continue until June.
  • Demand is increasing for northbound cross-border Mexico produce.
  • Outbound Texas is also seeing increased produce demand.
  • Meat products continue to be one of the main commodities shipping out of this region.

West

  • Demand in the Imperial Valley is starting to wane.
  • Demand in Salinas is picking up, primarily for outbound leafy greens.
  • Northern California will start to see increased demand for outbound cherry shipments.

PNW

  • Rates continue to drop as markets soften and winter weather subsides.
  • Idaho continues to ship the same commodities with fewer delays, resulting in relatively soft market conditions.
  • Capacity is abundant and will likely remain as such through the summer. 

Open Deck

What’s Happening: Seasonal demand is increasing nationwide.

Why It Matters: Rates are rising on the heels of increased demand.

  • Demand is steady as open deck season begins.
  • The collapse of the Francis Scott Key Bridge in Baltimore is leading to inbound shipments of machinery being rerouted to Newark, NJ, Norfolk, VA and other ports, which is helping to maintain demand and steady rates.
  • Demand in the Southeast is picking up for intra and outbound home improvement equipment.
  • Except in Florida, inbound rates in the Southeast are steady and load-to-truck ratios are high.
  • Oil and gas demand is strong in Texas.
  • Demand is steady for cross-border Canadian machinery.
  • Major port areas will likely see increased import demand.
  • Freeze Laws in the PNW and Michigan are still in effect.
  • National rates are increasing steadily and will likely continue to rise through July.
  • Capacity exits are helping move the market toward equilibrium.

Capacity Outlook

What’s Happening: Capacity continues to exit, albeit at a slower pace.

Why It Matters: Resilient capacity may elongate the ongoing down cycle.

According to the latest report (February), Net Revocations fell to nearly 5,300 in February, marking the lowest number since April 2022. Though this is somewhat surprising as rates continue to reach new cycle lows, market volatility in December and January likely helped carriers keep their wheels turning. Though revocations declined from January to February, the number of new carrier entrants grew, resulting in an overall population decrease of just 800 carriers.

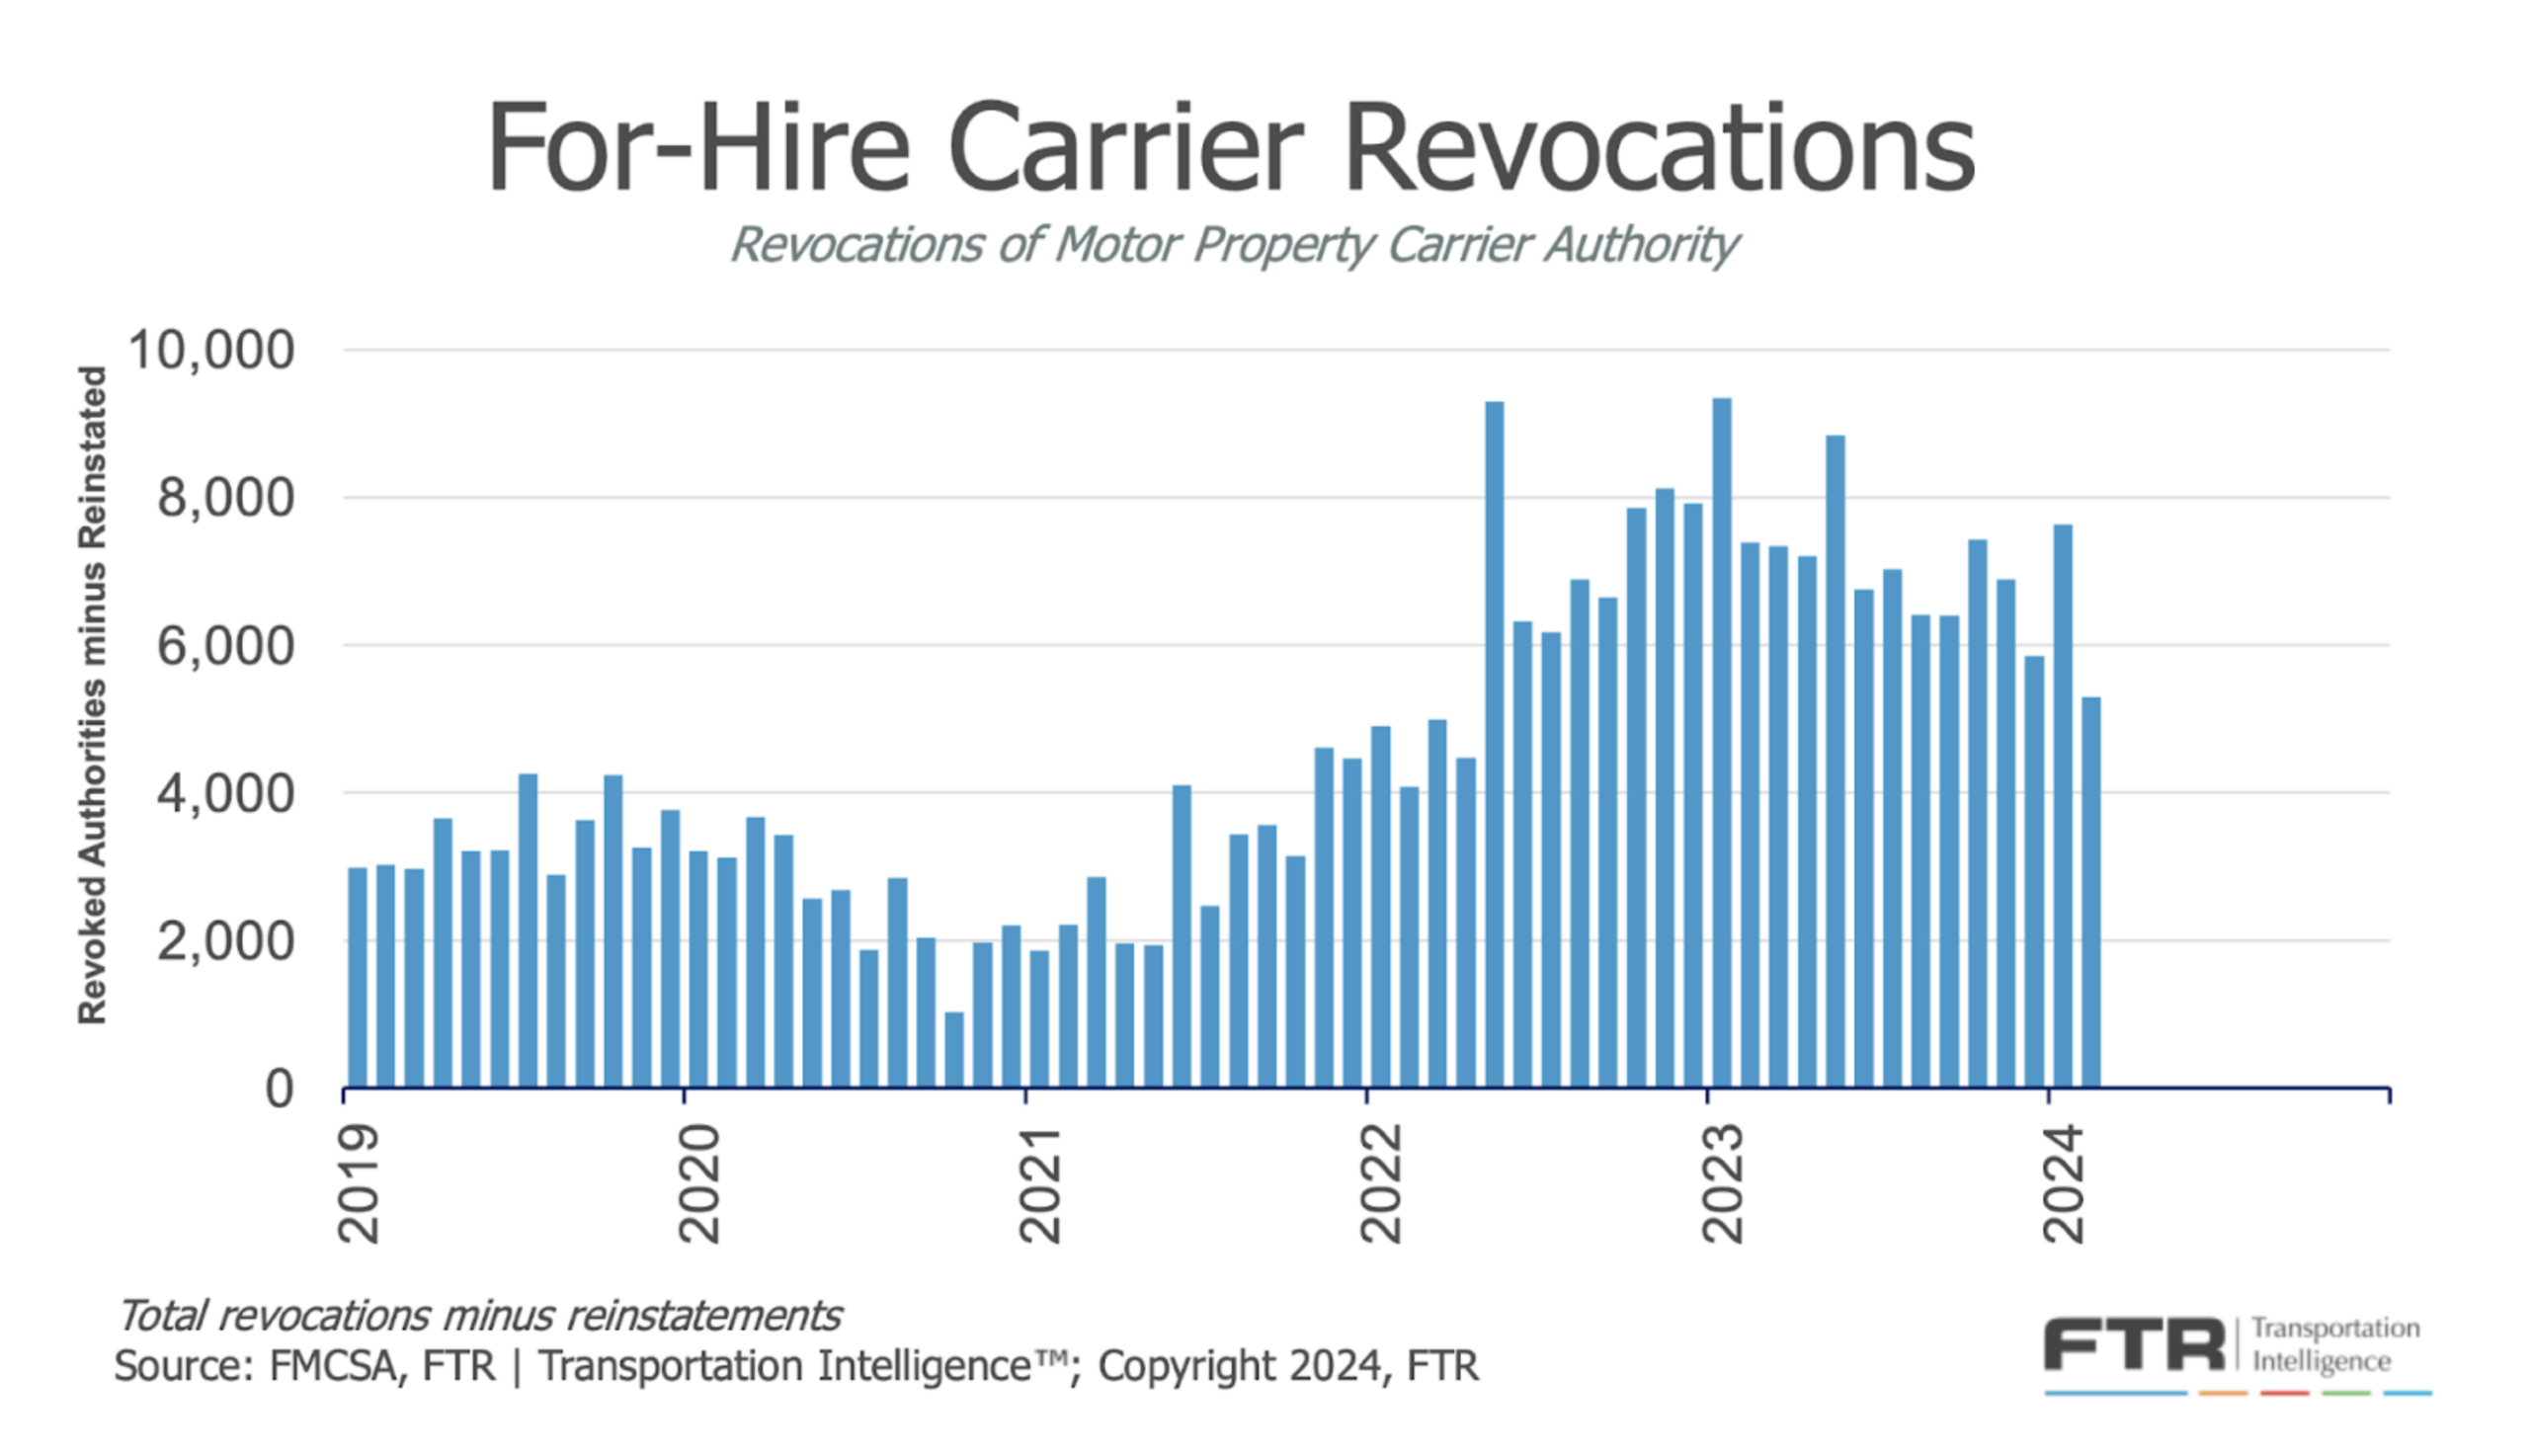
Figure 17: FTR’s Carrier Revocations

According to ACT Research, there were 10,000 new Class 8 orders in March, down from over 17,000 in February. Production should remain strong in the near term, but backlog levels have declined. It is surprising to see this trend when spot rates are so low, but it could result from private fleets preparing to meet 2027 emission regulations.

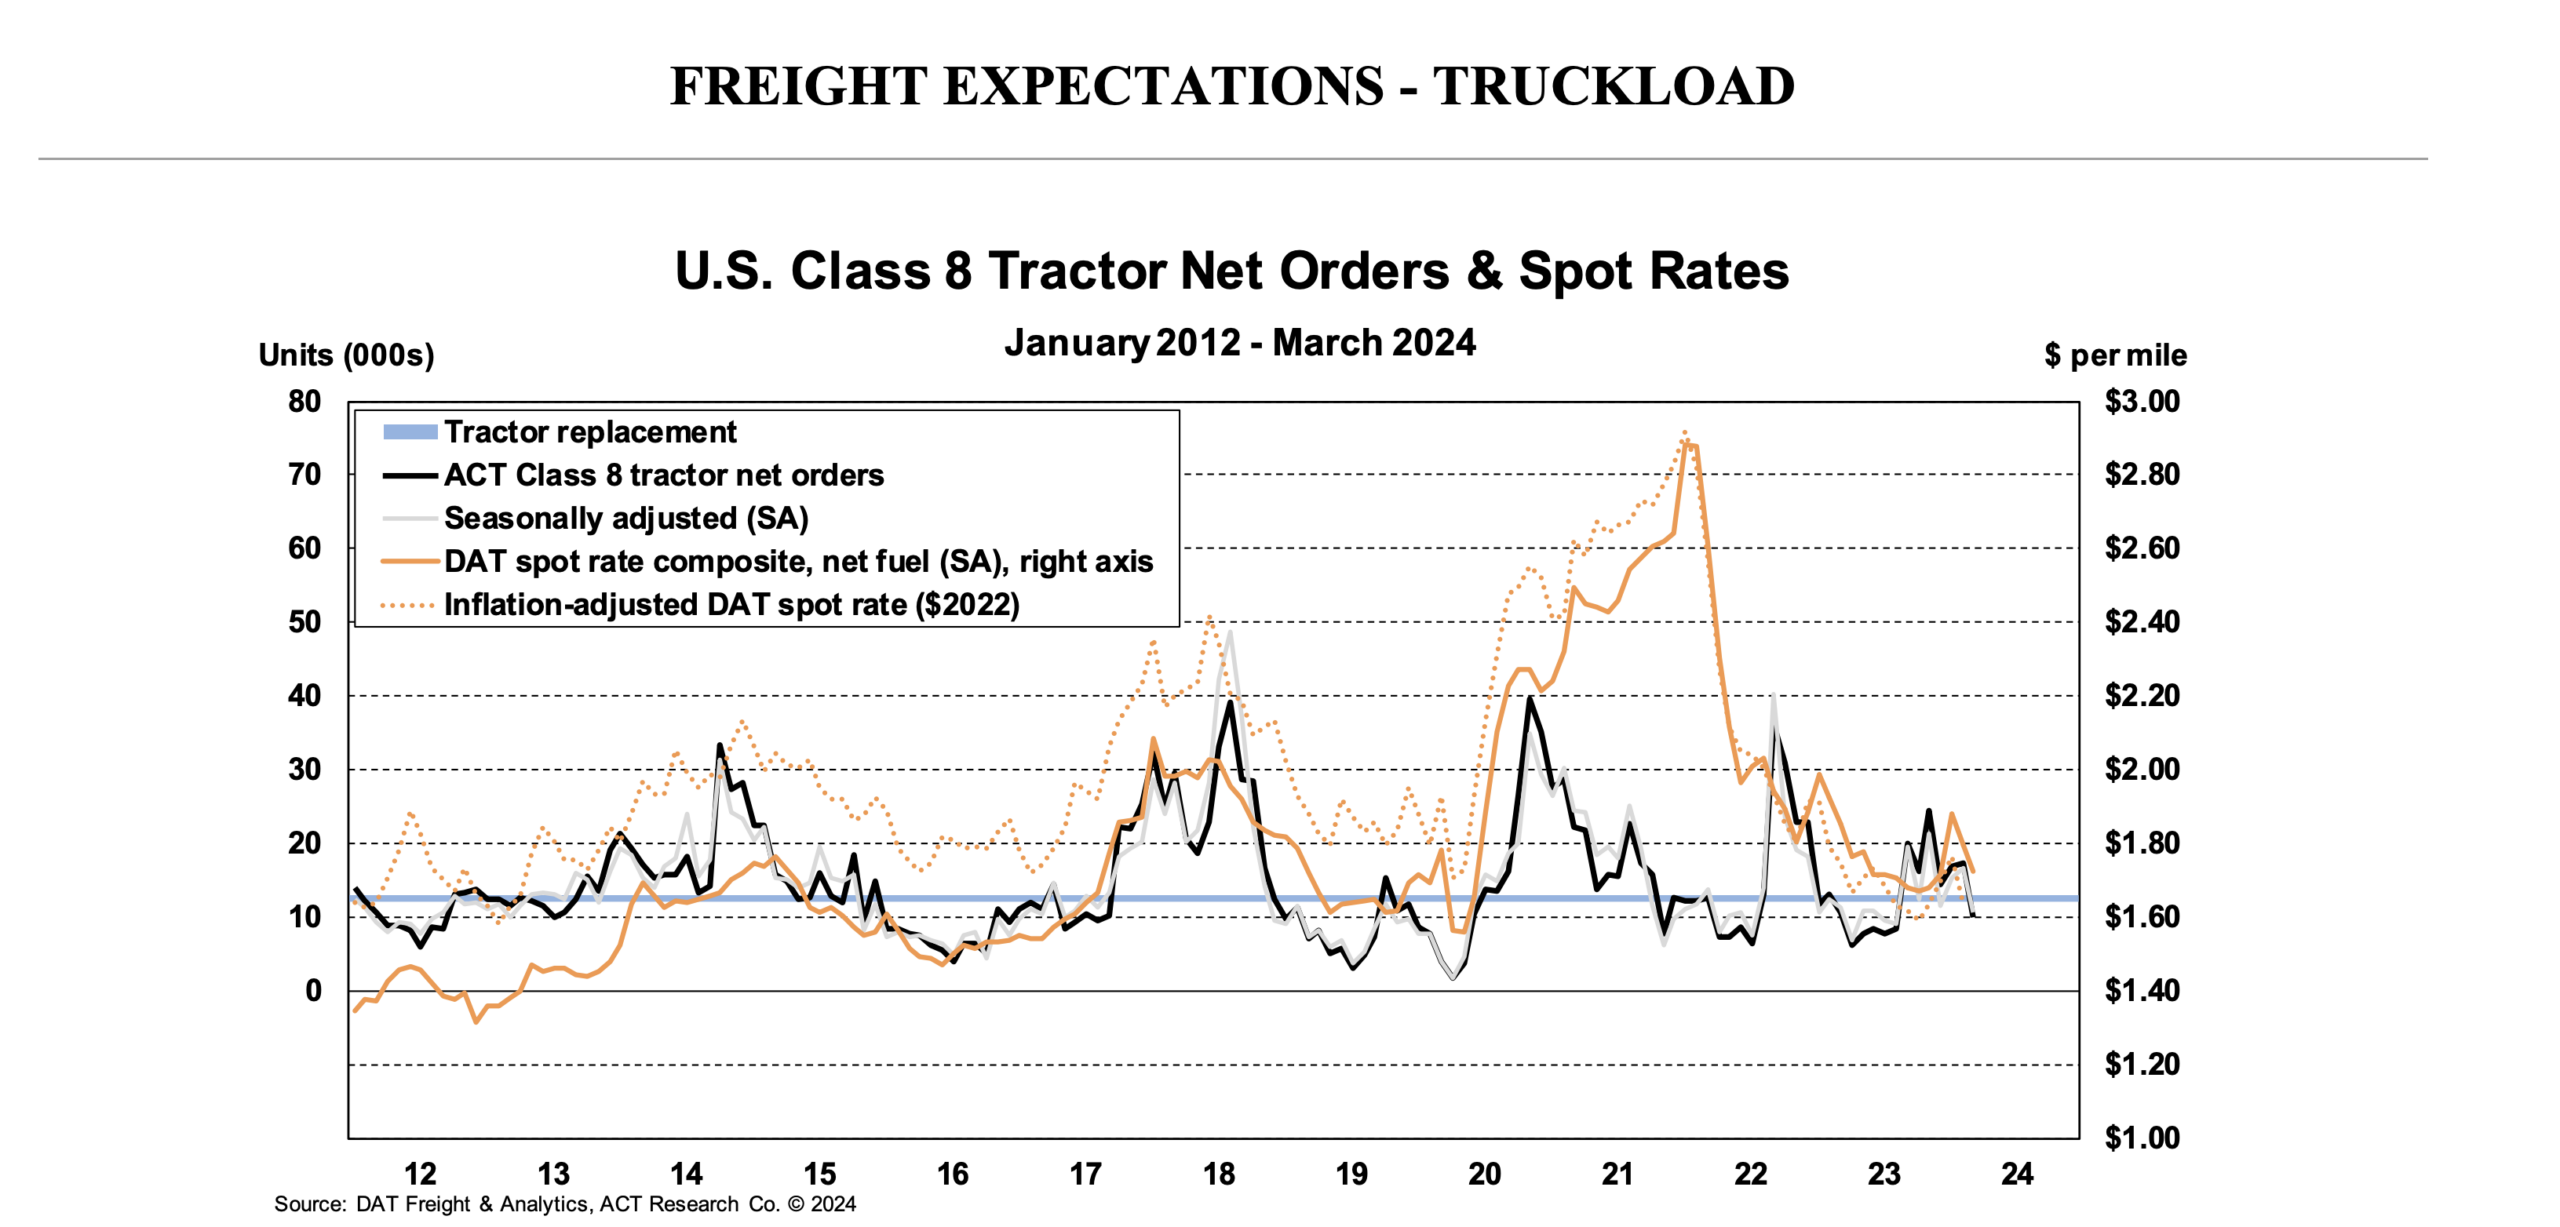
Figure 18: Class 8 Orders vs. Spot Rates – ACT Research

The latest (February) ACT Driver Availability Index reading was flat. Volumes remain relatively low, and ACT projects seasonal declines in Q2. As low rates persist, market conditions will likely apply downward pressure on availability as drivers seek more lucrative opportunities, potentially outside the trucking industry.

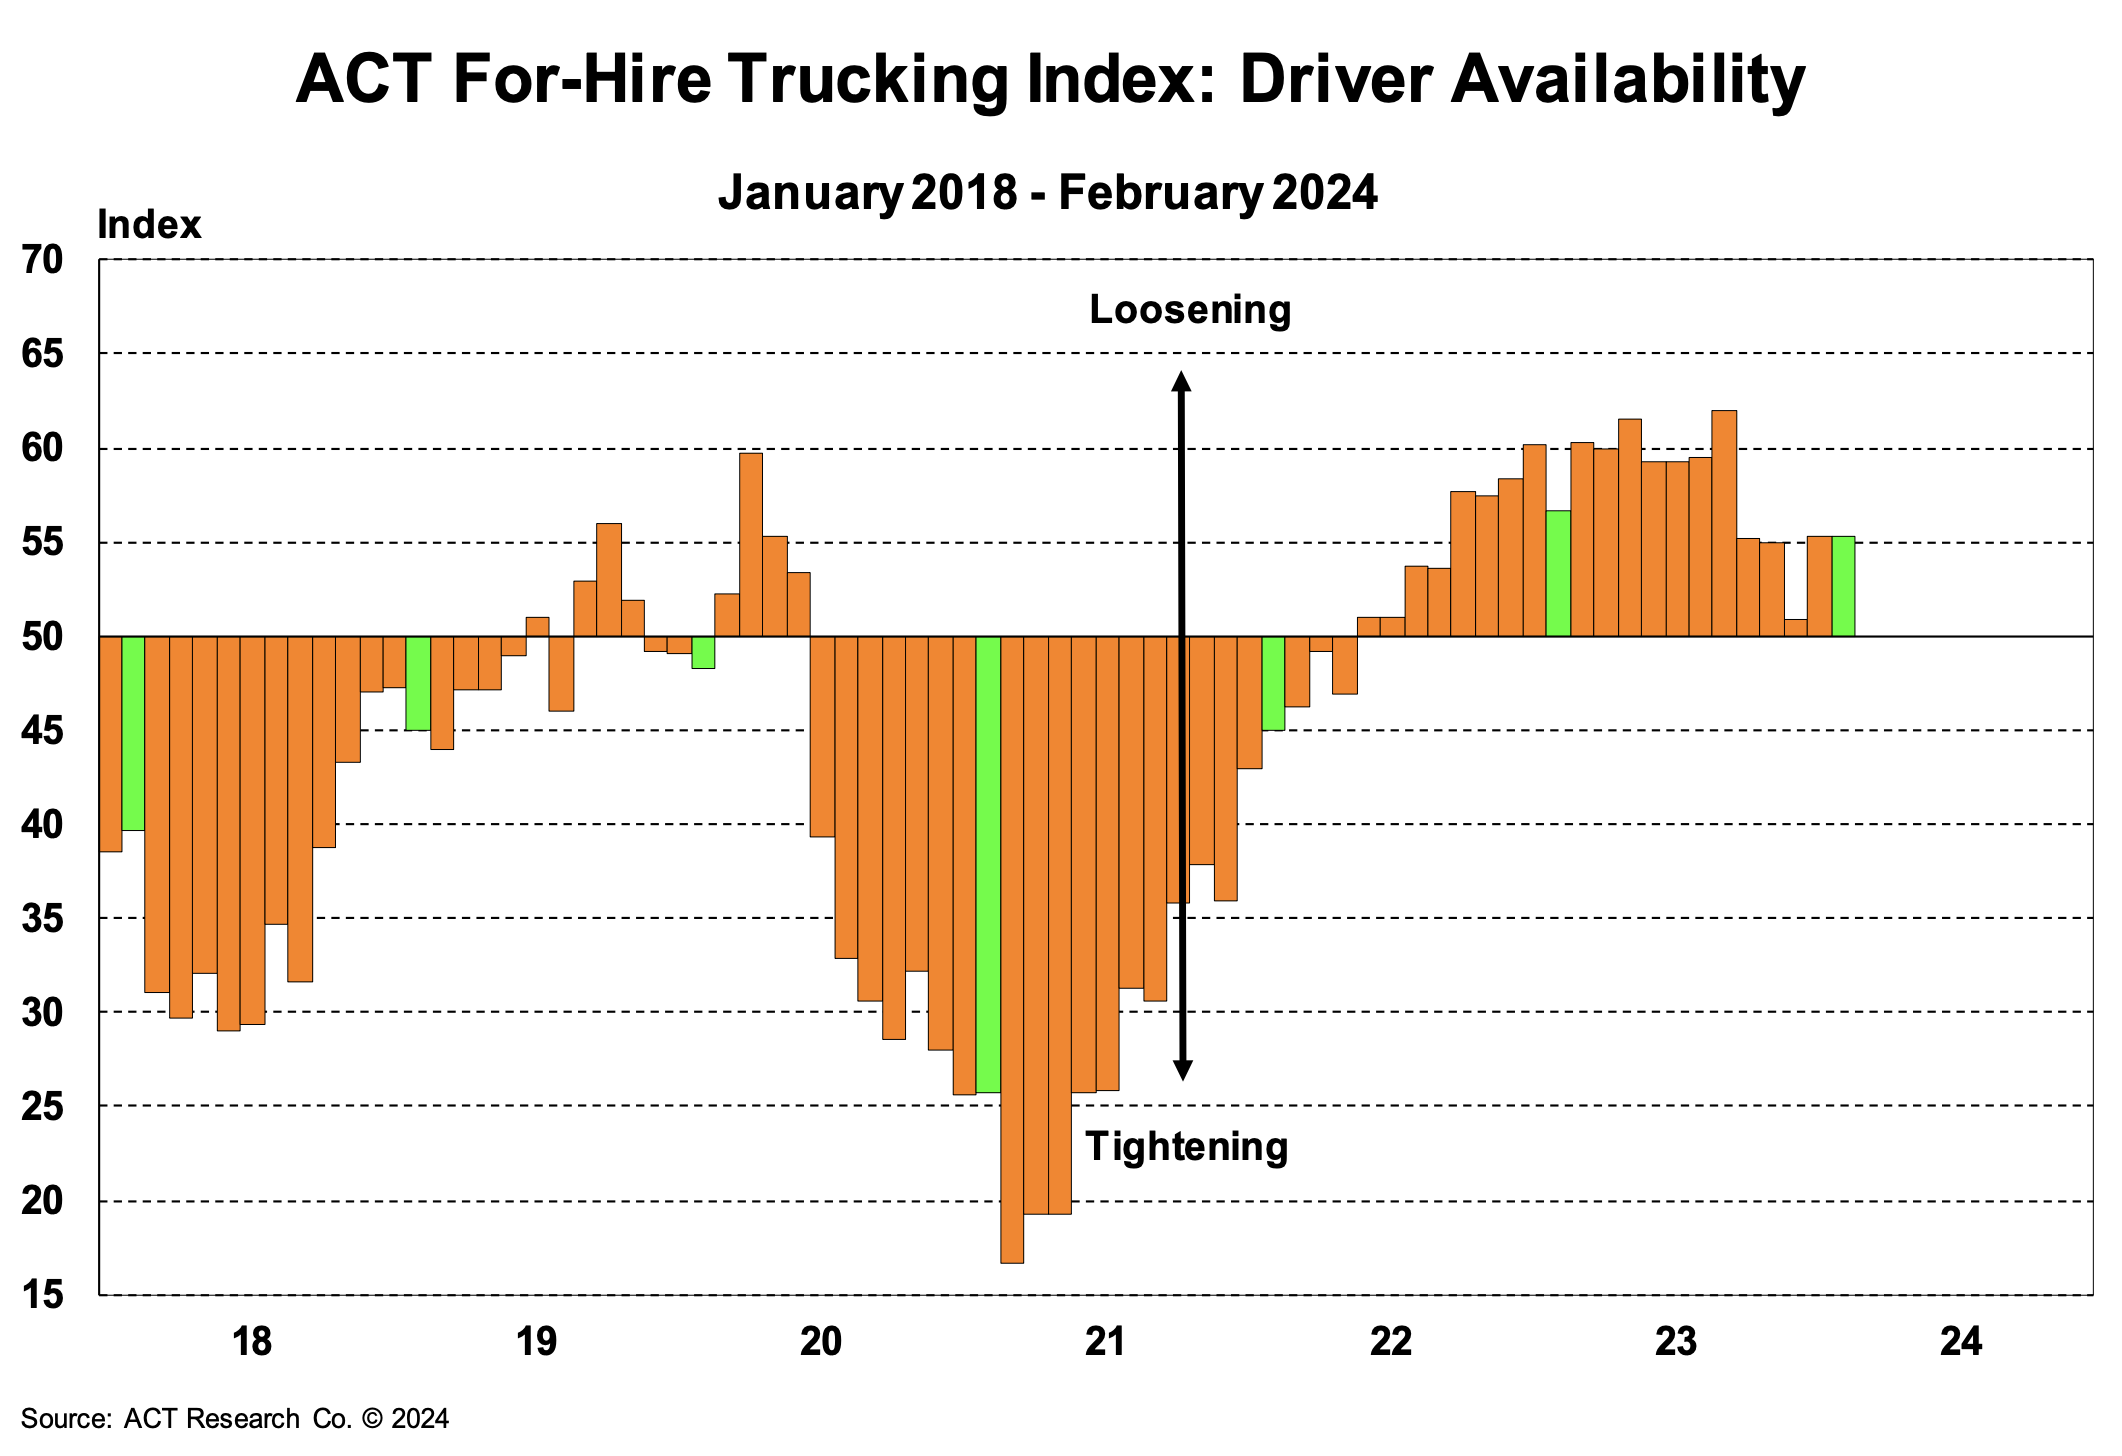
Figure 19: Driver Availability, ACT Research

Volume Outlook

What’s Happening: Imports remain strong despite maritime disruptors.

Why It Matters: Consistently strong import volumes could drive increased truckload demand.

The National Retail Federation (NRF) reported flat imports at 1.96 million TEUs in January. This marked a 25% year-over-year increase, which is projected to be the largest increase for at least the first half of the year. Additionally, the NRF forecasts that over two million TEUs will be imported in a single month for the first time since last fall.

The Francis Scott Key Bridge collapse continues to have regional impacts. Shipments have been rerouted to nearby ports such as Newark, NJ and Norfolk, VA. Despite the bridge collapse and Houthi attacks in the Red Sea, the maritime supply chain remains relatively stable and resilient.

Figure 20: NRF Monthly Imports

Overall, the data indicates relatively stable consumer health, keeping freight demand relatively flat. Production declined year-over-year by two-tenths of a percent in February. However, manufacturing rebounded from January to February, up 0.9%. As destocking comes to a halt, we expect strong manufacturing trends. Retail activity also rebounded in February, and housing starts were up 5.9% year-over-year.

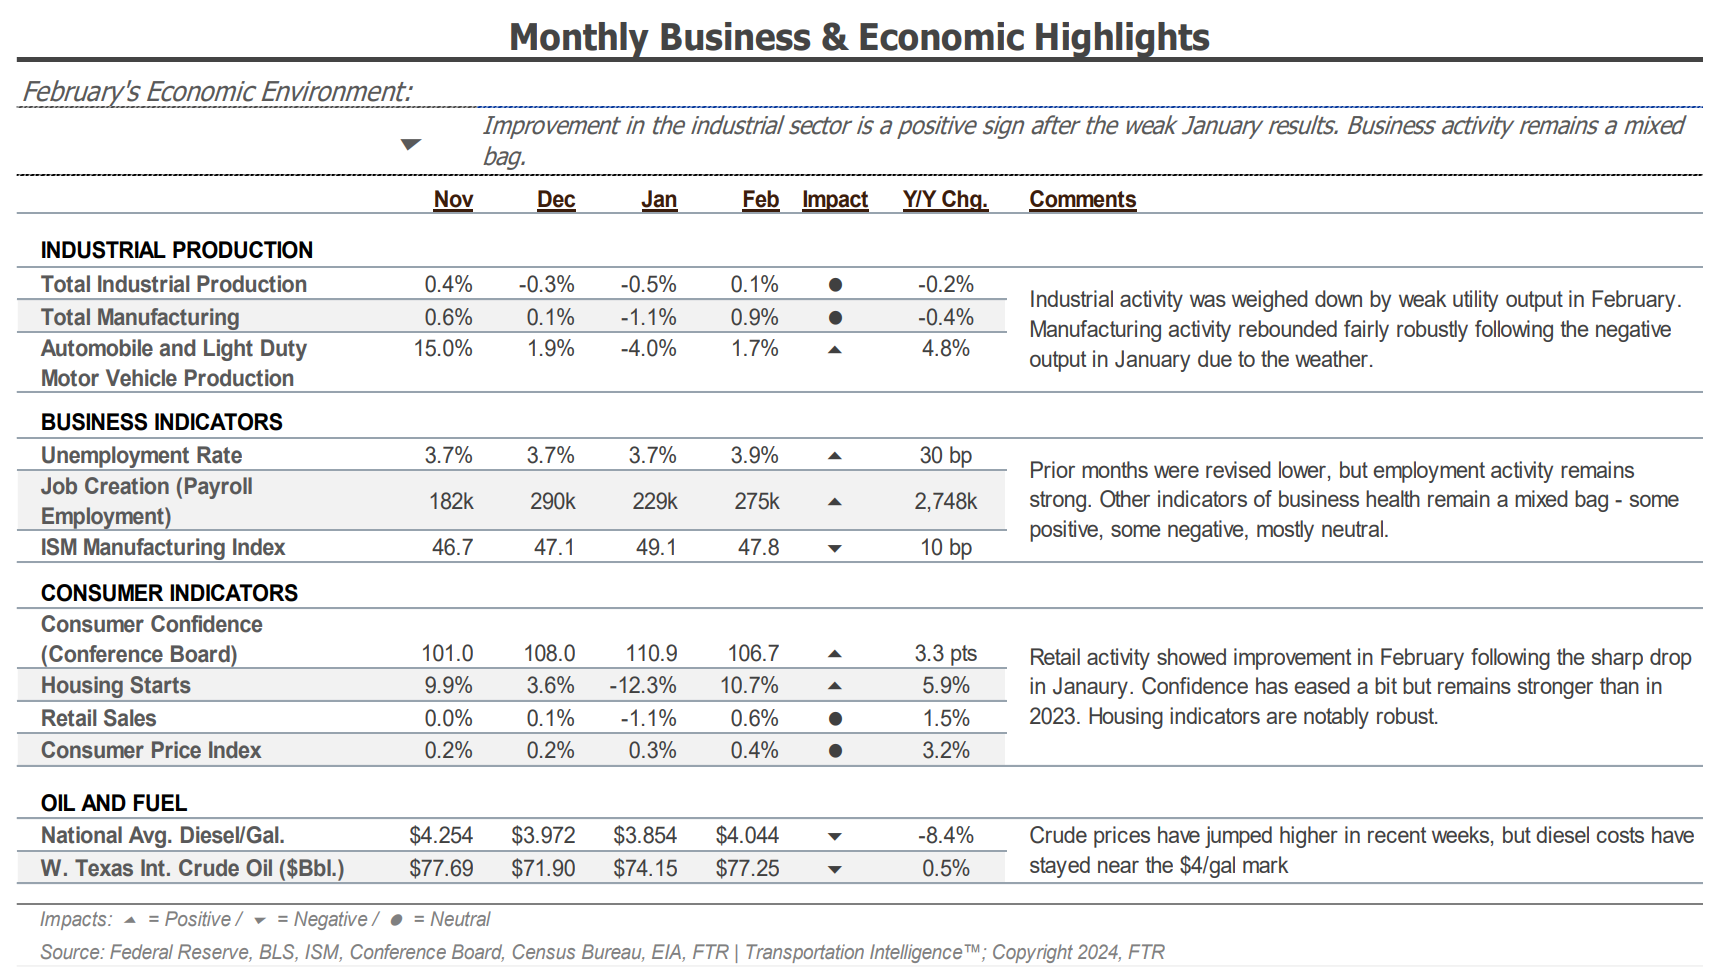
Figure 21: February Business & Economic Highlights, FTR

FTR’s latest truck loadings forecast calls for 0.8% year-over-year growth, up slightly from the estimated 0.7% growth reported last month. No modes are expected to decline in 2024. Reefer freight will likely have the largest annual increase at around 2.7%. Dry van is expected to grow by 1.1% year-over-year, and flatbed is expected to grow by 0.6%.

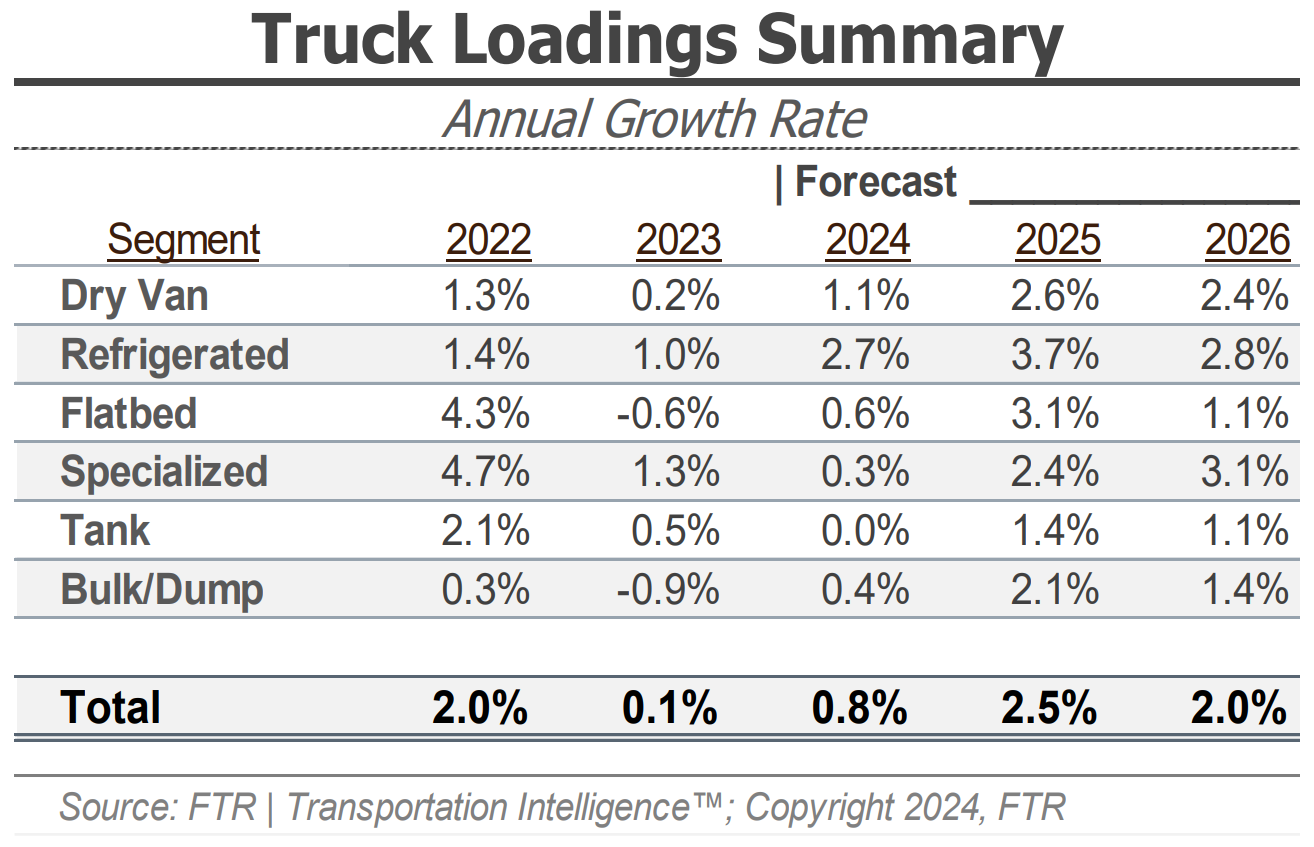
Figure 22: FTR’s Truck Loadings Summaryefer

Consumer Sentiment

What’s Happening: Inflation remains sticky.

Why It Matters: Interest rates could stay elevated for an extended period.

CPI data rose from 3.2% in February to 3.5% in March. Inflation, excluding food and energy, remained at 3.8%. The Fed appears less keen to make cuts in the near term, and there is now a remote chance they won’t cut rates at all this year, which would mean a significant consumer spending increase is unlikely. Once inflation and interest eventually cool, consumer spending should improve and help drive freight demand.

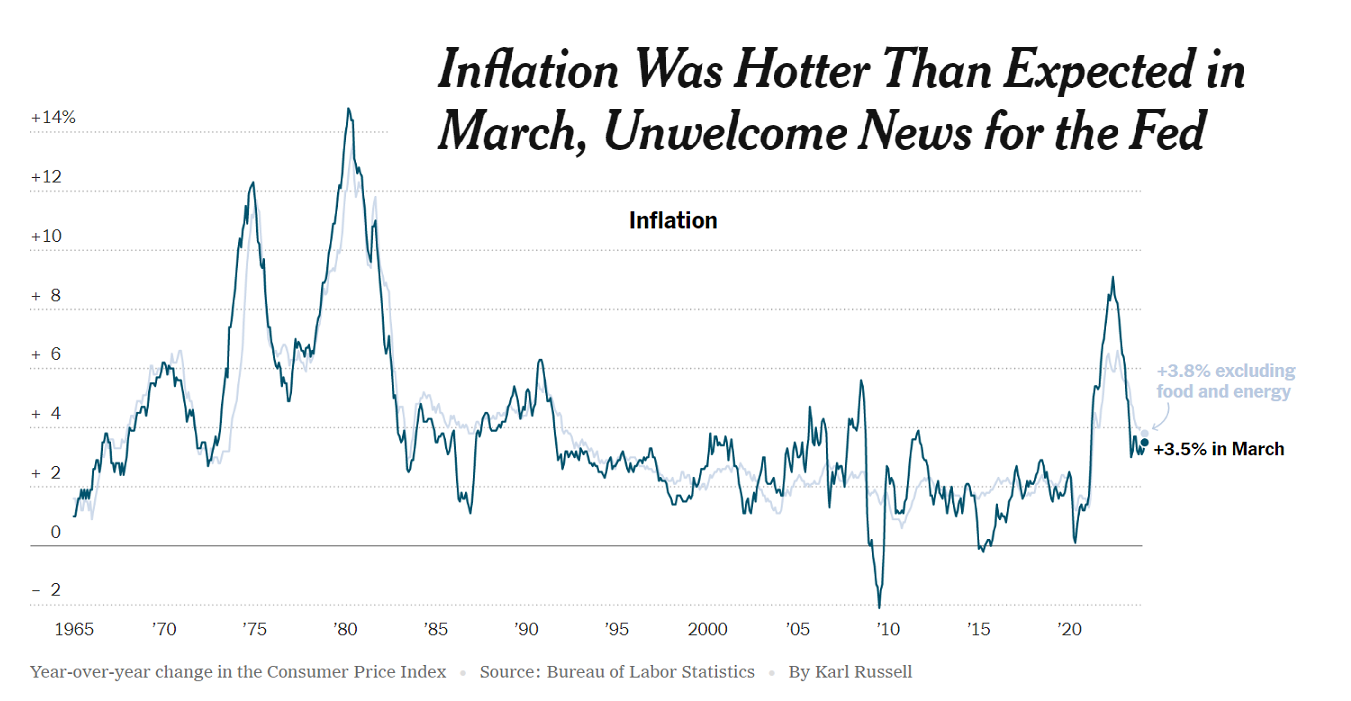
Figure 23: New York Times Inflation Data

Bank of America data showed March card spending increased by 0.3% year-over-year, likely driven by the timing of Easter. However, when removing seasonal factors, March spending declined by 0.7% year-over-year. Despite the slight spending slowdown, consumers remain optimistic thanks to a strong labor market and wages reaching the highest level since early 2023.

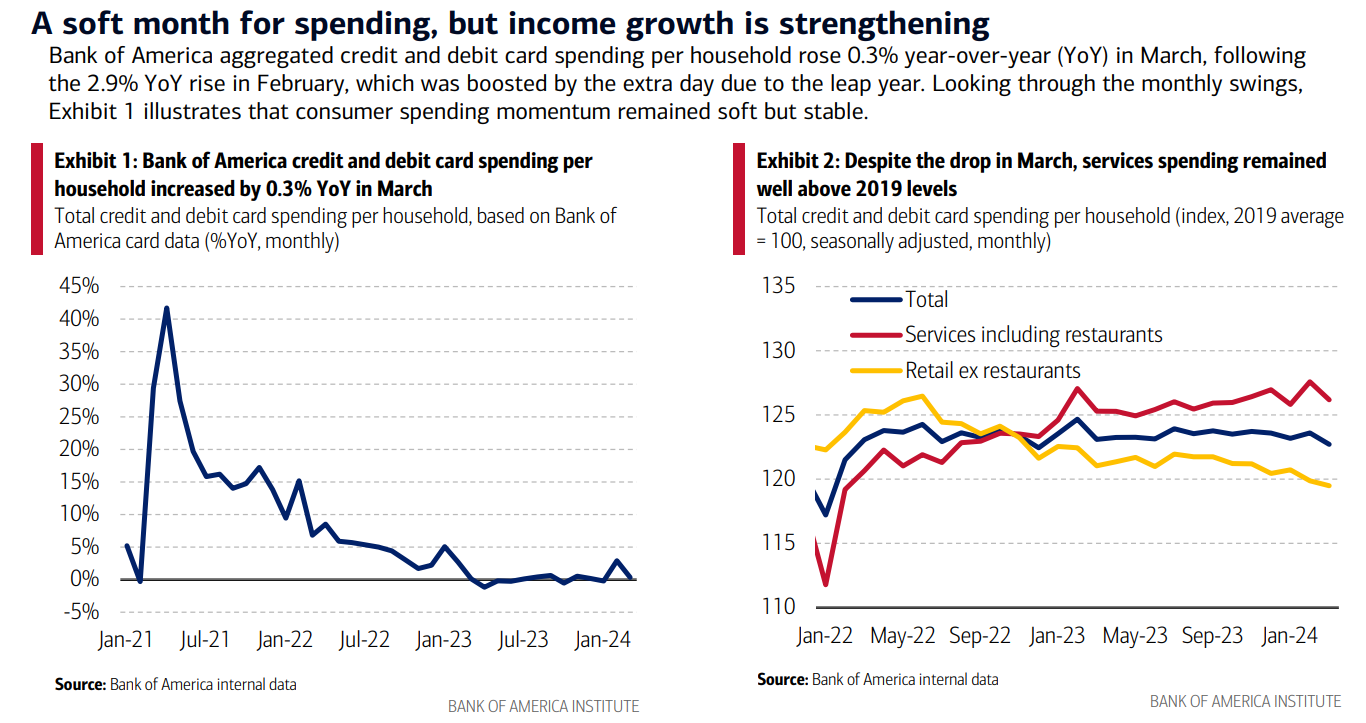
Figure 24: Bank of America Total Card Spending Per Household

Conclusion

March market conditions mostly mirrored February, remaining soft despite short-term seasonal volatility. Dry van and reefer rates reached new cycle lows, and the spot-contract gap increased.

New carrier entrants increased as revocations declined. Some carriers may continue to accept volume even as rates reach new lows to maintain revenue, likely extending the capacity surplus and, in turn, the downcycle. Low demand and ample supply mean the market should be capable of handling domestic disruptions.

From a global perspective, we continue to monitor the mounting tensions in the Middle East. Should the conflicts escalate further, fuel prices could rise and increase carrier operating expenses.

Stateside, sticky inflation will likely keep the Fed from cutting interest rates for the foreseeable future, delaying consumer spending and demand increases that typically follow rate reductions.

For now, shippers and carriers will continue to prepare for the 100 Days of Summer, when rates may rise again.

About the Market Update

The Arrive Monthly Market Update, created by Arrive InsightsTM, is a report that analyzes data from multiple sources, including but not limited to FreightWaves SONAR, DAT, FTR Transportation Intelligence, Morgan Stanley Research, Bank of America Internal Data, Journal of Commerce, Stephens Research, National Retail Federation and FRED Economic Data from the past month as well as year-over-year.  We know market data is vital in making real-time business decisions. At Arrive Logistics, we are committed to giving you the data and insights you need to better manage your freight.

Contact Us

"*" indicates required fields

Carrier Scorecard Feedback

Get Access to the Shipper Portal

Current Customers

Already shipping with Arrive?

Connect with your representative to get access to your ARRIVEnow Shipper Portal. Can’t connect with your rep? Use this form to reach out.

New Customers

Not shipping with Arrive yet?

If you’re not an Arrive customer, please join our network to access the portal.

Use of Cookies

We use cookies to enhance your browsing experience, serve personalized ads or content, and analyze site traffic. By continuing to use this website, you acknowledge and consent to our use of cookies as detailed in our privacy policy.

Fraud Prevention

Freight fraud continues to impact our industry. We encourage shippers and carriers to reach out to Arrive immediately if there is ever a shipment in question that may be subject to fraud. Arrive Logistics registered email domain is @arrivelogistics.com. Our 24/7 phone number is 888-861-0650 and our leadership team can also be reached at feedback@arrivelogistics.com

Arrive Carrier Requirements

Please have the following info ready to complete registration

  • MC, MX, DOT, or state reg #
  • Tax ID & W9 info
  • Cert of Insurance: $100k cargo, $1M Auto, & $1M commercial general liability coverage
  • Active Common or Contract Authority (365+ days)
  • Safety Rating of at least Satisfactory (or None)

Subscribe to receive freight market updates​

"*" indicates required fields

Quick Apply

"*" indicates required fields

Max. file size: 50 MB.

Download this Report

"*" indicates required fields

Add me to the monthly distribution