


January truckload demand was in line with typical seasonal patterns for the most part. We believe the tightness early in the month was primarily the result of capacity trends, not a demand surge. Some severe winter weather throughout the month led to a slight spot activity increase relative to December, but year-over-year comparisons still highlight significant spot demand declines. Contract indices illustrate a slight pullback from late 2022, but a seasonal downshift is normal and expected in the first quarter.
The FreightWaves SONAR Outbound Tender Volume Index (OTVI), which measures contract tender volumes across all modes, was down 31% year-over-year, or 18% when measuring accepted volumes after the significant decline in tender rejection rates. This large decline is inconsistent with other sources, providing further evidence that FreightWaves data is likely heavily skewed toward retail freight rather than the overall market. Though unconfirmed by FreightWaves, considering retail-related demand has slowed substantially since Q4 2021, it would help explain the significant drop in volumes.
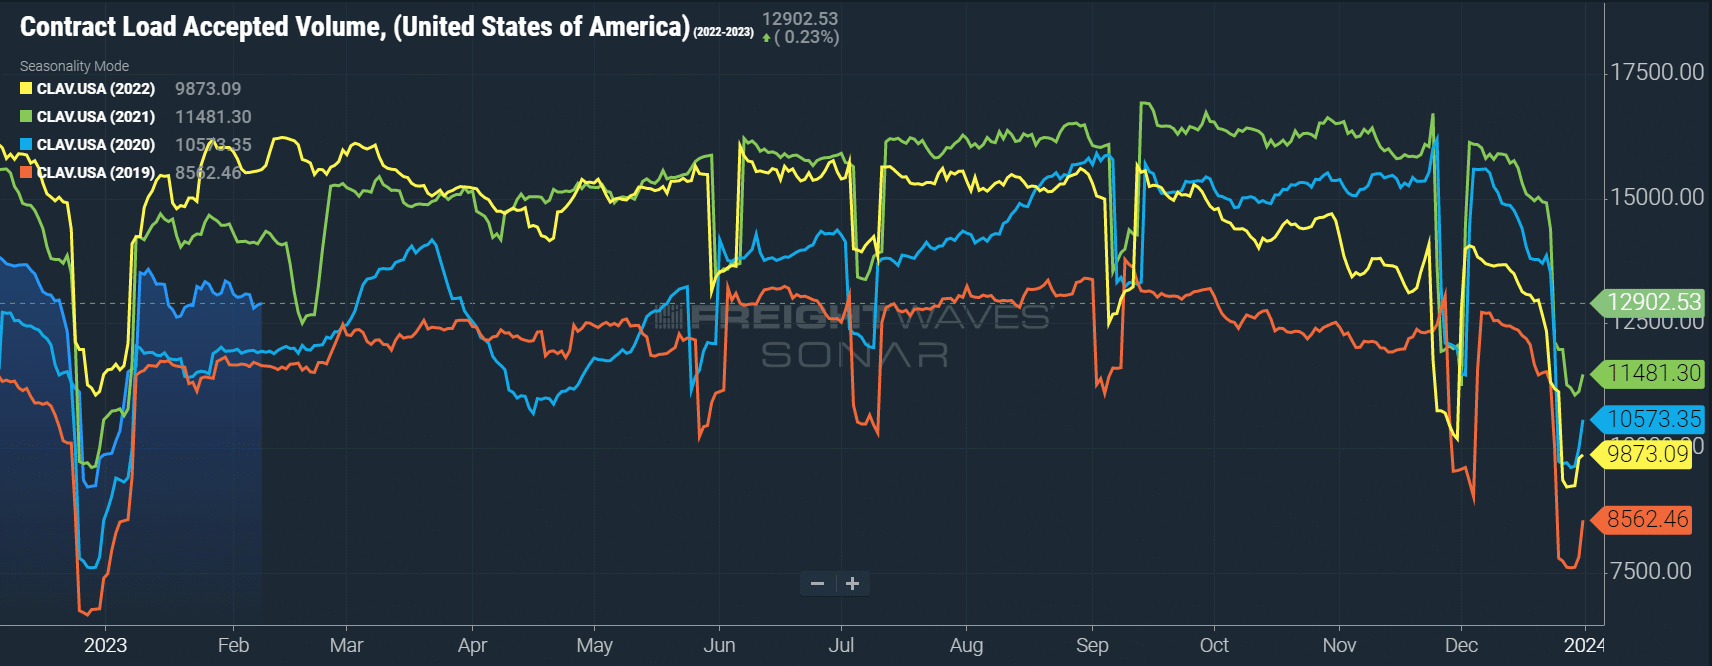 Figure 1: Contract Load Accepted Volume (SONAR): Accepted contract volumes are down 17.9% y/y in early February but remain above historical pre-pandemic levels.
Contract freight still leads the way and spot volumes continue to suffer as shippers experience more strong routing guide compliance. DAT data shows year-over-year spot volumes declined 68.5% in January, despite increasing 1.2% month-over-month from December. The increase in spot posts was likely due to disruption caused by widespread severe winter weather and carriers taking time off around the holidays and into the month.
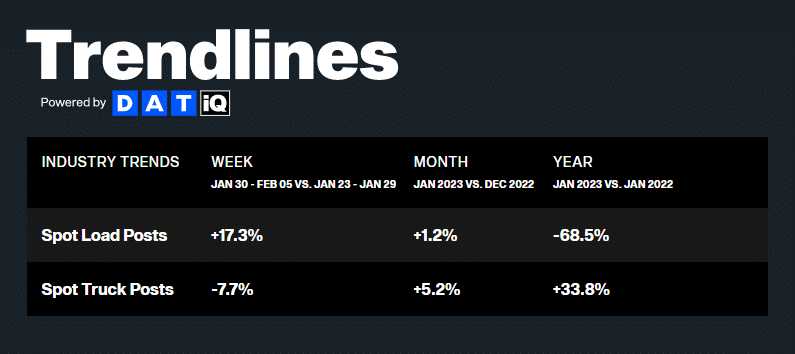 Figure 2: Industry Trends, Spot Load Posts vs. Spot Truck Posts
Conditions in the first quarter are typically the softest they will be all year. After several weeks of lingering holiday disruptions, the market has loosened up right on queue, and capacity remains more than sufficient to meet current demand.
The Sonar Outbound Tender Reject Index (OTRI) measures the rate at which carriers reject the freight they are contractually required to take. The rate declined steadily throughout the month, from 5.5% in early January to 3.47% in early February, indicating that shippers are still seeing good routing guide compliance on contractual freight. Reefer tender rejections aligned with van rejections, easing throughout the month.
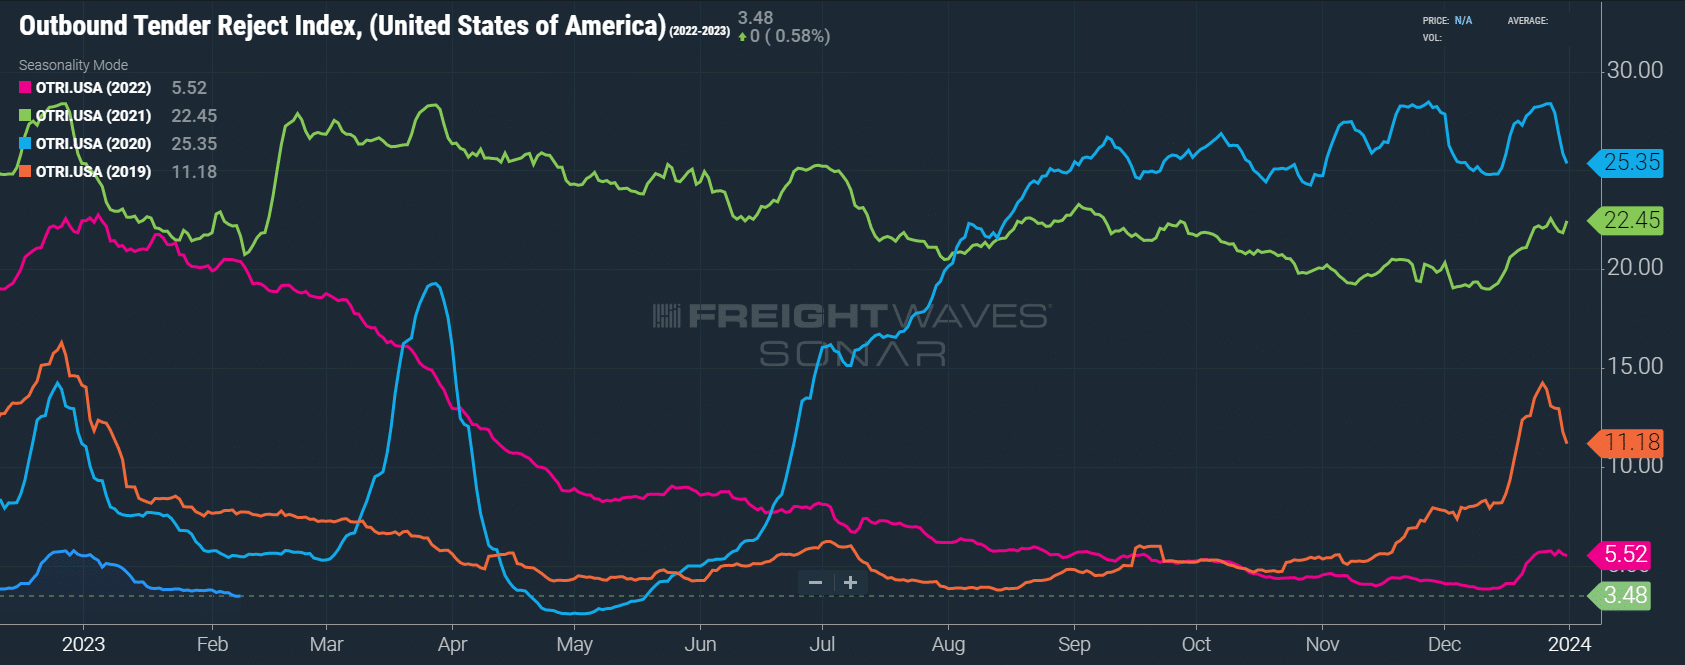 Figure 3: Outbound Tender Reject Index (SONAR): OTRI spiked in line with normal seasonal pressures around the holidays but remains at an all-time low for this time of year — a sign carriers are protecting their contract freight.
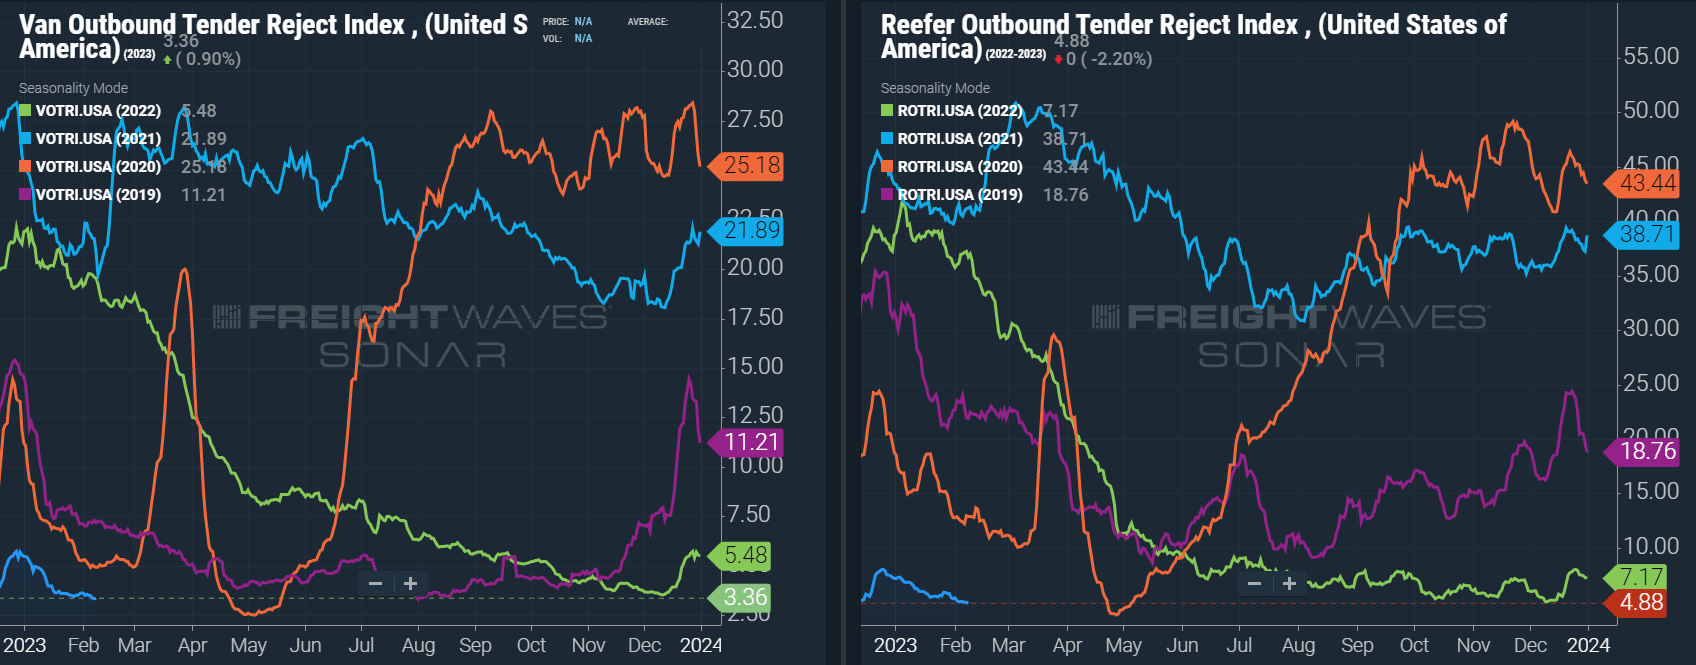 Figures 4 & 5: Van & Reefer Outbound Tender Reject Indices (SONAR): Dry van and reefer tender rejections are trending at all-time lows for this time of year, with dry van rejection rates below 3.5% and reefer rejections below 5%.
The DAT Load-to-Truck Ratio measures the total number of loads relative to the total number of trucks posted on their spot load board. In January, the Dry Van Load-to-Truck Ratio decreased 13% month-over-month and remained down 68% year-over-year. At 3.01 loads per truck, current levels are typical of equilibrium market conditions. Likewise, the Reefer Load-to-Truck Ratio decreased month-over-month, falling 14.6% from December and remaining down 76% year-over-year.
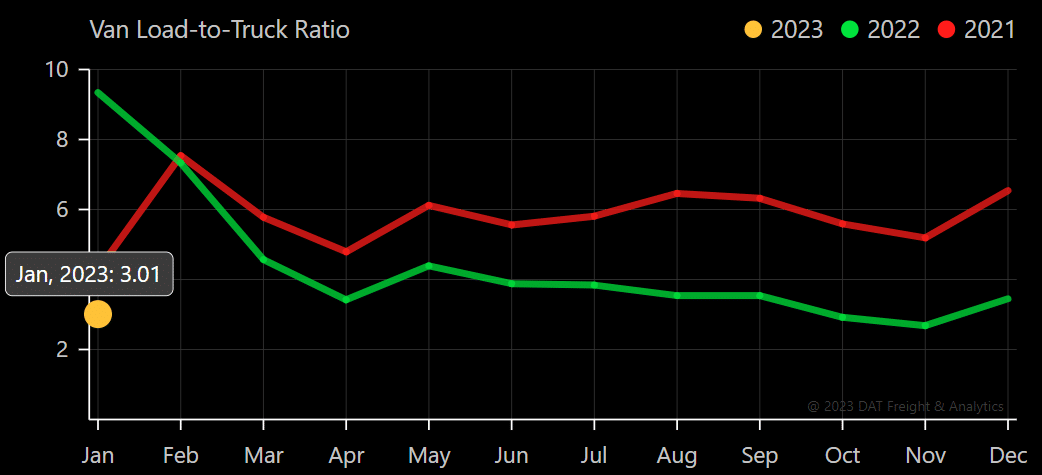 Figure 6: Van Load-to-Truck Ratio
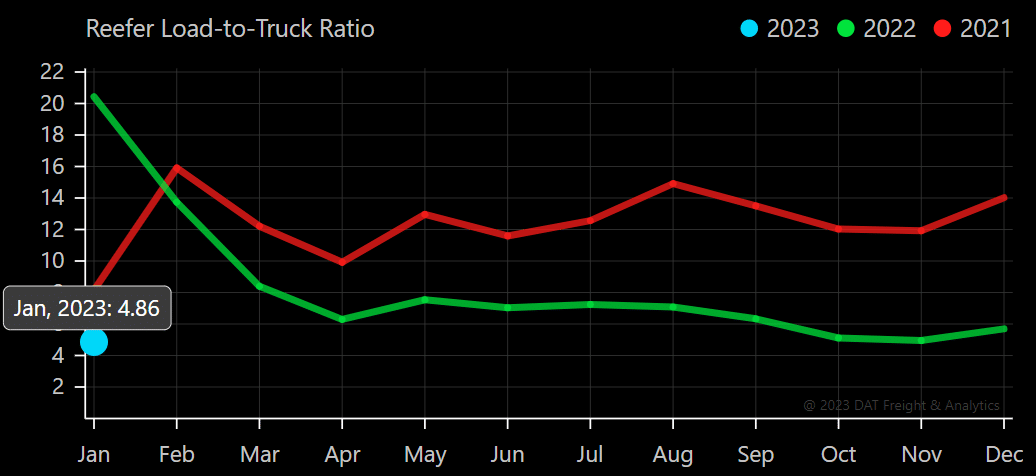 Figure 7: Reefer Load-to-Truck Ratio
Weekly Load-to-Truck Ratio trends help illustrate the easing that occurred late in January before widespread winter weather increased spot activity in the first week of February. As we progress deeper into first-quarter seasonal slowdowns, conditions will likely moderate further in February.
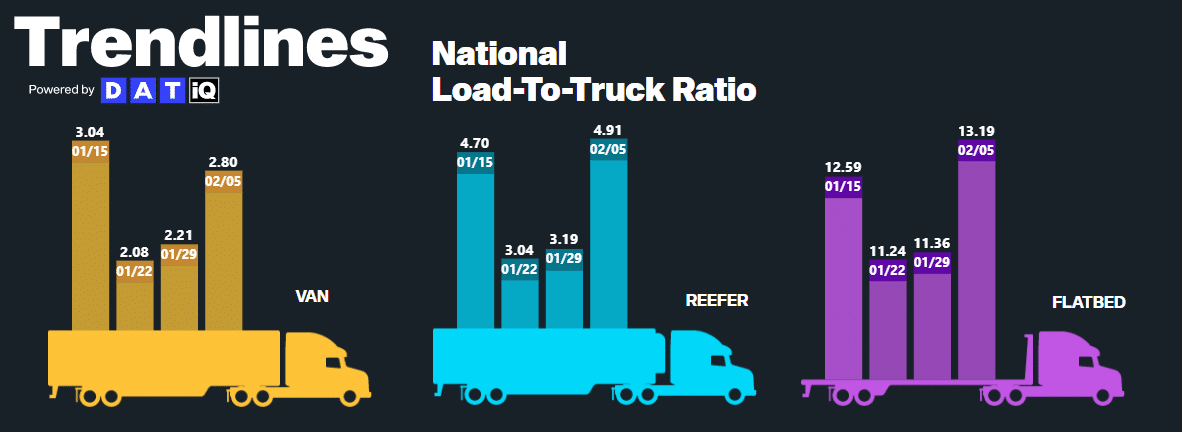 Figure 8: DAT Trendlines, National Load-to-Truck Ratio
The Morgan Stanley Dry Van Freight Index is another measure of relative supply; the higher the index, the tighter the market conditions. The black line with triangle markers on the chart provides a great view of what directional trends would be in line with normal seasonality based on historical data dating back to 2007.
January trends underperformed typical seasonality, indicating that conditions softened more than usual before the early February winter weather disruptions. We anticipate further softening throughout February, followed by possible disruption due to the early produce season in mid-March.
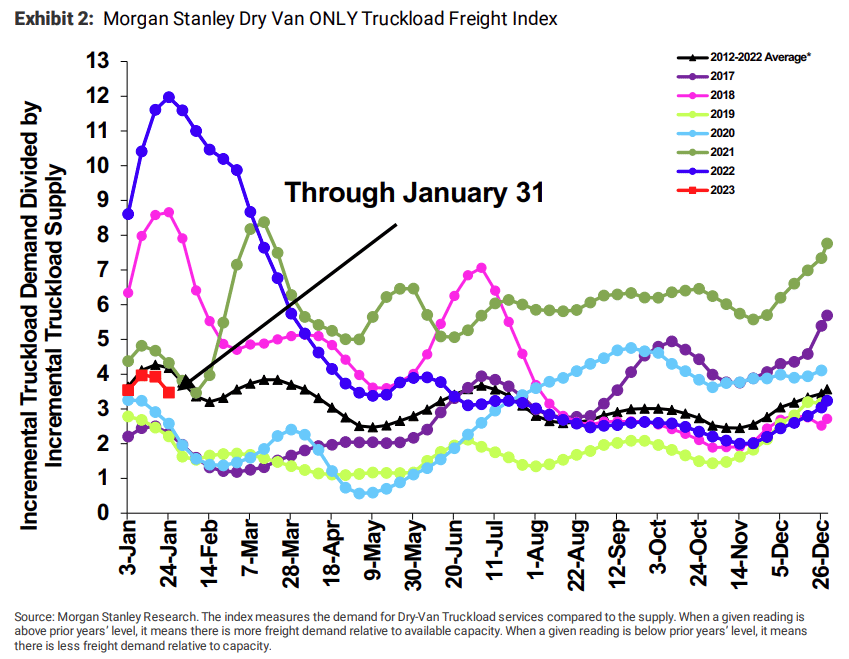 Figure 9: Morgan Stanley Dry Van Only Truckload Freight Index
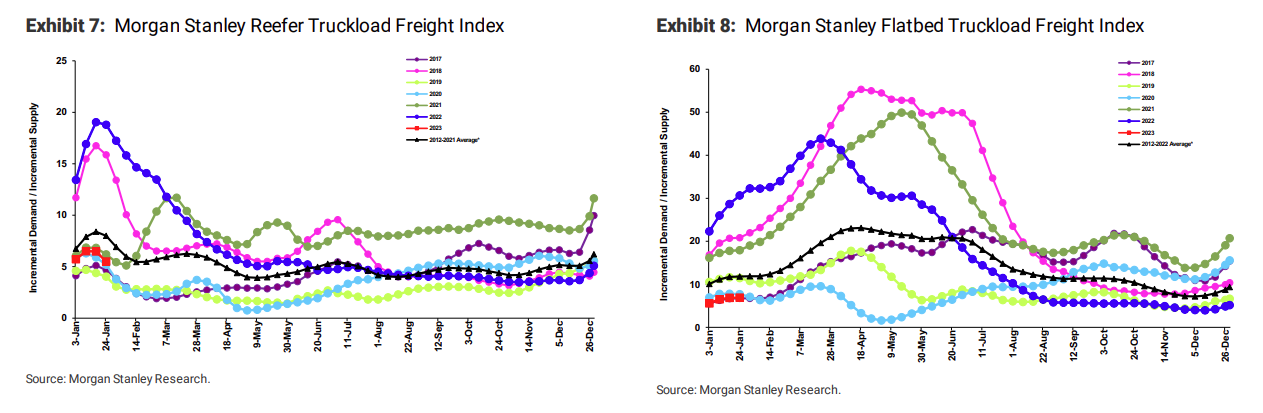 Figures 10 & 11: Morgan Stanley Reefer & Flatbed Truckload Freight Indices
Following the same trend as capacity, rates eased throughout January after some short-lived year-end volatility. When looking at Truckstop’s weekly rate chart, it’s clear the holiday surge was significant, but as in previous years, it lasted only a few weeks. In turn, rates responded to rapidly normalizing capacity conditions as the month progressed.
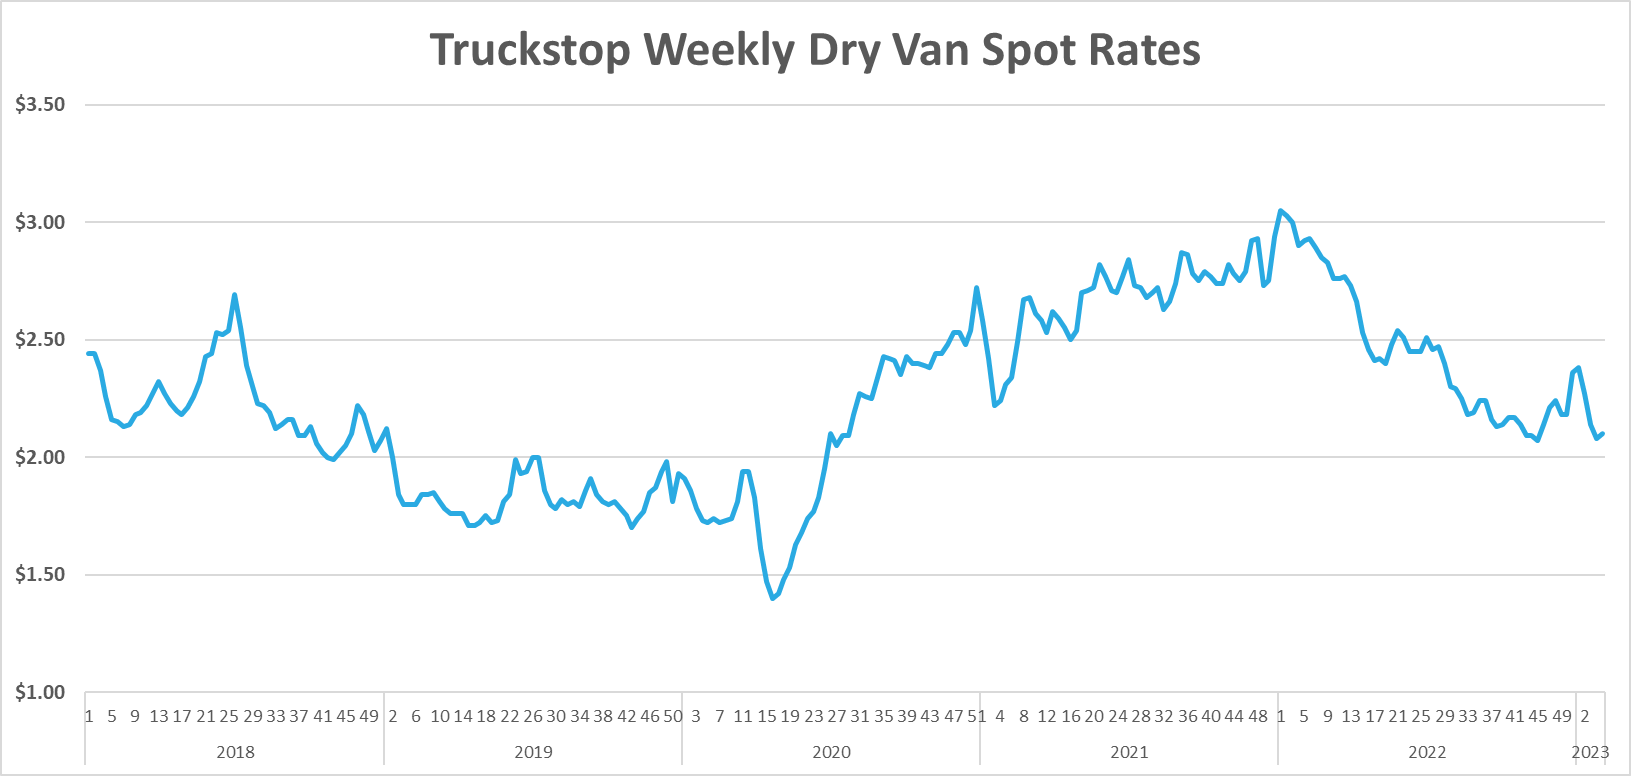
Figure 12: Truckstop Weekly Dry Van Spot Rates
According to DAT, all-in spot rates, including linehaul and fuel costs, are down across all three modes in early February, mirroring the trend demonstrated in recent capacity data and weekly Truckstop data. As of February 10th, van and reefer equipment have seen greater decreases than flatbed equipment, falling by $0.09 and $0.14, respectively, compared to just $0.04 for flatbed.
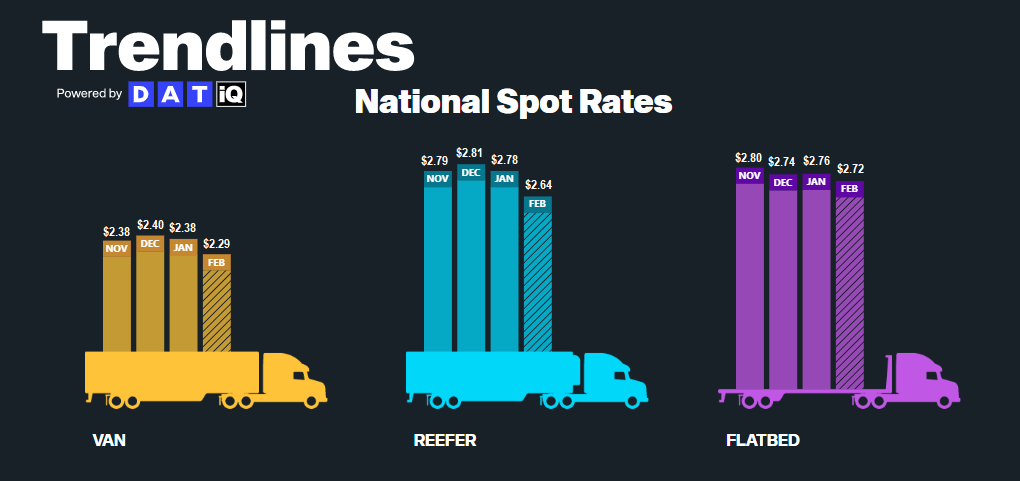 Figure 13: DAT Trendlines, National Spot Rates
Early February linehaul data shows spot and contract rates have resumed the downward trend of the past year. Though the holiday surge was more significant than anticipated, recent trends are falling closely in line with our forecast. We anticipate spot rate declines to continue over the next month and contract rates to follow suit for several more months as more shippers lock in lower pricing and as new business goes live.
Recent spot rate spikes helped close the spot-contract gap to $0.53 in January, but declining rates in early February quickly drove it back up to $0.59. As a result, downward pressure on contract rates should continue for the foreseeable future, even if the market experiences some seasonal pressures in the back half of the second quarter.
All-in spot rates are down 26% on a year-over-year basis, and linehaul spot rates are down nearly 34%. All-in contract rates are down 6.5% year-over-year, and linehaul contract rates are down 11.1% from their February 2022 peak.
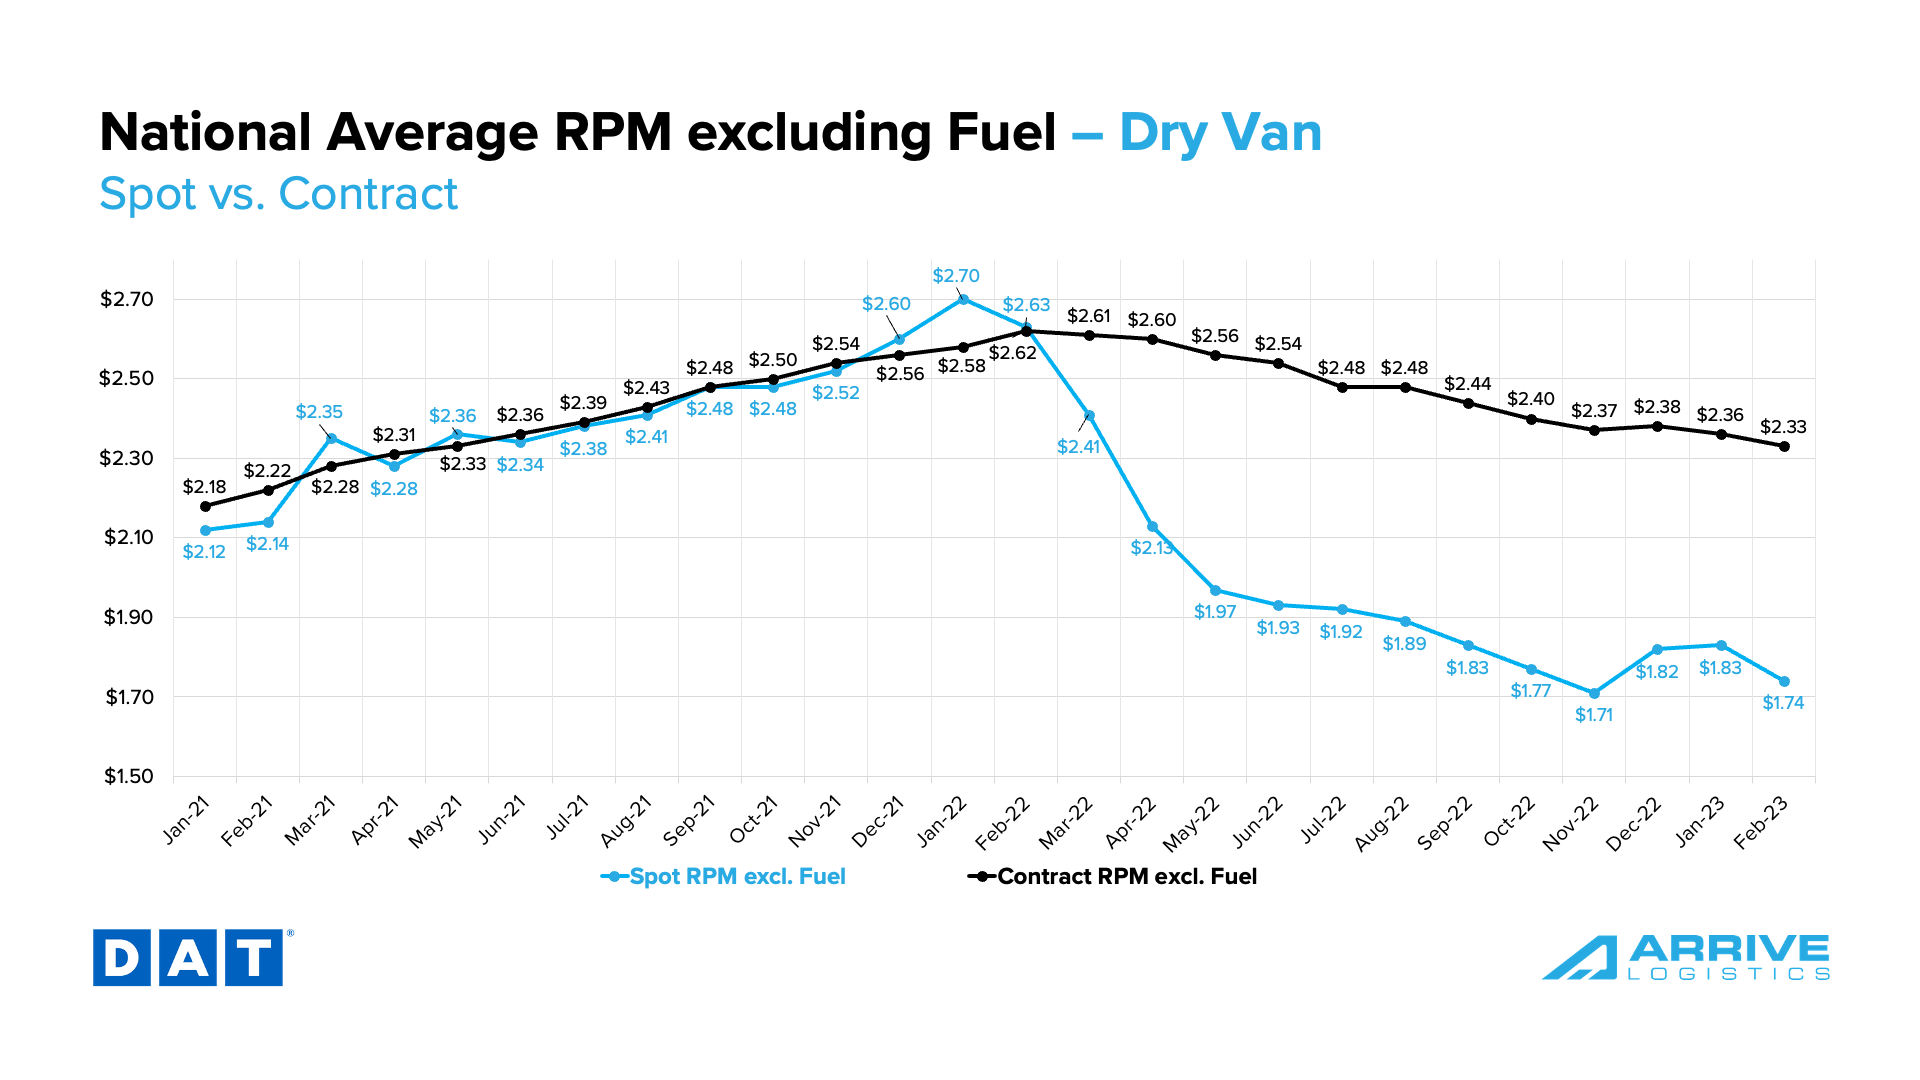 Figure 14: DAT National Average RPM, Dry Van, Spot vs. Contract: Van spot rates surged in late December and early January as the spot market heated up. As anticipated, rates have fallen in Q1 as supply and demand rebalanced to pre-holiday conditions.
Following a similar pattern to van rates, reefer spot and contract linehaul rates are down early in the month. The current reefer contract rate is $2.55 per mile, excluding fuel, while the current reefer spot rate at $2.04 per mile, excluding fuel — a 35% decrease from $3.15 per mile in January 2022, the peak for reefer spot rates. Contract rates are now down by $0.22 per mile, excluding fuel, from their peak of $2.77 in May 2022.
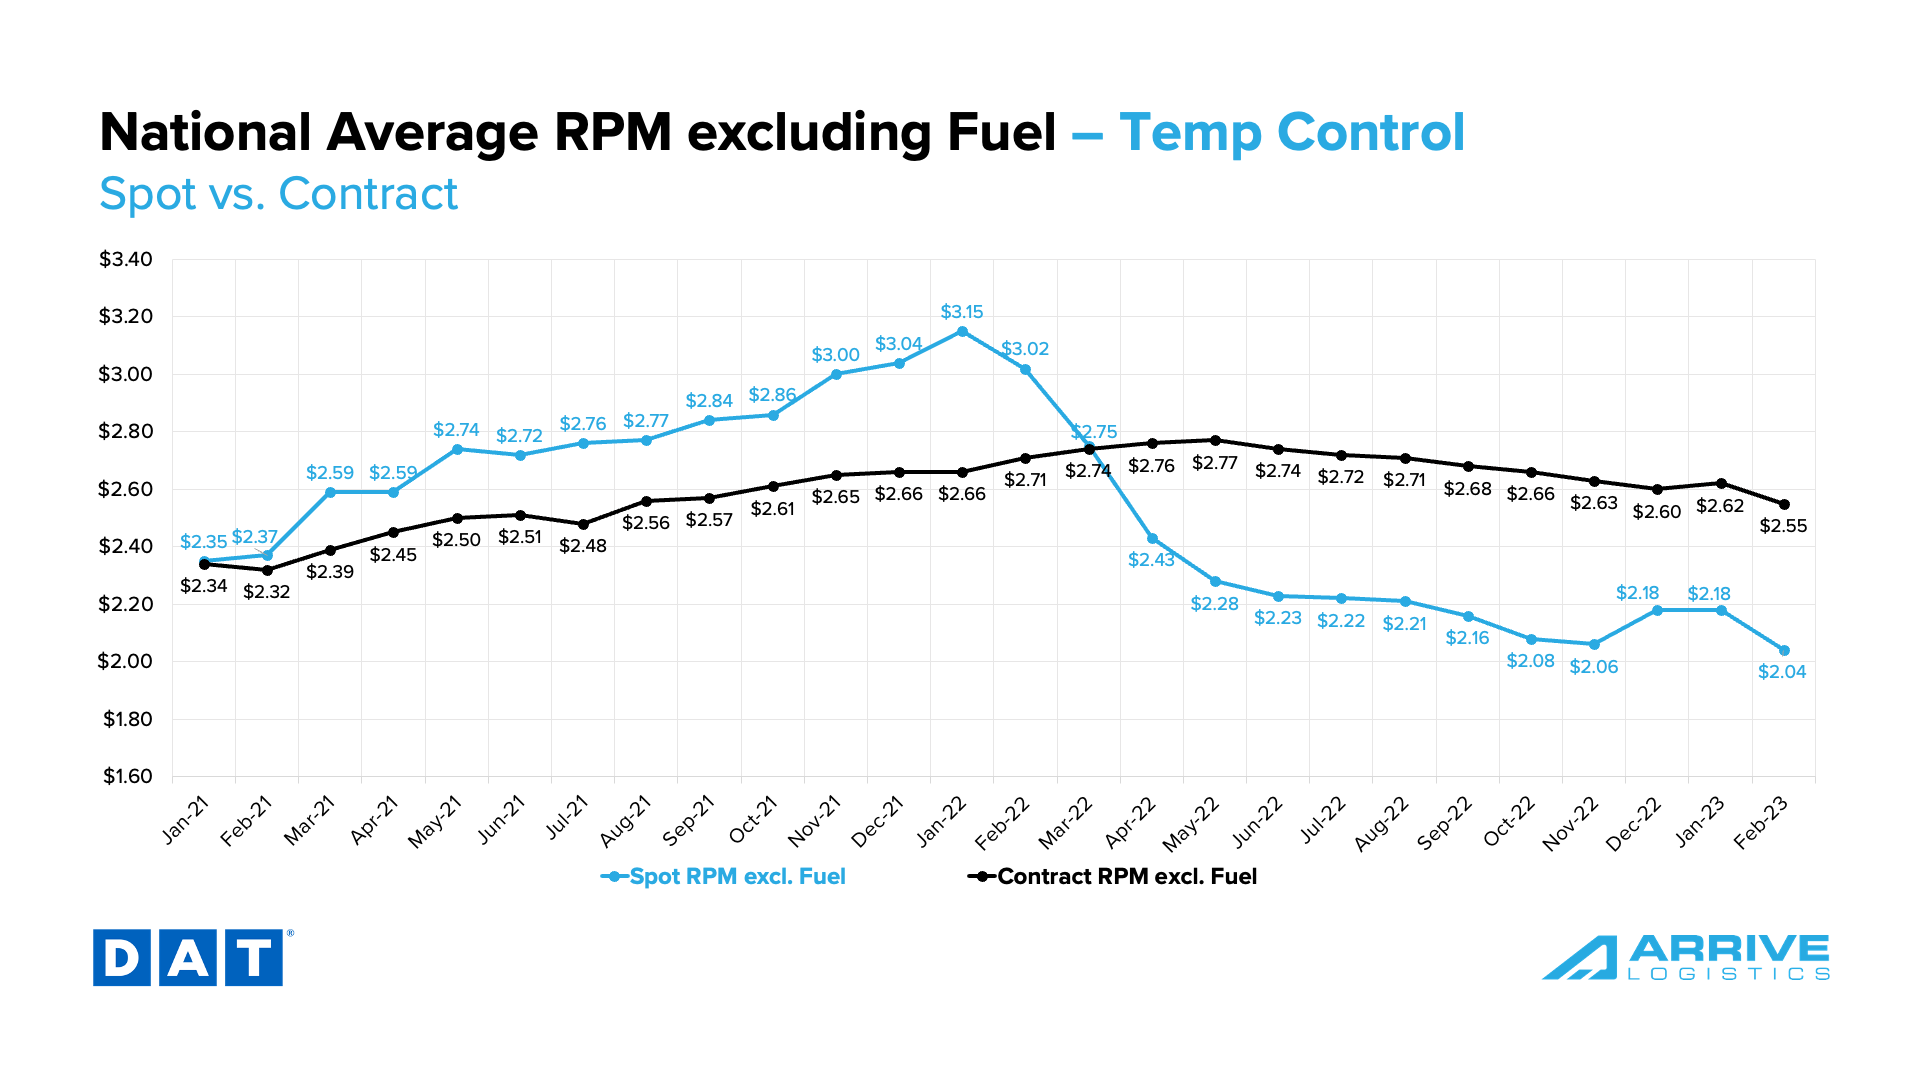 Figure 15: DAT National Average RPM, Temp Control, Spot vs. Contract
In the flatbed market, both spot and contract rates decreased after increasing for several months. The current spot rate is $2.06 per mile, excluding fuel. Flatbed contract rates are currently $2.83 per mile, excluding fuel.
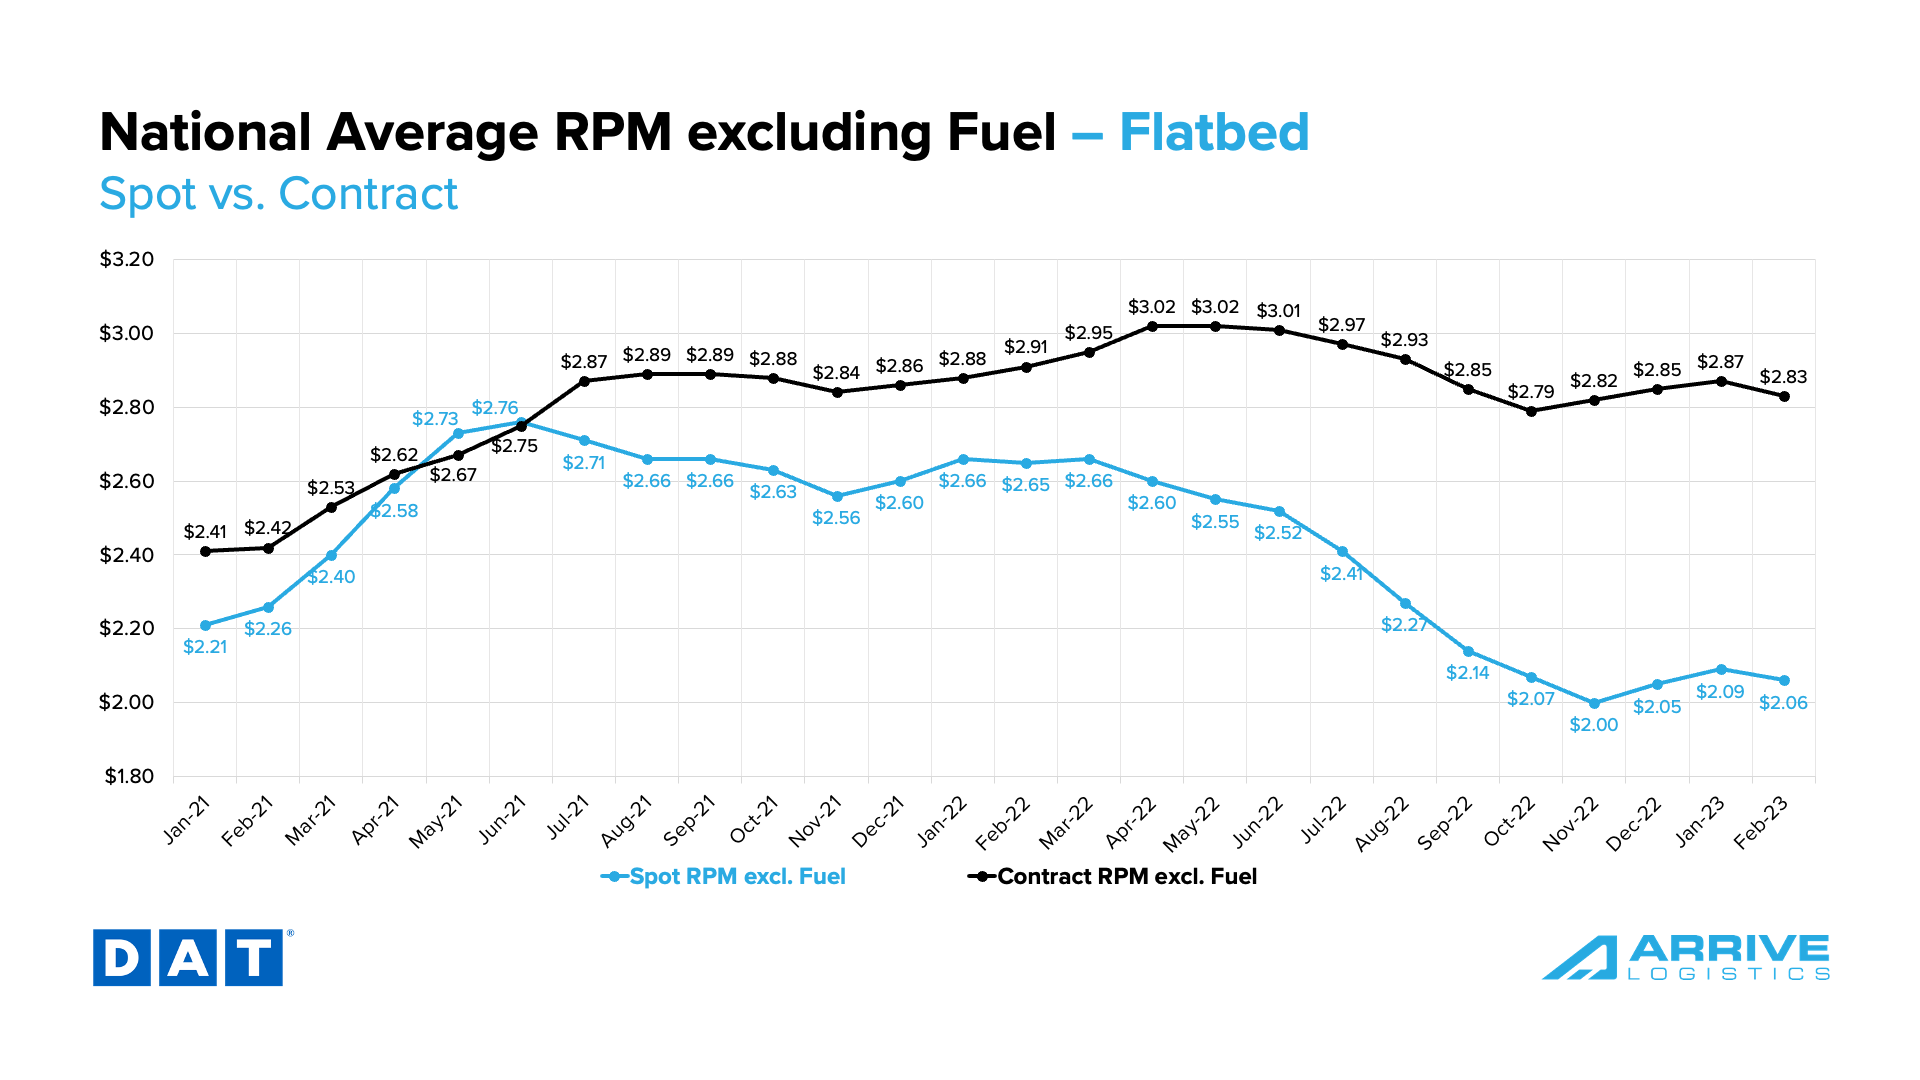 Figure 16: DAT National Average RPM, Flatbed, Spot vs. Contract
Revocations of trucking authority, as calculated by FTR, remain at historically high levels as trucking conditions have worsened. Up to this point, we believe this trend supports the theory that many owner-operators are taking company jobs with larger assets instead of trying to survive independently. It proves that turnover is high in the carrier space but not high enough to say with certainty that capacity is leaving the market — at least not yet. In fact, total trucking jobs ticked up slightly to a new all-time high in January.
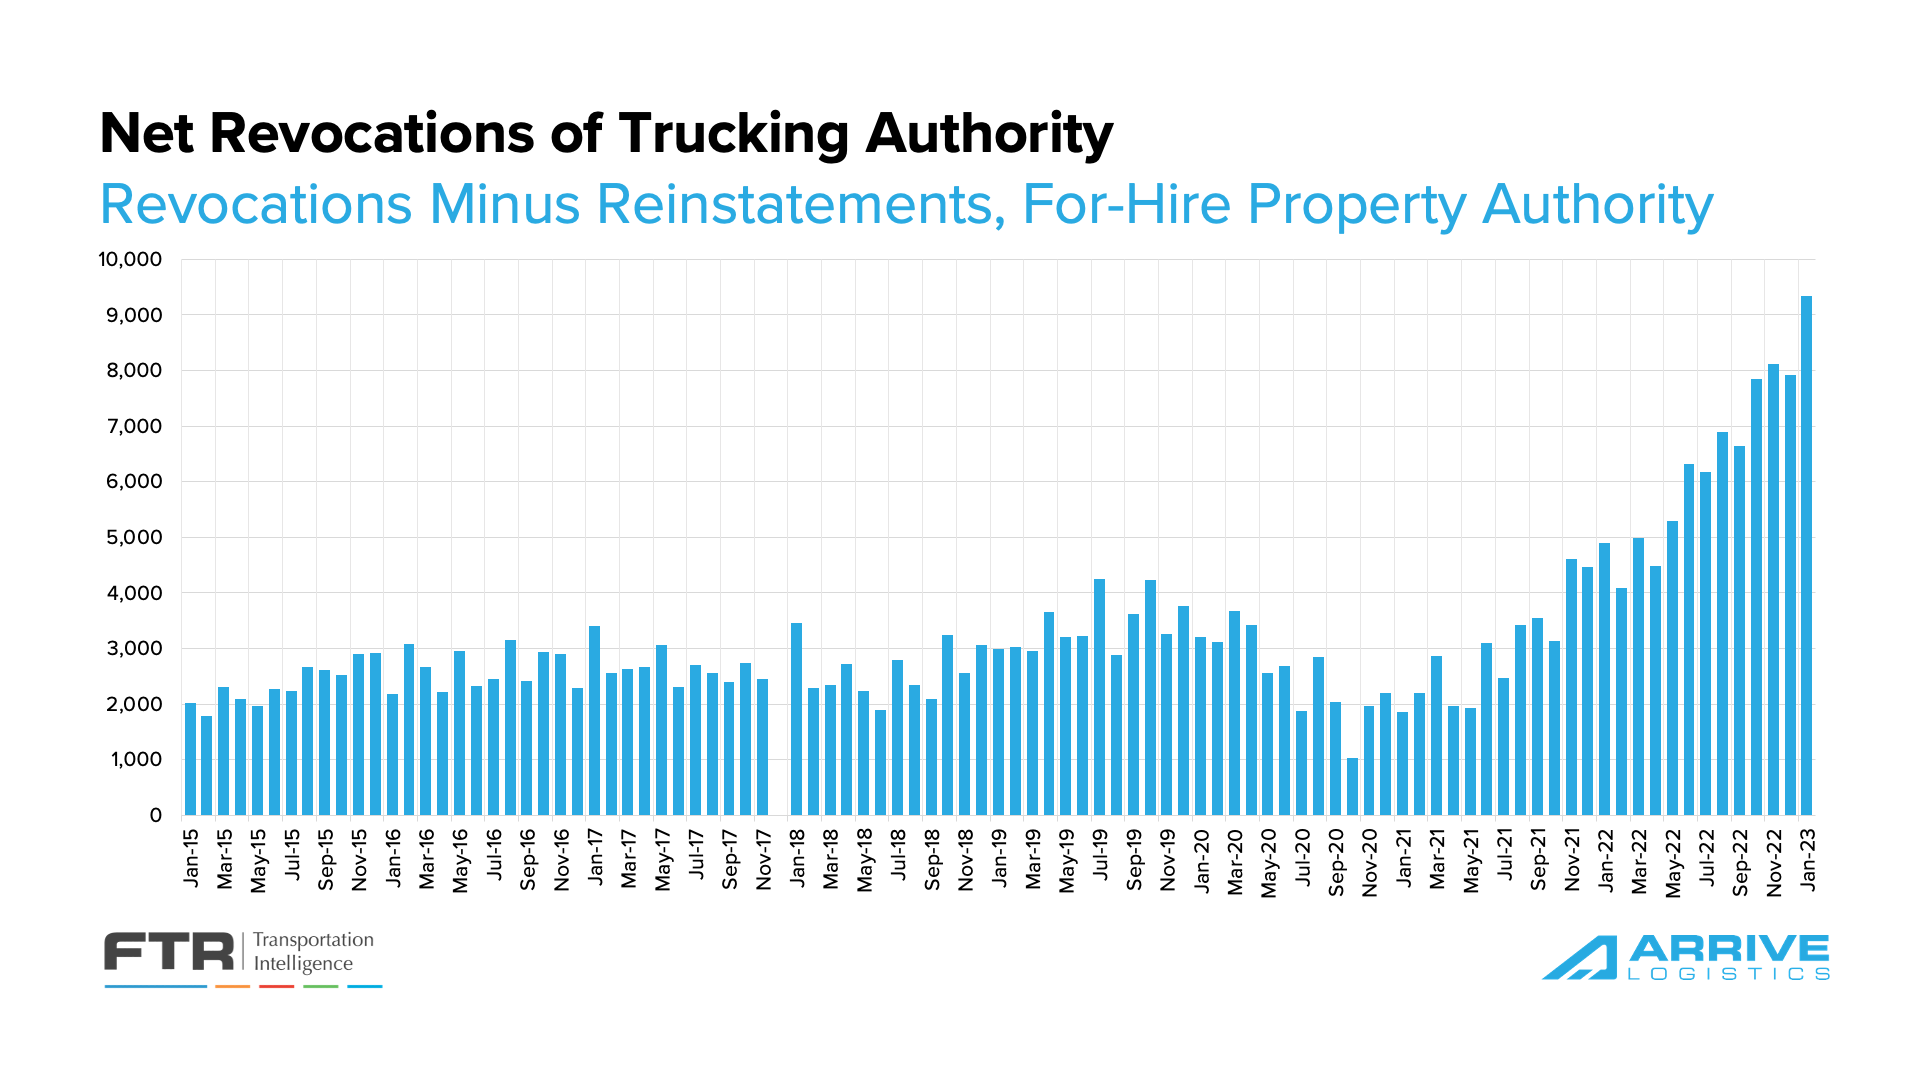 Figure 17: Net Revocations of Trucking Authority: FTR Analysis of FMCSA Data
The job growth that started during the pandemic has held steady in recent months, indicating that the number of drivers leaving the market is not yet surpassing the total number of owner-operators taking company jobs. Since employment data does not include the owner-operator headcount, these individuals are represented in the trucking employment numbers as they sign on with larger asset carriers.
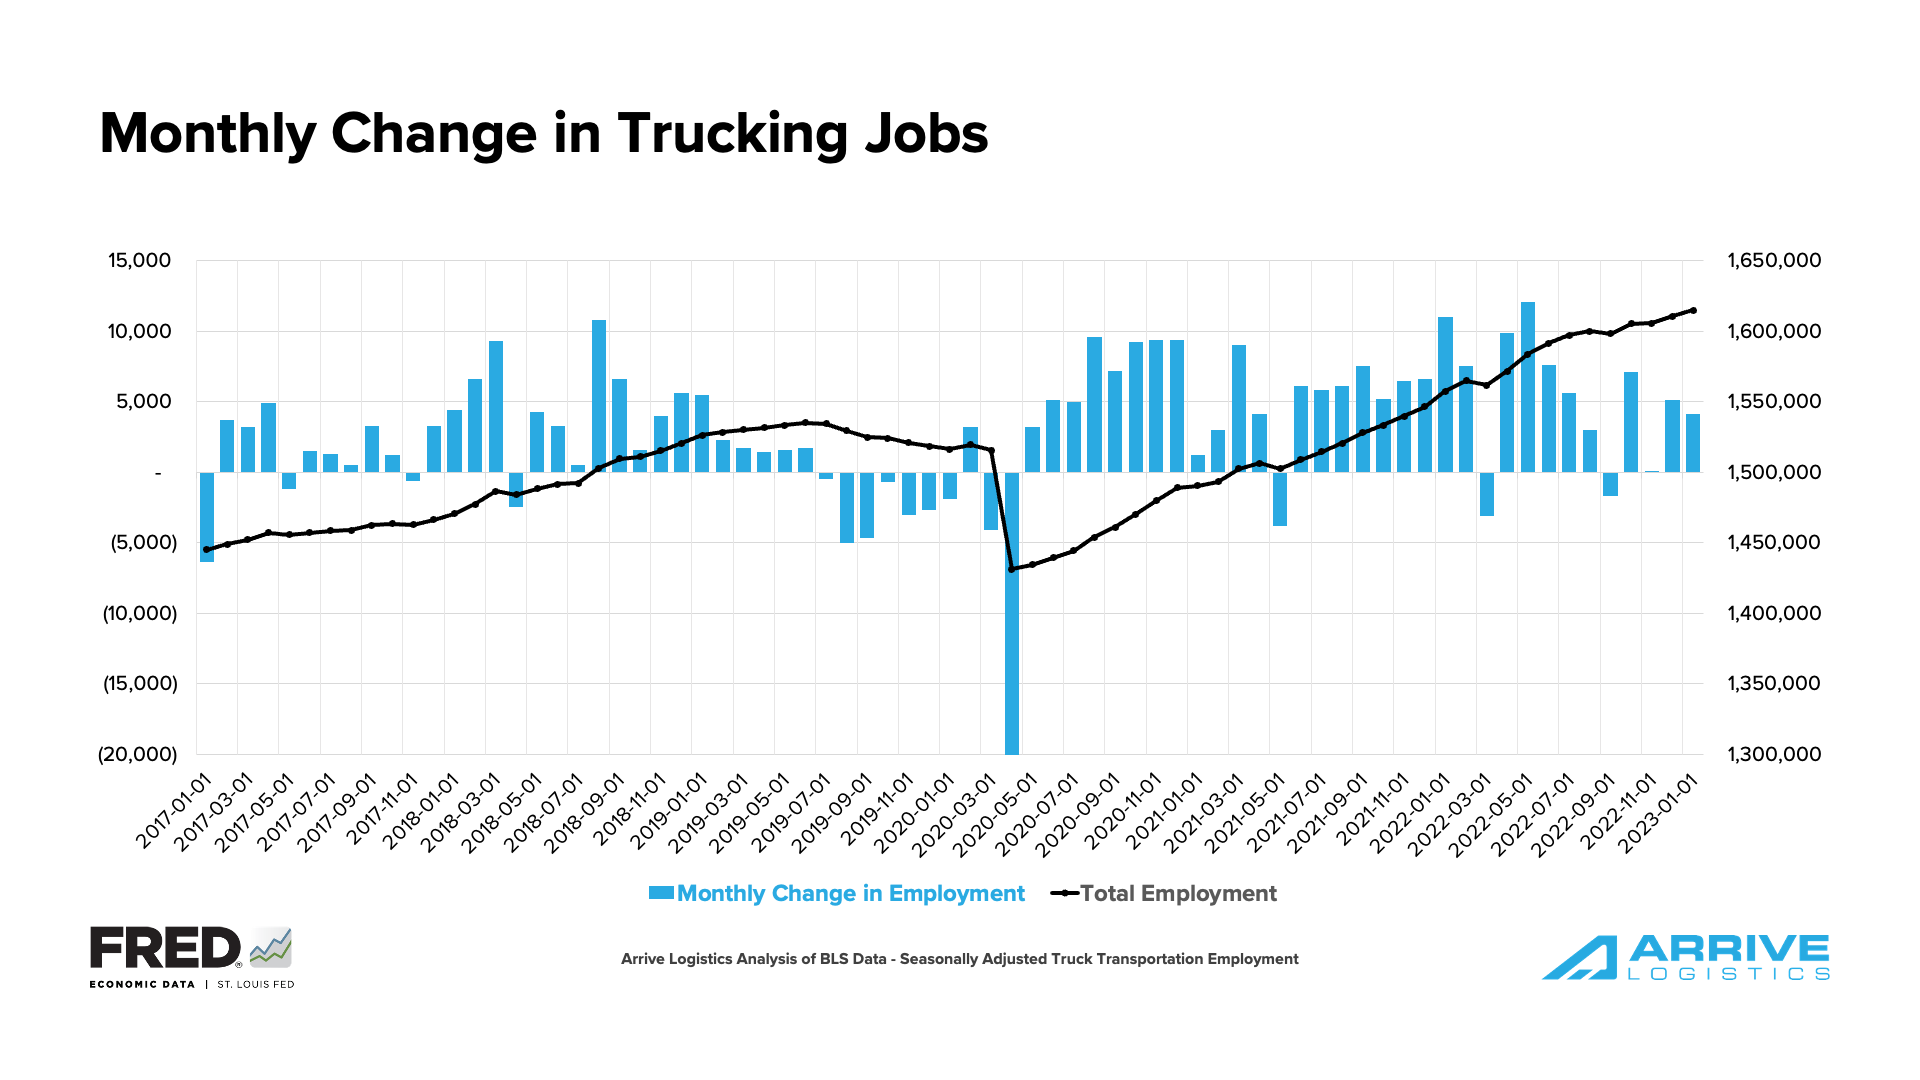 Figure 18: Monthly Change in Trucking Jobs
If demand falls as 2023 rolls on, larger carriers will likely slow their driver hiring efforts. In that case, trucking employment would likely trend in the opposite direction, leaving a depleted workforce and the market vulnerable to future demand surges.
One trend that could account for why more and more carriers, especially those with high spot exposure, are closing up shop is that the all-in spot rate per mile is now below the average cost per mile of operation for publicly traded carriers. Historically, we see capacity normalize when this happens, and spot rates rise relatively quickly.
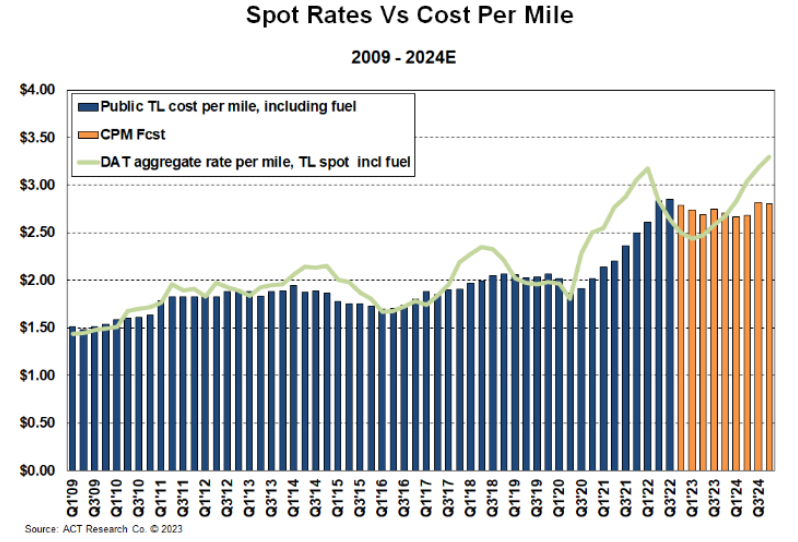 Figure 19: Spot Rates vs. Cost Per Mile: ACT Research
A recent trend we’re watching is the number of revocations starting to outpace net new carriers entering the market, leading to three straight months of total carrier reduction. Until trucking jobs begin to decline, this trend is likely additional evidence to support the idea that owner-operators are moving to company jobs.
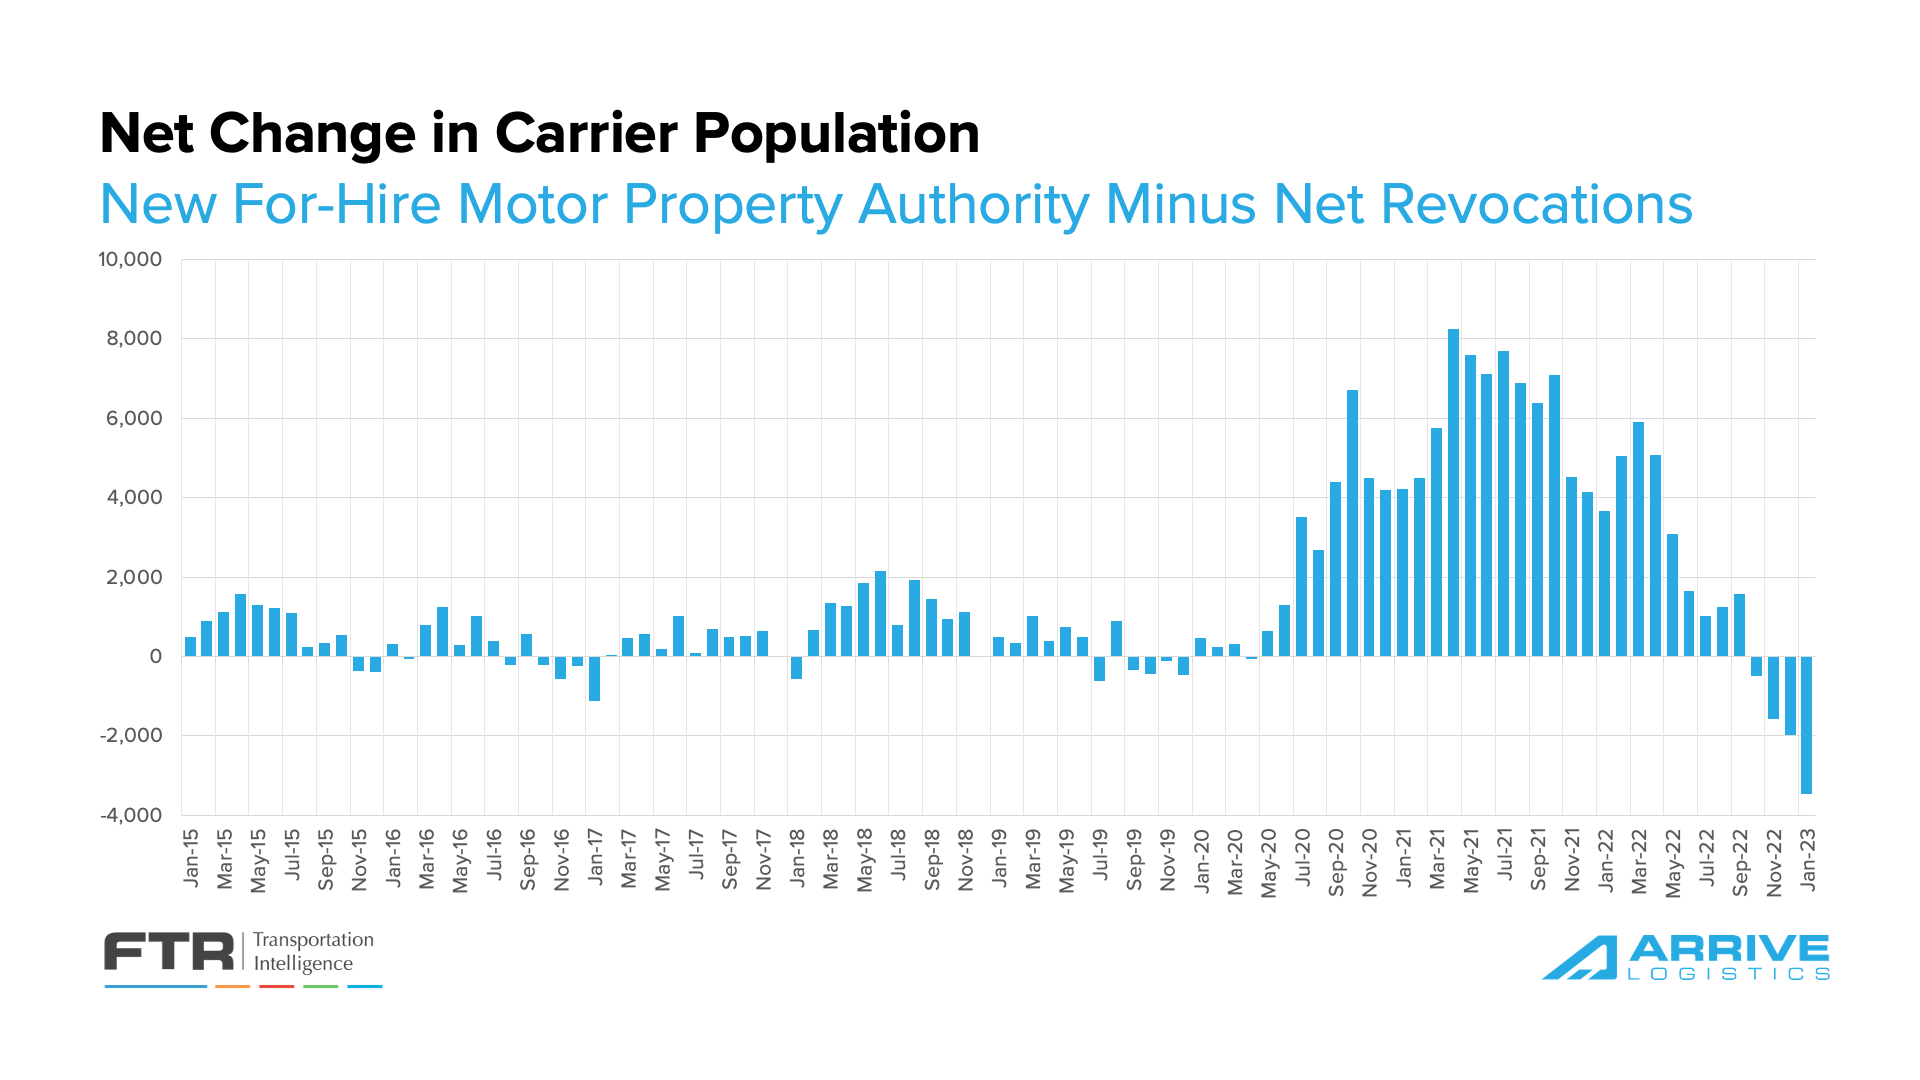 Figure 20: Net Change in Carrier Population: FTR Analysis of FMCSA Data
According to FTR, New Class 8 truck orders fell for the fourth straight month to 21,600 in January. However, FTR noted that this was not a surprise as backlogs are already filling most of the production slots at OEMs for the year and while orders have fallen off, they remain higher than a year ago. Current levels remain above what is required to replace aging equipment but below recent production levels, meaning backlogs should ease slightly in the coming months. In January, however, the average time from order to delivery increased from 9.1 to 9.48 months.
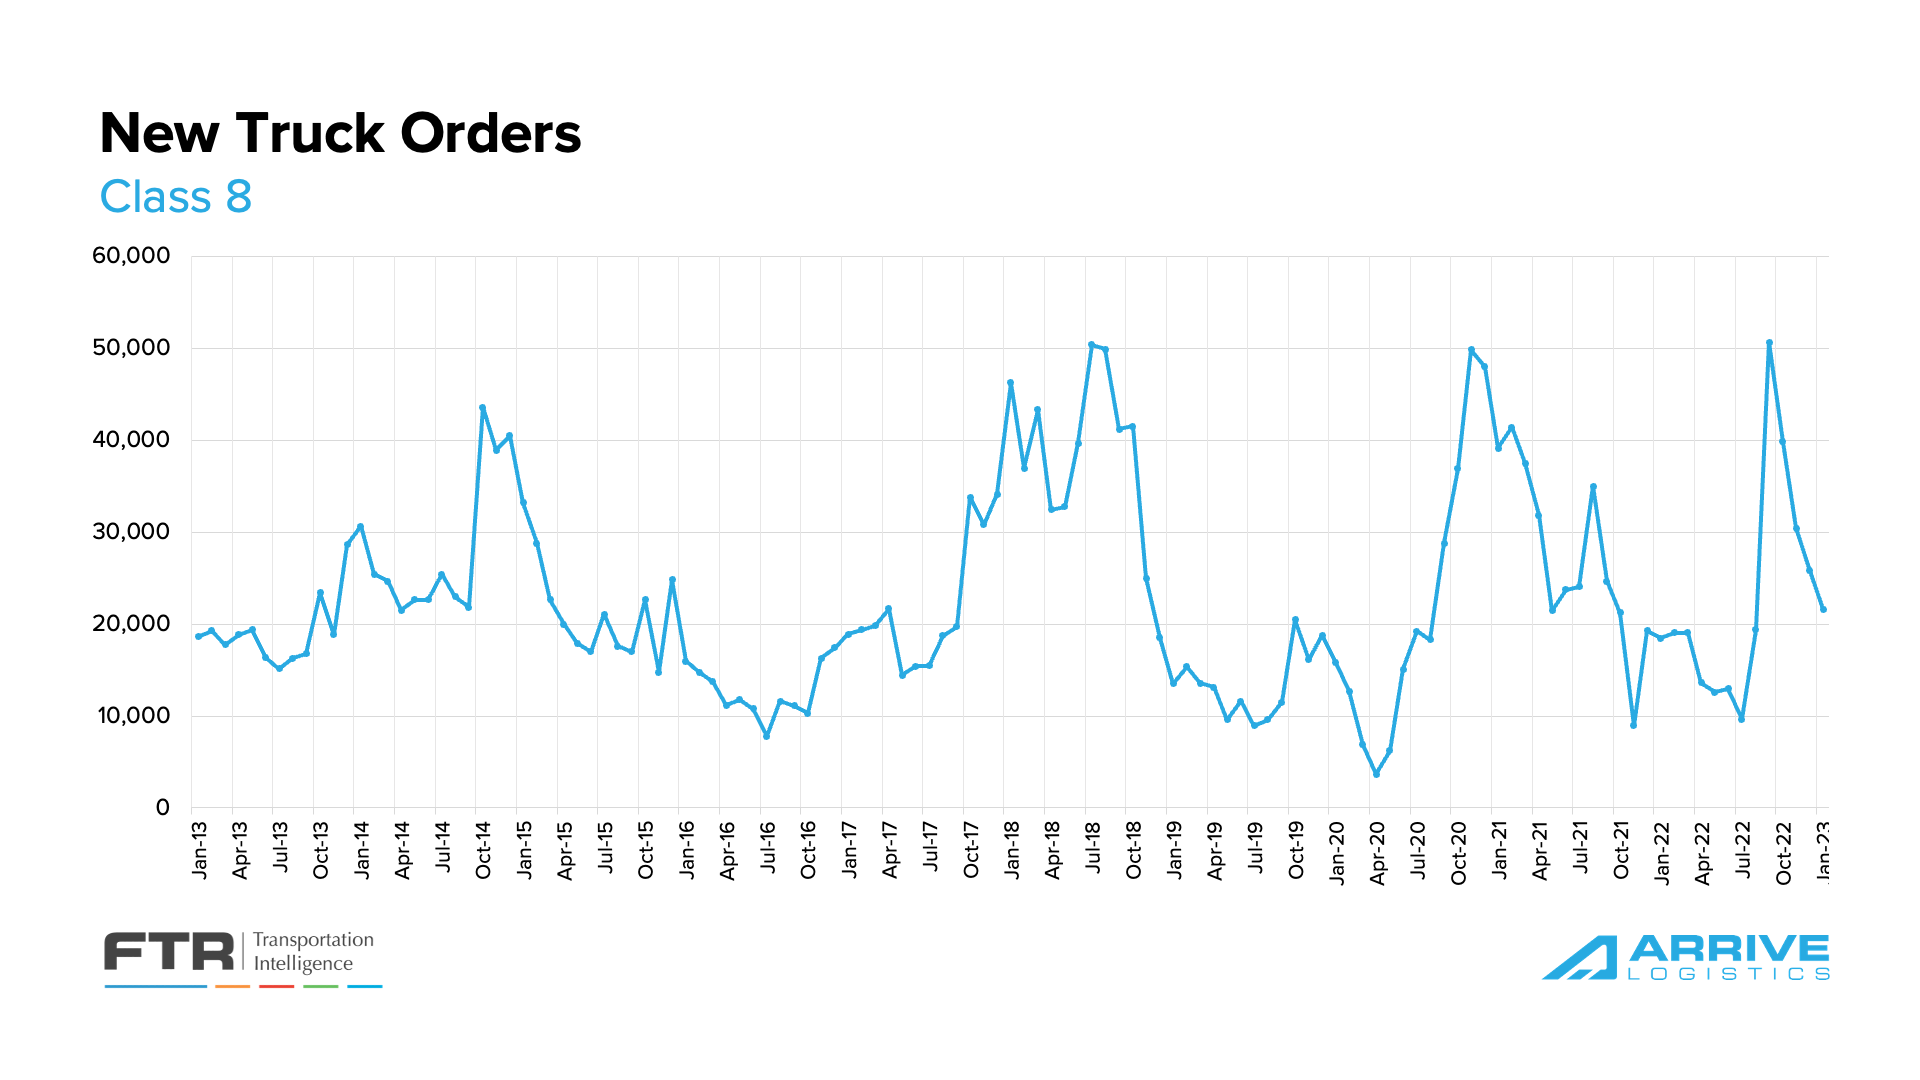 Figure 21: New Truck Orders: Source: FTR
Shippers in Arrive’s network continue to note the value of drop trailers in creating warehouse efficiencies amid labor challenges and overstocked inventories. The ability to plan has limited unnecessary dwell times and detention payments to carriers. Drop trailers also benefit carriers, who are getting increased asset utilization on tractors by spending less time waiting for freight to be loaded or unloaded. As a result, trailer orders jumped 47% to hit new record levels in December.
Indicators of future freight demand are not showing many bright spots in 2023, as trends that emerged in the back half of 2022 remain core themes early in the new year.
The FED has been relatively successful in slowing inflation by raising interest rates, which we believe is putting downward pressure on demand. The ISM showed the manufacturing sector posted its third consecutive month of contraction, and imports, a key contributor to overall truckload demand, dropped below two million TEUs for the first time in nearly two years. Projections anticipate import levels to remain below two million TEUs through most of the spring, with February likely to post the lowest number in three years. The NRF reports that retailers are importing less merchandise while they wait and see how the economy shapes up in the months ahead.
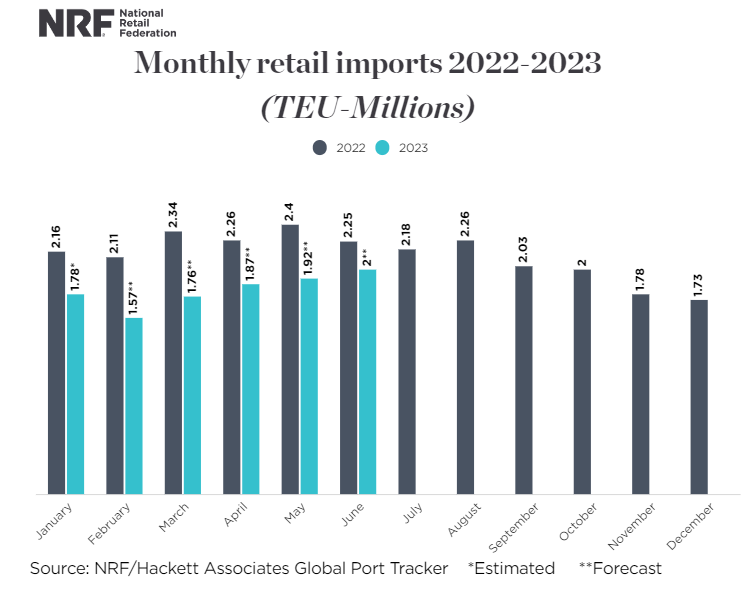 Figure 22: Monthly Retail Imports 2022-2023: Source: FTR
The ISM manufacturing report indicated easing backlogs as new orders contracted sharply, despite production also contracting. The new orders index fell to 42.5% in manufacturing, its lowest value since the height of the pandemic lockdowns in May 2020. The ISM has indicated that issues causing new order slowdowns should be resolved by the second quarter, but the trend is concerning nonetheless. Manufacturing was forecasted to be one of the main volume drivers in 2023; if contraction persists, demand will likely fall further than previously forecasted. That said, there is still significant pent-up demand in the space that should enable healthy volumes in the near term.
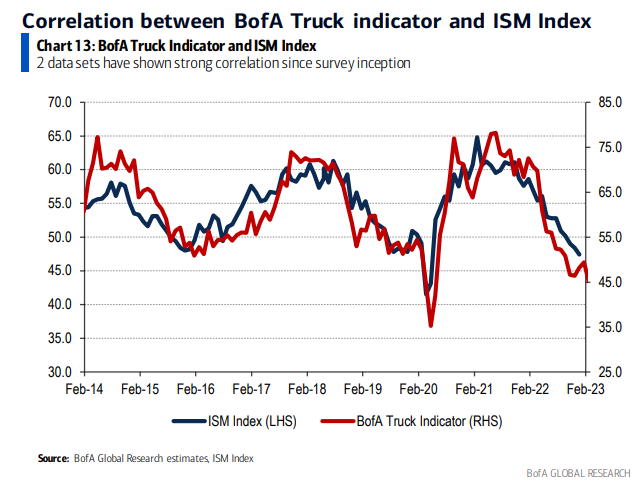 Figure 23: Bank of America Truck Indicator: BofA research illustrates a strong correlation between the ISM index and trucking demand.
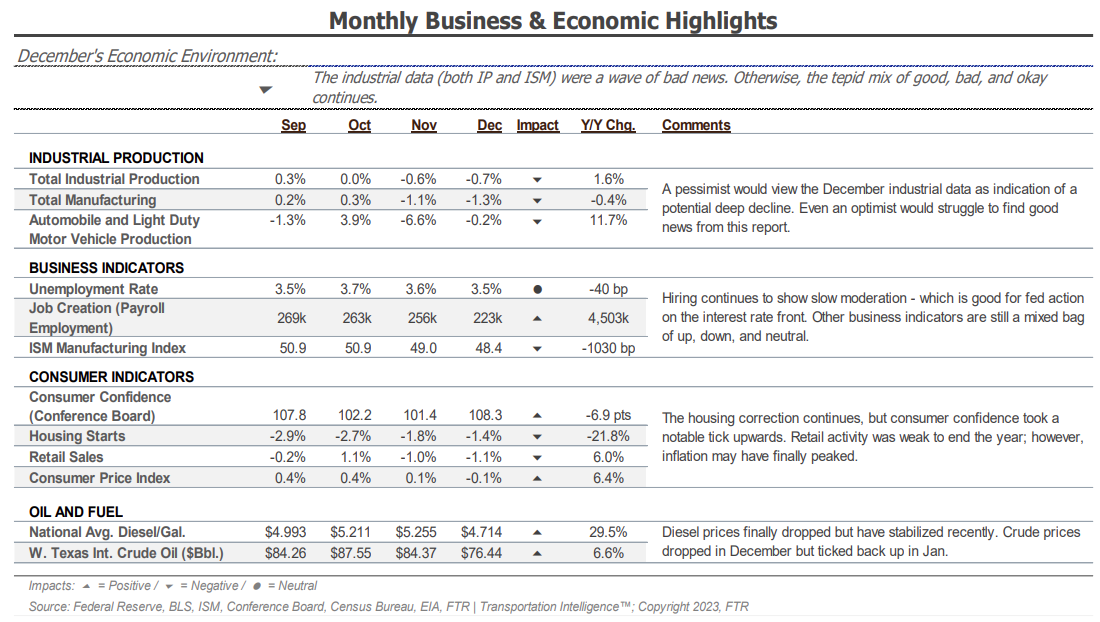 Figure 24: FTR Monthly Business & Economic Highlights
According to the previous report, FTR’s latest truck loadings showed a 2.0% year-over-year increase for 2022, down slightly from an estimated 2.1% heading into January. The 2023 forecast has been revised downward and shows a 0.2% decline from the 0.6% growth reported in the last update. In the latest forecast, weaker outlooks for automotive, chemicals and various other commodities more than offset strong food and construction loadings.
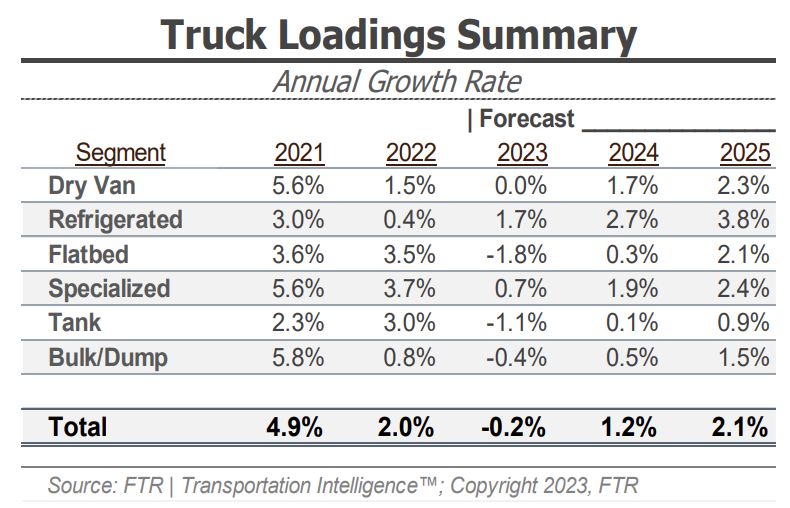 Figure 25: FTR Truck Loadings Summary
Largely in line with expectations, early February CPI data showed inflation slowed in January, falling from 6.5% to 6.4% year-over-year growth (5.6% when excluding food and energy). Rising shelter costs, which account for nearly 40% of the CPI index, made up about half of the monthly 0.5% increase from December. Rising energy costs also had a significant impact on the results.
As for what these trends mean for future interest rate increases, there is probably no change to the FED’s plan. The current readings show some improvement, but indicate the FED still has some work left to do. There is light at the end of the tunnel, however, as any improvement means we are moving in the right direction.
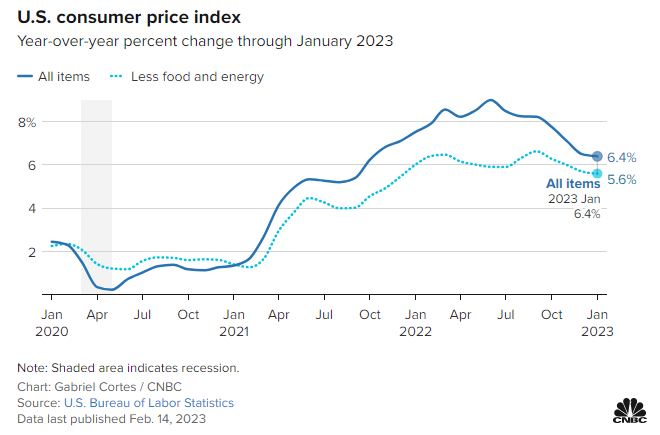 Figure 26: U.S. Consumer Price Index
According to Bank of America card data, year-over-year consumer spending grew by 5.1% in January. That’s up from 2.2% year-over-year growth in December after increasing 1.7% month-over-month on a seasonally adjusted basis in January. BofA noted spending growth in January was broad-based, as seasonably adjusted increases appeared across most retail categories.
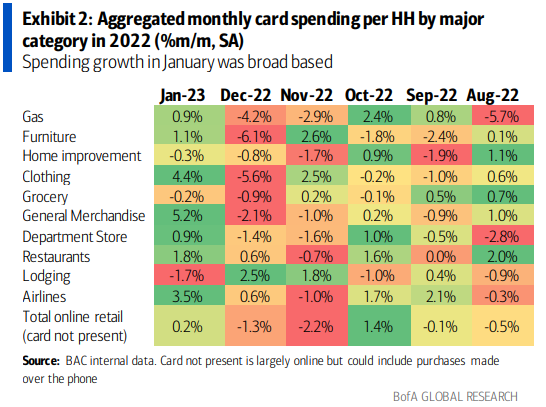 Figure 27: Bank of America Monthly Card Spending
Consumer spending on durable goods improved in January and remains elevated. However, it is still being outpaced by leisure services spending relative to pre-pandemic levels. Airline travel is a category that has continued to see significant growth and supports this trend.
BofA also indicated that while the spending data from January is positive, most factors are short-lived and unlikely to generate an extended acceleration in economic activity. The bottom line, they noted, is that this trend will not prevent the economy from slipping into a recession but could help push the timeline into the back half of 2023.
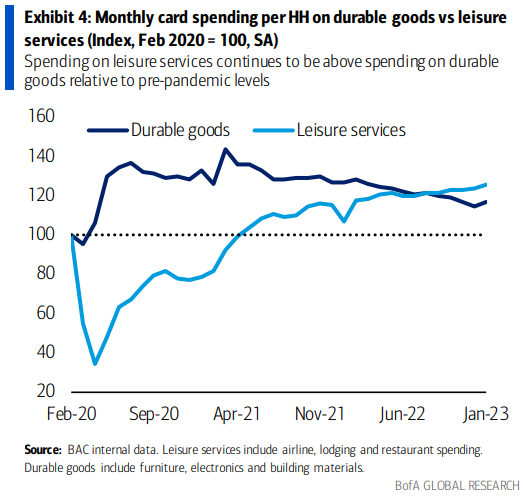 Figure 28: Bank of America Monthly Card Spending (Durable Goods vs. Leisure Services)
Initial jobless claims were mostly flat into early February and remain very close to what they were this time last year and even before the pandemic. The unemployment rate was also nearly flat compared to January 2020 and down from January 2022, a sign that the labor market remains tight despite recent reports of layoffs.
The strong labor market continues to signal confidence in consumers’ ability to maintain current spending levels and prevent any crash that could suddenly lead truckload demand off a cliff.
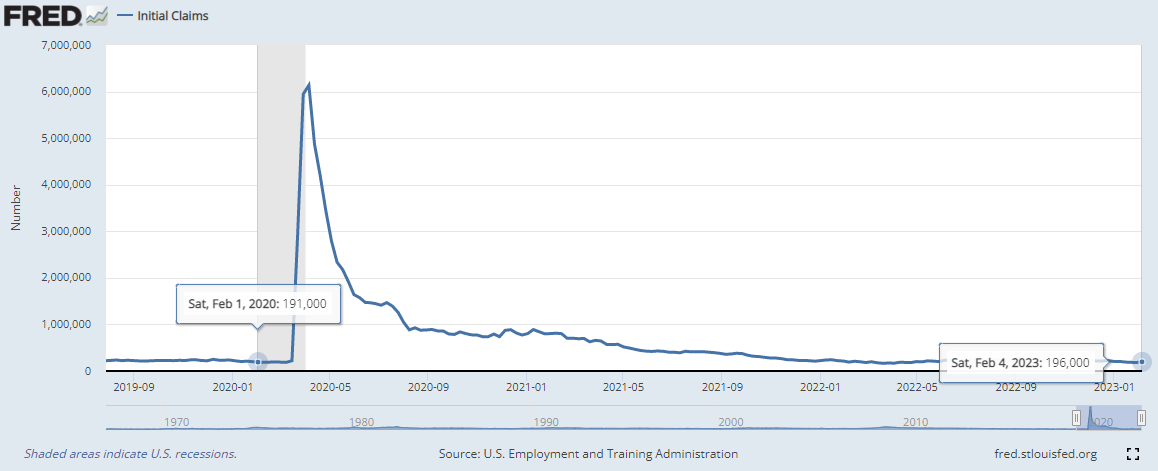 Figure 29: FRED Initial Jobless Claims
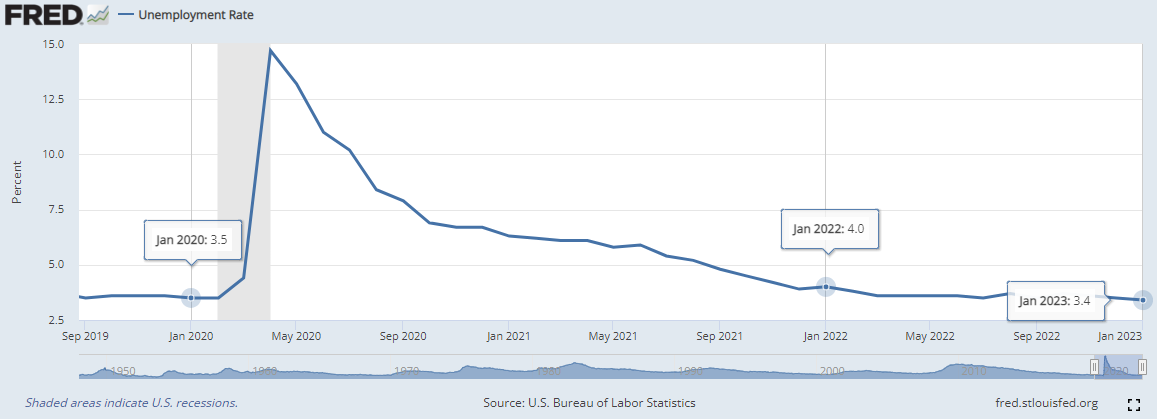 Figure 30: FRED Unemployment Rate


