


Conditions calmed and followed recent trends in February as winter weather died down across the Northern U.S. Spot load postings were down 28% from January 2023 and nearly 12% from February 2023. Although spot loads are down year-over-year, the 11.9% decline is better than the 36% year-over-year decline in January. Ultimately, demand today is weaker than during the pandemic but stronger than in the period preceding it.
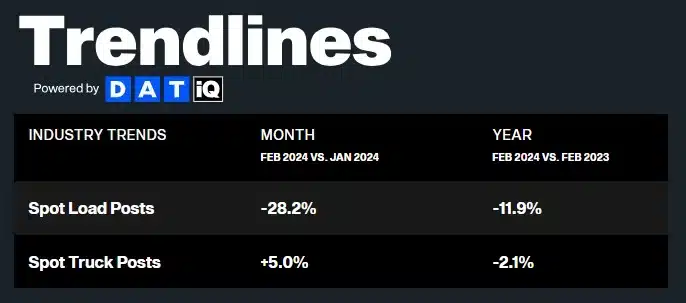
Figure 1: DAT Trendlines
The FreightWaves SONAR Outbound Tender Volume Index (OTVI), which measures contract tender volumes across all modes, was up 10.1% year-over-year, or 9.7% when measuring accepted volumes.
Adjusted accepted volumes were up 3% month-over-month in early March, driven by dry van tender acceptance increasing by 3% despite reefer tender acceptance declining by 1.6%.
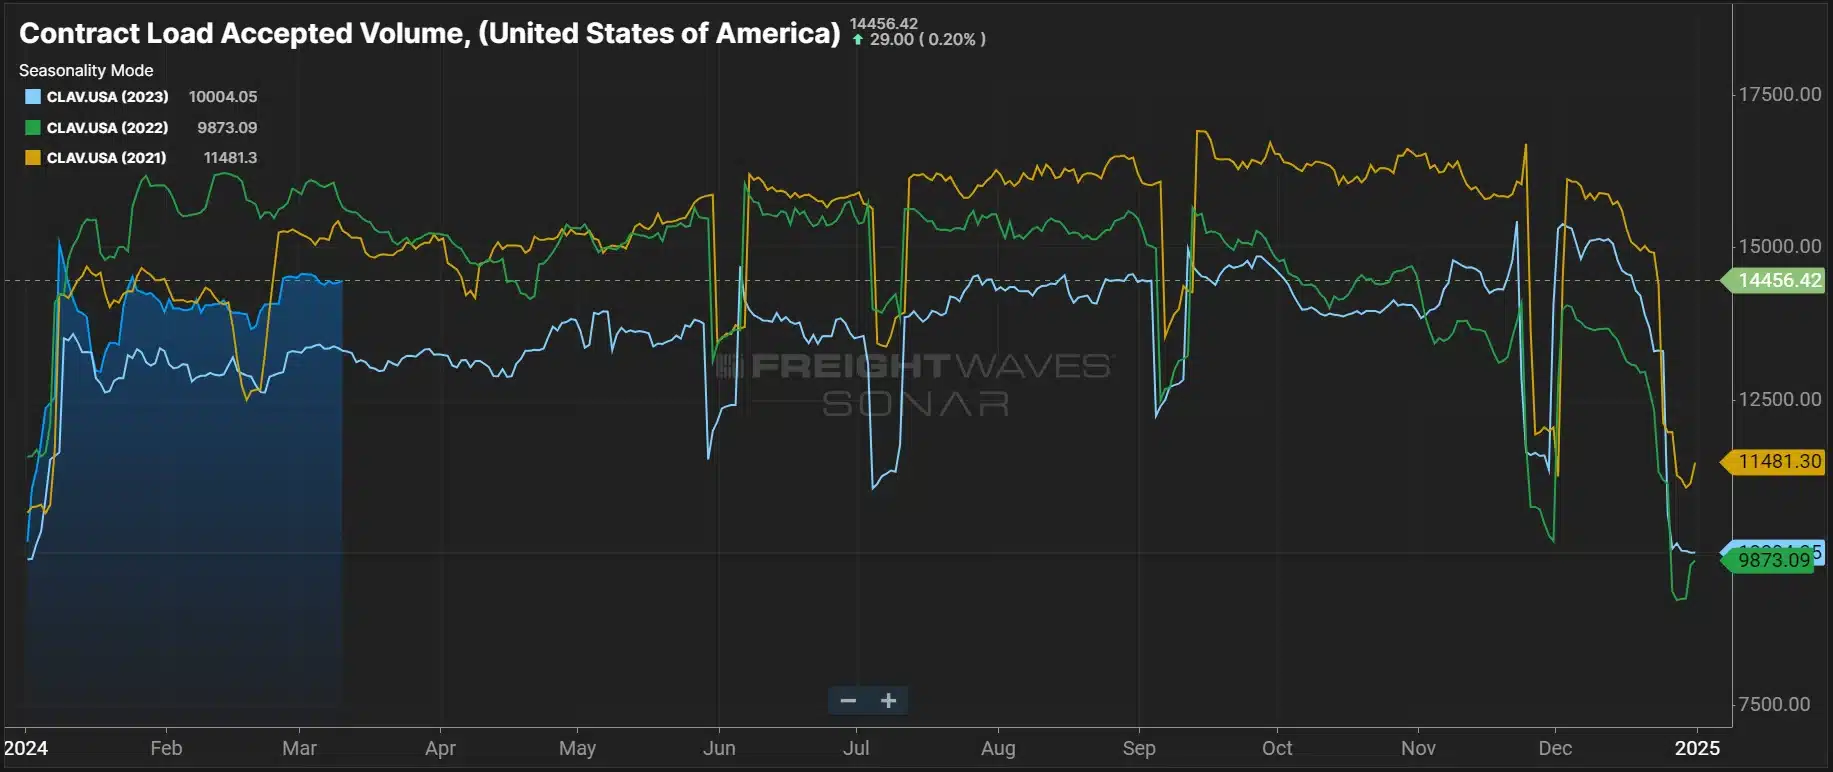
Figure 2: Contract Load Accepted Volume, SONAR: Accepted contract volumes were up 3.0% y/y in early March and remain above historical pre-pandemic levels.
The Cass Freight Index shipments component is a good overall market indicator because it encompasses both spot and contract freight based on bill data. It shows year-over-year declines for the last 24 months as destocking remains a focus nationwide. That trend continued in February. Though shipments were up 7.3% month-over-month on a non-seasonally adjusted basis and 2.0% on a seasonally adjusted basis, they were down 4.5% year-over-year. However, that was still a slight improvement from the 7.6% year-over-year decline in January.
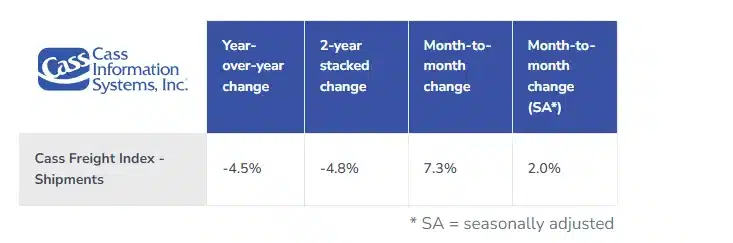 Figure 3: Cass Freight Index Report – February 2024
Market conditions returned to 2023 levels in February after some volatility in January. Loosening across markets indicates that the downcycle persists and capacity is sufficient to meet demand across all modes.
The Sonar Outbound Tender Reject Index (OTRI), which measures the rate at which carriers reject freight they are contractually required to take, hovered over 5% for most of February and remains relatively flat year-over-year despite a jump in early 2024. The tender rejection rate decline in February followed typical seasonality as shippers prepare for produce season and the 100 days of summer.
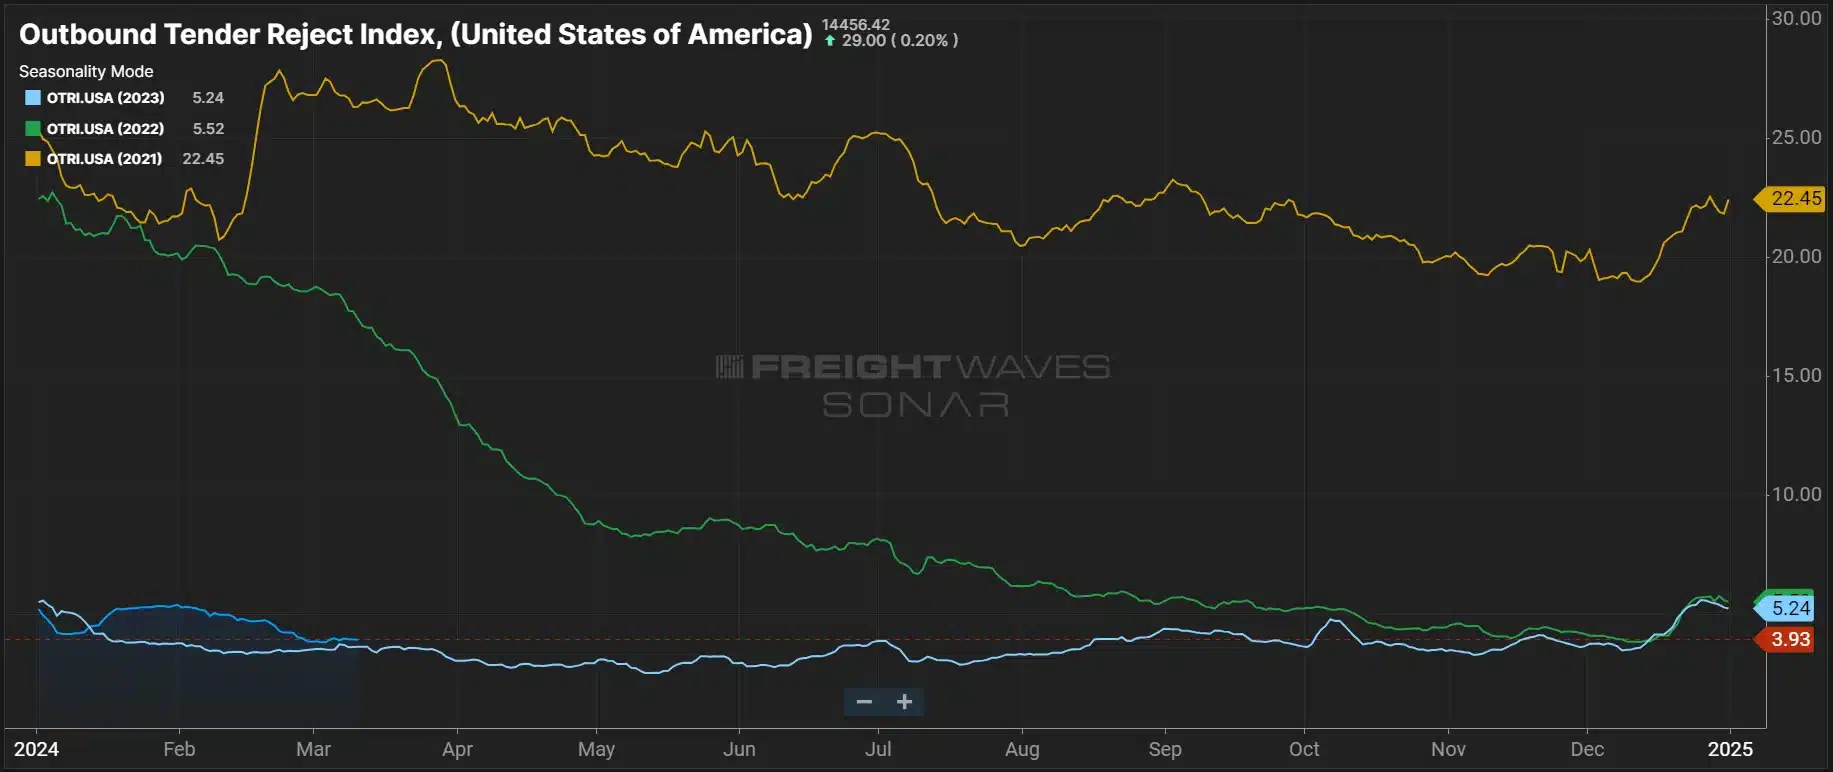 Figure 4: Outbound Tender Reject Index, SONAR: OTRI remains around 5% and in-line with 2023 levels — a sign capacity is still sufficient to support demand and carriers are protecting their contract freight as spot rates fall back down.
Though dry van tender rejections are slightly below 4% and almost exactly in line with this time last year, they’re still well below March 2021 and 2022 levels. Reefer was volatile in late January, but February tender rejection rates fell back in line with 2023 levels and are trending just south of 5% to remain slightly up year-over-year.
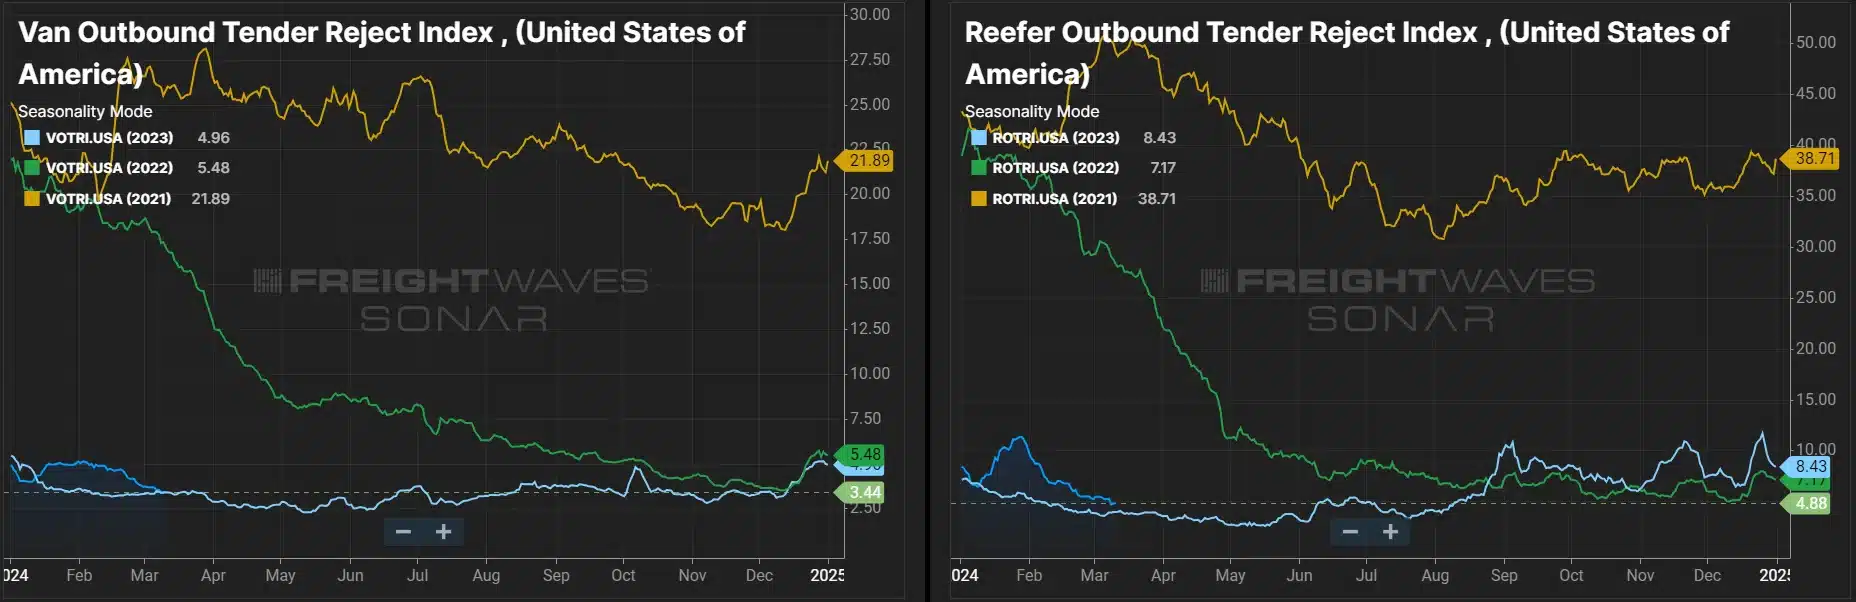 Figure 5: Van and Reefer Outbound Tender Reject Indices, SONAR: Tender Rejections across both dry van and reefer equipment types saw pullbacks in February and have returned to 2023 levels.
The DAT Load-to-Truck Ratio, which measures the total number of loads relative to the total number of trucks posted on their spot board, has changed from previous months due to DAT data correction issues. February dry van and reefer ratios show moderate easing from January and are now similar to a year ago, indicating the market is still oversupplied.
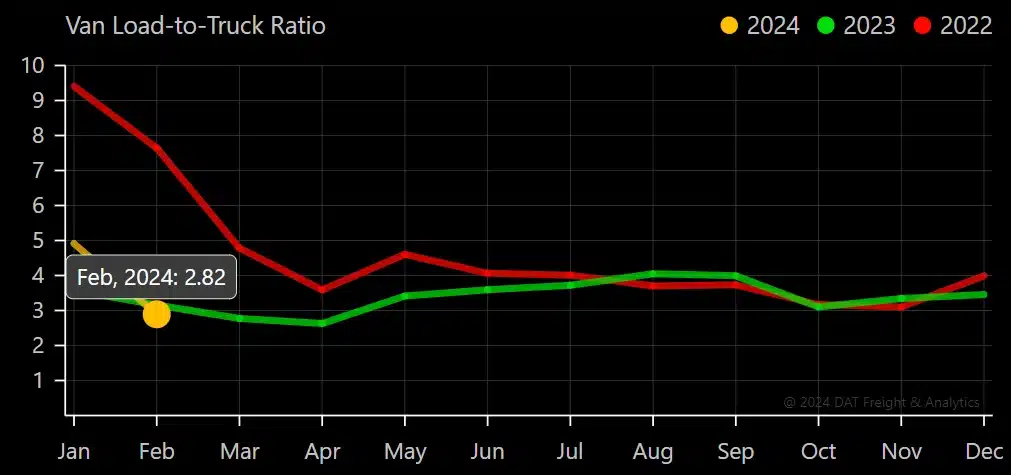 Figure 6: DAT Van Load-To-Truck Ratio
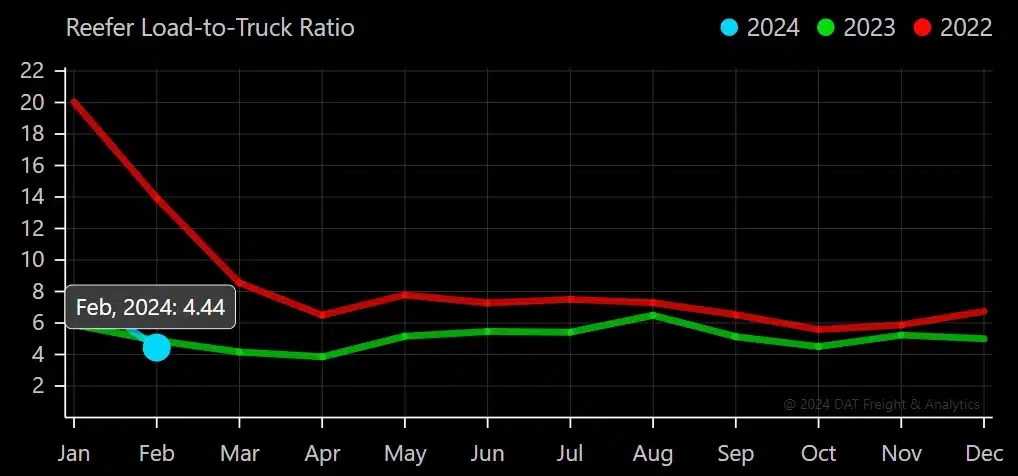 Figure 7: DAT Reefer Load-To-Truck Ratio
The Morgan Stanley Dry Van Freight Index is another measure of relative supply; the higher the index, the tighter the market conditions. The black line with triangle markers on the chart provides a great view of what directional trends would be in line with normal seasonality based on historical data dating back to 2007.
The market was loose heading into 2024 but tightened quickly in early January, causing the index to rise above 2023 levels and land close to the 10-year average. However, the index indicates soft conditions have returned over the past six weeks, with five straight readings showing loosening and levels falling close to where they were during the same period last year.
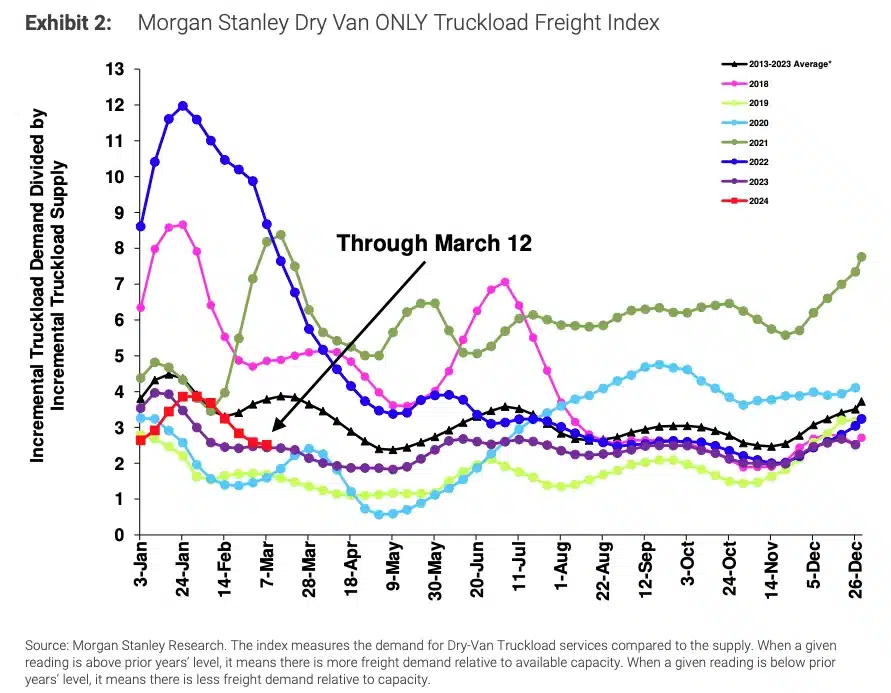
Figure 8: Morgan Stanley Dry Van Truckload Freight Index
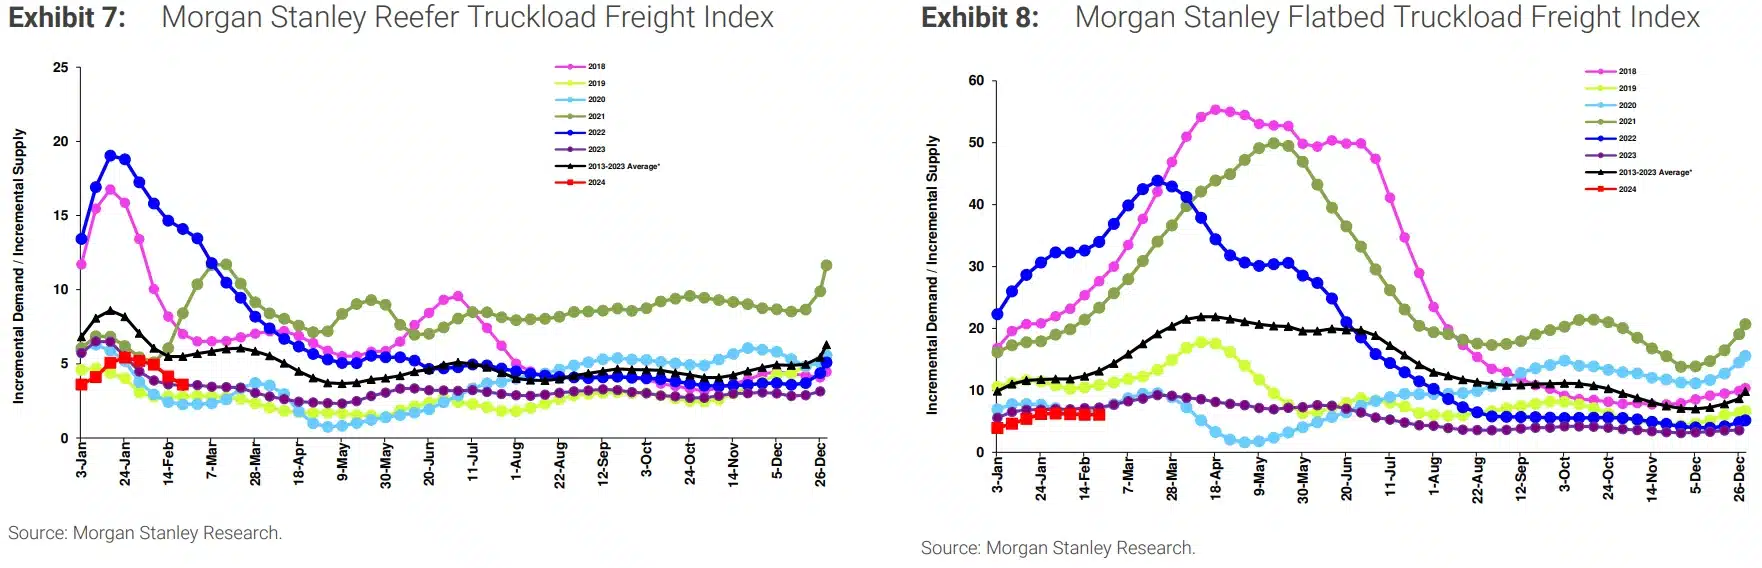
Figure 9: Morgan Stanley Reefer and Flatbed Truckload Freight Indices
Truckstop’s Weekly National Average Spot Rates provide a detailed view of week-to-week movements and a real-time look into the current environment. They reported new cycle lows for van and reefer spot rates over the last two weeks, mirroring load-to-truck ratio and tender rejection trends during the same period; this is likely the bottom for rates as the produce season begins and summer approaches. Conversely, the flatbed market has grown stronger as construction-related seasonal demand increases.
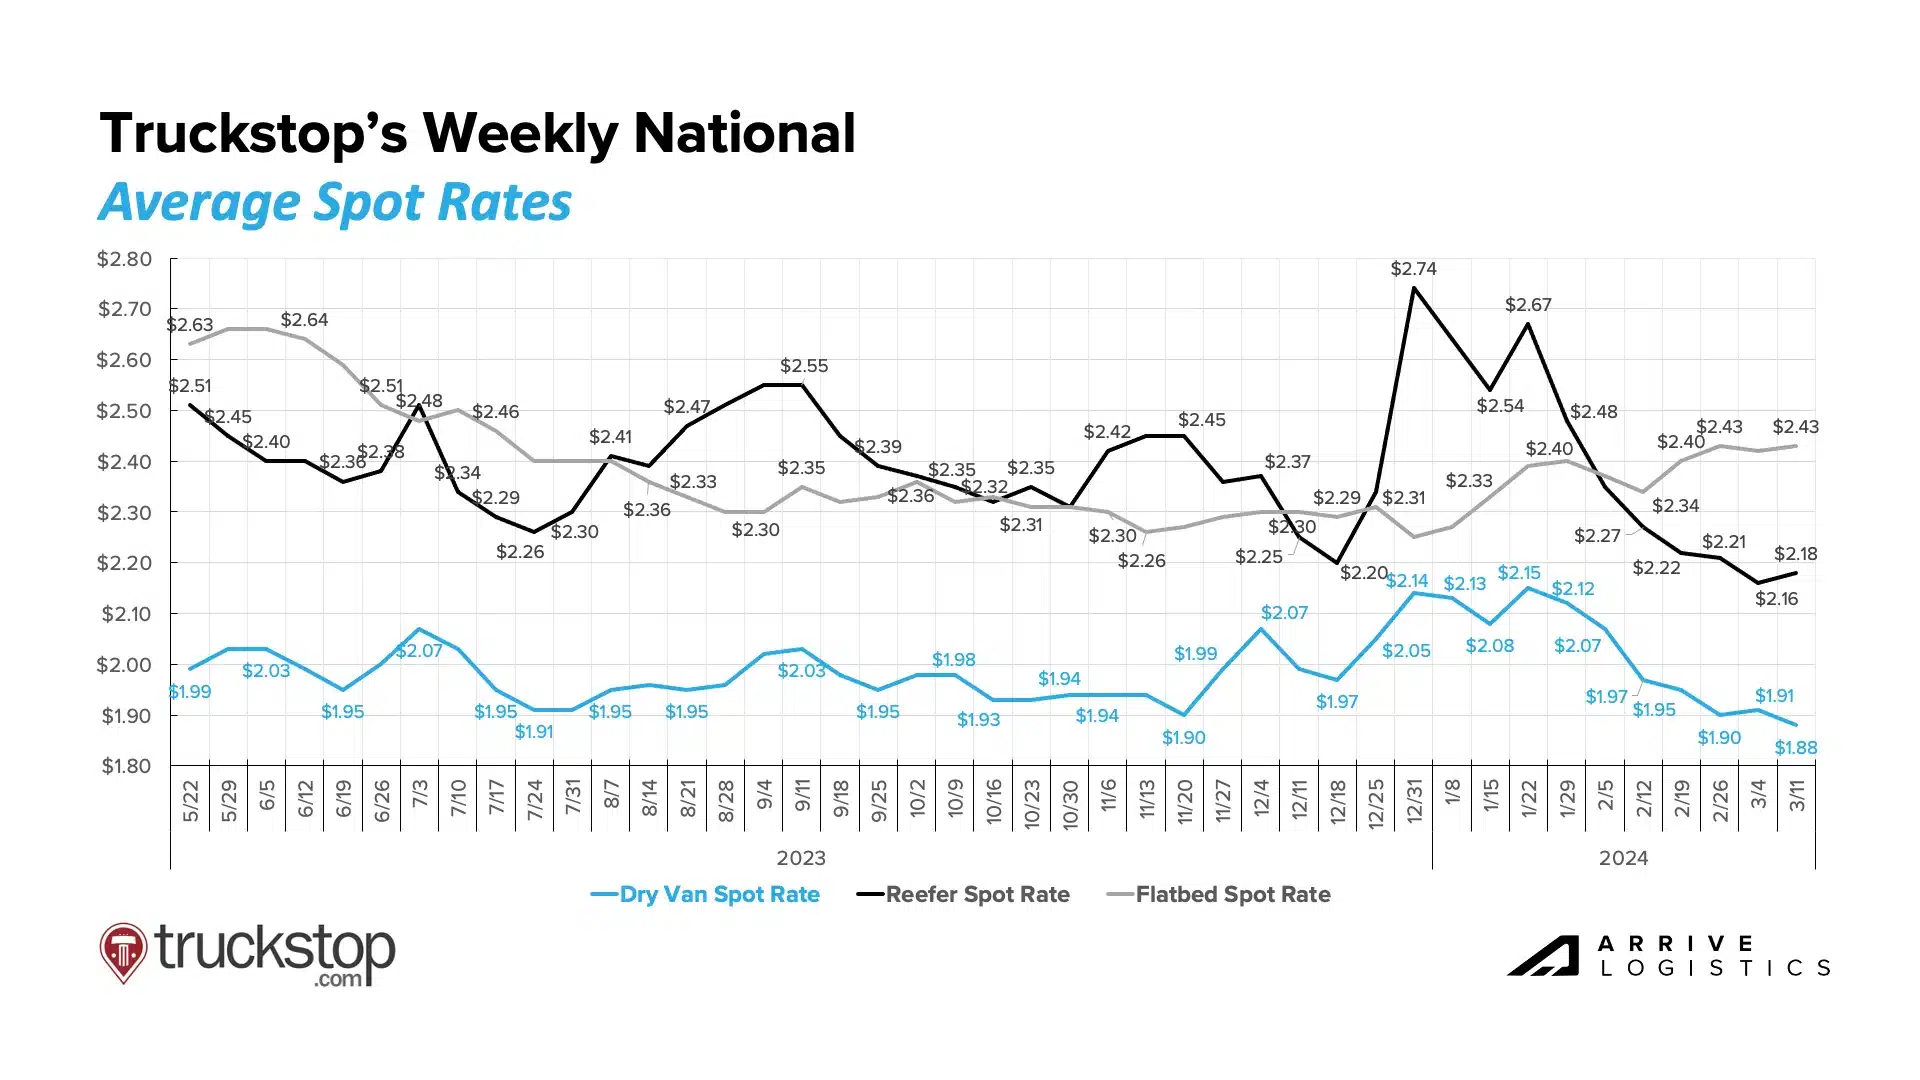 Figure 10: Truckstop’s Weekly National Average Spot Rates
DAT reports that national van and reefer spot rates declined by $0.07 per mile and $0.14 per mile, respectively, due to elevated rates settling following winter weather in January. Flatbed rates increased by $0.02 per mile and should hold steady as construction season approaches.
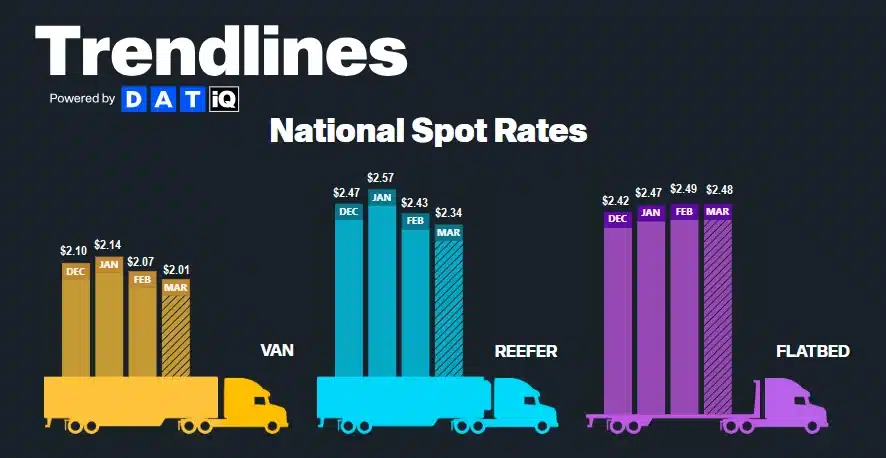
Figure 11: DAT Monthly Rate Trends
National diesel prices remain volatile, with moderate increases over the past couple of months despite some recent pullbacks. The average price through the first two weeks of March was $4.01, just a few cents below the February average. As a result, fuel surcharges across all three modes have been relatively flat this month but are still higher than at the end of 2023.
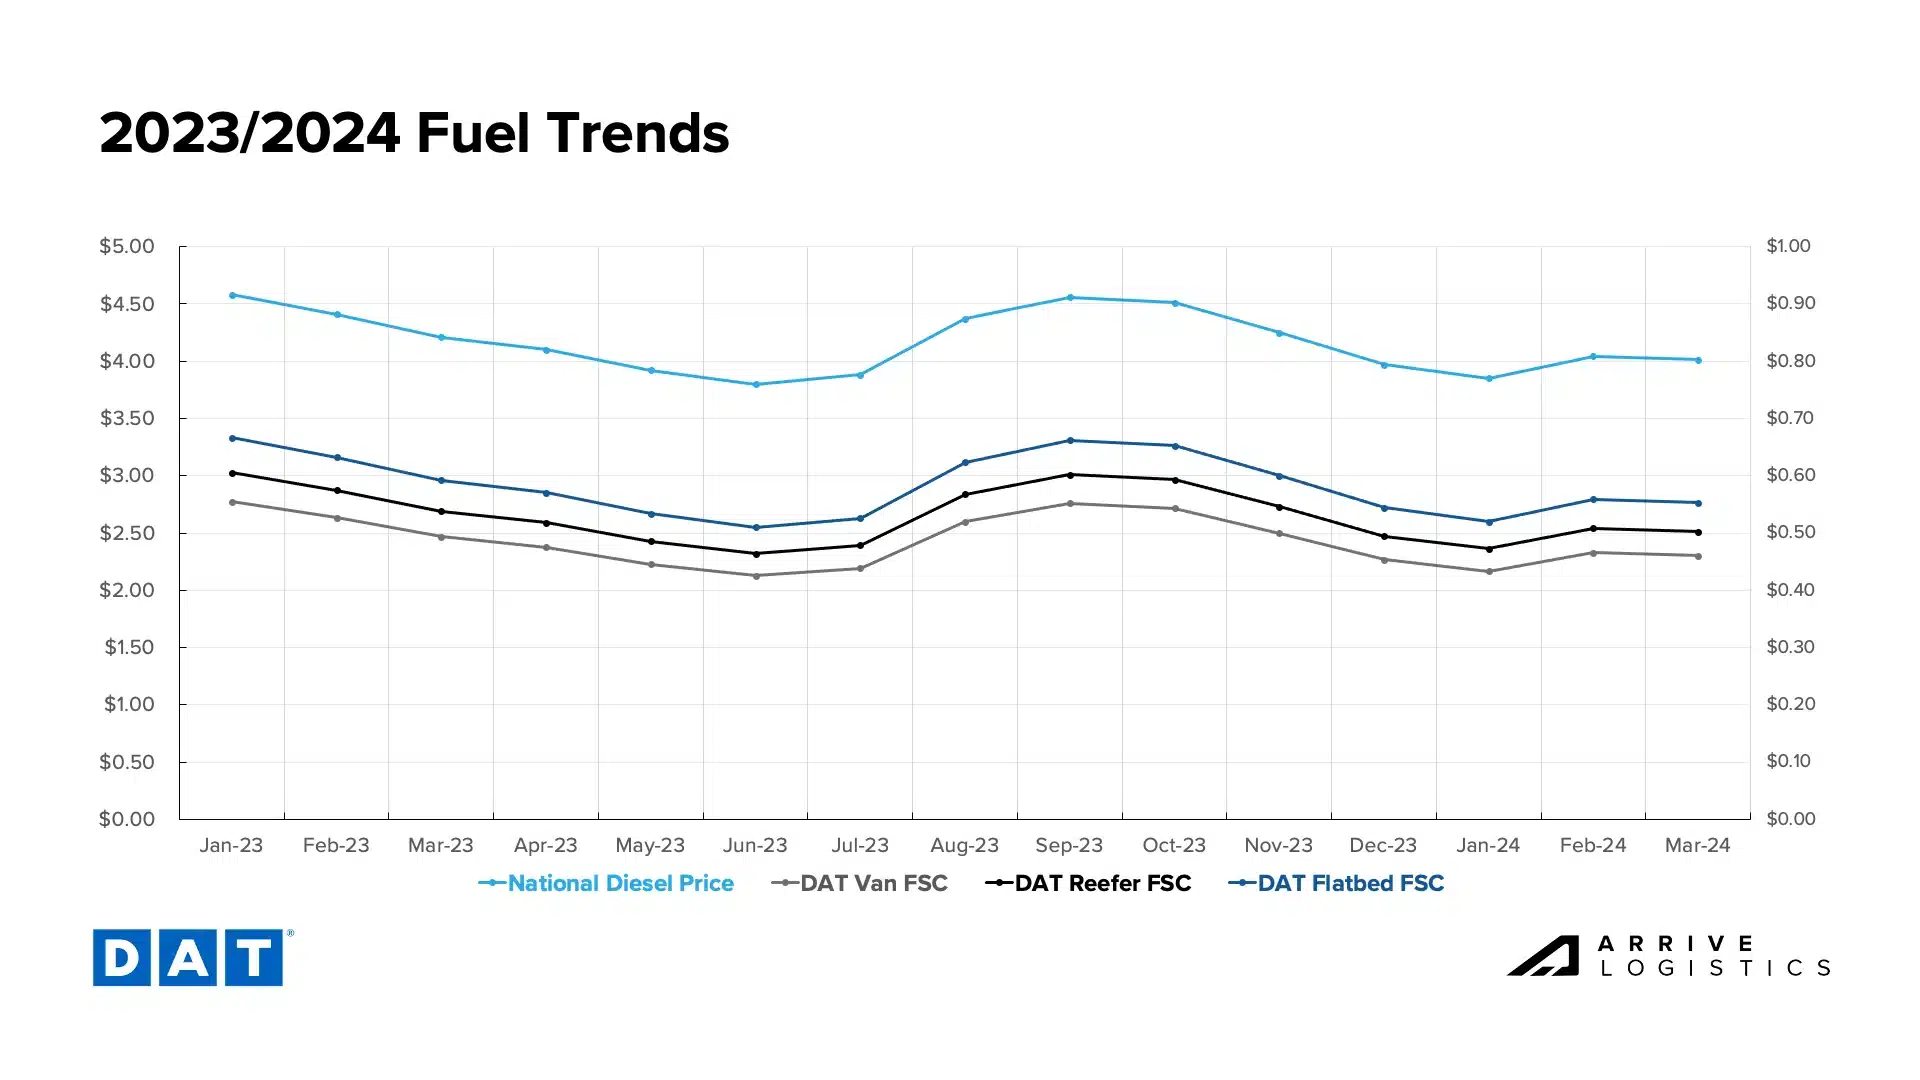
Figure 12: DAT Fuel Trends
DAT shows that dry van spot rates continue to decline from January and currently sit at $1.55 per mile, which aligns with cycle lows in October 2023. Contract rates stayed flat month-over-month and currently sit at $2.03 per mile. The spot-contract spread has risen by $0.05 to $0.48 per mile. This year’s outlook for potential price increases could result in more shippers locking in rates at current cycle lows.
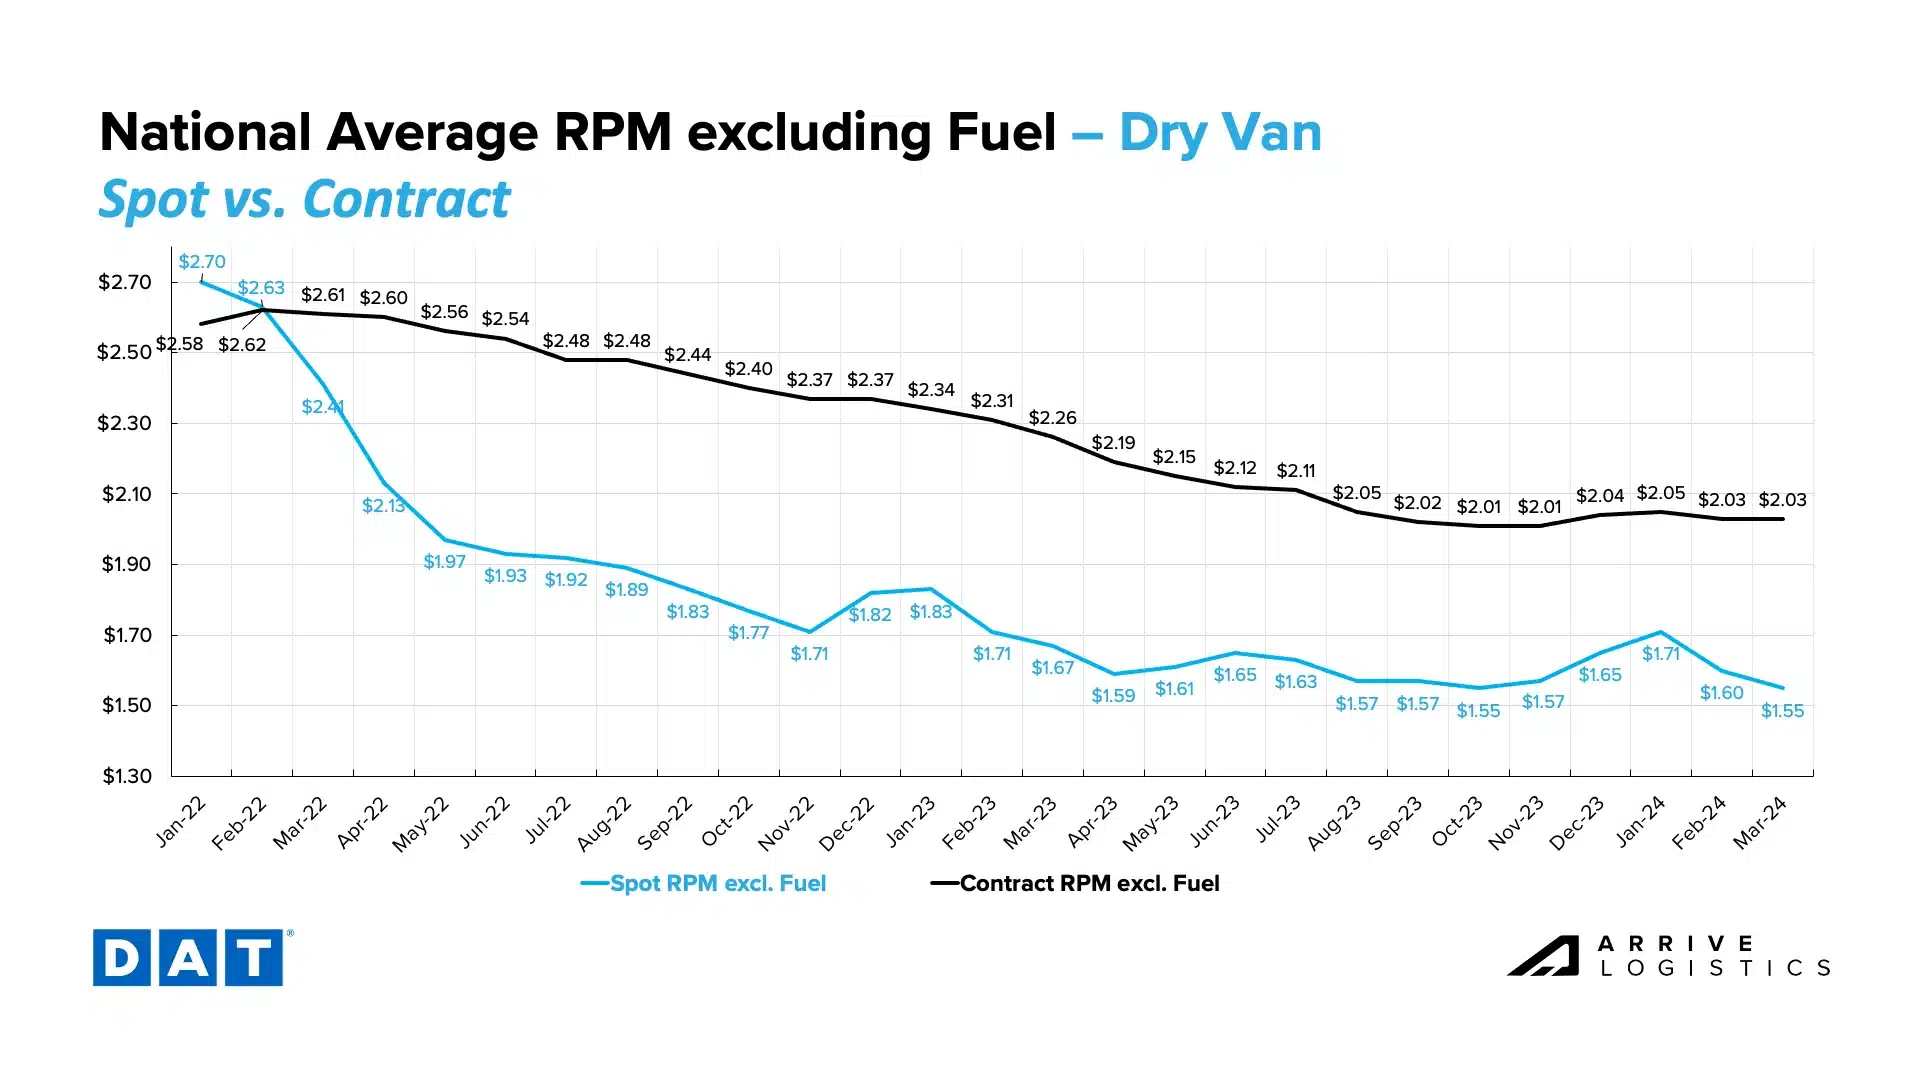
Figure 13: DAT Dry Van National Average RPM Spot vs. Contract
Reefer rates continue to follow the same trend as dry van but at a more magnified level. Linehaul spot rates sit at $1.84 per mile in March, a 12% decline from January and a 4% decline from February. Contract rates have declined by $0.02 per mile, excluding fuel, and continue to get downward pressure from lower spot rates. However, increased volatility means the reefer market recovery still outpaces dry van.
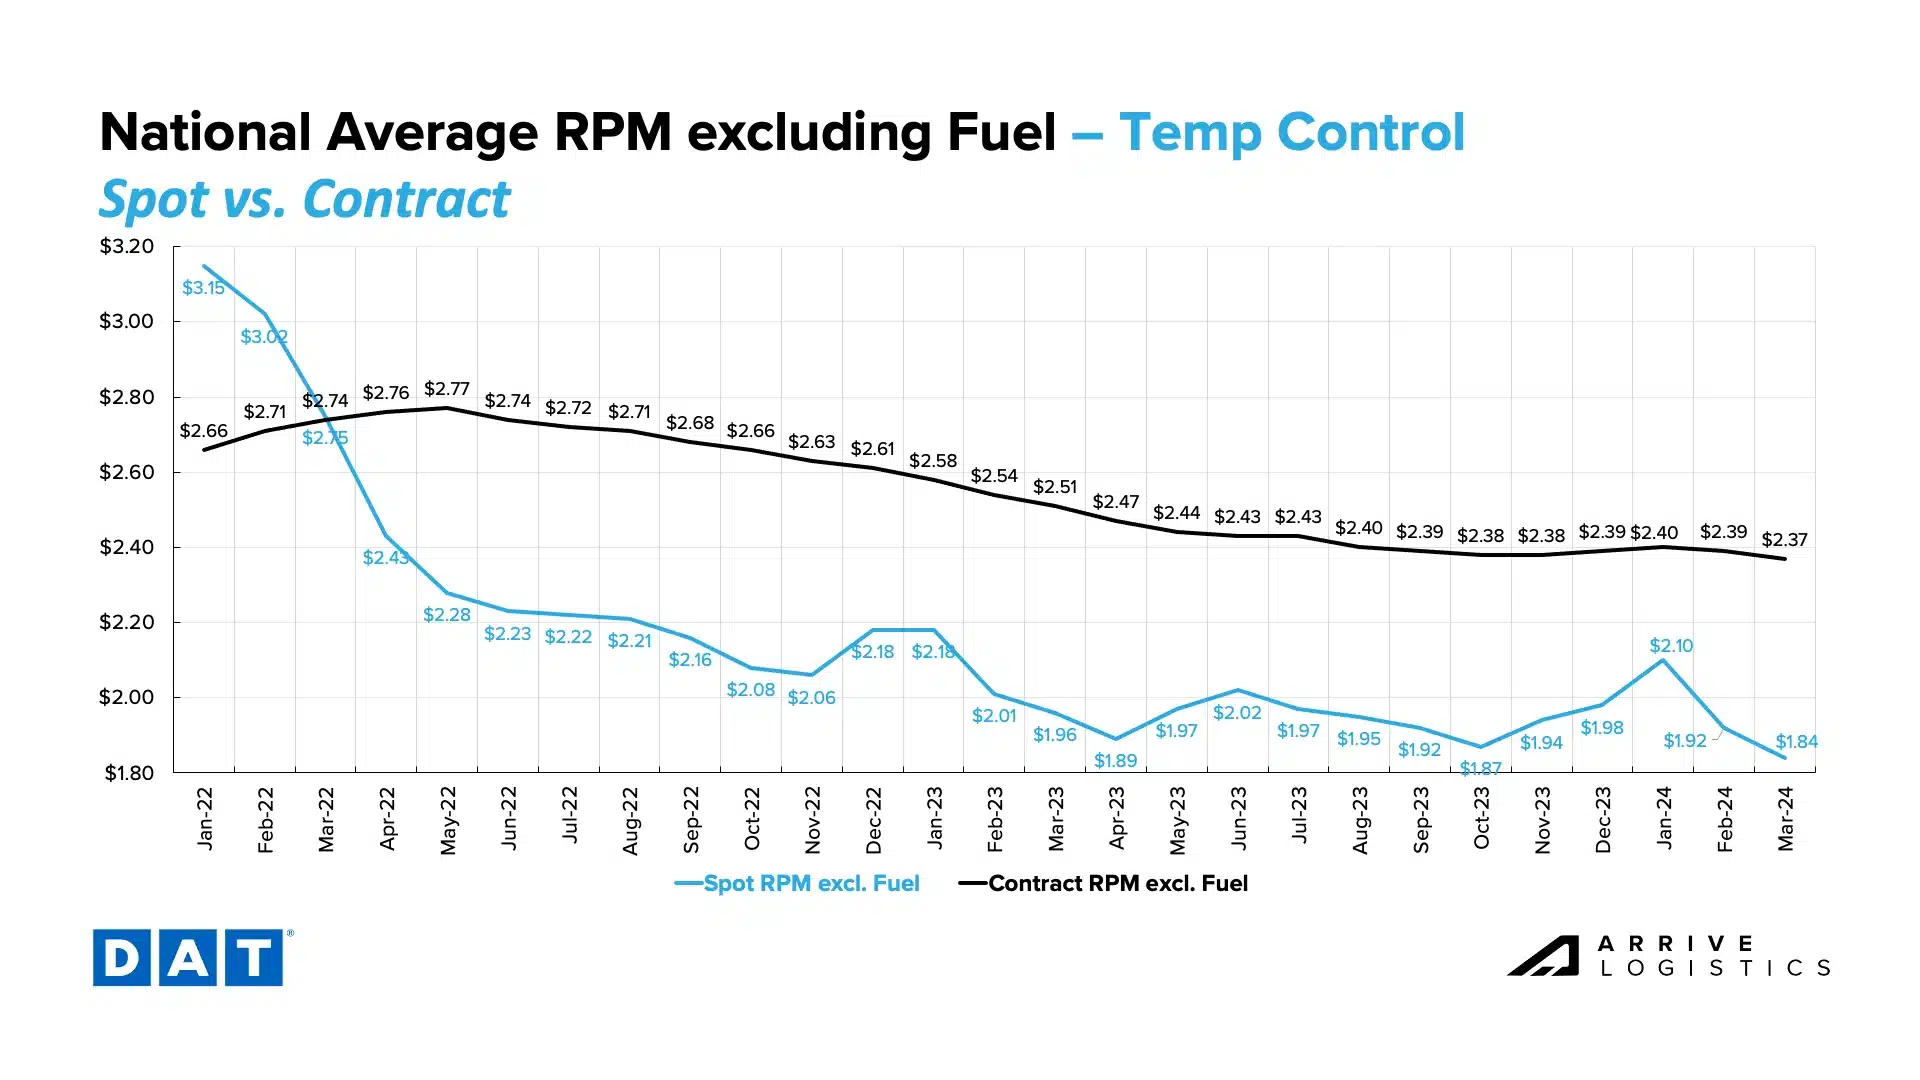
Figure 14: DAT Temp Control National Average RPM Spot vs. Contract
Normal seasonal tightness in the flatbed market continued in early March, but rates remain down year-over-year. Unlike the dry van and reefer markets, flatbed contract rates continue to slowly tick upwards and mitigate downward pressure from spot rates. Spot rates are currently $1.93 excluding fuel, and contract rates are $2.60 excluding fuel.
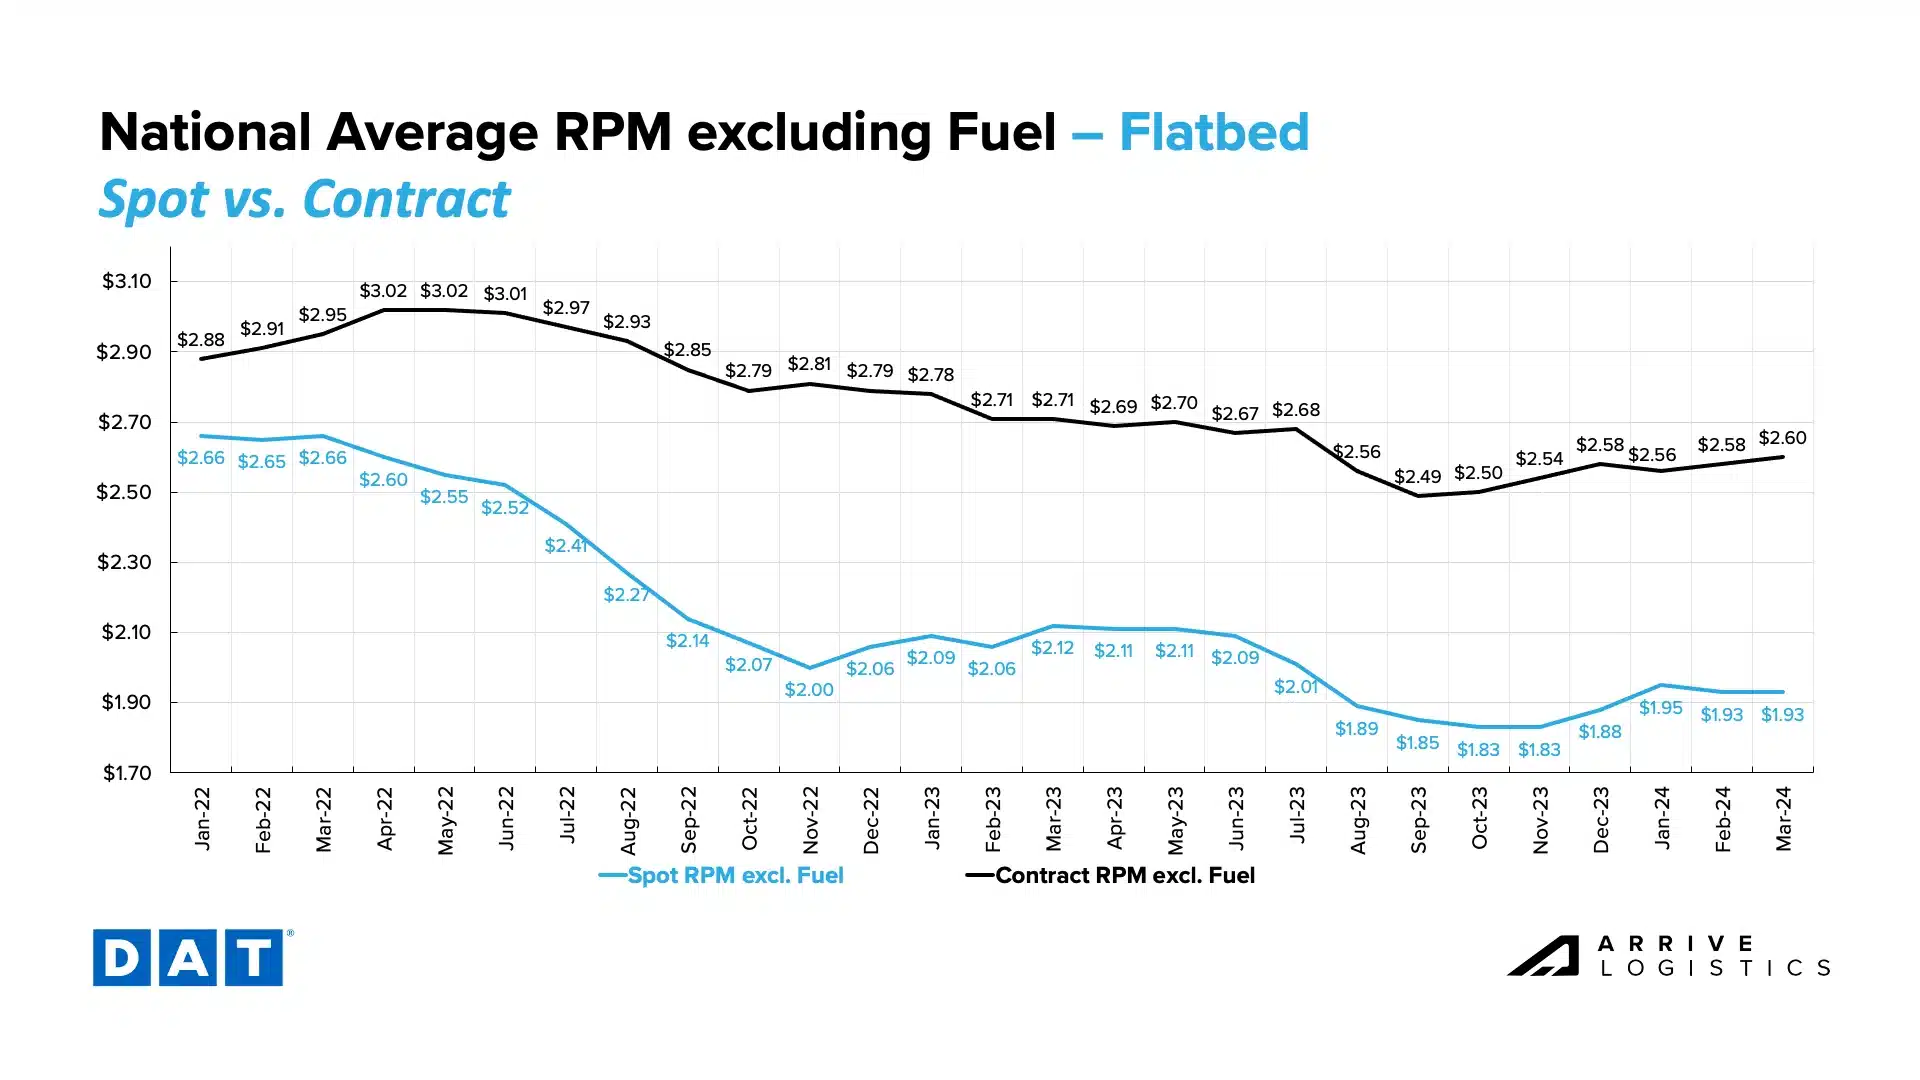
Figure 15: DAT Flatbed National Average RPM Spot vs. Contract
![]() Figure 17: High Risk Areas for Theft – T21
Figure 17: High Risk Areas for Theft – T21
The for-hire carrier population continues to shrink. However, over the past month, revocations decreased as new entrants increased, slowing the exit rate slightly. This may have resulted from recent spot rate increases convincing carriers to stay in the market.
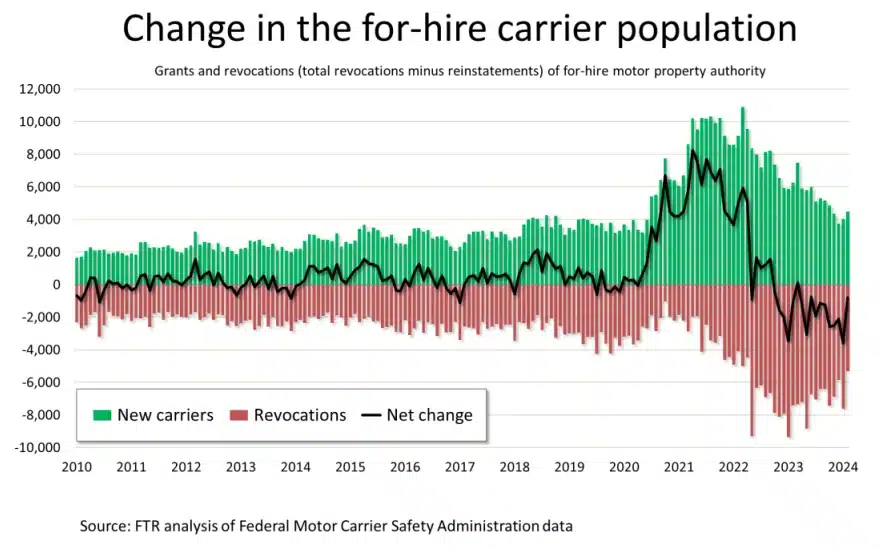
Figure 18: FTR’s Net Change in Carrier Population
According to ACT Research, new Class 8 truck orders remain above replacement levels, with 16,000 orders in February, or 15,100 on a seasonally adjusted basis. This trend is somewhat surprising as spot rates remain low, but it could be due to private fleets preparing for 2027 emission regulations.
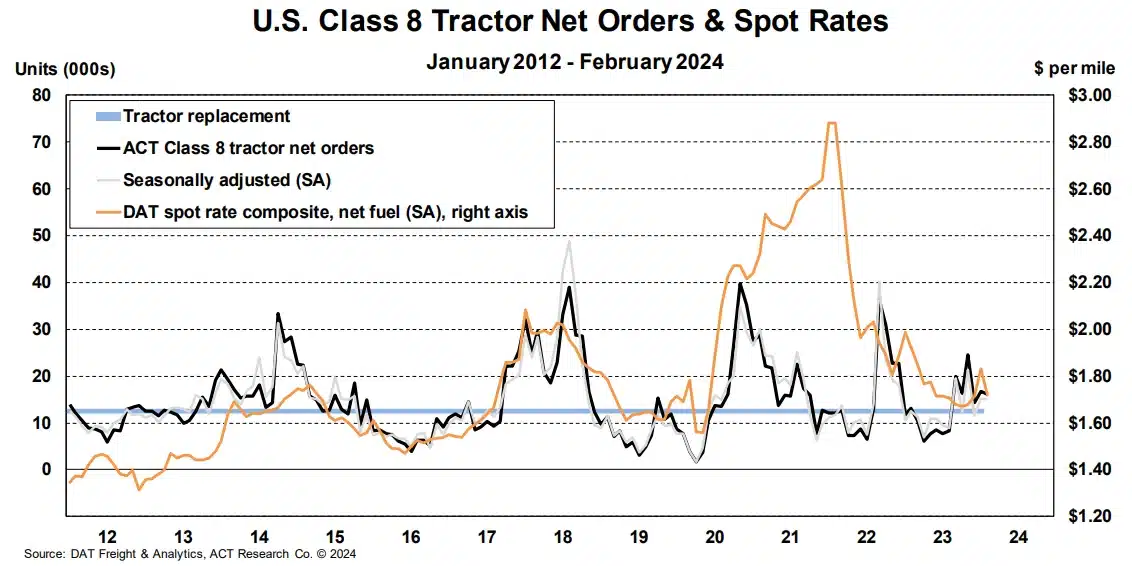
Figure 19: Class 8 Orders vs. Spot Rates – ACT Research
ACT’s Driver Availability Index increased by 4.5 points in January after dropping in December, likely due to owner-operators choosing to close rather than pay annual insurance and registration while rates are low. Despite loosening conditions, long-term challenges remain as retiring Baby Boomers shrink the U.S. labor force.
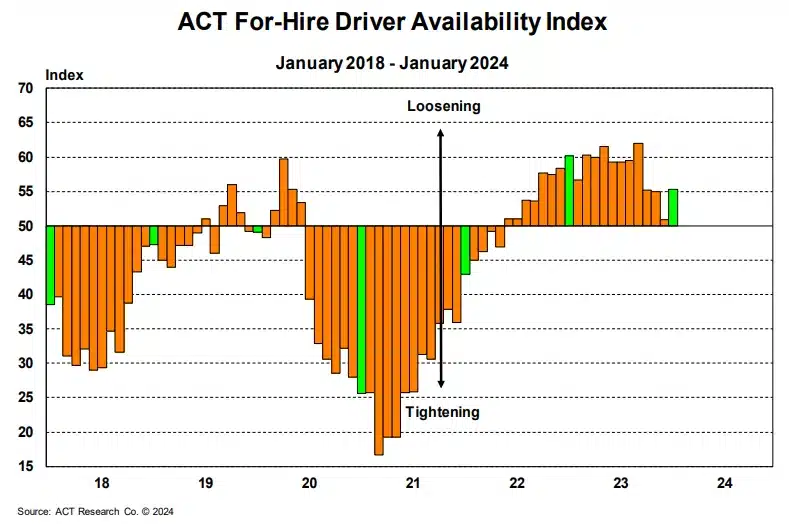 Figure 20: Driver Availability, ACT Research
The National Retail Federation (NRF) reported increased imports in January. Nearly two million TEUs entered the U.S., leading to 4.7% month-over-month growth and 8.6% year-over-year growth.
Attacks on vessels by Houthi rebels in the Red Sea are still causing significant maritime shipping disruptions. Shippers have continued to reroute shipments to avoid dangerous areas and mitigate impacts. Cargo is being rerouted around the Cape of Good Hope or sent across the Pacific Ocean to the West Coast. Despite some impact on costs and transit times, the movement of global goods remains stable overall. ![]()
Figure 21: NRF Monthly Imports
ACT Research data indicates that the 18-month destocking period could end soon, as inventory-to-sales ratios hit 1.16 in December, down from a peak of 1.21 in March 2023. Wholesale inventory-to-sales ratios are currently at 1.34 and are approaching the pre-pandemic average of 1.31. As retailers begin to restock inventories, there will naturally be an uptick in freight demand.
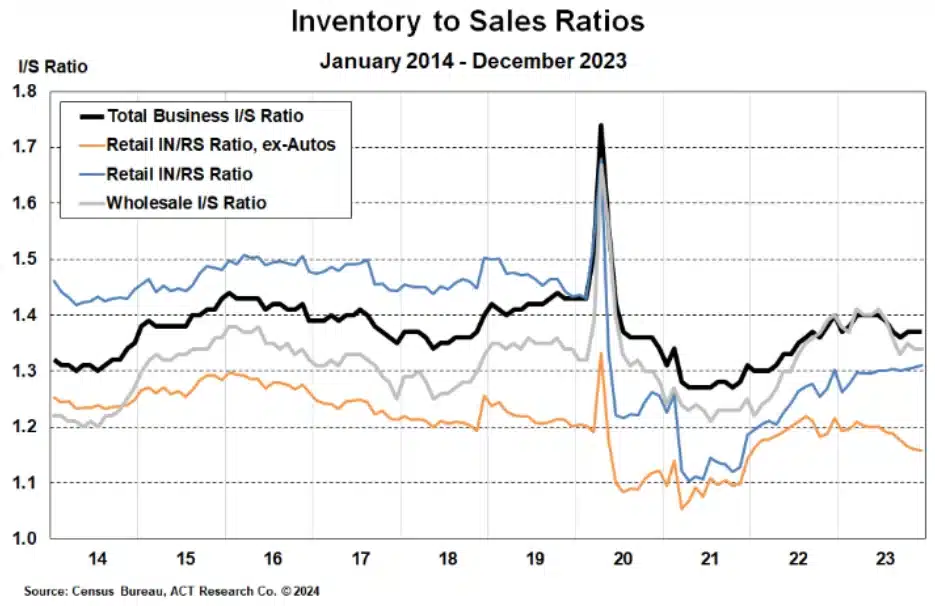
Figure 22: Total Business Inventories, ACT Research
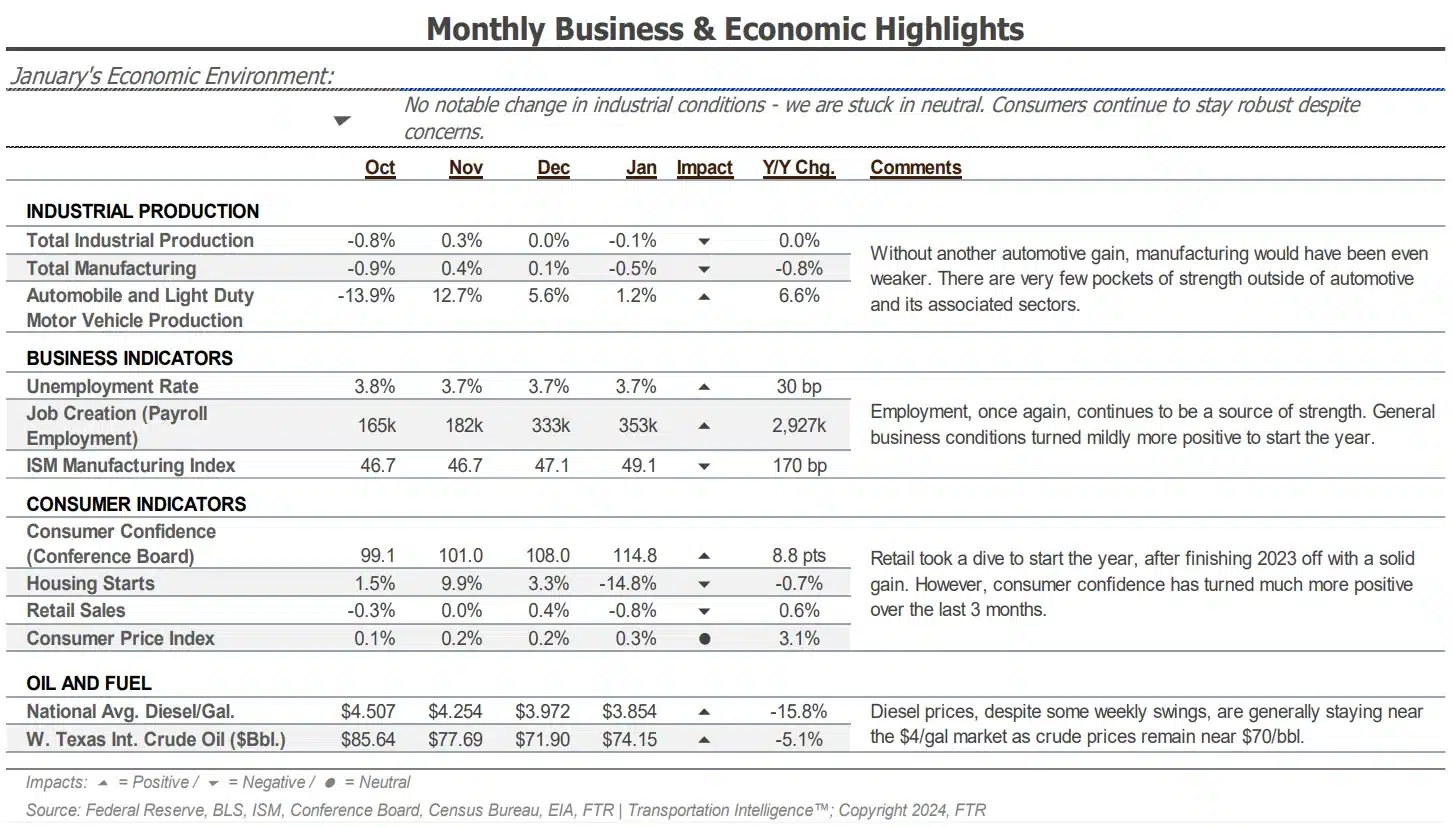
Figure 23: January Business & Economic Highlights, FTR
FTR’s revised truck loads forecast projects year-over-year growth of 0.7% in 2024, a relatively large jump from the 0.2% decline estimated a month ago. The main driver is the projected growth in reefer loads, which FTR expects to increase by 2.4% annually. Flatbed and dry van truck loadings are likely to grow by 0.8% and 1.1%, respectively. The primary driver of the optimistic forecast is the continued strength of the U.S. economy.
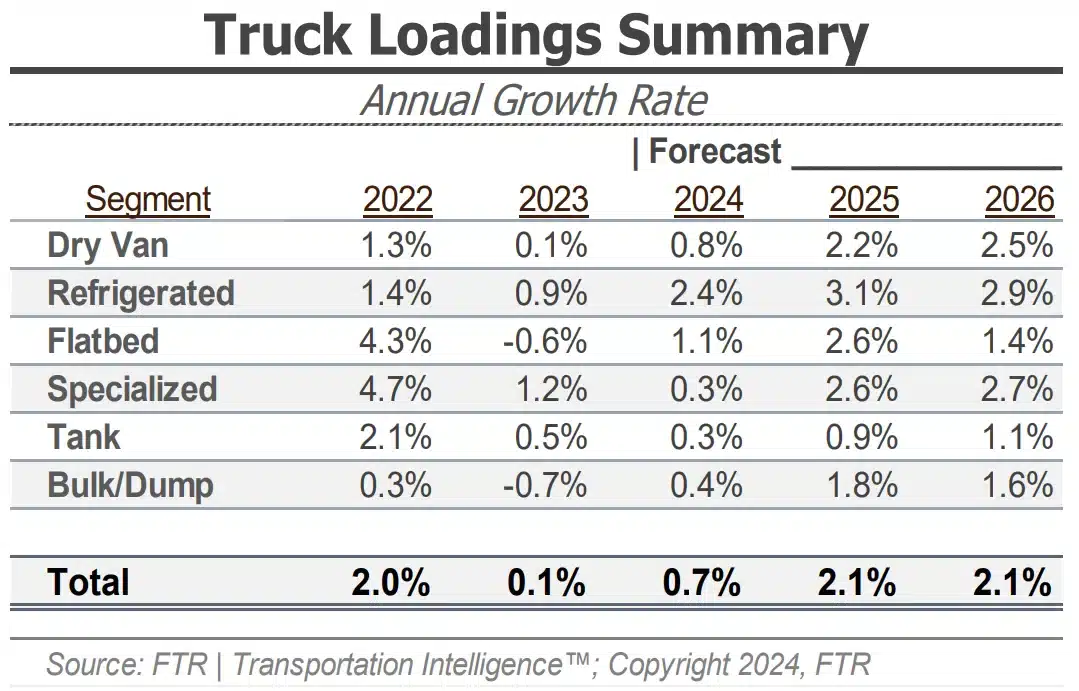
Figure 24: FTR’s Truck Loadings Summary
February CPI data came in at 3.2%, a slight increase from 3.1% in January. The inflation rate, excluding food and energy, was 3.8%. While this was slightly higher than expected, it is unlikely to deter the Fed from cutting interest rates later this year.
It is still unclear when the Fed will start to cut rates, but Jerome Powell, the Chair of the Federal Reserve, announced there is almost enough evidence to begin the process. Rate cuts are likely to drive increased spending and, in turn, freight demand.
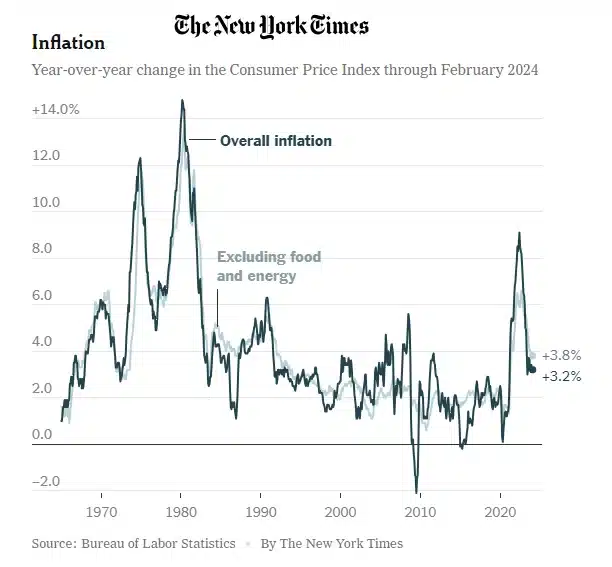
Figure 25: New York Times Inflation Data
January Bank of America card data showed card spending rose 2.9% year-over-year on a non-seasonally adjusted basis. One of the key drivers was the strong recovery of service-based spending, which rebounded from a winter-impacted January. However, this was offset by weaker spending in February compared to January. Overall, consumer spending remains stable despite elevated interest rates.
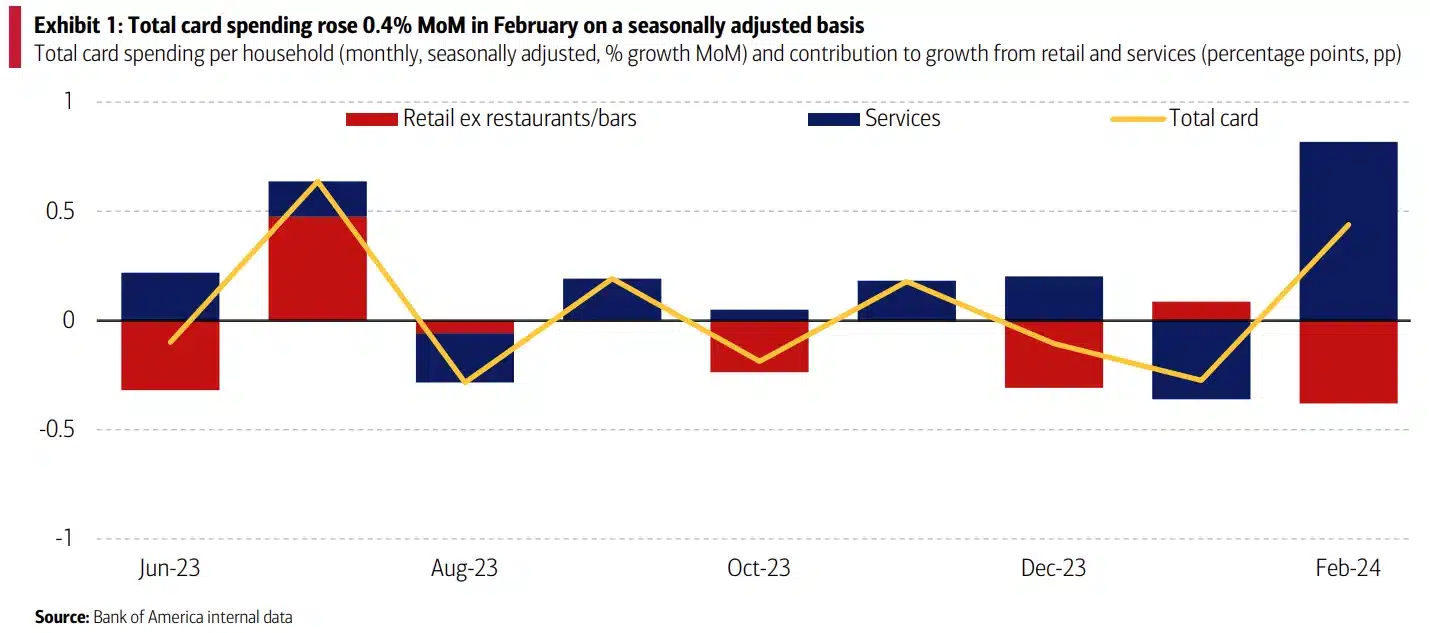 Figure 26: Bank of America Total Card Spending Per Household