


December demand trends continued to mirror patterns observed throughout 2023. DAT reports that December spot load postings were down 23.3% from November and 57.2% year-over-year. Truck postings also declined significantly, falling 14.3% from November to December and 20.2% year-over-year.
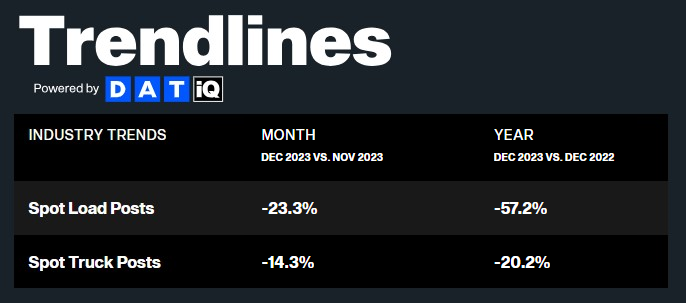
Figure 1: DAT Trendlines
The FreightWaves SONAR Outbound Tender Volume Index (OTVI), which measures contract tender volumes across all modes, was up 8.2% year-over-year, or 9.1% when measuring accepted volumes after the significant tender rejection rate decline.
Accepted volumes were down 4.2% month-over-month as of early January, driven by a 6.1% decrease in accepted dry van tenders and a 2.8% decrease in accepted reefer tenders.
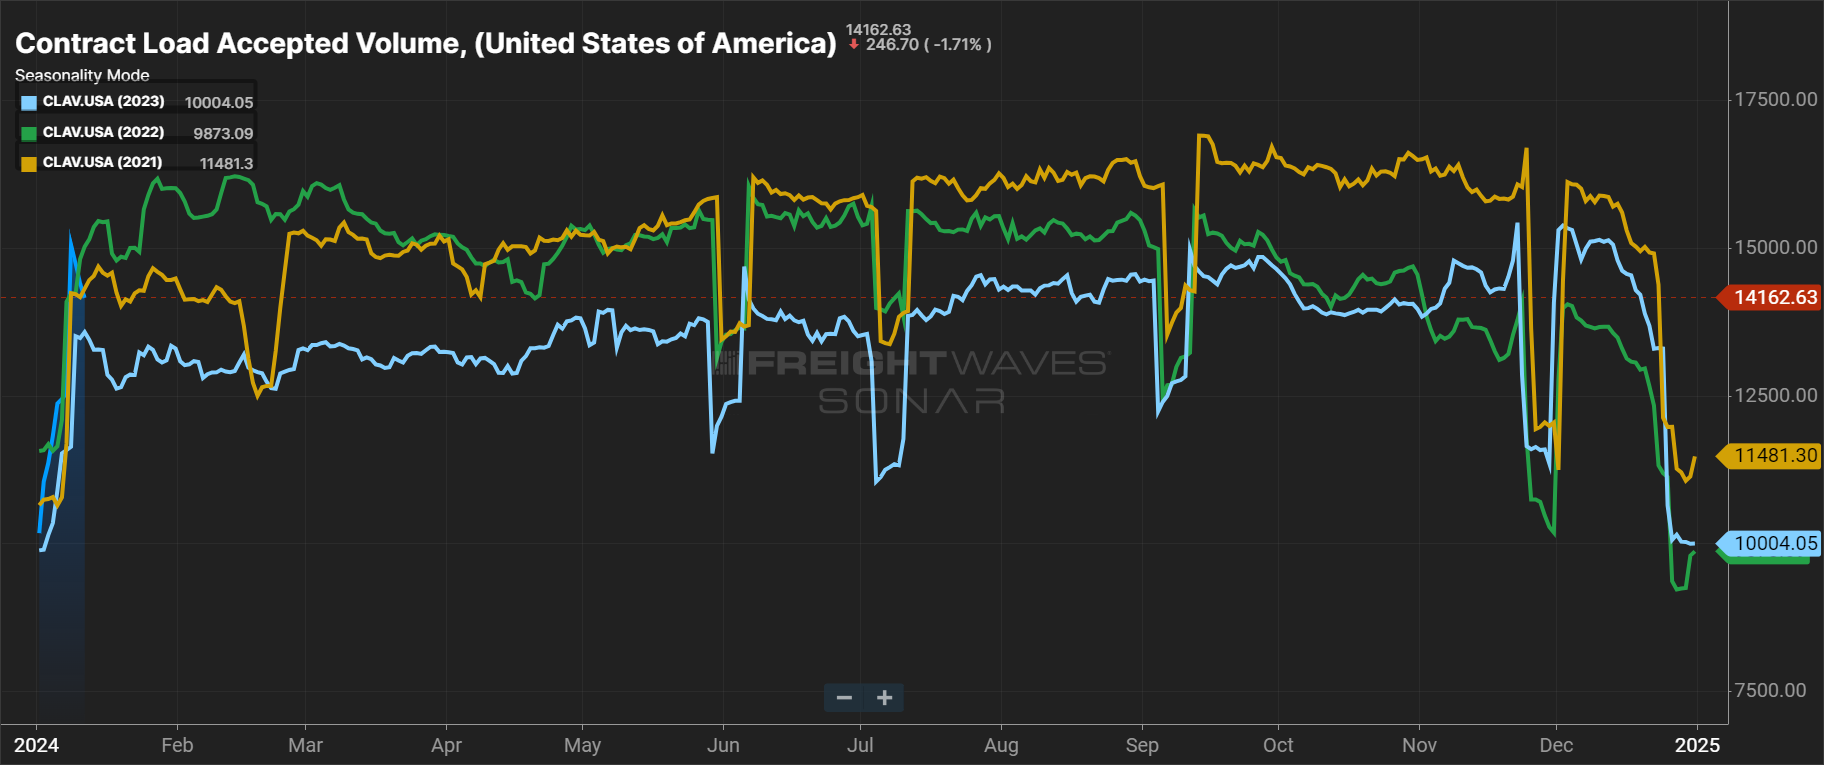
Figure 2: Contract Load Accepted Volume, SONAR: Accepted contract volumes were down 4.2 y/y in early January and remained well above historical pre-pandemic levels.
USDA truck shipment data for fresh fruits and vegetables continues to show pullbacks, with total shipments down 8% year-over-year in mid-December and 18% as of early January. Total U.S. imports are down 6.4% year-over-year, while domestic shipments are down 28%.
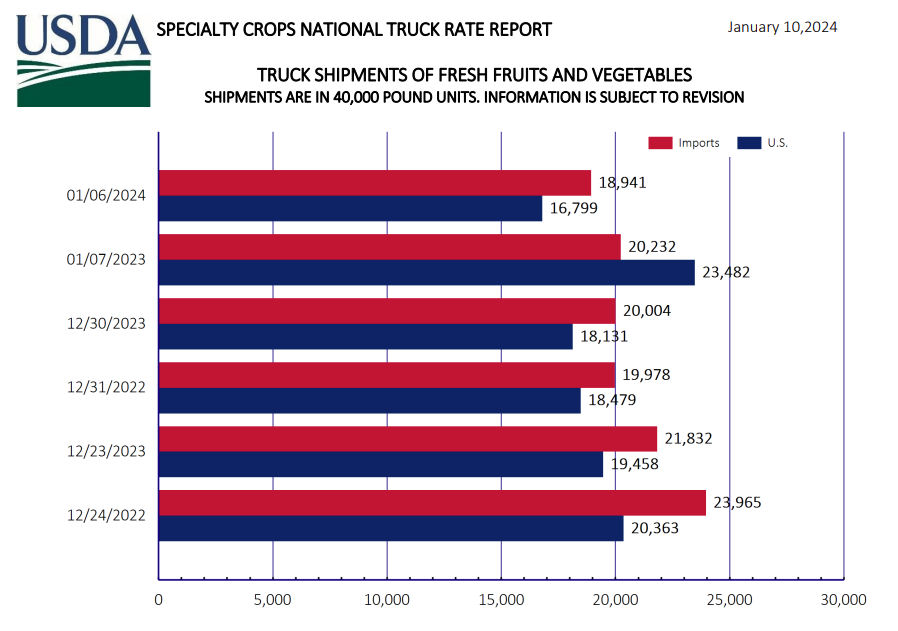 Figure 3: USDA Specialty Crops National Truck Rate Report
Market conditions remain relatively stable, indicating that current capacity is sufficient to meet demand. While the back half of December showed some tightness, it was less dramatic than during the pandemic years and is more indicative of traditional seasonal patterns.
Overall, December market conditions mirrored those observed in the second half of 2022, proving that this downcycle has lasted longer than normal. However, volatility increased in the reefer market during December compared to the end of 2022, indicating this mode is leading the charge toward market normalization.
The Sonar Outbound Tender Reject Index (OTRI), which measures the rate at which carriers reject freight they are contractually required to take, ended the year at around 5%. That was close to the high water mark in 2022 but well below the 22.45% reading at the end of 2021. The index started the year hovering above 4% and will likely remain in line with 2023 trends for the near future.
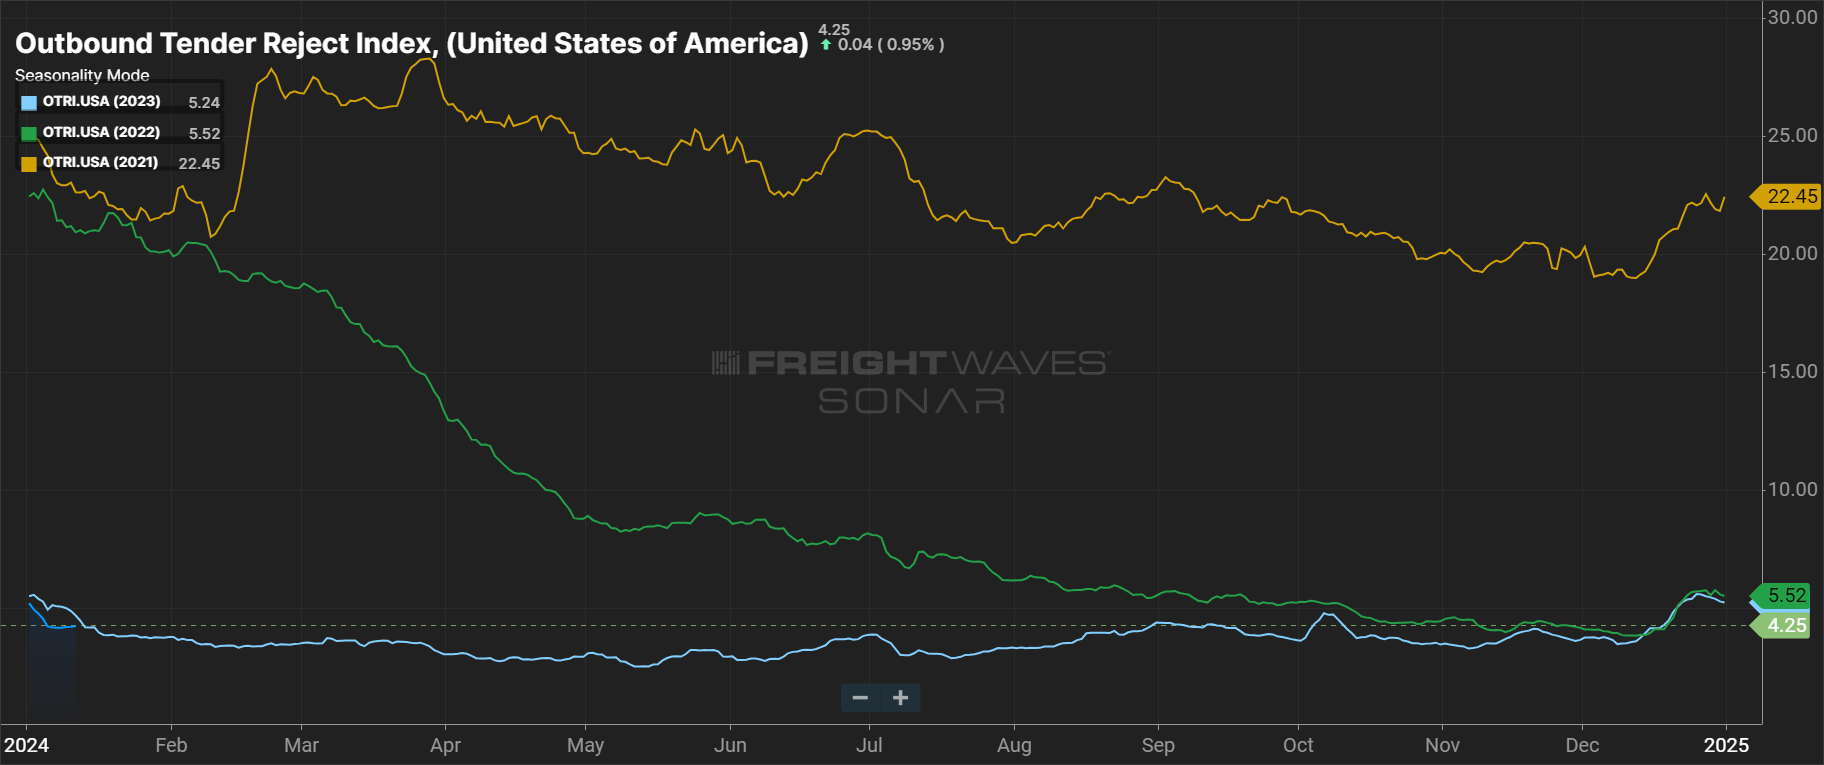 Figure 4: Outbound Tender Reject Index, SONAR: OTRI remains around 4% and 2022 levels — a sign capacity is still sufficient to support demand and carriers are protecting their contract freight despite increases in spot.
Tender rejections on the reefer side continue to show increased volatility, with rejection rates jumping well over 10% in the second half of December. While this is well below the 38% we saw in 2021, it is still higher than the rejection rates in 2022. Reefer rejection rates have started the year hovering above 8%, slightly higher than in early 2023.
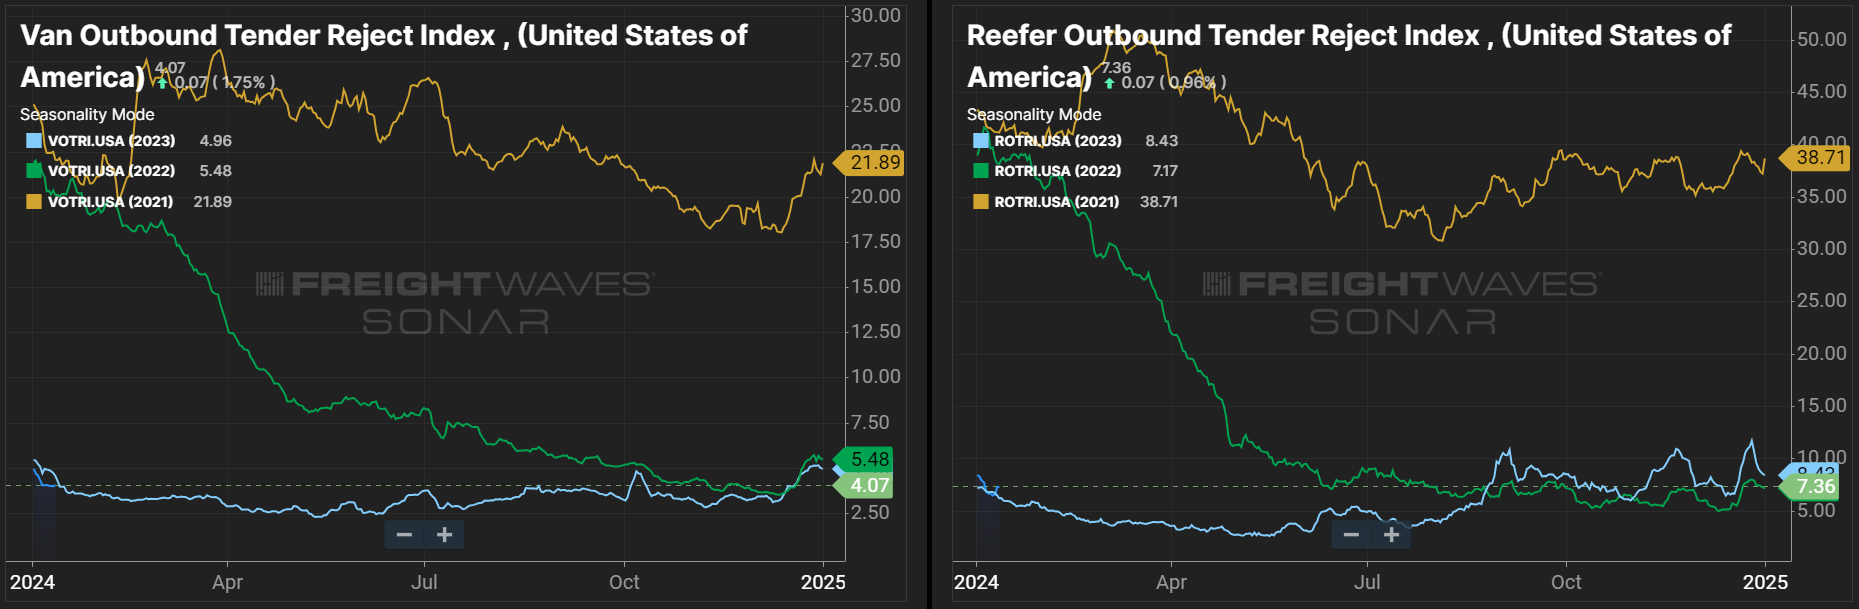 Figure 5: Van and Reefer Outbound Tender Reject Indices, SONAR: Dry van rejections remain historically low, but a meaningful increase in the baseline for reefer tender rejections is a sign that the market is becoming more vulnerable for the equipment type.
The DAT Load-to-Truck Ratio measures the total number of loads relative to the total number of trucks posted on their spot board. December data showed decreases across all three modes: Dry van was down 9% month-over-month and 44.1% year-over-year, reefer was down 18.3% month-over-month and 54.6% year-over-year, and flatbed saw the smallest movement, down 7.1% month-over-month and 47.9% year-over-year. These numbers continue to reflect the oversupplied market.
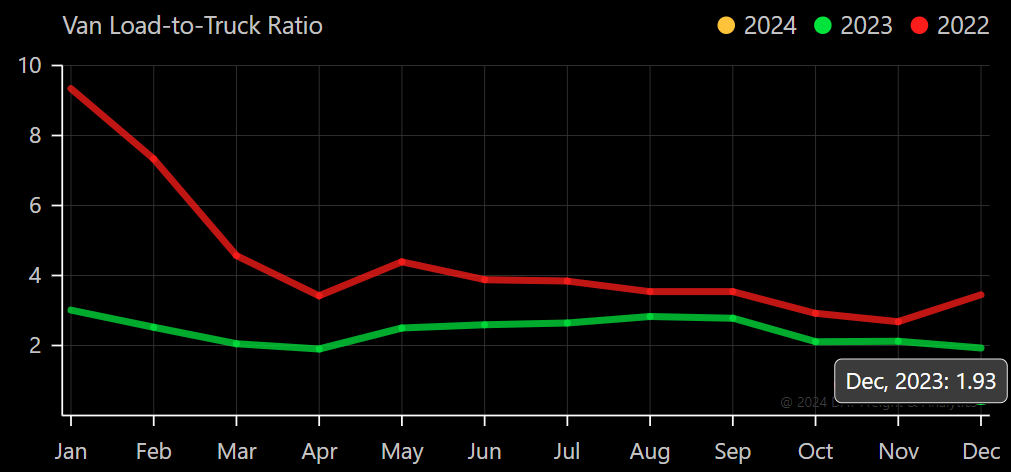 Figure 6: DAT Van Load-To-Truck Ratio
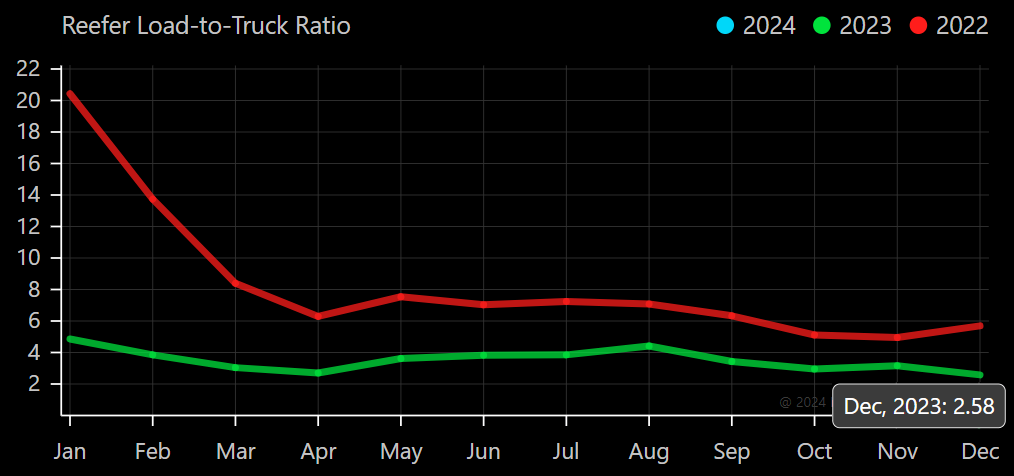 Figure 7: DAT Reefer Load-To-Truck Ratio
The Morgan Stanley Dry Van Freight Index is another measure of relative supply; the higher the index, the tighter the market conditions. The black line with triangle markers on the chart provides a great view of what directional trends would be in line with normal seasonality based on historical data dating back to 2007.
As expected, conditions tightened throughout November and December, then loosened slightly toward year-end. The first index reading of 2024 was the lowest in the past six years, further indicating that supply is still largely sufficient to support current demand.
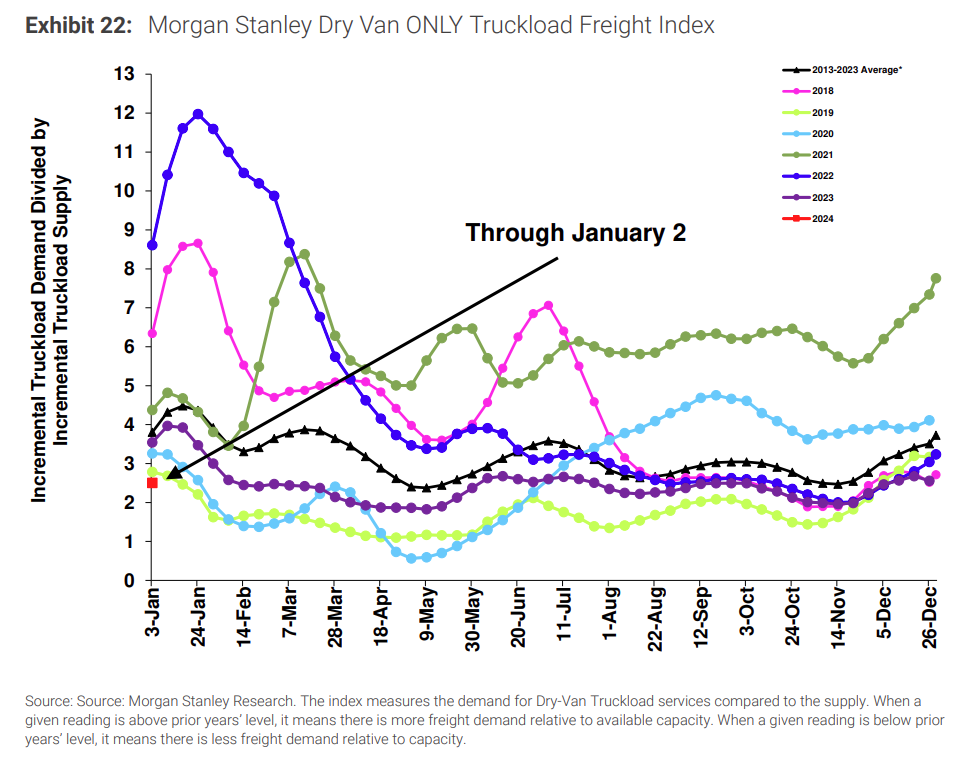
Figure 8: Morgan Stanley Dry Van Truckload Freight Index
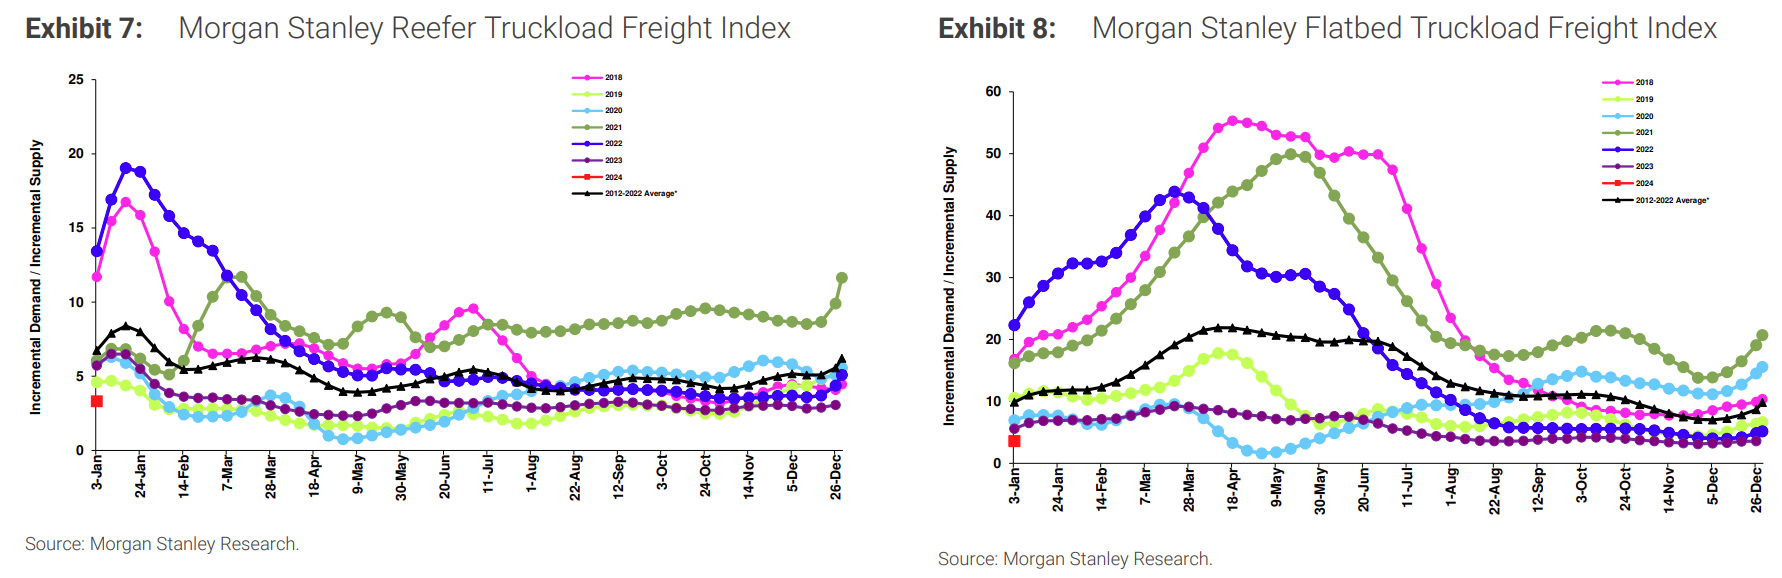
Figure 9: Morgan Stanley Reefer and Flatbed Truckload Freight Indice
The Truckstop Weekly National Average Spot Rates provide a detailed view of week-to-week rate movements and a real-time look into the current rate environment.
Van spot rates jumped up in the back half of December before flattening out in the first week of January, and reefer spot rates increased significantly after Christmas Day. This rate volatility is consistent with expectations. However, the increased rate movements relative to those seen in the summer peak and last year’s holiday season illustrate that the market is progressing towards equilibrium.
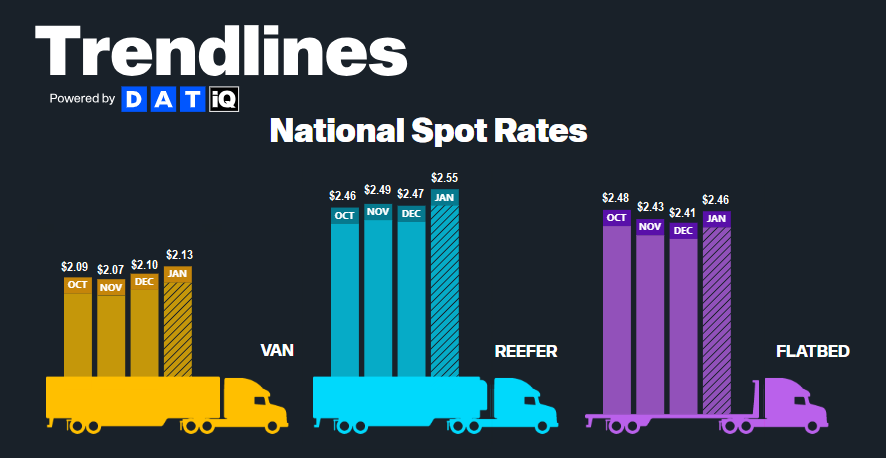
Figure 11: DAT Monthly Rate Trends
According to DAT, December all-in spot rates, including linehaul and fuel costs, were up for dry van and slightly down for reefer and flatbed. All-in van rates increased by $0.03 from November to December, while all-in reefer and flatbed rates decreased by $0.02.
Fuel prices have declined rapidly over the past few months, likely influencing reefer and flatbed all-in rate trends. All-in van rates have increased despite the fuel surcharge decline, indicating that linehaul rates rose even more than all-in rates.
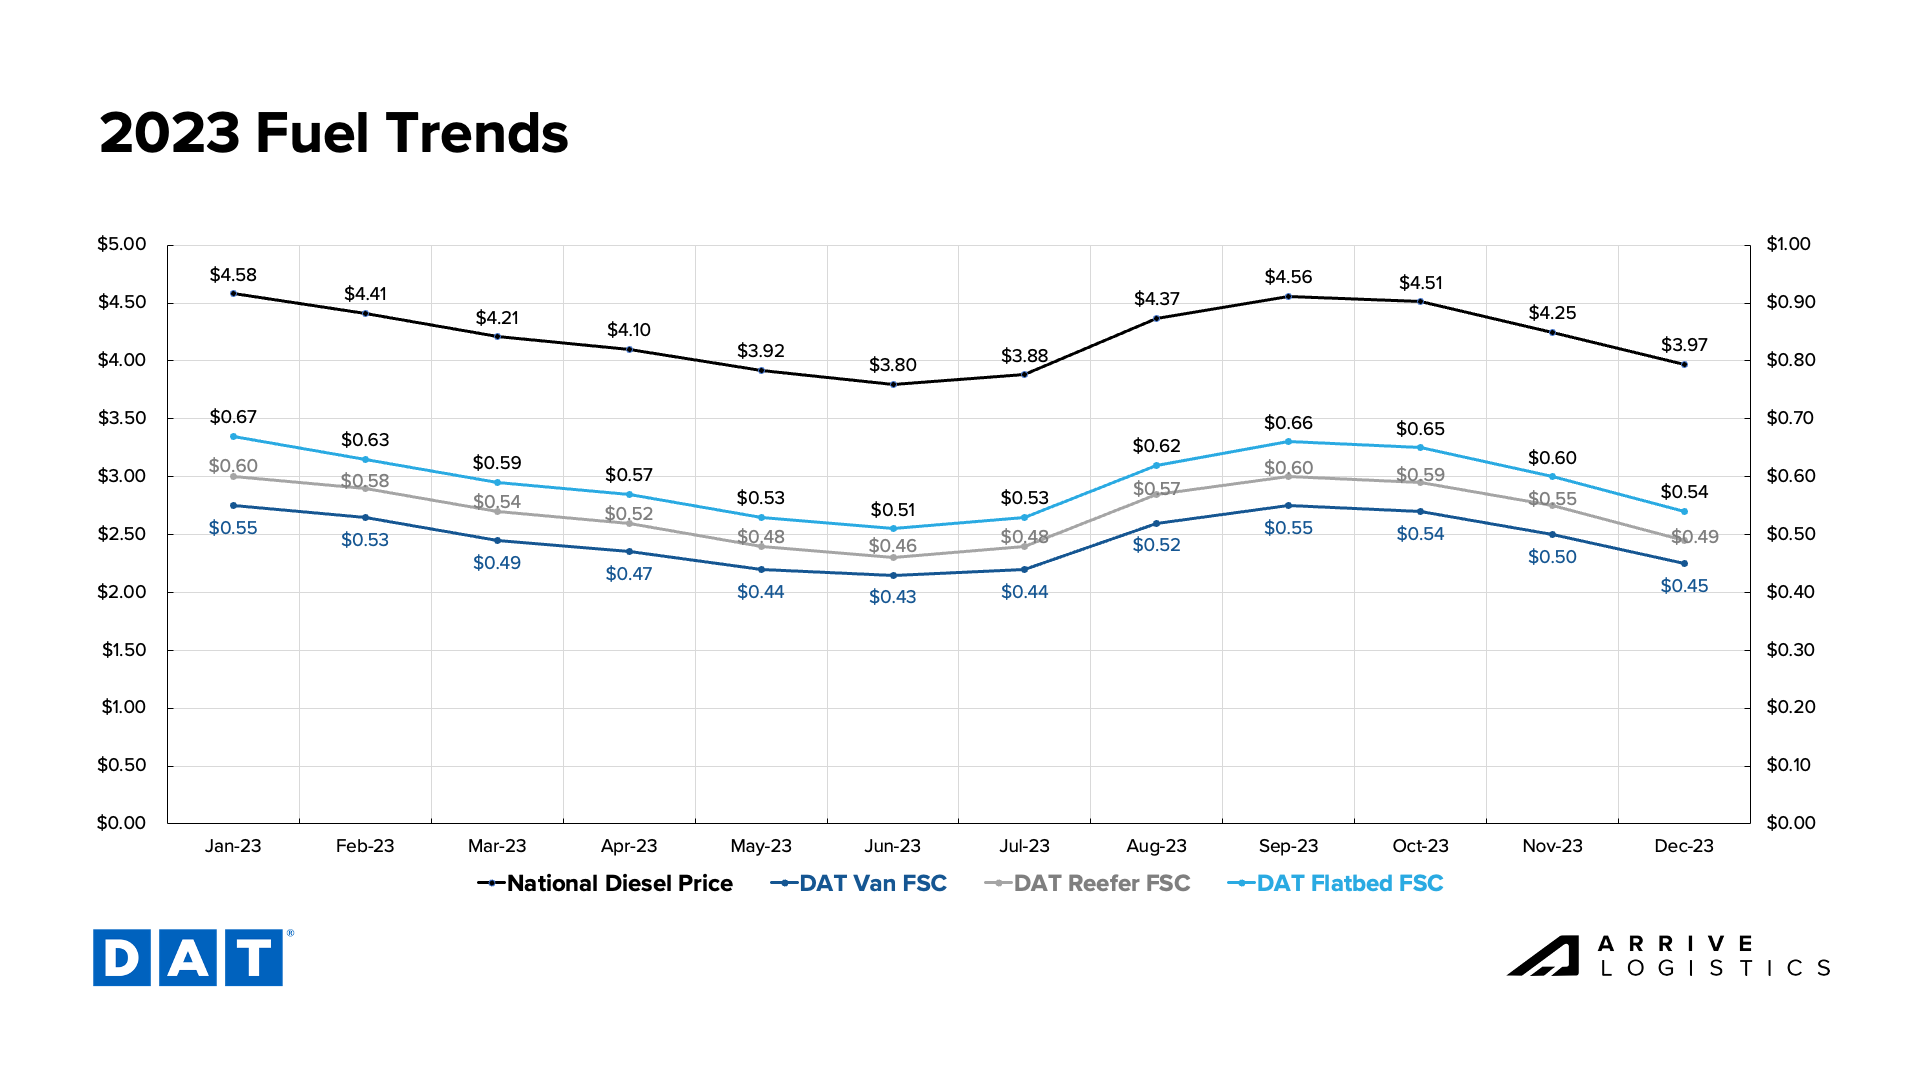
Figure 12: DAT Fuel Trends
National diesel prices were volatile in 2023 and declined quickly throughout Q4, falling nearly 13% to below $4.00 per gallon from September to December. In turn, per-mile fuel surcharges decreased significantly. The DAT van fuel surcharge dropped by $0.10 per mile from September to December, while reefer and flatbed surcharges declined by $0.11 per mile and $0.12 per mile, respectively, illustrating the variance between linehaul and all-in rate movement.

Figure 13: DAT Dry Van National Average RPM Spot vs. Contract
Van spot rates continued to rise, increasing by $0.08 from November to December and another $0.05 in January. Contract rates also increased month-over-month for the first time since early 2022.
Although the Q4 holiday seasons likely influenced spot rate increases, the gap between spot and contract is closing to levels not yet reached in the current downcycle. The December van rate spread dropped from $0.44 in November to $0.39 in December. As of mid-January, the rate spread sits at $0.35.
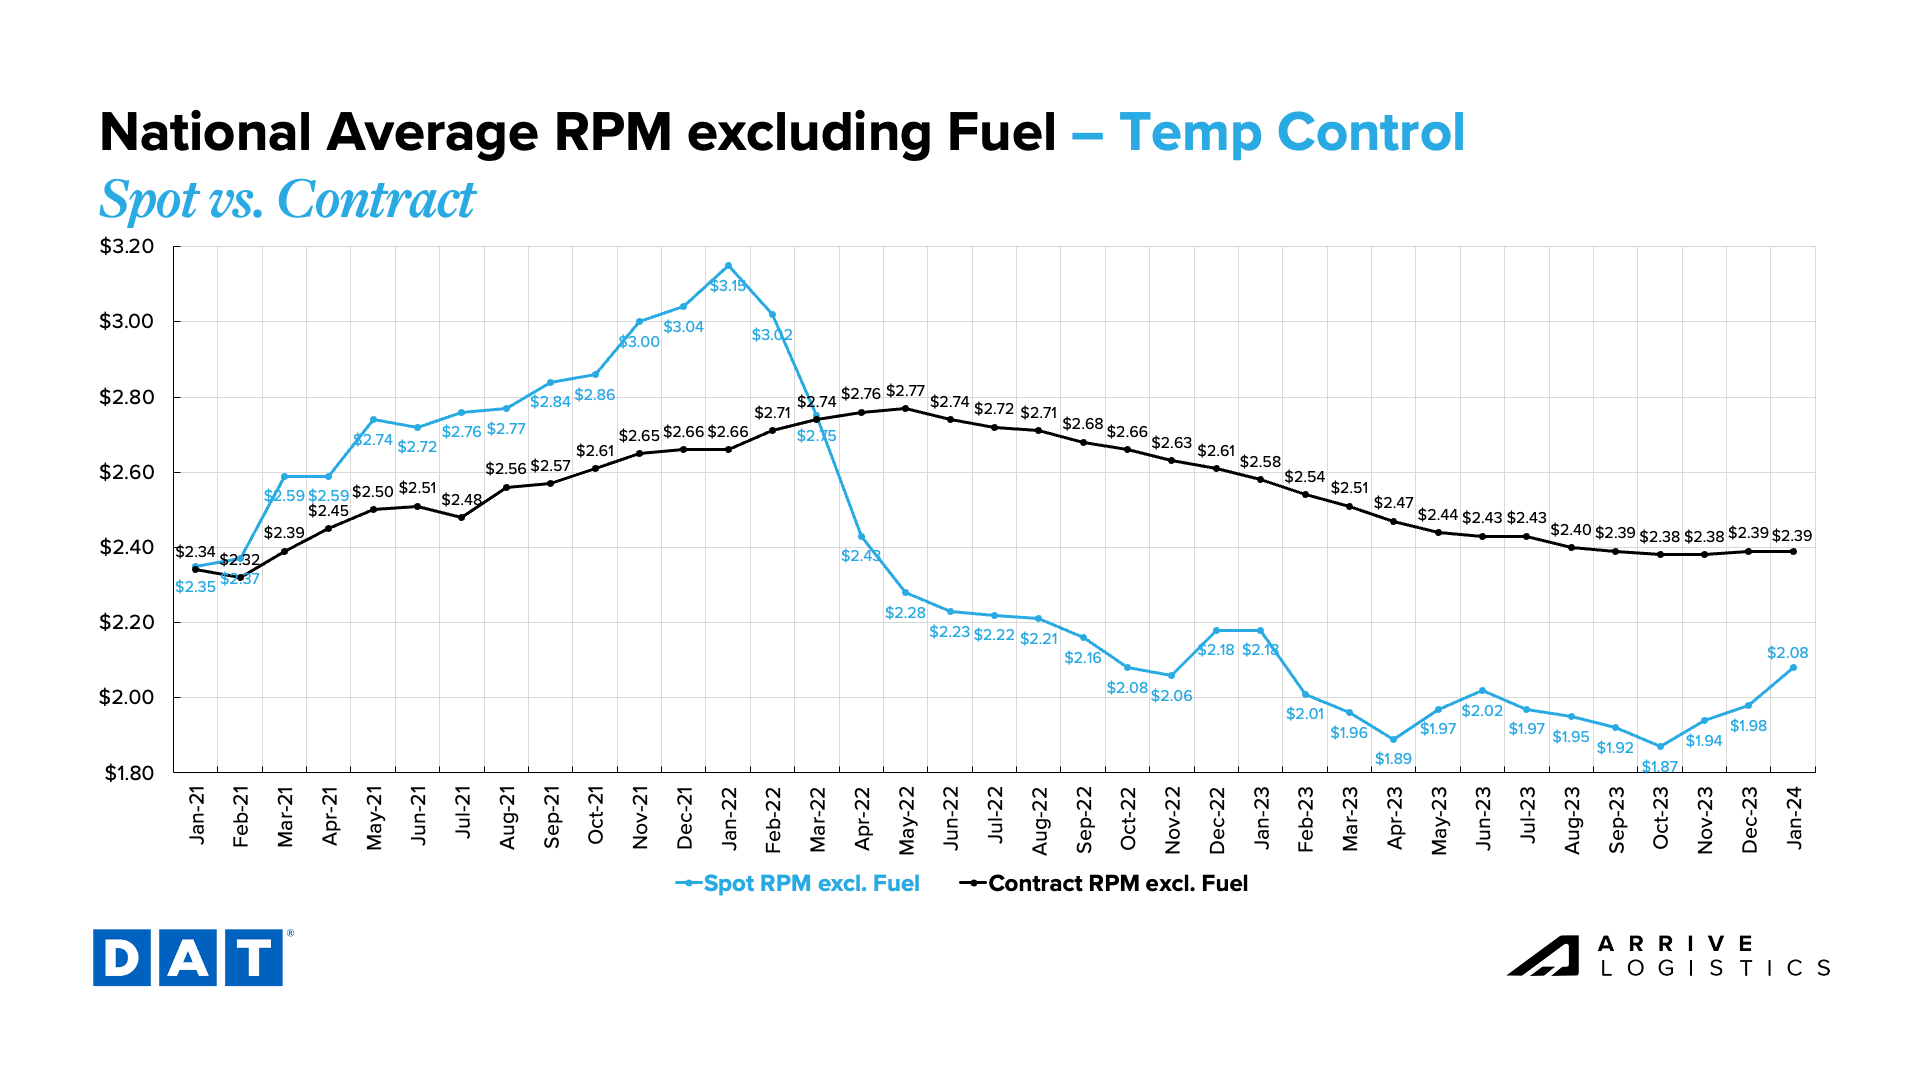
Figure 14: DAT Temp Control National Average RPM Spot vs. Contract
Flatbed spot rates continue to follow a similar trend as van and reefer equipment, jumping by $0.04 in December and $0.07 in mid-January. Contract rates increased by $0.05 in December but have since pulled back by $0.02. The spread between spot and contract rates remains high, at $0.64 per mile in mid-January.
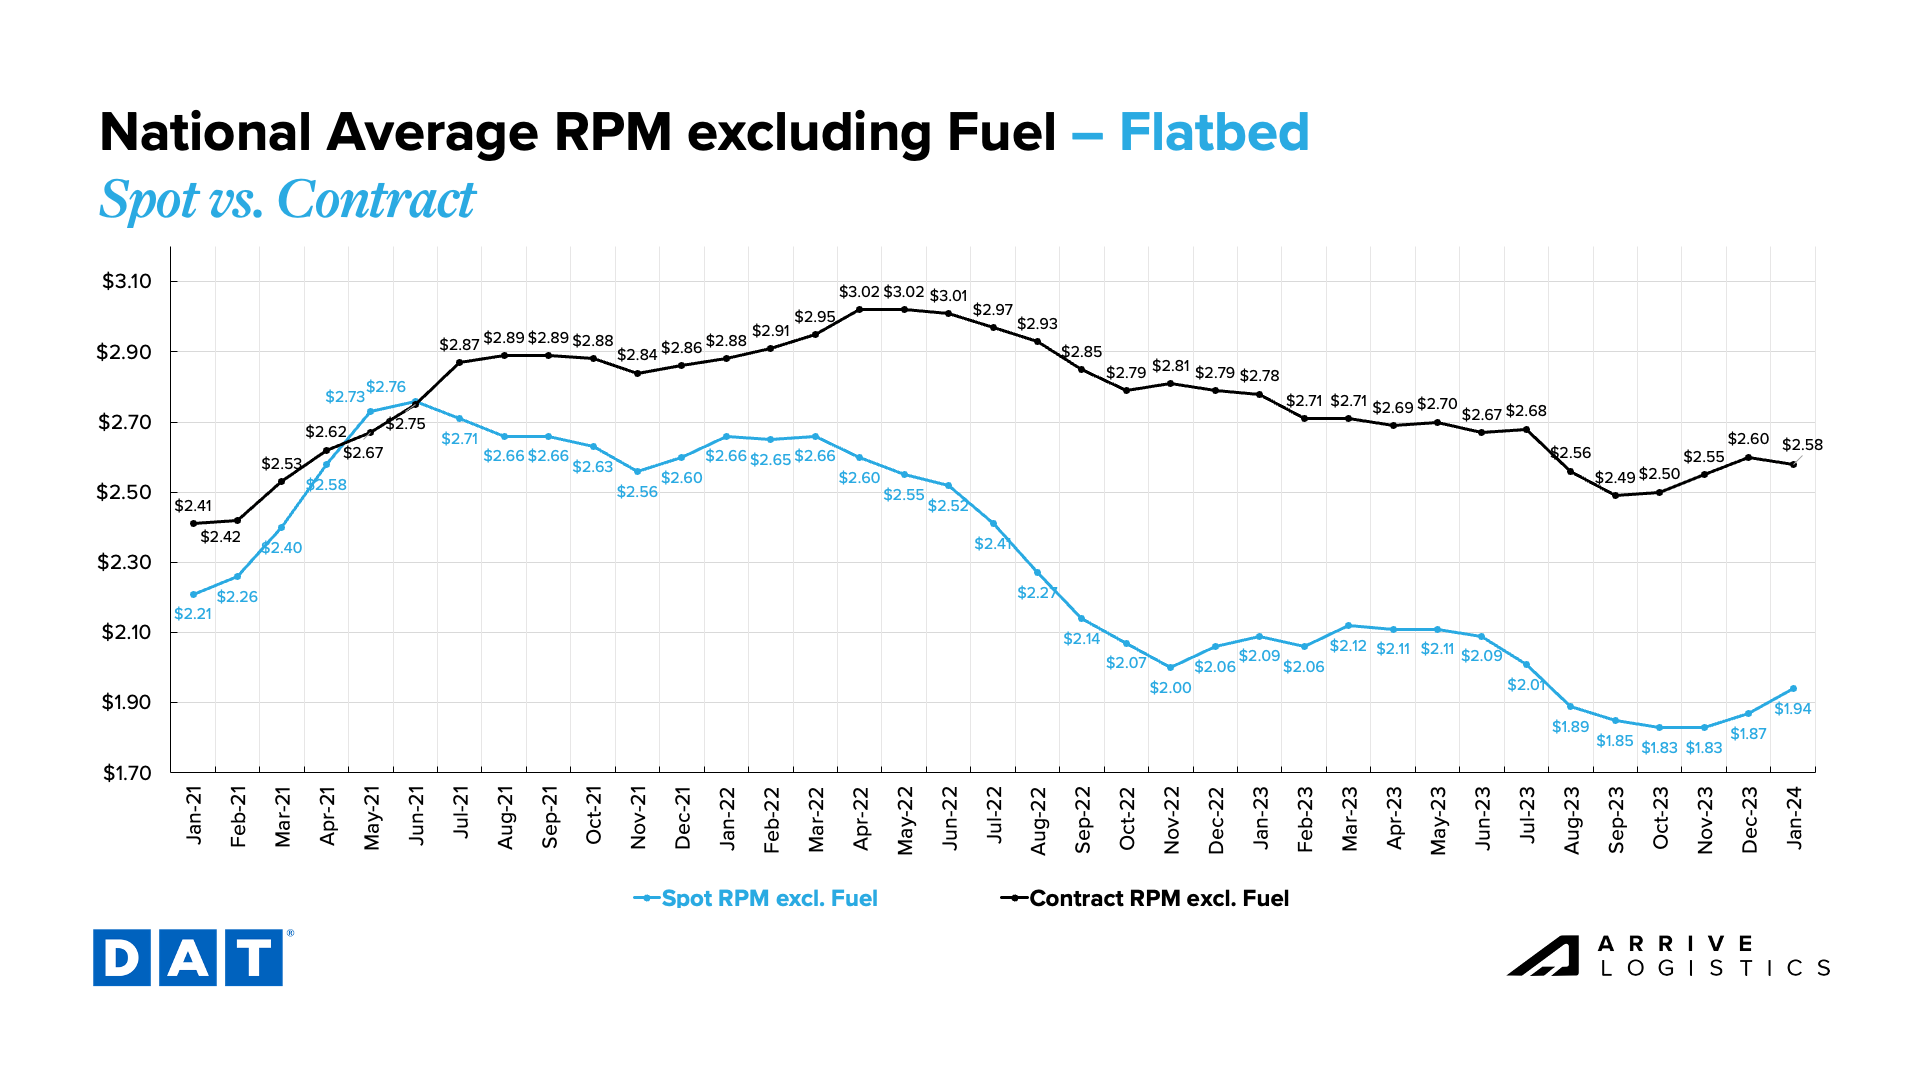
Figure 15: DAT Flatbed National Average RPM Spot vs. Contract
Reefer rates continue to show the most volatility, with linehaul spot rates jumping by $0.04 in December and another $0.10 in January. While we expect pullbacks in the second half of the month, the large rate increase supports the belief that the market is moving toward equilibrium.
The reefer rate spread has dropped to $0.29, the smallest during this downcycle, indicating that the market is more vulnerable to demand disruptions than during the peak demand season in summer 2023.
Spot rates are still down year-over-year, so carriers with heavy spot exposure and flat operating costs continue to see margin compression. While recent fuel price declines offer some relief, it is not enough to offset the last 18 months of low rates. However, there are signs that the market will reach equilibrium sometime this year, driving rates up in turn.
Capacity continues to exit the market, but slower than in previous downcycles. The pace largely results from carriers running mostly contractual freight and remaining profitable despite market conditions. Drivers from smaller carriers and owner-operators are joining larger carriers to avoid heavy spot market exposure.
Net revocations declined toward the end of 2023, but so did the number of new carrier start-ups. Nonetheless, revocations remain historically high, and as a result, Q4 of 2023 had the largest-ever decline in carrier population. Moreover, low numbers of new entrants indicate the industry is less attractive to entrepreneurs due to limited opportunities for success.
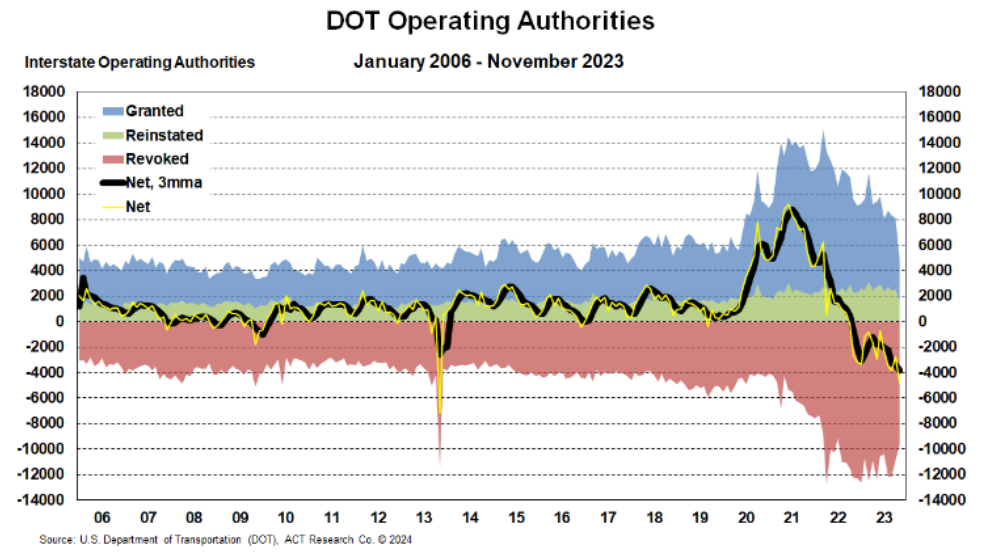
Figure 16: DOT Operating Authorities
New truck orders continue to roll in as 2024 build slots open up. However, there was a 14% decline in year-over-year truck orders in 2023, with total orders falling to 234,529 from 273,588 in 2022. The decline occurred at a time when carriers were experiencing low demand and margin compression, ultimately resulting in lower profits and a lack of cash needed to order new equipment.
This trend likely points to the financial strength of larger carriers and private fleets’ ongoing investment in growth. While order levels were above the historical average, they did align with seasonal trends. Orders increasing also represents the possibility of a much slower capacity reduction than in previous cycles. Overall, freight demand is healthy, so larger fleets are adding capacity to insource volume back from smaller for-hire fleets and owner-operators.
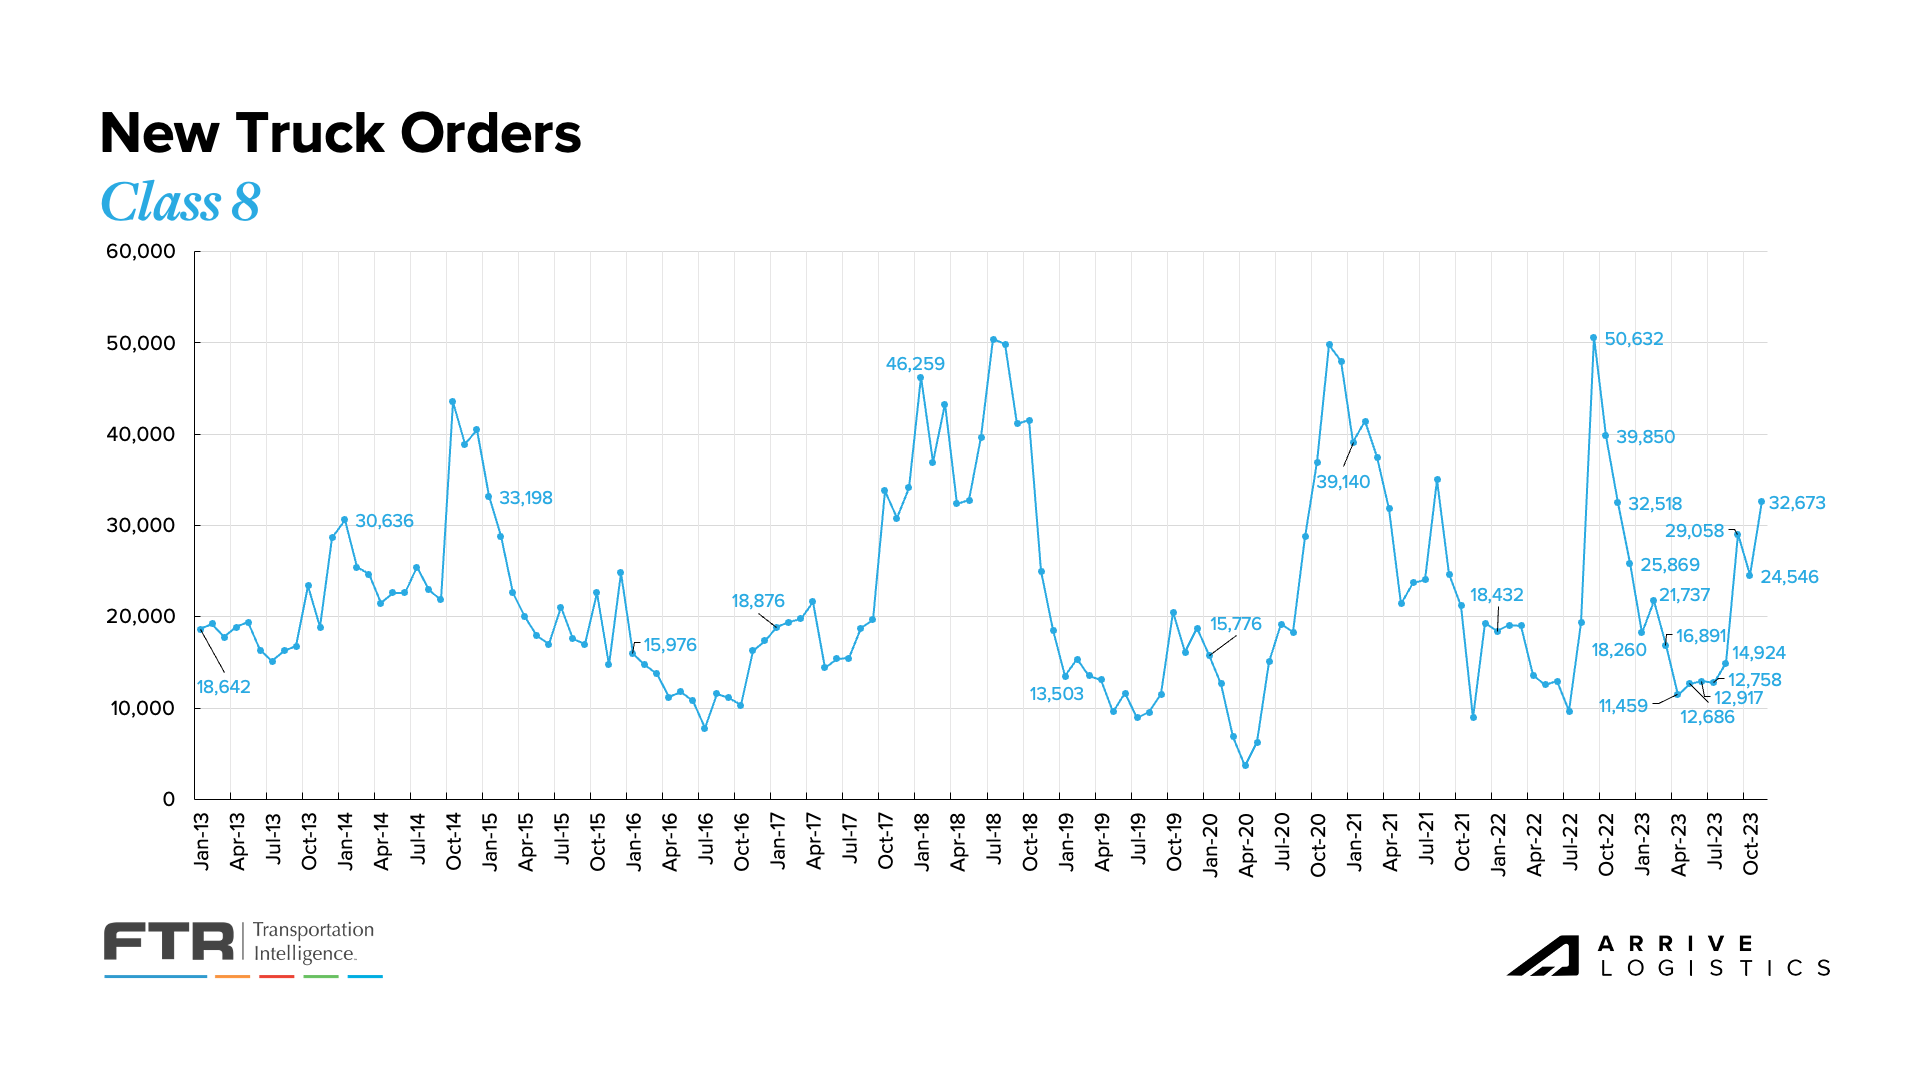
Figure 17: New Truck Order, Class 8: FTR Analysis of FMCSA Data
Demand remains down year-over-year and will likely stay flat for the first half of 2024. The overall strength of the consumer remains a focus from an economic perspective. The National Retail Federation (NRF) recently reported that imports peaked in October, which was later than the typical August peak.
Q4 2023 imports were above Q4 2022 levels, indicating that retailers may have been completing their destocking phase and were gearing up for the holidays. Downside demand risks remain, including concerns about manufacturing trends, how long strong consumer spending will continue, the potential impact of student loan payment resumption on 2024 housing and construction, and the possibility of an extended period of elevated interest rates.
If import volumes remain in line with the National Retail Federation (NRF) forecast, the results will show that an 8.6% month-over-month jump in December imports drove increased freight movement into the last two weeks of 2023 and into early 2024. The total number of imports in 2023 will be around 22.4 million TEUs, down 12.4% from 2022 and over 13% from the all-time high in 2021.
![]()
Figure 18: NRF Monthly Imports
The latest ISM manufacturing report showed a contraction in backlogs and new orders for the 15th and 16th consecutive months, respectively. However, there was a trend shift in production and customer inventories. Production grew following a long streak of contraction, and customer inventories went from overstocked to starved. This indicates inventories have started dwindling, potentially leading to several months of increased production and, ultimately, increased freight demand.
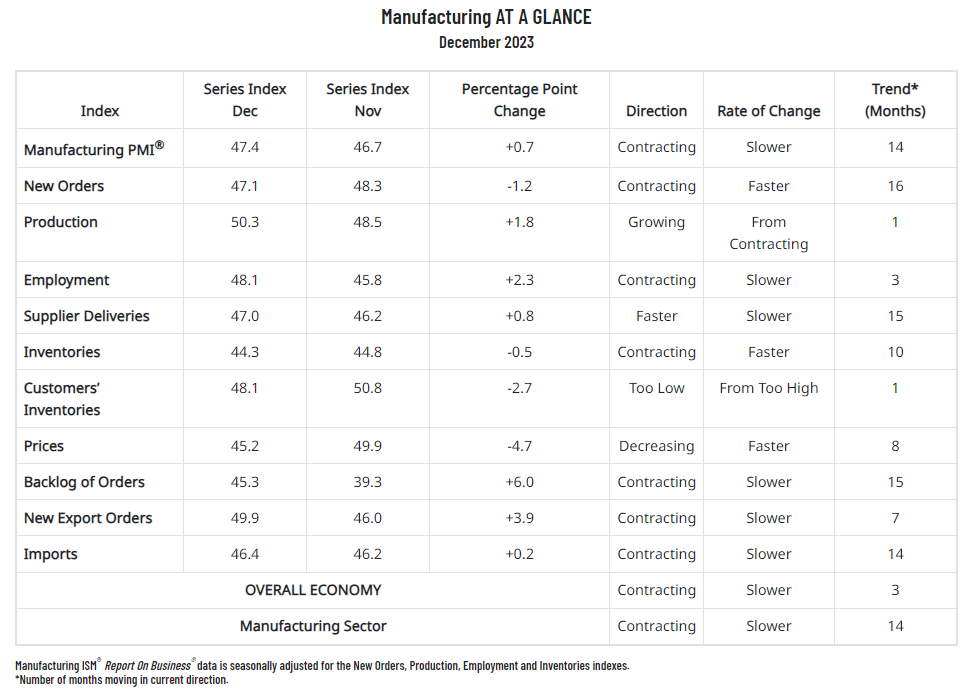
Figure 19: ISM Manufacturing Report, Manufacturing at a Glance
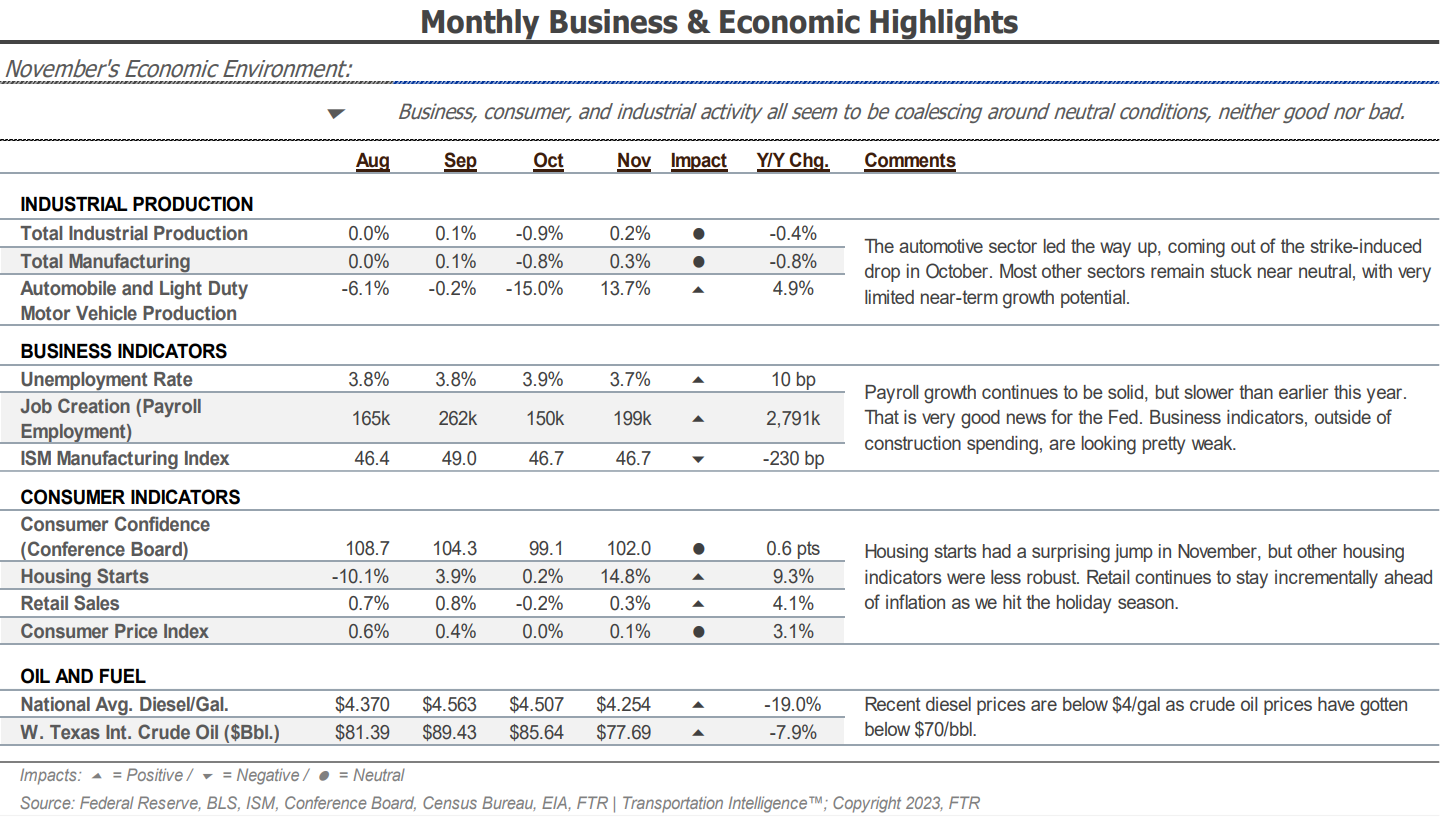
Figure 20: Monthly Business & Economic Highlights
FTR’s latest truck loadings forecast for 2024 rose slightly from last month and is expected to decline by 0.3% instead of the 0.4% projected last month. Dry van loads will likely increase by 0.7%, supported by potential growth for food and paper loadings.
The 2024 reefer truckload forecast also saw a substantial increase and is now projected to grow by 2%, largely due to anticipated growth in many food categories and a stronger outlook for meat and poultry freight.
Flatbed truck loadings are expected to decline by 0.3%, up from the original projection of a 0.6% decline.
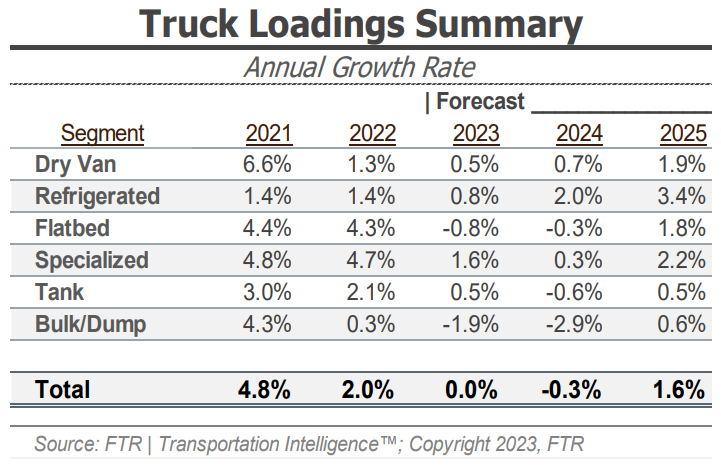
Figure 21: FTR’s Truck Loadings Summary
Overall, data on economic conditions remains relatively positive. Stability in the labor market is the biggest driver of our view that we are not on the verge of going over a demand cliff in trucking. As long as labor conditions remain healthy, we believe the consumer will continue to spend and support stable truckload volumes. Drawdowns on inventories in retail and manufacturing should also support flat to positive demand growth associated with sector bottoming.
December CPI data came in at 3.4%, a small increase from the 3.1% reading in November. While this conflicted with the recent disinflation streak, the Fed is still likely to begin cutting interest rates this year anyway. However, the current numbers cast doubt on when the first rate cut could occur. That said, we still expect to see two to three rate cuts this year, and large interest rate reductions would likely trigger increased housing activity and thus increase overall freight demand.
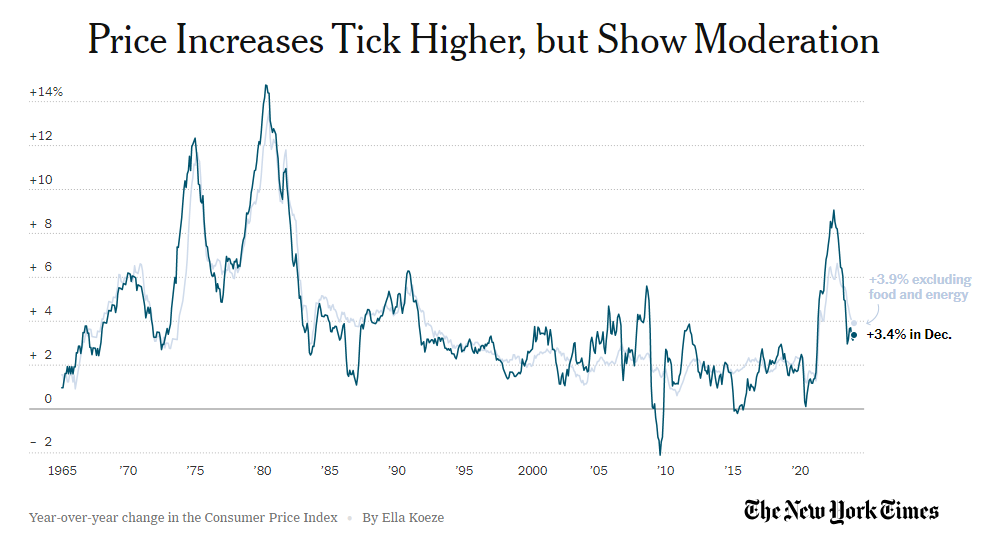
Figure 22: New York Times Inflation Data
December Bank of America card data showed consumer spending rose by 0.1% month-over-month on a seasonally adjusted basis. Total card spending in the five weeks following Thanksgiving increased by 1.3% in 2023 compared to the same time frame in 2022. The categories with the largest increases were gas (up 1% month-over-month), airlines (0.8%) and lodging (0.6%). Furniture and clothing spending were down month-over-month, with 4.3% and 2.0% declines, respectively.
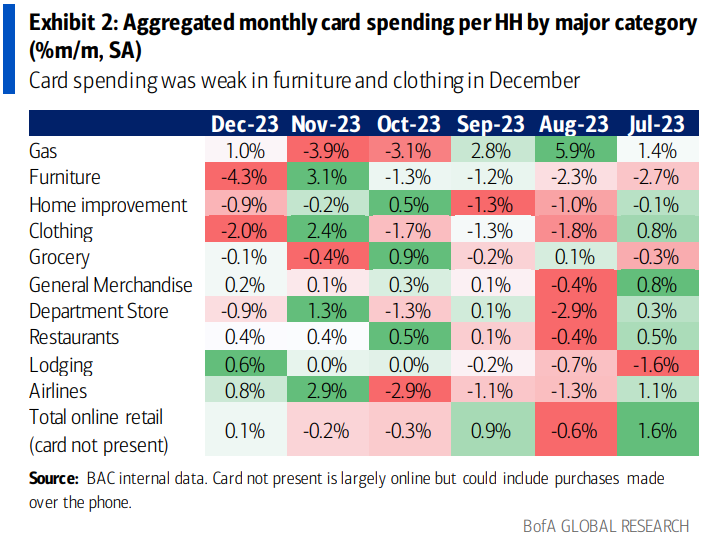 Figure 23: Bank of America Aggregated Monthly Card Spending per HH


