


2024 holiday season trends hit a higher peak than in 2022 and 2023, proving that the market is recovering and becoming more vulnerable to disruption. Declining year-over-year demand being outpaced by capacity reductions was the main catalyst for increased volatility in 2024. As a result, spot activity accelerated month-over-month and year-over-year in December.
The Sonar Contract Load Accepted Volume Index (CLAV) measures accepted load tenders moving under contractual agreements. It is similar to the Outbound Tender Volume Index (OTVI) but removes all rejected tenders. The latest CLAV data showed that 2024 holiday season contract volumes were 5%-10% lower than in 2023. Though demand was down overall, much of that contract volume likely just shifted to the spot market as increased tender rejections disrupted routing guides.
 Contract Load Accepted Volume, SONAR
December DAT data showed spot postings were up 17% from November and over 23% year-over-year, further supporting the narrative that the market is more balanced than a year ago. The large reduction in truck postings is also a strong indicator of the reduced capacity environment that led to increased routing guide challenges through the year-end push.
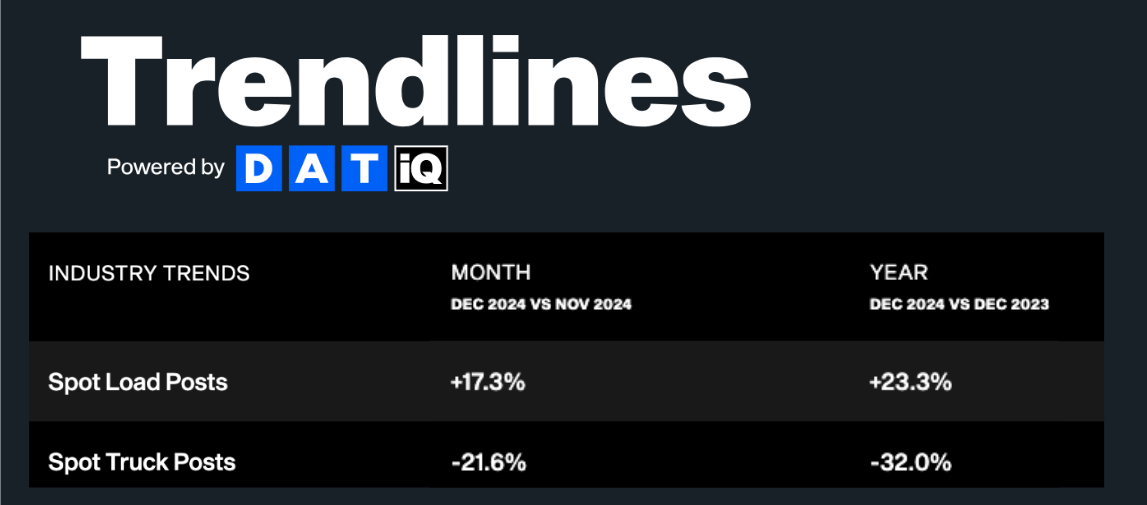 DAT Trendlines
The Cass Freight Index’s component is a good indicator of overall market health because it encompasses both spot and contract volume based on bill data. Volatility increased in December despite Cass data showing monthly and annual volume declines, which supports our view that capacity reductions are the root cause of market shakeups.
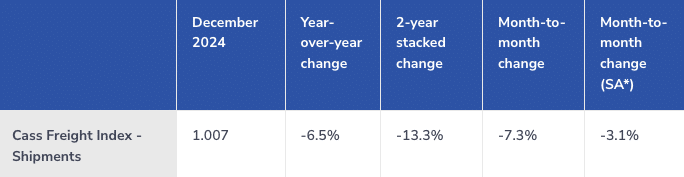 Cass Freight Index Report – December 2024
Data continues to indicate that the market has passed the bottom and is more vulnerable to disruption. As 2025 continues, stretches of seasonality and volatility will likely have a more pronounced market impact.
The Sonar Outbound Tender Reject Index (OTRI), which measures the rate at which carriers reject the freight they are contractually required to take, was up nearly 100% year-over-year around Christmas. As we forecasted last month, tender rejections surpassed 10% for the first time since April 2022 before falling to around 8% by year-end. Rejection rates remained relatively high in early 2025 as winter storms wreaked havoc in the Midwest and Southeast regions.
In the full history of the FreightWaves Sonar OTRI, the measure has only risen above 10% when a market disruption was in progress or conditions were primed for one with the right catalyst. For example, in 2019, rejection rates peaked at roughly 14% over Christmas week. A few months later, pandemic-related buying patterns sent the market into a sustained period of inflationary conditions. While that was an extraordinary black swan event and one unlikely to occur again in the next few months, it does highlight that OTRI volatility leading up to the 2020 disruption indicated market vulnerability.
 Outbound Tender Reject Index, SONAR
Dry van-specific tender rejections approached 9% around Christmas, fell below 8% by year-end, and spiked again in early January amid highly disruptive winter storms. Today, rejection rates are ahead of what they were around the 2024 summer peak and well above the highest level in 2023, confirming the market’s increasing vulnerability to disruption.
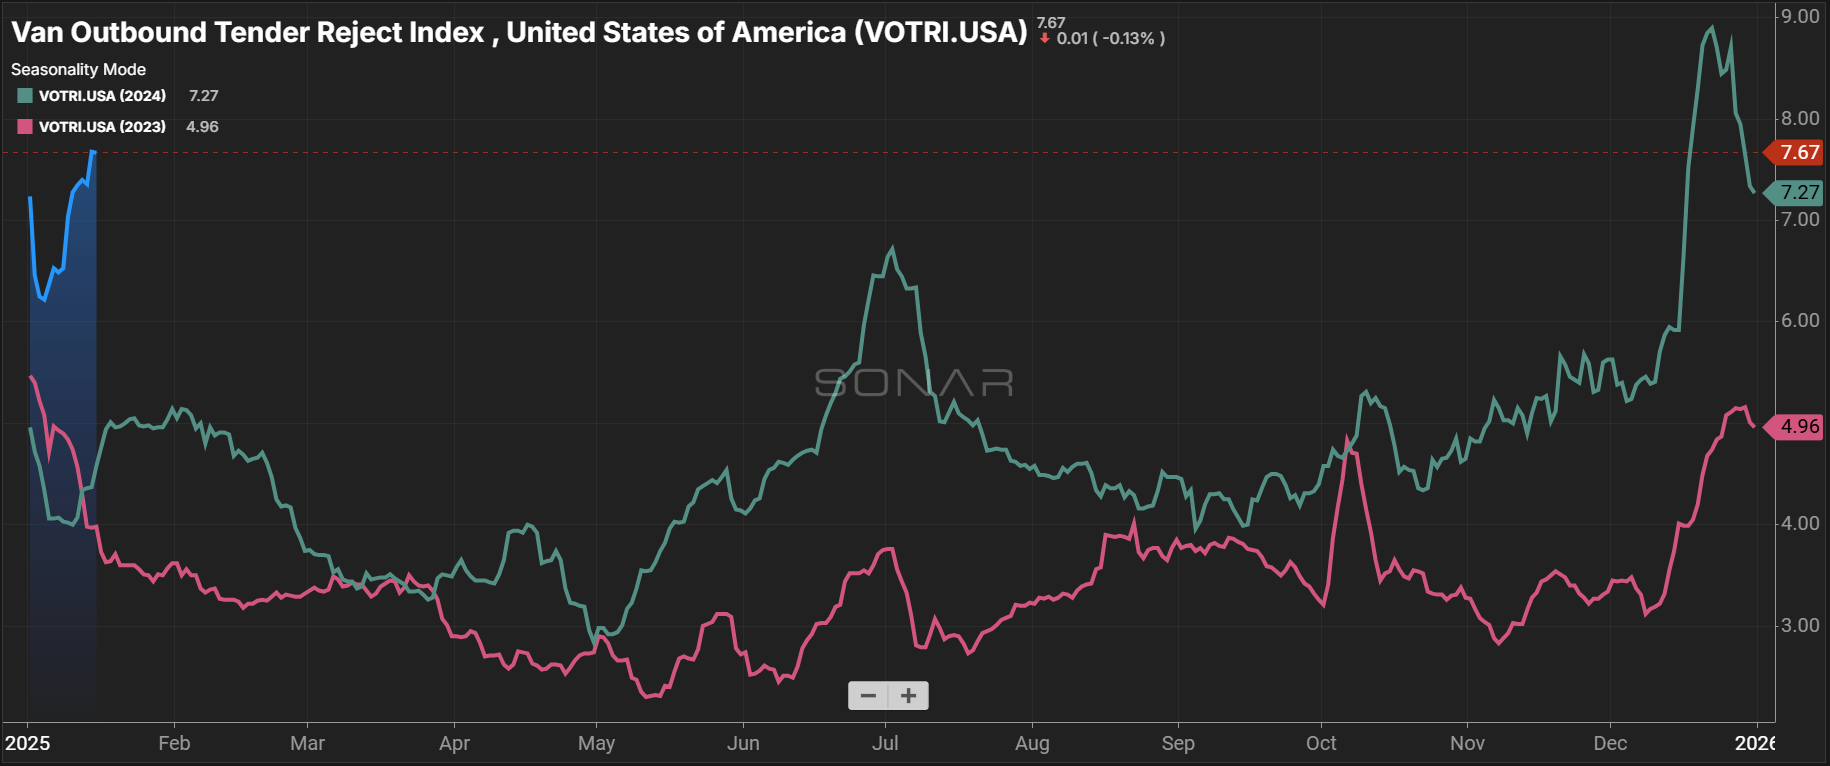 Dry Van Outbound Tender Reject Index, SONAR
Reefer rejection rates surpassed 20% for the first time in over two years around Christmas and remain above 18% amid the ongoing impact of winter storms. A similar trend emerged last year as consecutive winter storms drove reefer rejection rates above 10%. Given the forecast for additional rounds of very cold temperatures, reefer rejection rates could continue to create spot rate volatility for most of January before
likely declining later in Q1.
 Reefer Outbound Tender Reject Index, SONAR
The DAT Load-to-Truck Ratio (L/T) measures the total number of loads relative to the total number of trucks posted on its spot board. In December, the dry van ratio increased significantly month-over-month and was up 82% year-over-year, the highest level since February 2022. Though less pronounced than dry van, the reefer ratio was nearly 9, its highest point since February 2022. This data mirrors tender rejection trends and our overall market narrative.
 DAT Reefer Load-To-Truck Ratio
The Morgan Stanley Dry Van Freight Index is another measure of relative supply; the higher the index, the tighter the market conditions. The black line with triangle markers on the chart provides a great view of what directional trends would be in line with normal seasonality based on historical data dating back to 2007. The data deviated from the 10-year average toward the end of 2024; in fact, only 2021 ended the year with a higher reading, indicating market conditions are the tightest they’ve been since early 2022.

Morgan Stanley Dry Van Truckload Freight Index
 Morgan Stanley Reefer and Flatbed Truckload Freight Indexes
According to weekly spot market data provided by Truckstop, which we believe provides the best view of week-to-week seasonal volatility, both van and reefer rates followed trends similar to the 2023 peak holiday season. Reefer rates rose by nearly 15% in the span of three weeks to reach the highest mark since the last week of 2023. Dry van rates ticked up nearly 7% in the same time frame, hitting the highest weekly mark since late January 2024. Rates will likely remain elevated before declining around mid-January.
 Truckstop’s Weekly National Average Spot Rates
DAT data shows that all-in spot rates increased month-over-month across all three major modes. Dry van rates rose by $0.06 per mile, while reefer and flatbed rates rose by $0.03 per mile and $0.02 per mile, respectively. Rates are still elevated as of mid-January; line haul rates will likely decline later this month, but rising fuel costs could keep all-in rates flat.

DAT Monthly Rate Trends
National diesel prices continued ticking down through year-end, with the December average landing at $3.49 per gallon. Low fuel prices continue to benefit carriers navigating higher operating costs amid low revenues. The EIA’s fuel outlook remains favorable for carriers, calling for an average price of $3.61 per gallon in 2025, down from $3.78 per gallon in 2024.
DAT December dry van data provides further evidence of a strong 2024 holiday peak season. Spot rates reached $1.74 per mile, excluding fuel, the highest monthly average since January 2023. Rates were also up $0.09 per mile from December 2023. Notably, the spot-contract rate gap closed to $0.26/mile, the smallest spread since March 2022. The spot-contract rate gap has a strong inverse correlation to market vulnerability and shows the most sensitive conditions in two years.
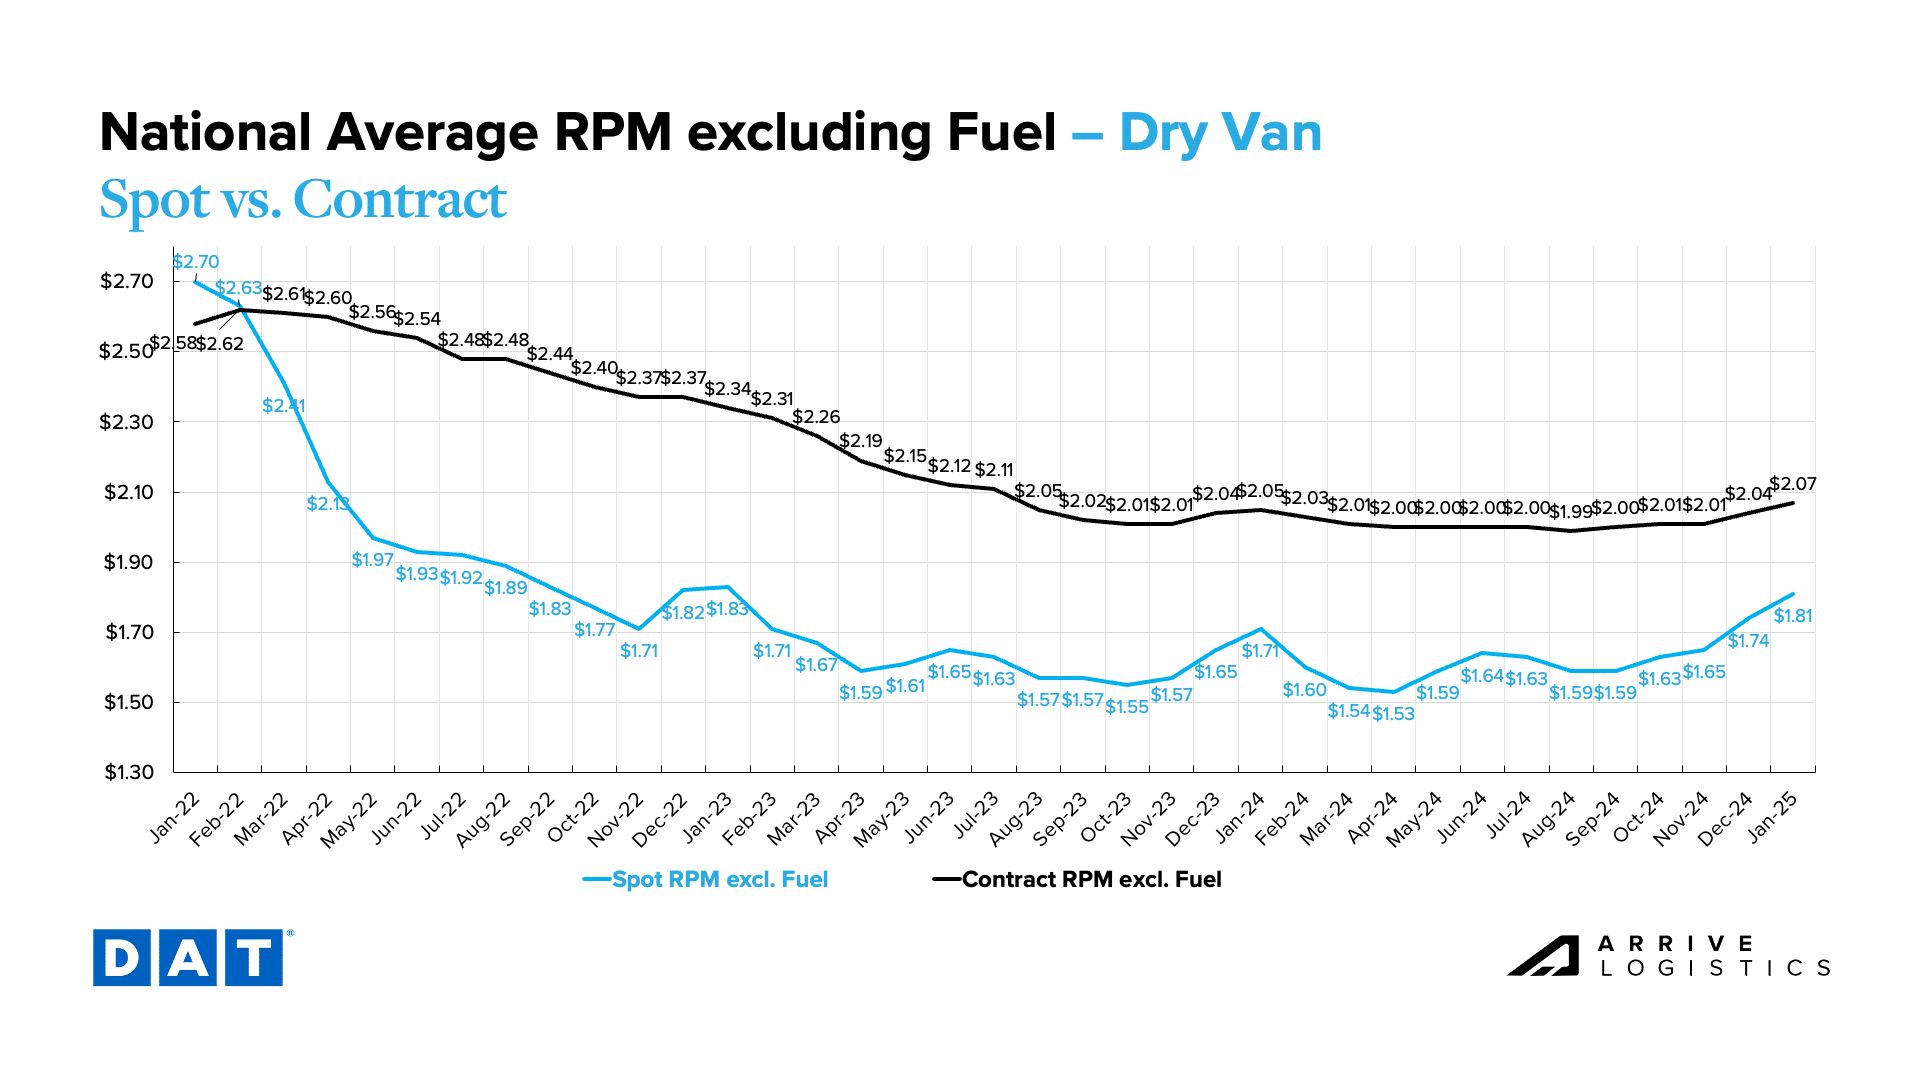 DAT Dry Van National Average RPM Spot vs. Contract
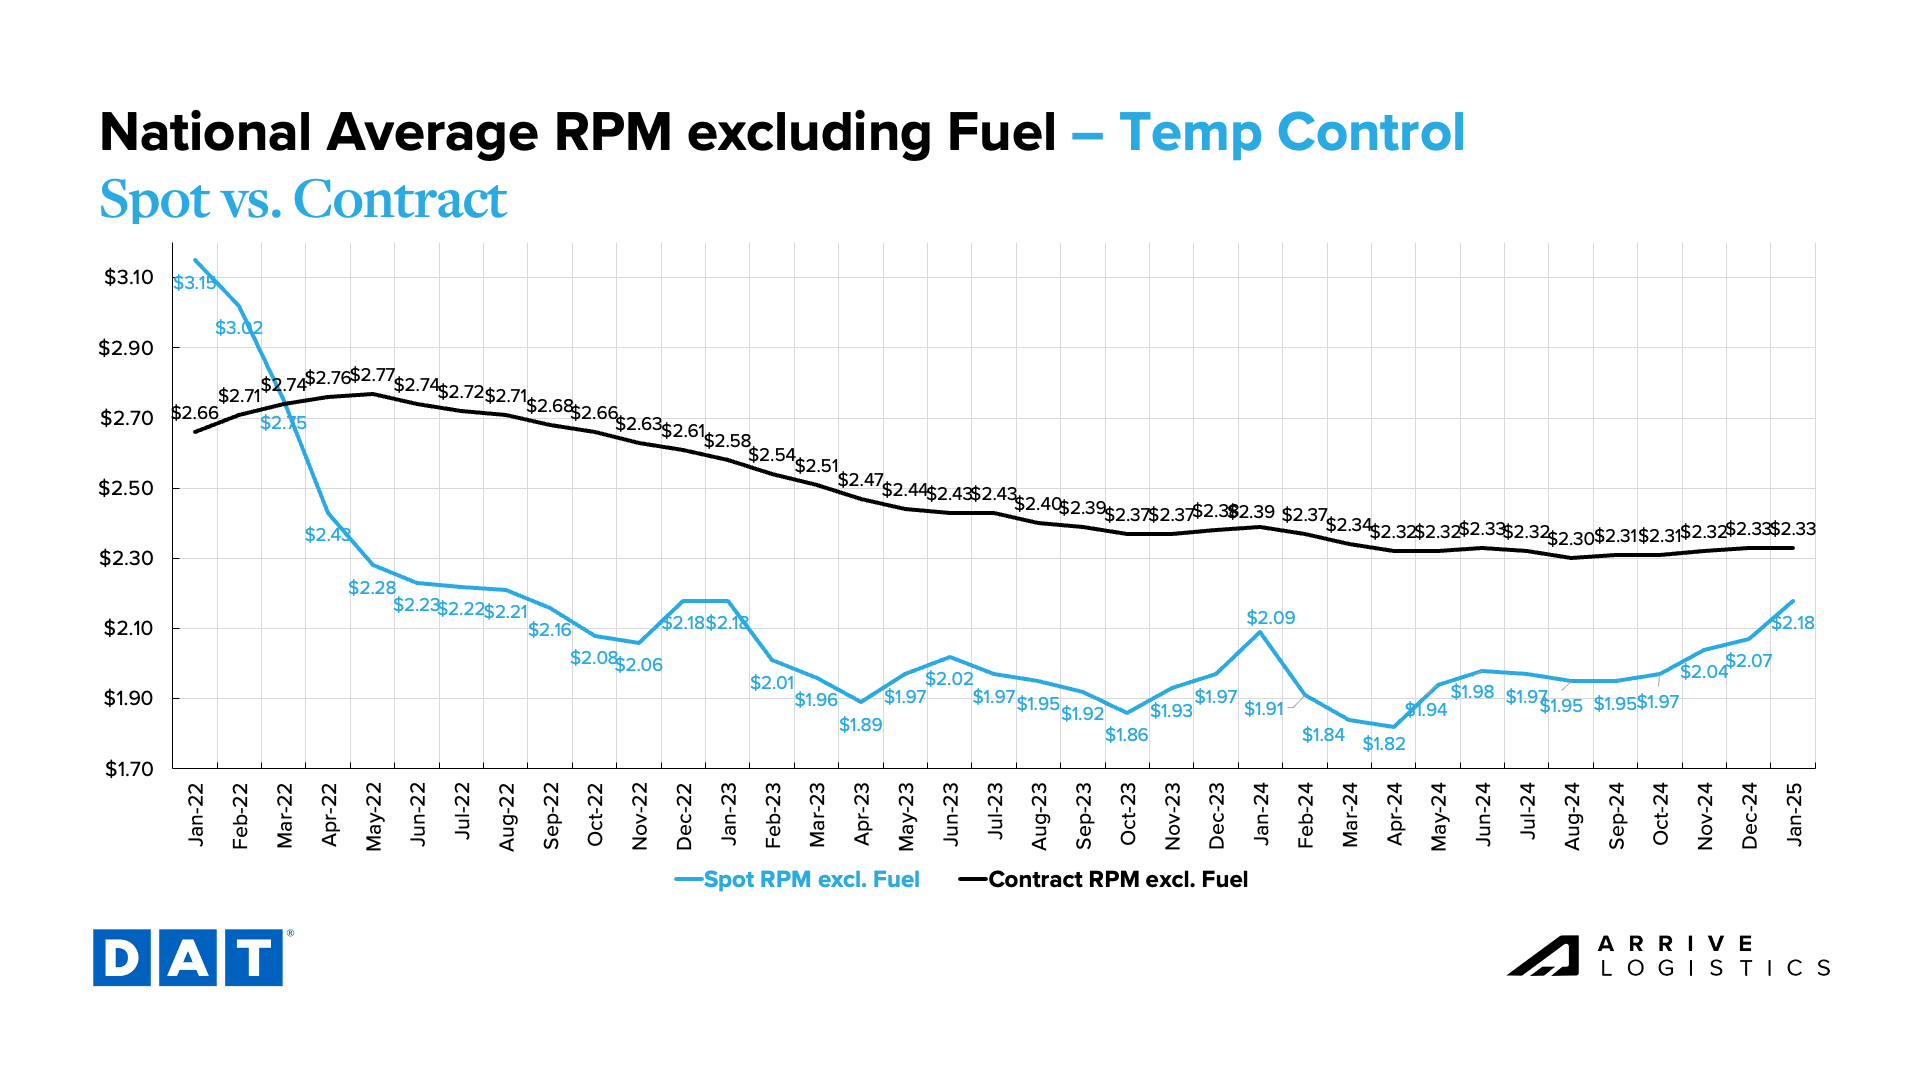
Reefer spot rates, excluding fuel, rose by $0.03 per mile from November to December, while contract rates, excluding fuel, increased by just $0.01 to $2.33 per mile. These trends closely reflect those of November and December 2023. This year, spot rates increased by $0.12 per mile from December to January, but the current rate of $2.18 per mile is higher than in 2024 and the same as in 2023. This year’s rate inflation likely resulted from winter storms Blair and Cora.
Flatbed spot and contract rates, excluding fuel, rose in December to $1.95 per mile and $2.60 per mile, respectively. Rates continue to rise in January, and the spread remains high at $0.63 per mile. Overall, the flatbed market continues to show more stability than dry van and reefer markets.
 DAT Temp Control National Average RPM Spot vs. Contract
There were over 1,800 carrier revocations last month, the most since early 2024. The resulting tightening is reflected in December tender rejection and load-to-truck ratio data. As the carrier pool continues to shrink, spot capacity will decline and vulnerability to disruption from a sudden spot demand shock will increase.
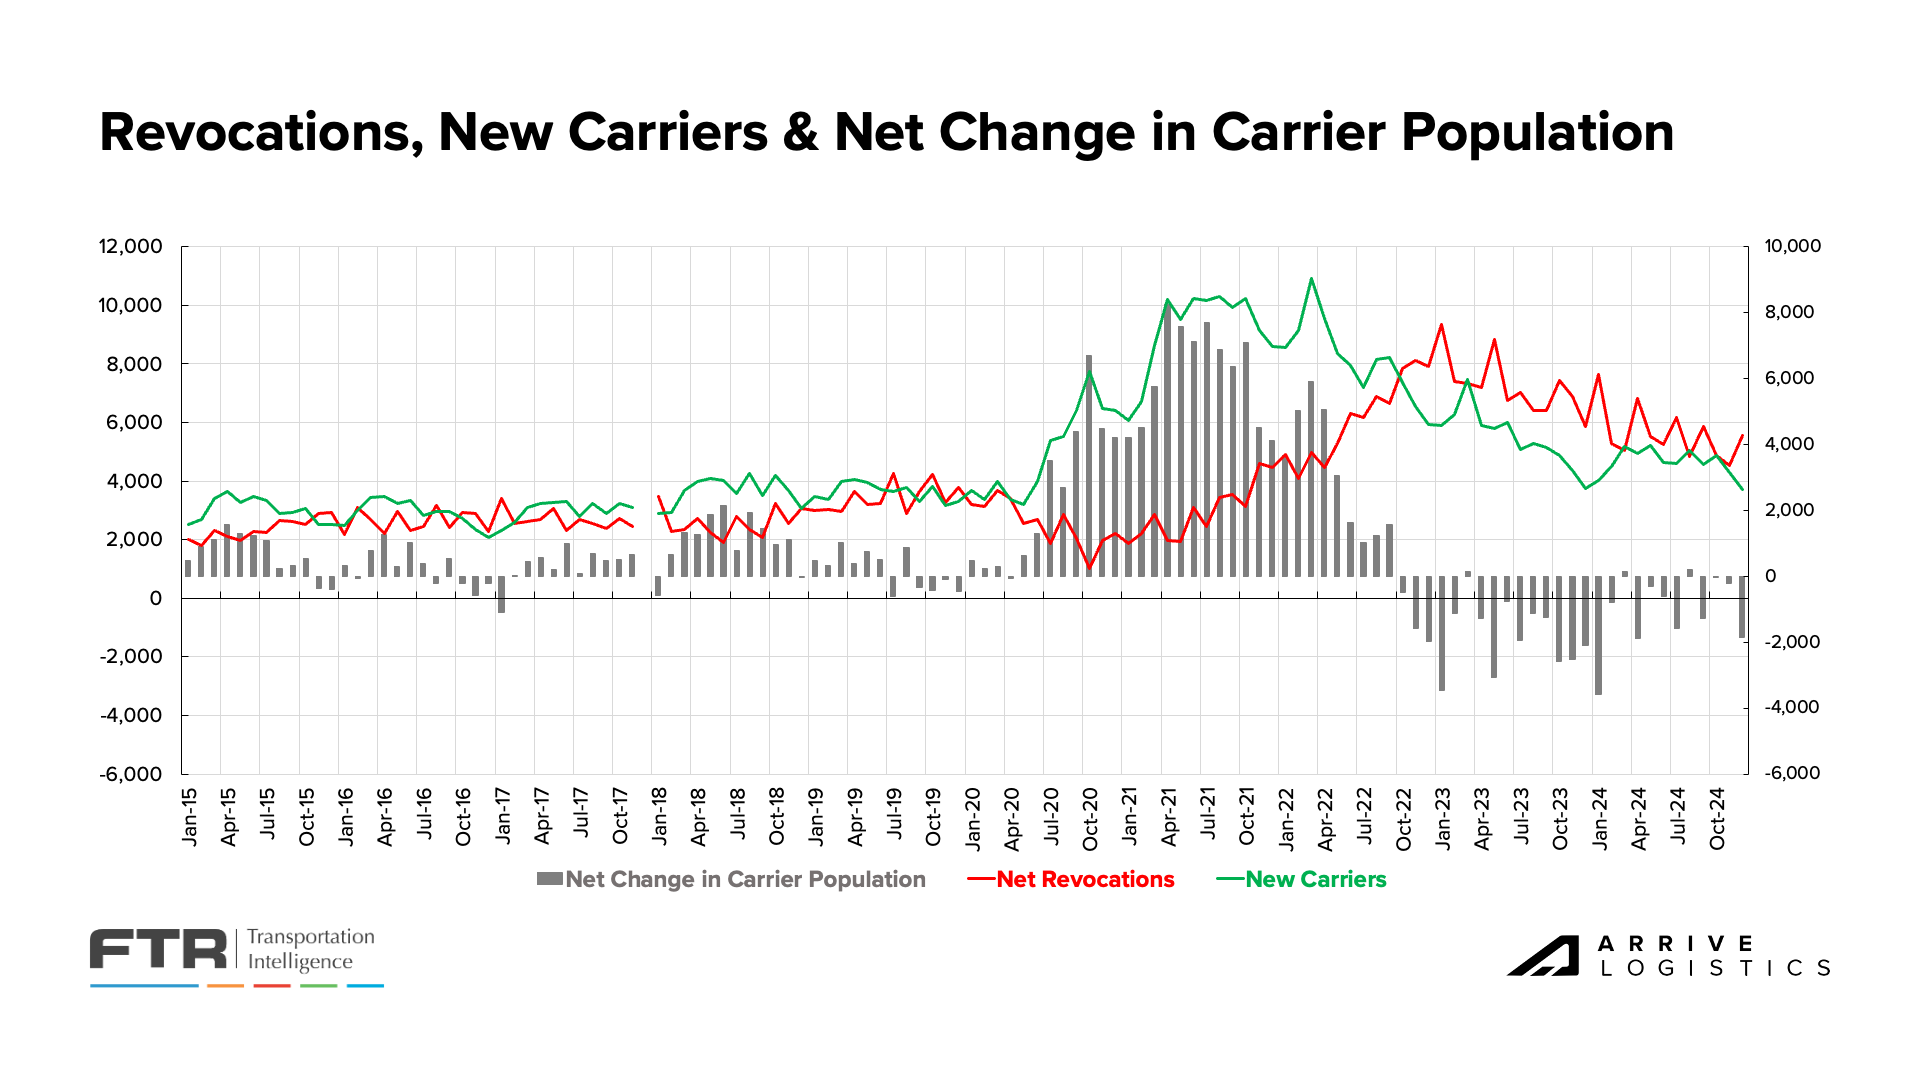 Carrier Revocations, New Carriers & Net Change in Carrier Population, FTR
According to ACT’s Driver Availability Index, the driver market remains sufficient to service demand. The most recent reading of 52.8 in November marked the 30th consecutive month that driver availability eased.

For Hire Driver Availability Index, ACT Research
The December trucking jobs report showed a seasonally adjusted decline of 800 jobs, and downward revisions for October and November resulted in 800 and 2,000 fewer jobs, respectively. Total employment has fallen by only 500 over the past four months, suggesting relative stability, but jobs were down 5,900 year-over-year in December and 42,000 below the peak in July 2022.
Factoring that stability into the significant year-over-year drop reflects how the rate environment has leveled out over the past year and started shifting toward inflation. A stable operating environment for carriers typically supports employment stability, a positive sign for trucking companies if current conditions hold or improve.
Looking ahead, while demand uncertainty remains, overall market conditions are expected to stay relatively steady. Carriers have recently focused on maximizing asset utilization and operational efficiency. Should rates rise significantly later in the year, that focus may shift toward expansion, potentially driving job growth. However, meaningful gains may not materialize until mid-year or beyond, suggesting the most severe job losses are likely behind us in this market cycle.
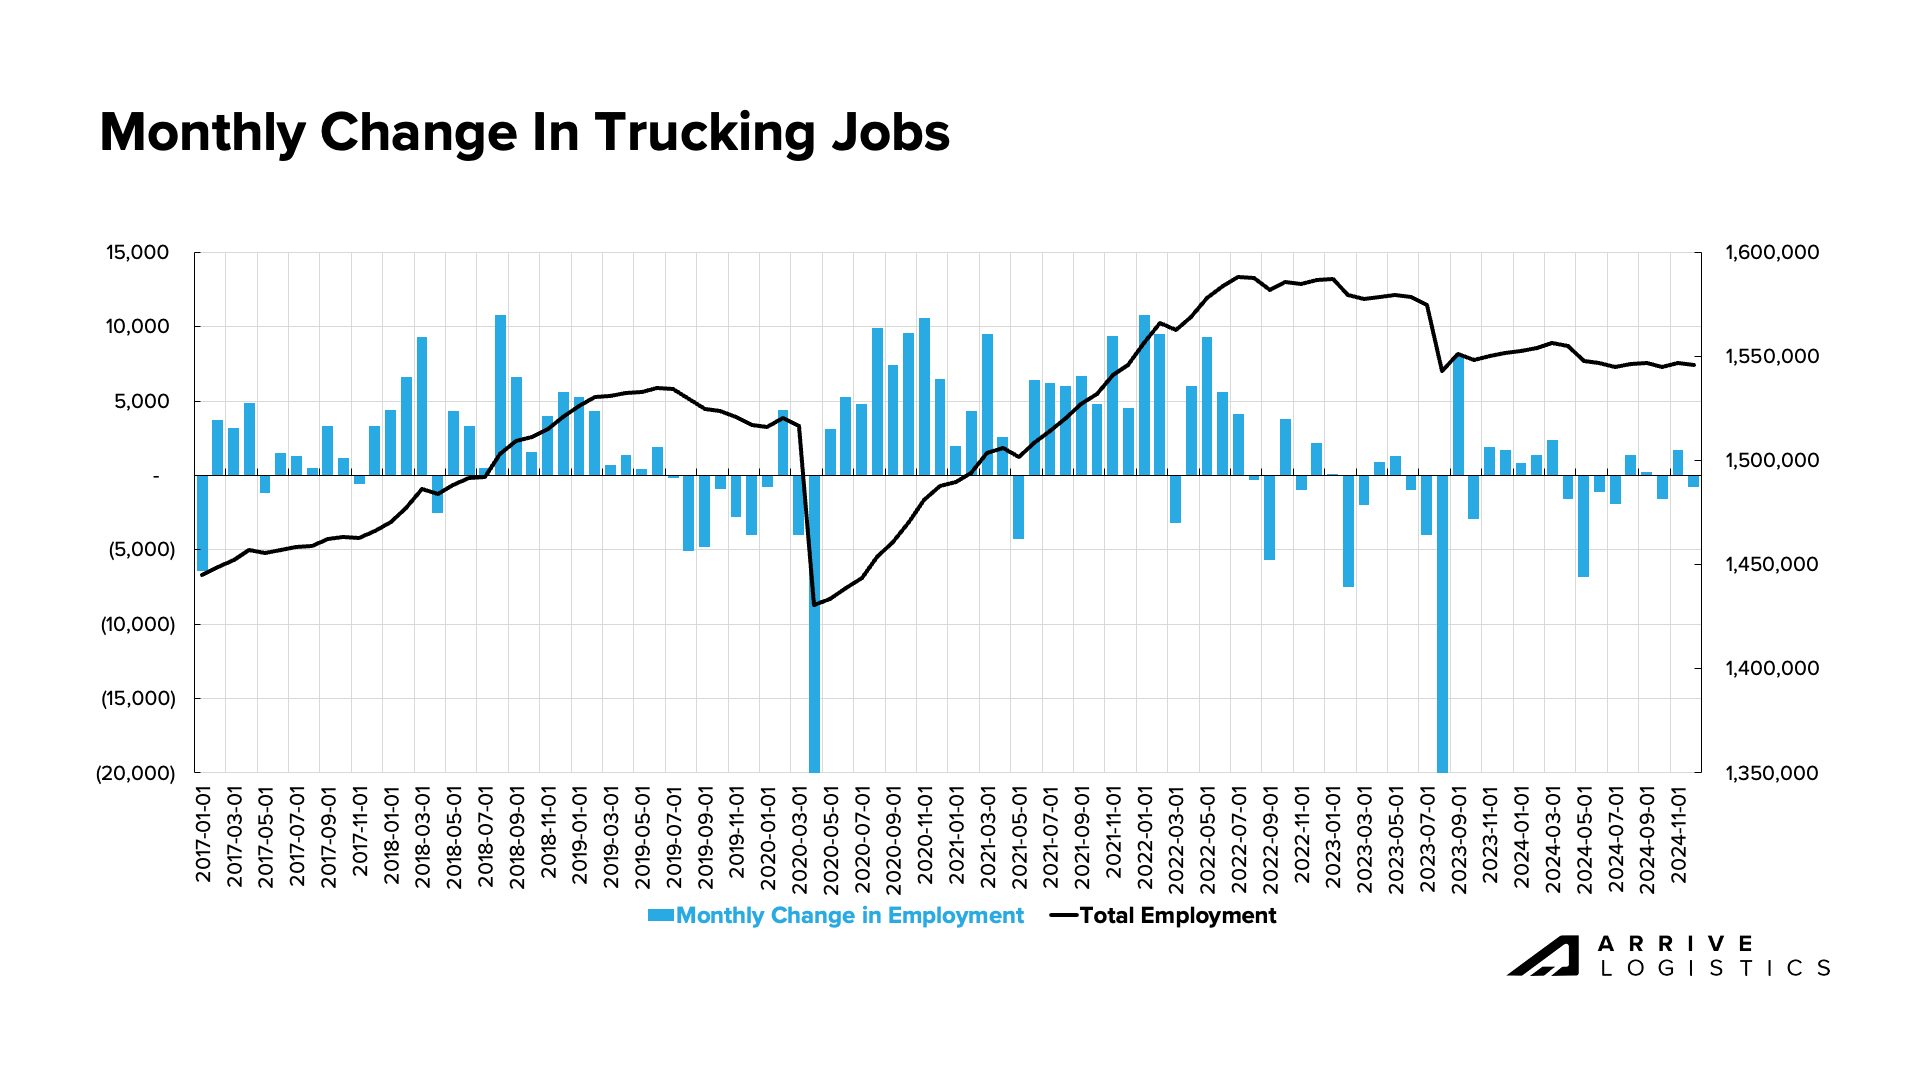 Monthly Change in Trucking Jobs, FRED Economic Data
FTR’s latest truck utilization forecast remains relatively unchanged. Current utilization is almost above the 10-year average of 92% and should continue to improve gradually through 2025 and into 2026. Equipment utilization improvement is a sign that fleet networks are tightening, and as that number approaches 100%, the risk of sustained disruption increases.
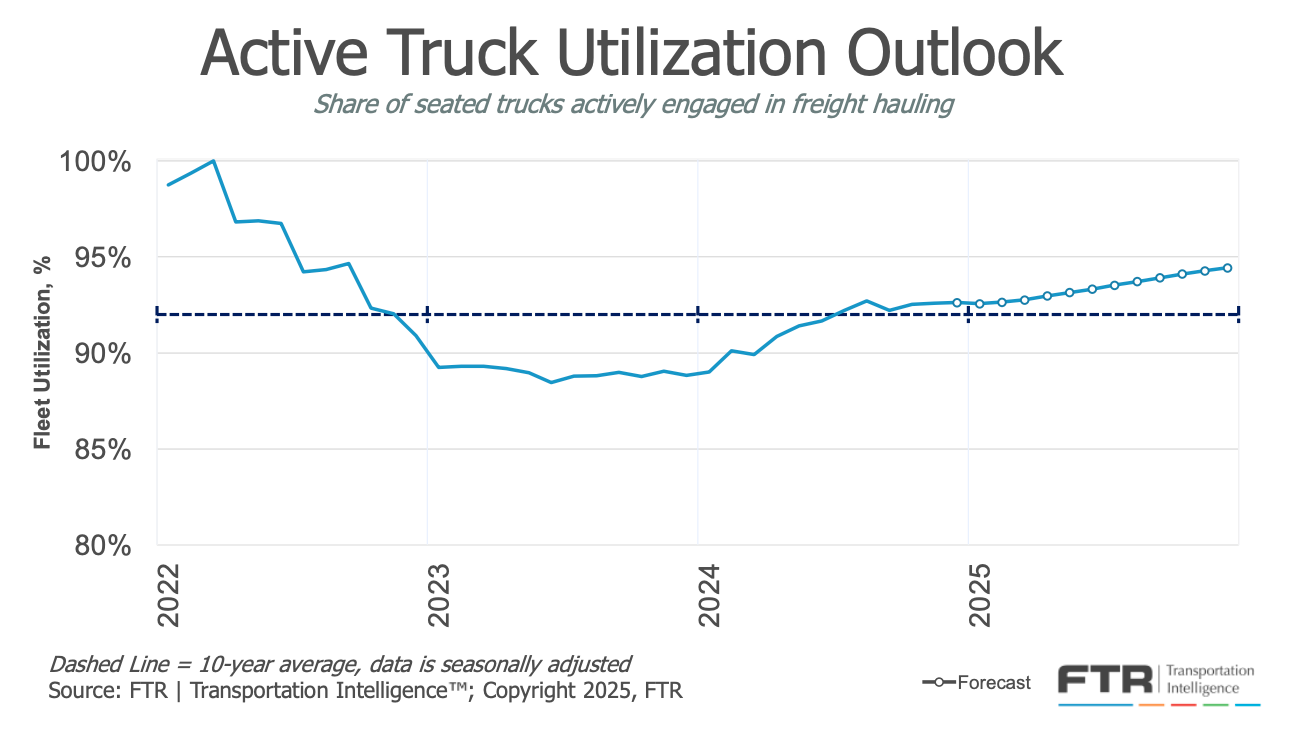 Active Truck Utilization, FTR
With the holiday season behind us, demand volatility will likely settle over the next few months. While there remains uncertainty about how potential tariffs may impact the freight market, averting the port strike alleviated some concerns heading into the new year. With that said, our outlook still calls for flat to slow demand growth in 2025.
While ports have yet to release final December import numbers, the National Retail Federation estimated that 2.24 million TEUs hit shore, up over 19% from December 2023. If these numbers hold, 25.6 million TEUs would have been imported in 2024, up 15.2% year-over-year. The current NRF forecast calls for 2.16 million TEUs this month, which would be a 10% increase from January 2024.
The potential for East and Gulf Coast port strikes likely spurred a pull-forward event that increased import volumes toward the end of 2024. The impact on import volumes in early 2025 remains to be seen, but so far, the NRF projects that only February will see a year-over-year import decline in the first five months of the year.
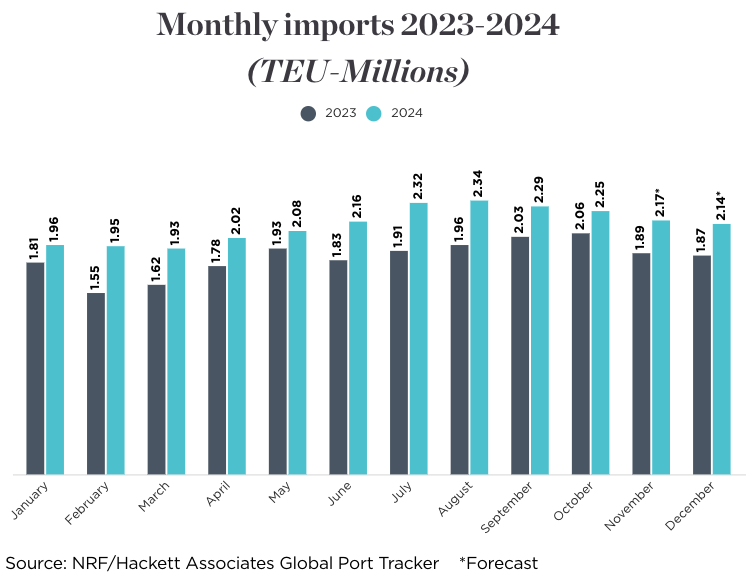 NRF Monthly Imports
Recent Descartes data shows that imports increased slightly month-over-month in December and ended the year with over 14% more imports compared to December 2023. The end-of-year data shows December import volumes aligned with both December 2020 and December 2021. Q1 tends to typically be a slower time for imports, and the aversion of the port strike increases the chance that import volumes will decline in the coming months.
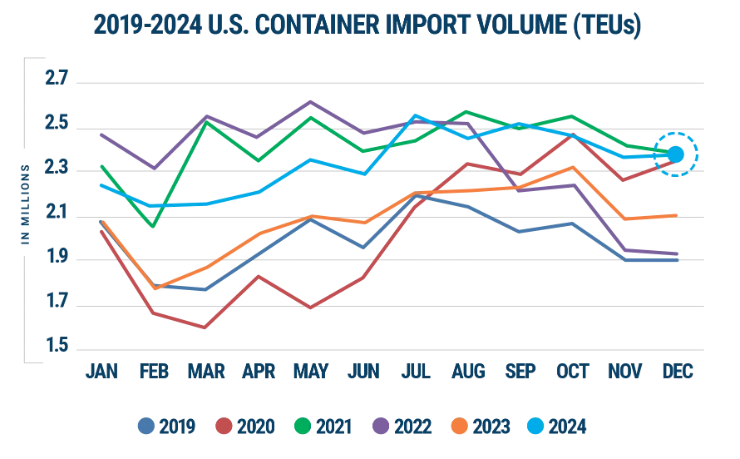 U.S. Container Import Volume 2019-2024, Descartes December 2024 Global Shipping Report
 U.S. Container Import Volume Share Comparison, Descartes
The manufacturing sector continues to contract, with the index sitting below 50 in 25 of the past 26 months, including the last nine. The December reading increased by 0.9 percentage points month-over-month to 49.3. The ISM notes that a reading above 42.5 indicates economic expansion, and November marked the 56th consecutive month with a reading above that threshold. If interest rates continue to decline and spending increases, manufacturing demand could grow and potentially drive the index above 50 in 2025.
 Manufacturing at a Glance, December 2024 Manufacturing ISM Report on Business
Economic trends in freight-related industries remain volatile. Industrial production and manufacturing both declined while unemployment remained low. Retail activity grew for the second consecutive month and mortgage rates rebounded. With interest rate cuts likely to be put on pause in the near future, it is unclear how much the manufacturing and housing sectors will boost freight demand in the first half of 2025 and beyond.
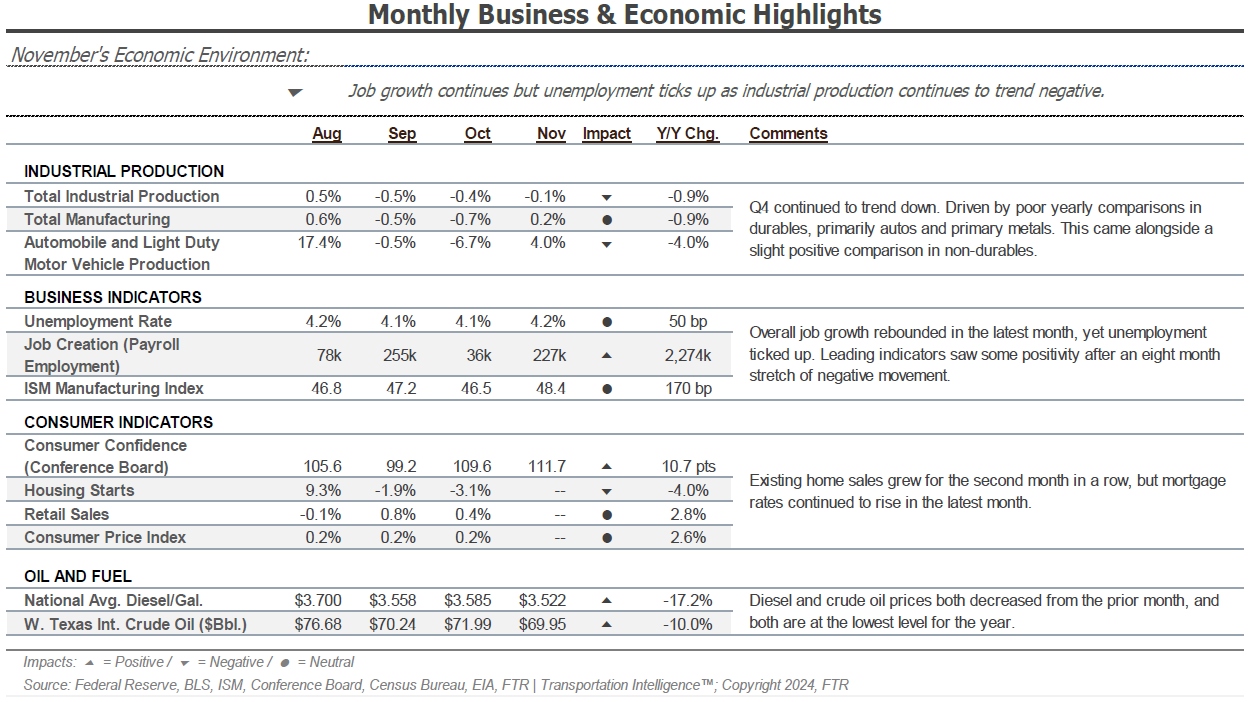 Monthly Business & Economic Highlights, FTR
FTR made a slight downward revision to its 2024 truck loading summary, dropping it 0.1 basis points to 0.2%. This was primarily driven by a small downward revision to both dry van and refrigerated volumes. The 2025 truck loadings forecast showed a much more meaningful downward revision, with the forecasted growth rate now expected to be 1.1%, down from 1.7% last month. All modes apart from flatbed received meaningful downward revisions to their 2025 forecasts.
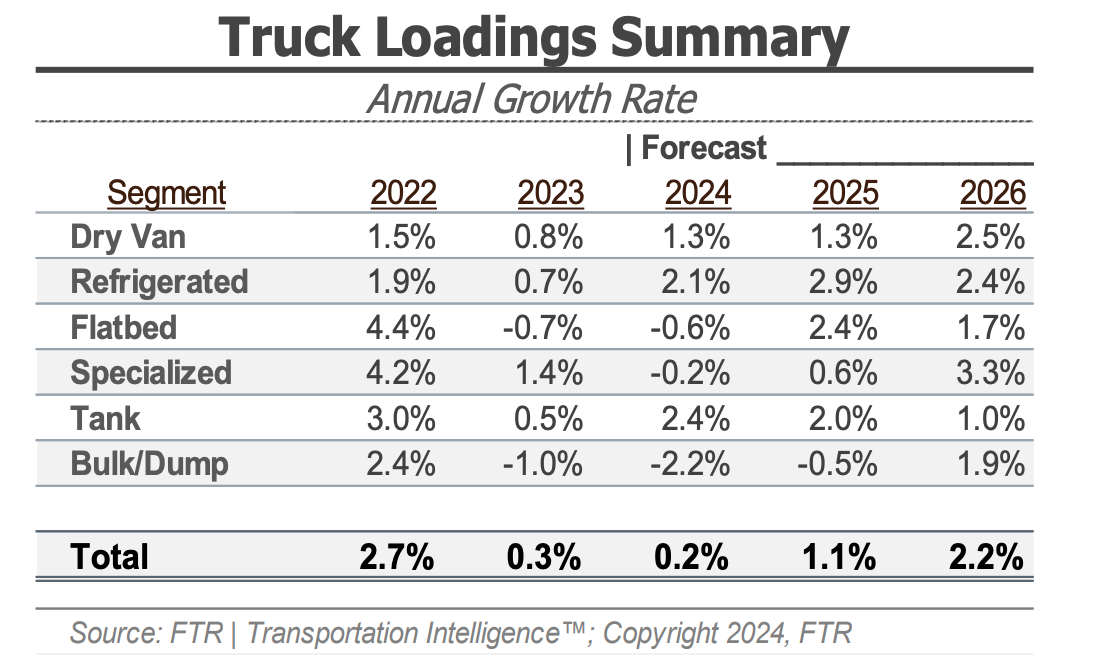 Truck Loadings Summary, FTR
Inflation ticked back up in December, rising to 2.9% and remaining above the Federal Reserve’s target rate of 2%. As a result, it increases the possibility that we will see additional interest rate cuts in the first half of 2025, however the strong jobs data released earlier this month seems to indicate a higher for longer interest rate environment, likely providing no meaningful benefit to freight demand throughout 2025.
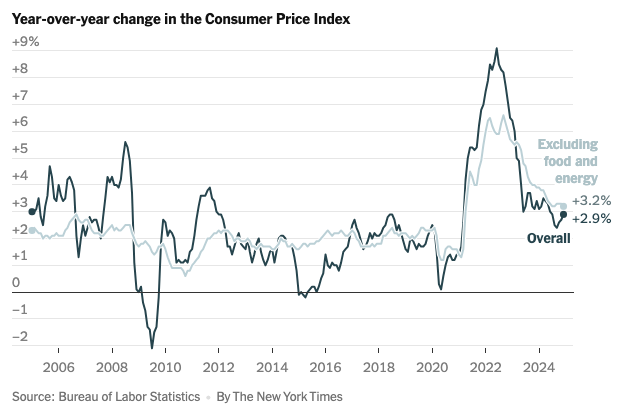 Consumer Price Index, New York Times
Recent Bank of America credit card data shows that spending per household increased by 2.2% year-over-year in December and was up 0.7% from November. While these numbers bode well for the overall economy, the impact on the freight market will likely be muted as service spending continues to rise faster than retail.
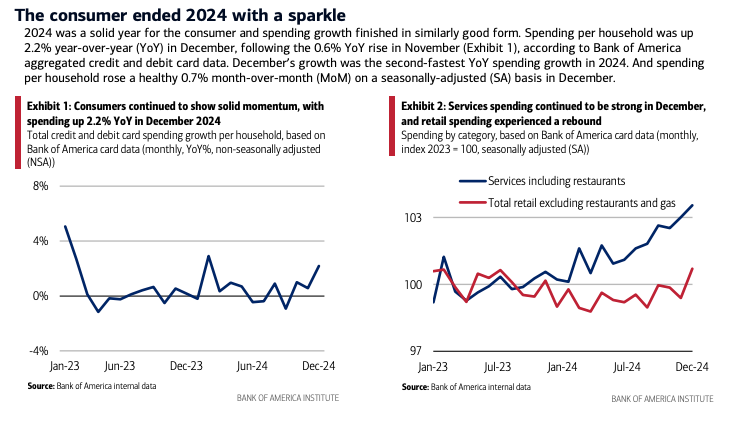 Bank of America Total Card Spending, Bank of America Consumer Checkpoints
Unemployment remains relatively stable at 4.1%, indicating a strong labor market that should encourage healthy consumer spending, which in turn drives stable freight demand.
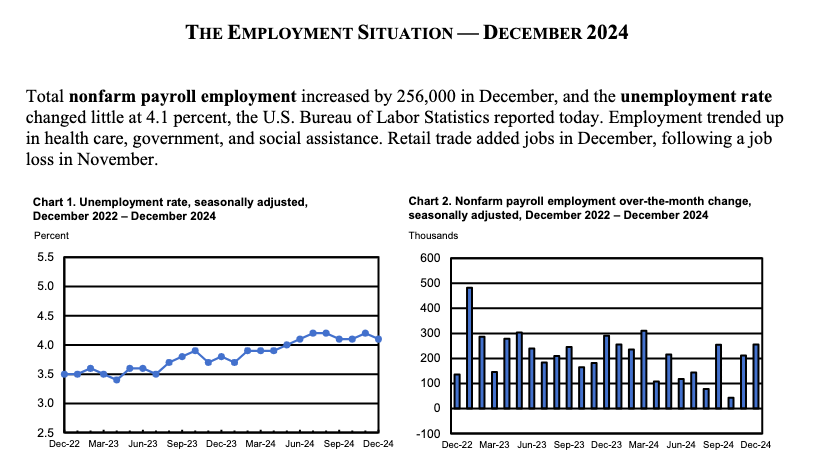 Employment Situation – December 2024, U.S. Bureau of Labor Statistics


