


Freight volumes remained healthy in August, increasing nominally on a seasonally adjusted basis across major indices.
DAT reports exclusively on spot trends and noted that August spot load posts were up 12.5% compared to July after falling in each of the previous two months. The annual comps still showed a year-over-year decline, but spot load posts improved from -54% in June and -50.3% in July to -41.4% in August.
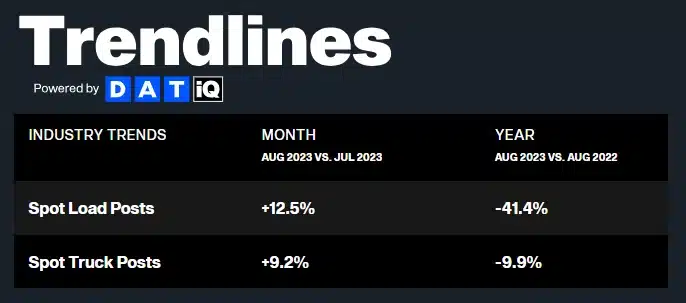 Figure 1: DAT Trendlines
Cass reported a 1.9% decrease in August shipments, translating to a 0.8% month-over-month increase on a seasonally adjusted basis. However, the index is down 10.6% year-over-year, which is a step in the wrong direction from 8.9% in July and a significant jump from the 4.7% year-over-year decline in June. Cass noted this trend appears especially significant given the extraordinary destocking last summer, which created freight demand as retailers shipped out stale inventory.
Interestingly, Cass also believes meaningful private fleet capacity growth accounts for a substantial decline in volume because these fleets insource freight from the for-hire market. This trend appears significant and could have far-reaching implications for future market conditions.
 Figure 2: Cass Freight Index
Like Cass, the ATA reported August volumes increased 0.2% on a seasonally adjusted basis and 6.3% on a non-seasonally adjusted basis from July. On a year-over-year basis, the index showed a negative growth increase from July, similar to Cass. The seasonally adjusted index was down 2.3% in August, compared to just 1.2% in July.
It’s safe to assume the same factors influenced the ATA report as the Cass report. ATA Chief Economist Bob Costello noted, “The evidence is growing that tonnage hit bottom in April and continues its slow climb upwards… Year-over-year comparisons remain difficult as tonnage peaked in September of last year, and as a result, it is unlikely that tonnage turns positive for at least a month or two longer.”
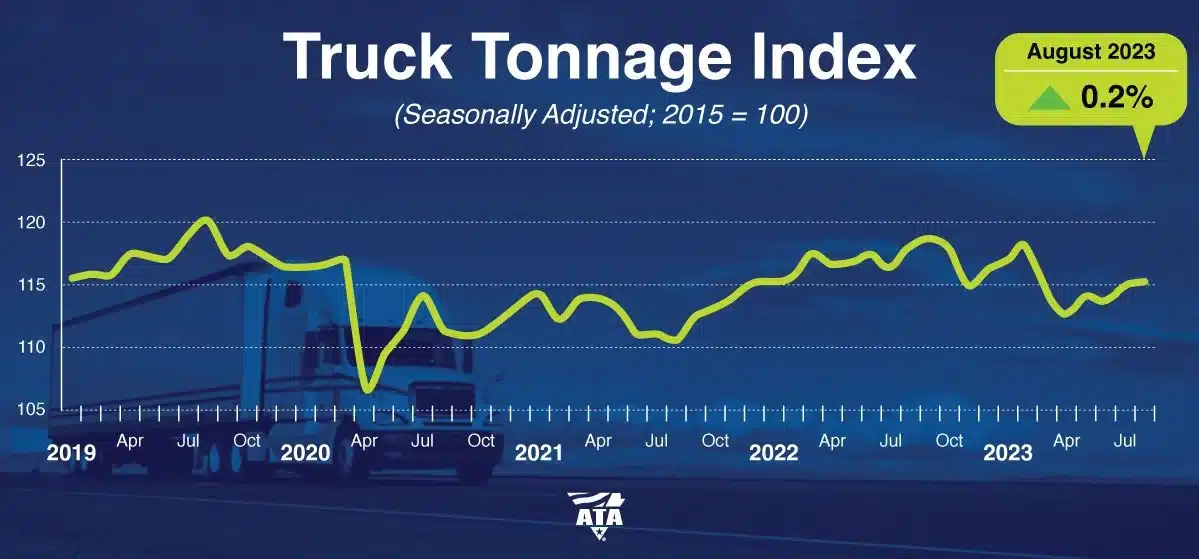 Figure 3: ATA Truck Tonnage Index
The FreightWaves SONAR Outbound Tender Volume Index (OTVI), which measures contract tender volumes across all modes, was down 6.7% year-over-year, or 5.5% when measuring accepted volumes after the significant tender rejection rate decline.
Accepted volumes were up 0.8% month-over-month, driven by a 0.2% increase in accepted dry van tenders and a 9.7% increase in accepted reefer tenders. The overall increase is largely in line with the Cass and ATA reports and directionally with DAT spot trends. Consistency across all indices enables greater confidence that the data shows an improving demand environment.
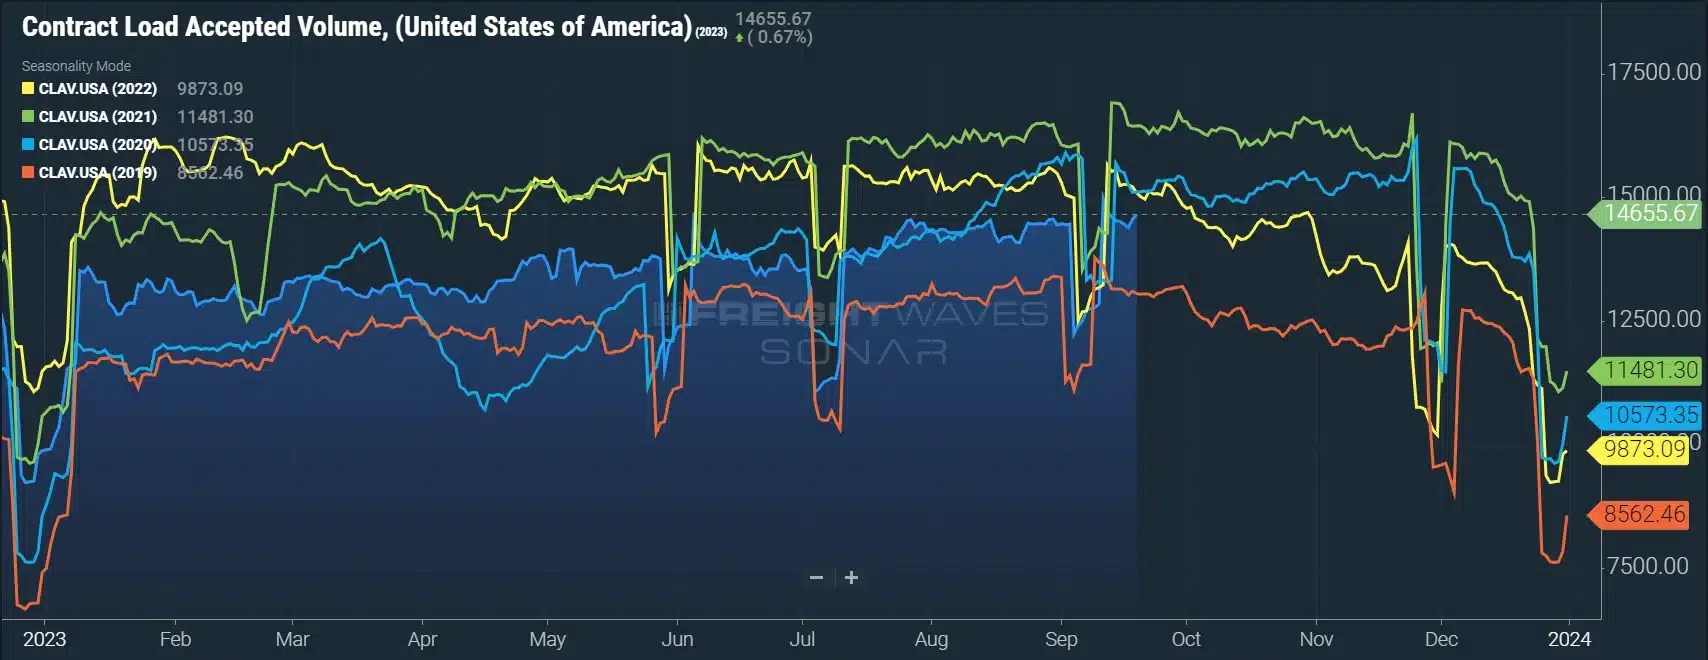 Figure 4: Contract Load Accepted Volume, SONAR: Accepted contract volumes were down 6% y/y in early August but remained above historical pre-pandemic levels.
Contrary to the reefer tender volume trends reported by FreightWaves, USDA truck shipment data for fresh fruits and vegetables showed pullbacks in total truck shipments and the year-over-year growth rate from a month ago. In mid-August, the three-week trend showed total shipments were down 1% year-over-year, with both U.S.-grown and imported crop shipments down 1%. In mid-September, the three-week trend shows total shipments are down 3% year-over-year, with U.S.-grown shipments down 5% and imports flat.
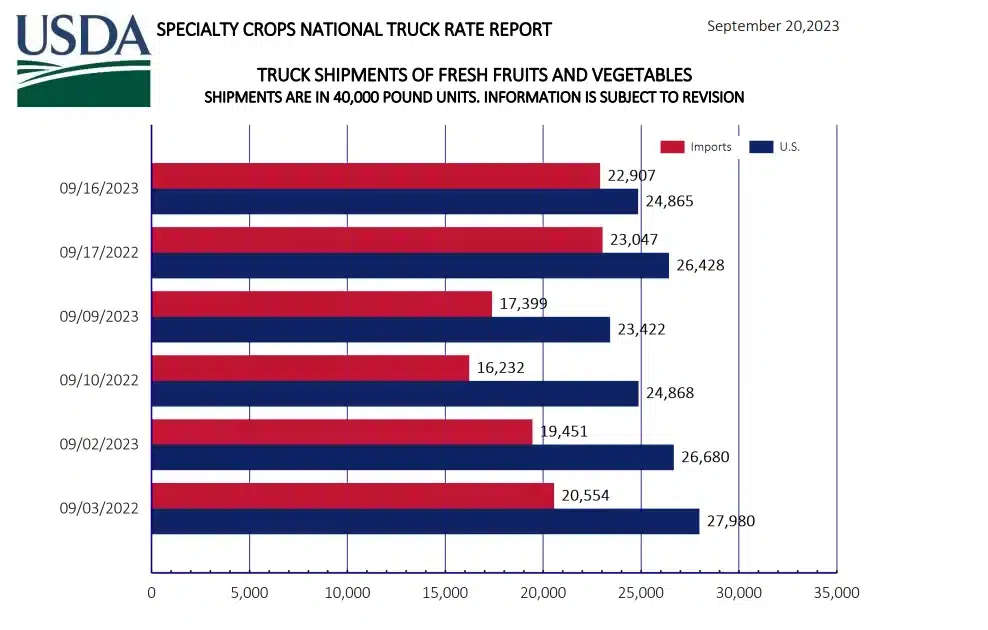 Figure 5: USDA Specialty Crops National Truck Rate Report
Summer peak season illustrated normal historical market tightness. Demand surges caused regional pockets of rate volatility, signaling that the market was generally becoming more balanced, so volatility associated with seasonal demand surges and disruptive events should continue. The supply and demand rebalancing seems to be further along for refrigerated equipment than for van, so reefer rate swings have been and may continue to be more volatile.
As expected, August van rates were volatile in certain pockets and regions, but it had little impact on tender acceptance and service for shippers at the national level. This trend demonstrates where we stand in the capacity correction cycle — conditions remain oversupplied, and further correction is needed before the market becomes vulnerable to sustained disruption.
The Sonar Outbound Tender Reject Index (OTRI) measures the rate at which carriers reject the freight they are contractually required to take. The numbers fluctuated between an early-month low of 3.3% and 4.39% by month-end, indicating routing guide compliance on shippers’ contractual freight remained historically high.
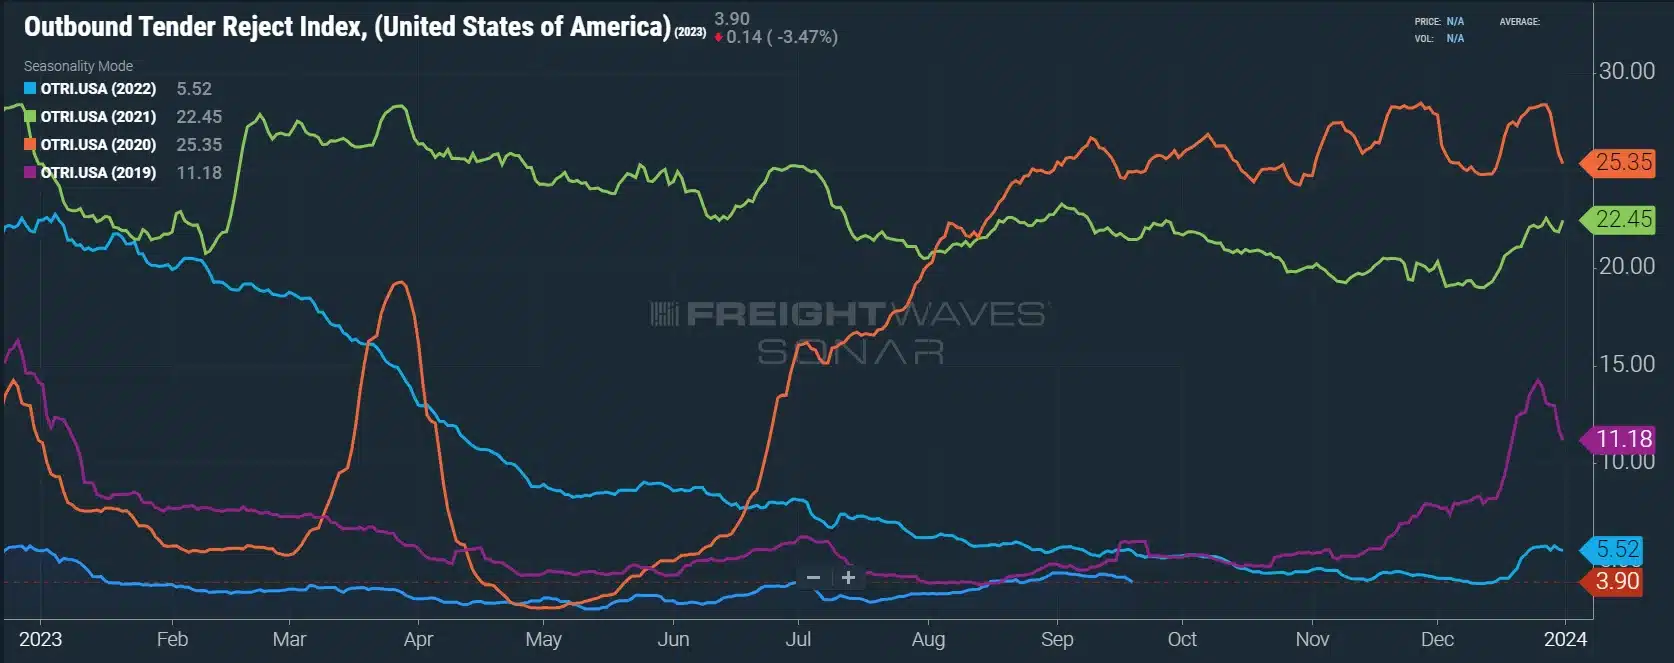 Figure 6: Outbound Tender Reject Index, SONAR: OTRI remains below 4% and 2019 levels — a sign capacity is still sufficient to support demand and carriers are protecting their contract freight despite increases in spot.
The year’s most significant disruptive event was Hurricane Idalia hitting Florida’s Gulf Coast the week before Labor Day. Although it affected conditions in the Southeast for a few weeks, the nationwide rejection rates for van rates only increased slightly.
For reefer equipment, however, it was a different story. Tender rejections jumped to nearly 11% for the first time in almost 18 months, a sign that the market is much more balanced and susceptible to disruption. However, despite the significant national average increase, localized rejection rates as high as 30%-40% in certain regions were driving the impact.
Regional tightness is moving from the Southeast and Northern Midwest as the produce season shifts to the Pacific Northwest. We agree with those forecasting a muted peak season as Q4 begins; however, the reefer environment could become challenging as we approach Thanksgiving and Christmas.
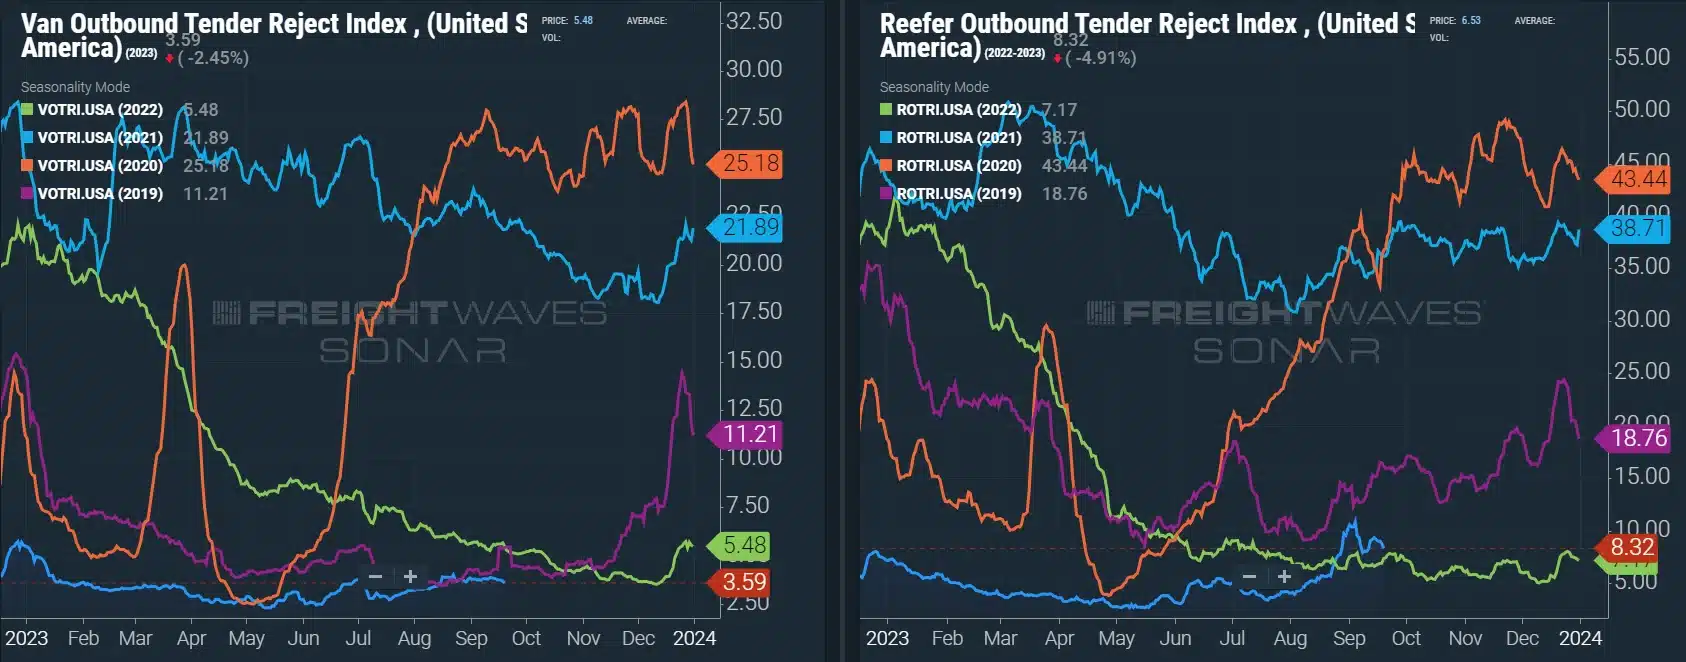 Figures 7 & 8: Van and Reefer Outbound Tender Reject Indices, SONAR: Dry van rejections have recovered from an early month shakeup, but reefer tender rejections are trending higher, a sign that the market is becoming more vulnerable for the equipment type.
The DAT Load-to-Truck Ratio measures the total number of loads relative to the total number of trucks posted on their spot board. August data showed relatively flat conditions despite a meaningful spot load increase, indicating truck posts were also up.
The Dry Van Load-to-Truck Ratio was up 7.2% month-over-month but remains down 20% year-over-year, whereas the Reefer Load-to-Truck Ratio was up 14.5% month-over-month but down 37.8% year-over-year.
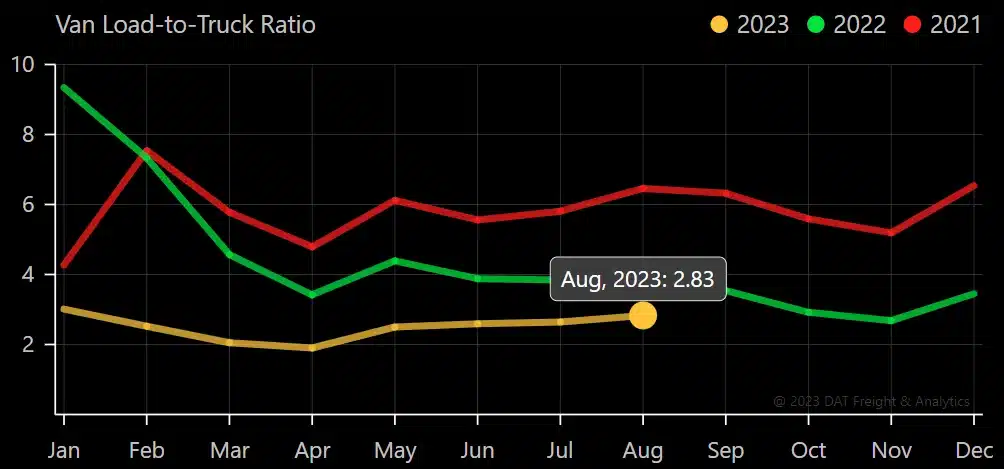 Figure 9: DAT Van Load-To-Truck Ratio
 Figure 10: DAT Reefer Load-To-Truck Ratio
The Morgan Stanley Dry Van Freight Index is another measure of relative supply; the higher the index, the tighter the market conditions. The black line with triangle markers on the chart provides a great view of what directional trends would be in line with normal seasonality based on historical data dating back to 2007.
As expected, conditions tightened slightly before Labor Day. Hurricane Idalia also drove tightness, but all things considered, the index barely increased, indicating supply is still largely sufficient to support demand. Historical data points to potential tightening through the end of Q3 before easing early in Q4.
 Figure 11: Morgan Stanley Dry Van Truckload Freight Index
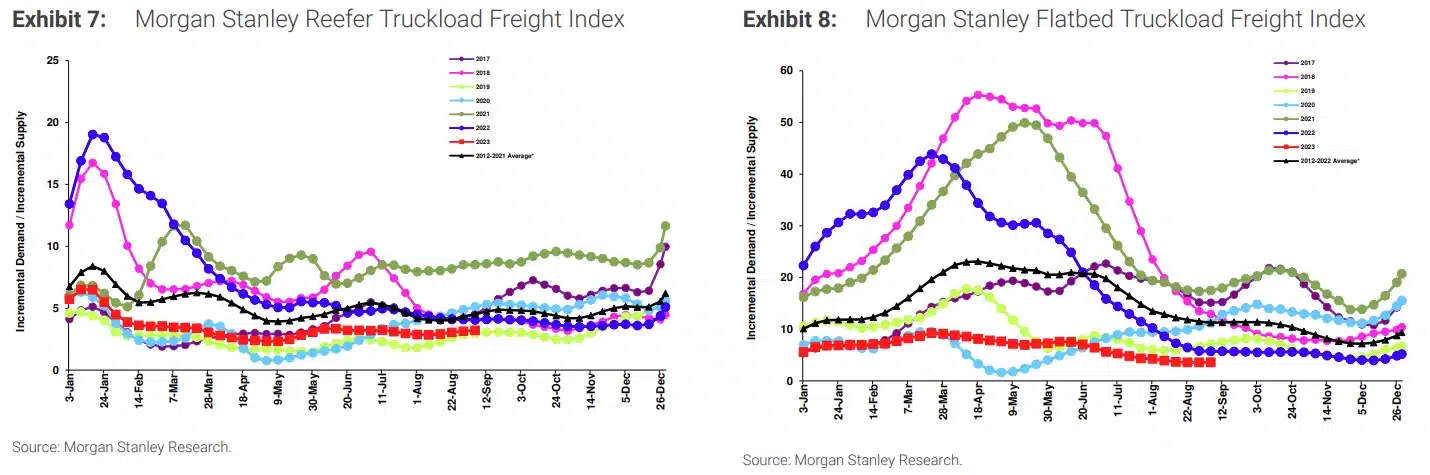 Figures 12 & 13: Morgan Stanley Reefer and Flatbed Truckload Freight Indices
Truckstop’s Weekly National Average Spot Rates provide a detailed view of week-to-week rate movements and a real-time look into the current rate environment.
Following tender rejection trends, Hurricane Idalia caused rates to pick up in late August and early September. The impact was more pronounced for reefer equipment due to concurrent produce seasons in the Upper Midwest and Pacific Northwest. Flatbed rates, however, continue to trend down.
After picking up at the onset of the summer peak season, van and reefer rates have fluctuated with seasonal pressures but have not regressed to April lows. Steady demand improvements and the ongoing capacity correction are helping to solidify the spot rate floor. Van and reefer rates have bottomed out and are more likely to experience seasonal upticks than further declines.
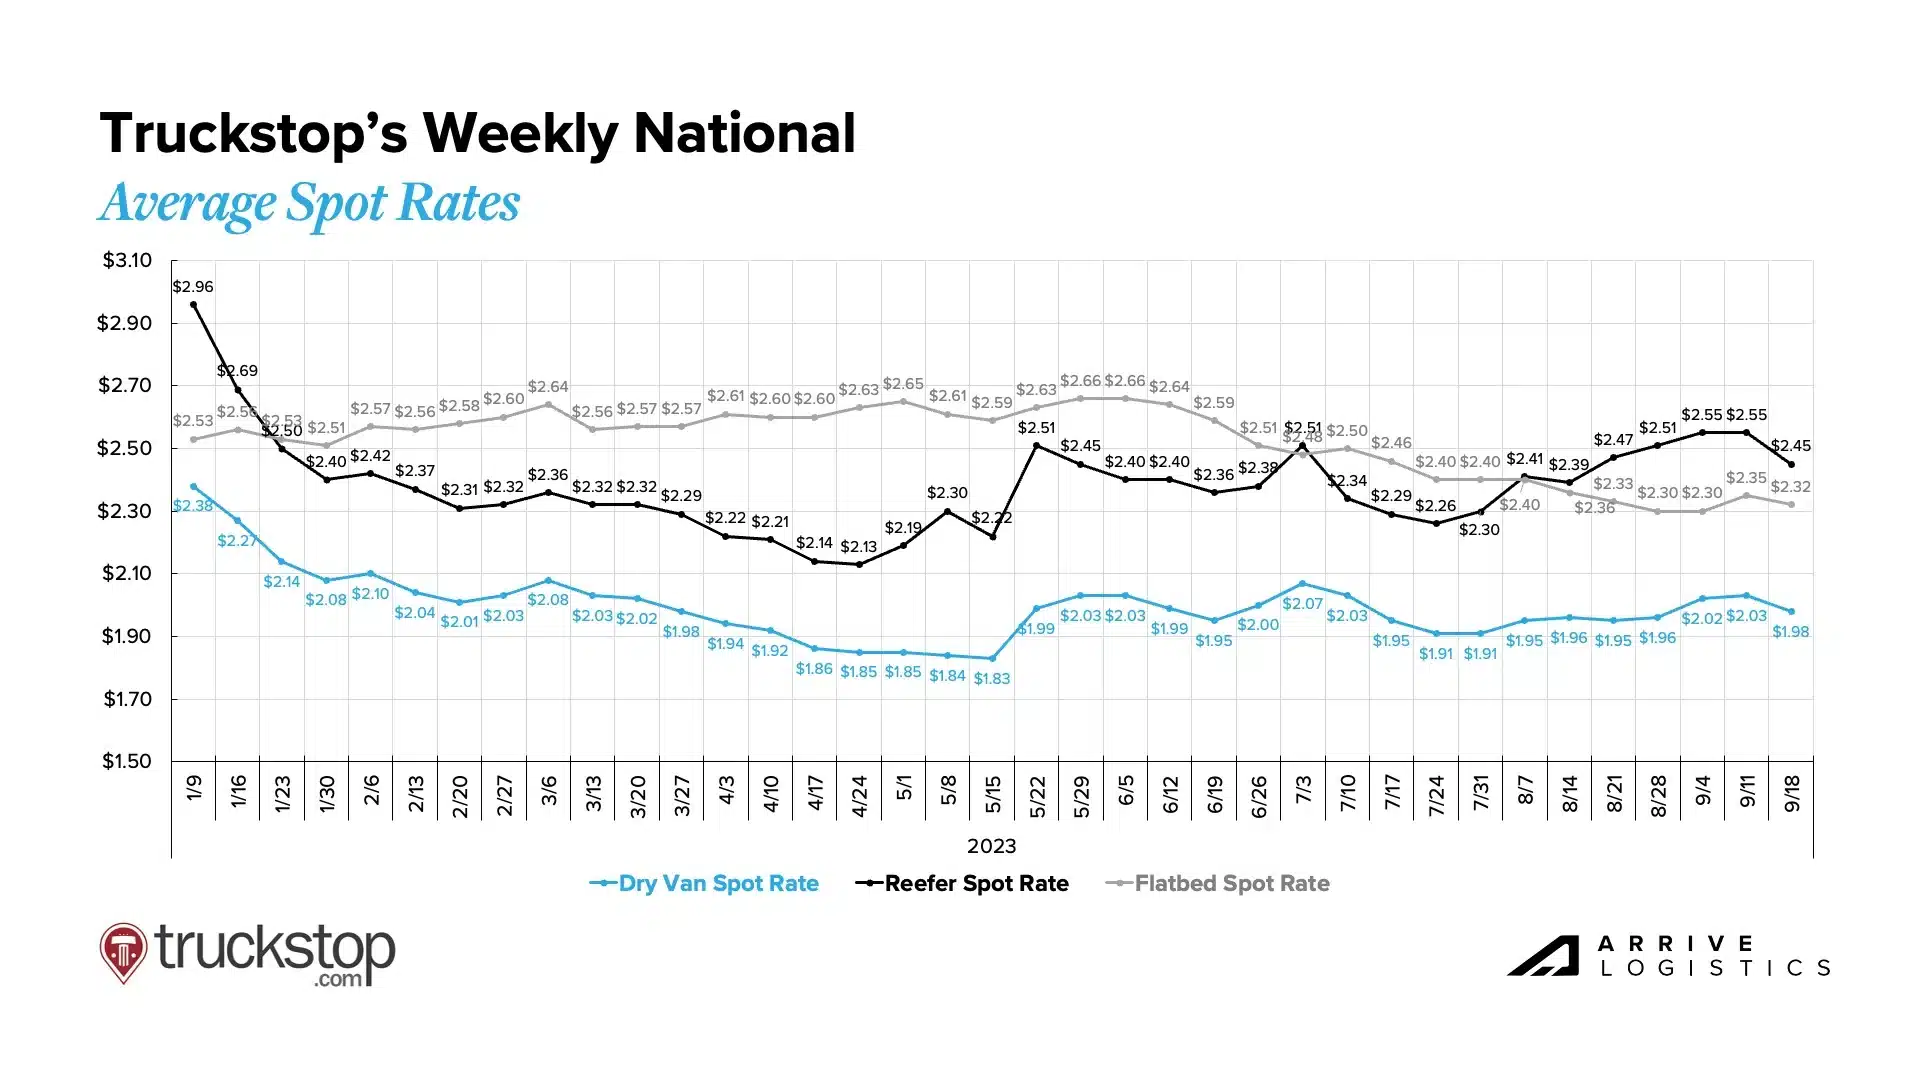 Figure 14: Truckstop Weekly National Average Spot Rates
According to DAT, all-in spot rates, including linehaul and fuel costs, are up slightly for all three equipment types month-over-month. Since August, van rates are up $0.02 per mile, reefer rates are up $0.03 per mile, and flatbed rates are up $0.01.
All-in rates are rising as linehaul rates fall due to significant fuel price hikes in the last month. According to DAT, the dry van fuel surcharge increased from $0.44 to $0.55 per mile over the last two months.
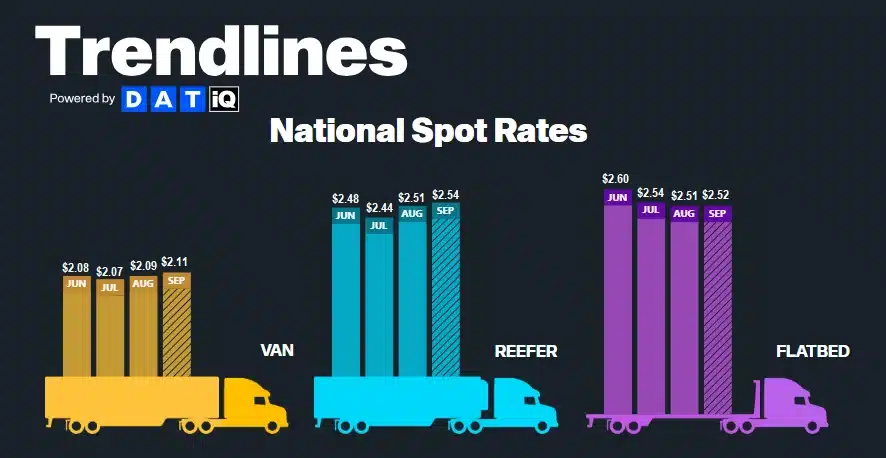 Figure 15: DAT Trendlines National Spot Rates
The month-over-month van rate spread held steady at $0.49 in August and month-to-date in September after closing at $0.48 in July. Fuel volatility is also contributing to this trend, but the gap should continue to close now that spot rates have found a floor and contract rates face ongoing downward pressure.
All-in dry van spot rates are down 13.9% year-over-year in September, while linehaul spot rates are down 14.8%. All-in dry van contract rates are down 15.0% year-over-year, and linehaul contract rates are down 16.0%. These improvements illustrate that peak deflationary pressures are behind us.
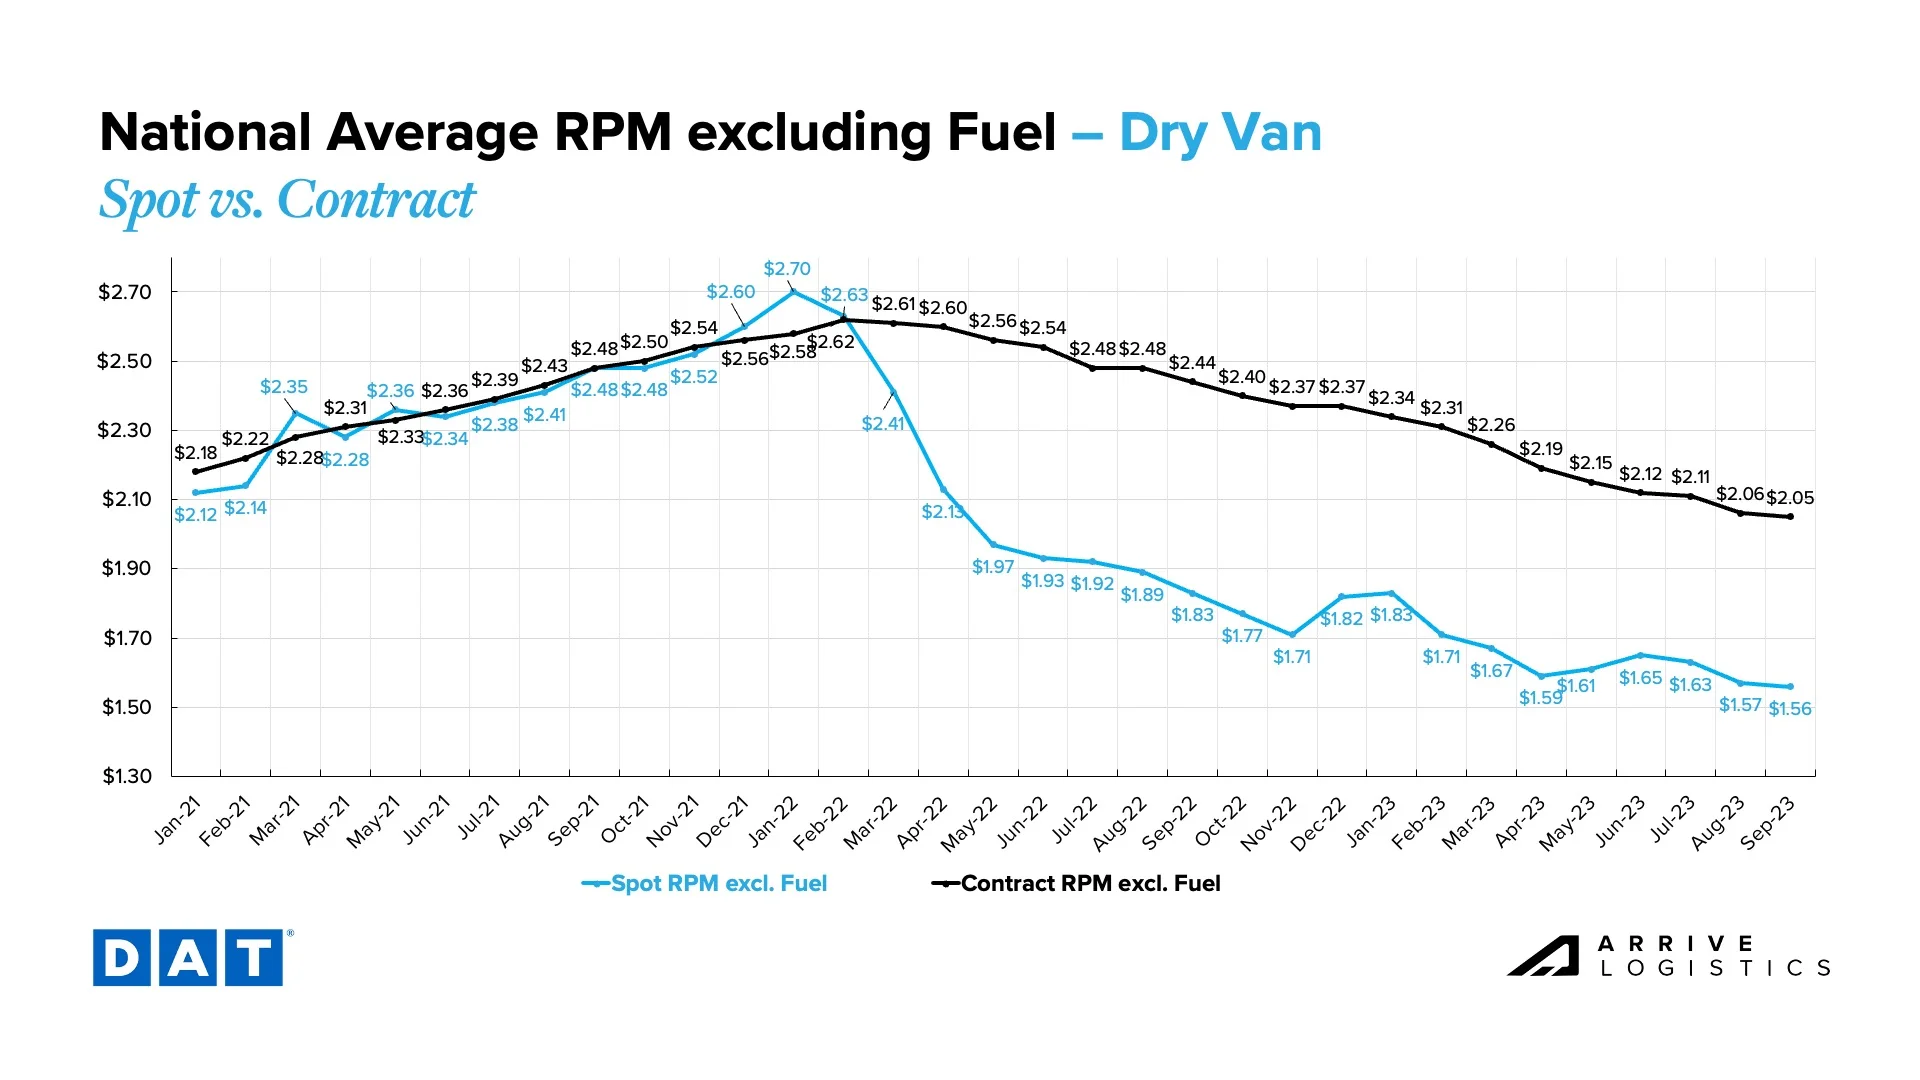
Figure 16: DAT Dry Van National Average RPM Spot vs. Contract
Monthly reefer rate trends followed van trends throughout Q3, easing from a June high as the summer peak season faded. After reaching an April high of $0.58, the reefer equipment spot-contract rate spread dipped as low as $0.41 when spot rates peaked in June but is back up to $0.45 in early September. Like van trends, the gap should further close now that spot rates have found a floor and contract rates continue to undergo downward pressure.
Down 10.8% year-over-year, the current reefer contract rate is $2.39 per mile, excluding fuel, while the current reefer spot rate is down 10.2% year-over-year to $1.94 per mile, excluding fuel.
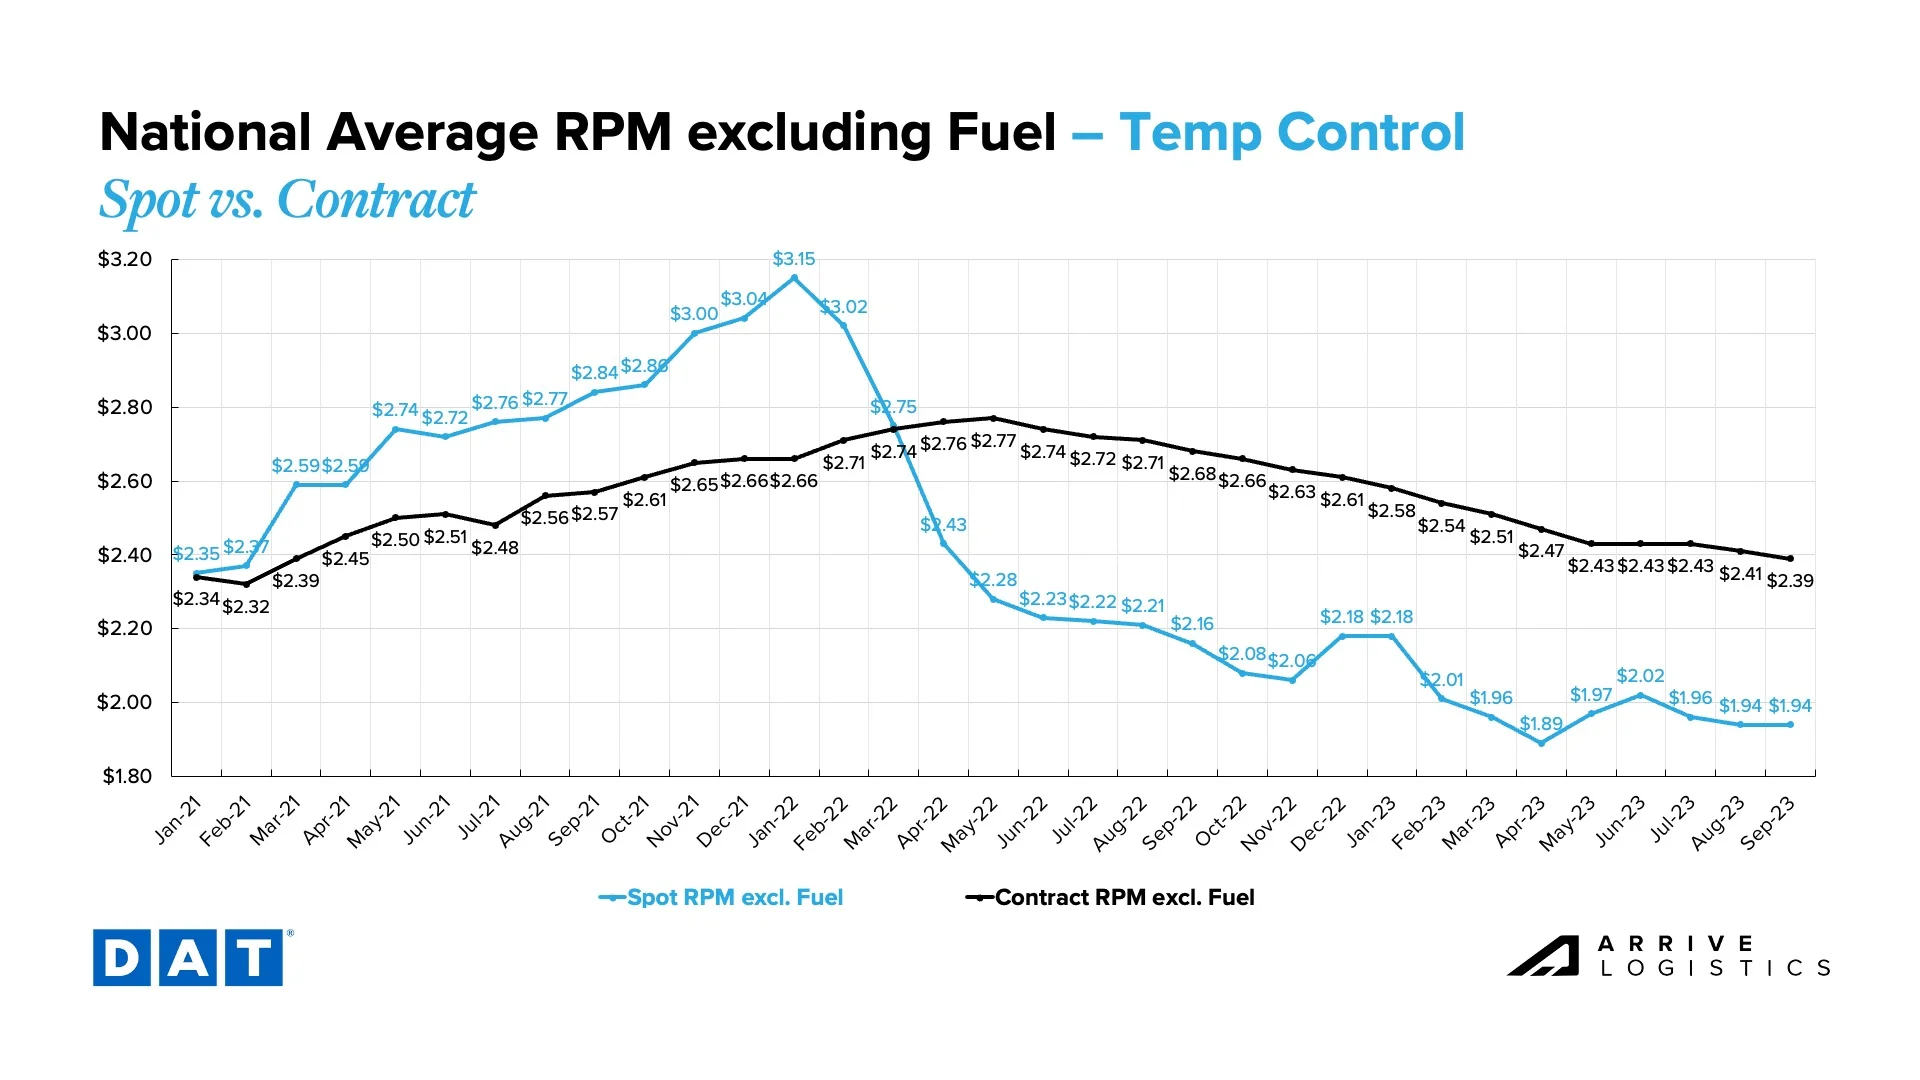 Figure 17: DAT Temp Control National Average RPM Spot vs. Contract
After stabilizing for the first half of 2023, Flatbed rates have rapidly declined recently. Despite contract rates falling quickly, the spot-contract gap is still near an all-time high at $0.68 per mile after dipping to a low of $0.58 in April. In September, spot rates are currently at $1.86 and contract at $2.54 per mile, excluding fuel.
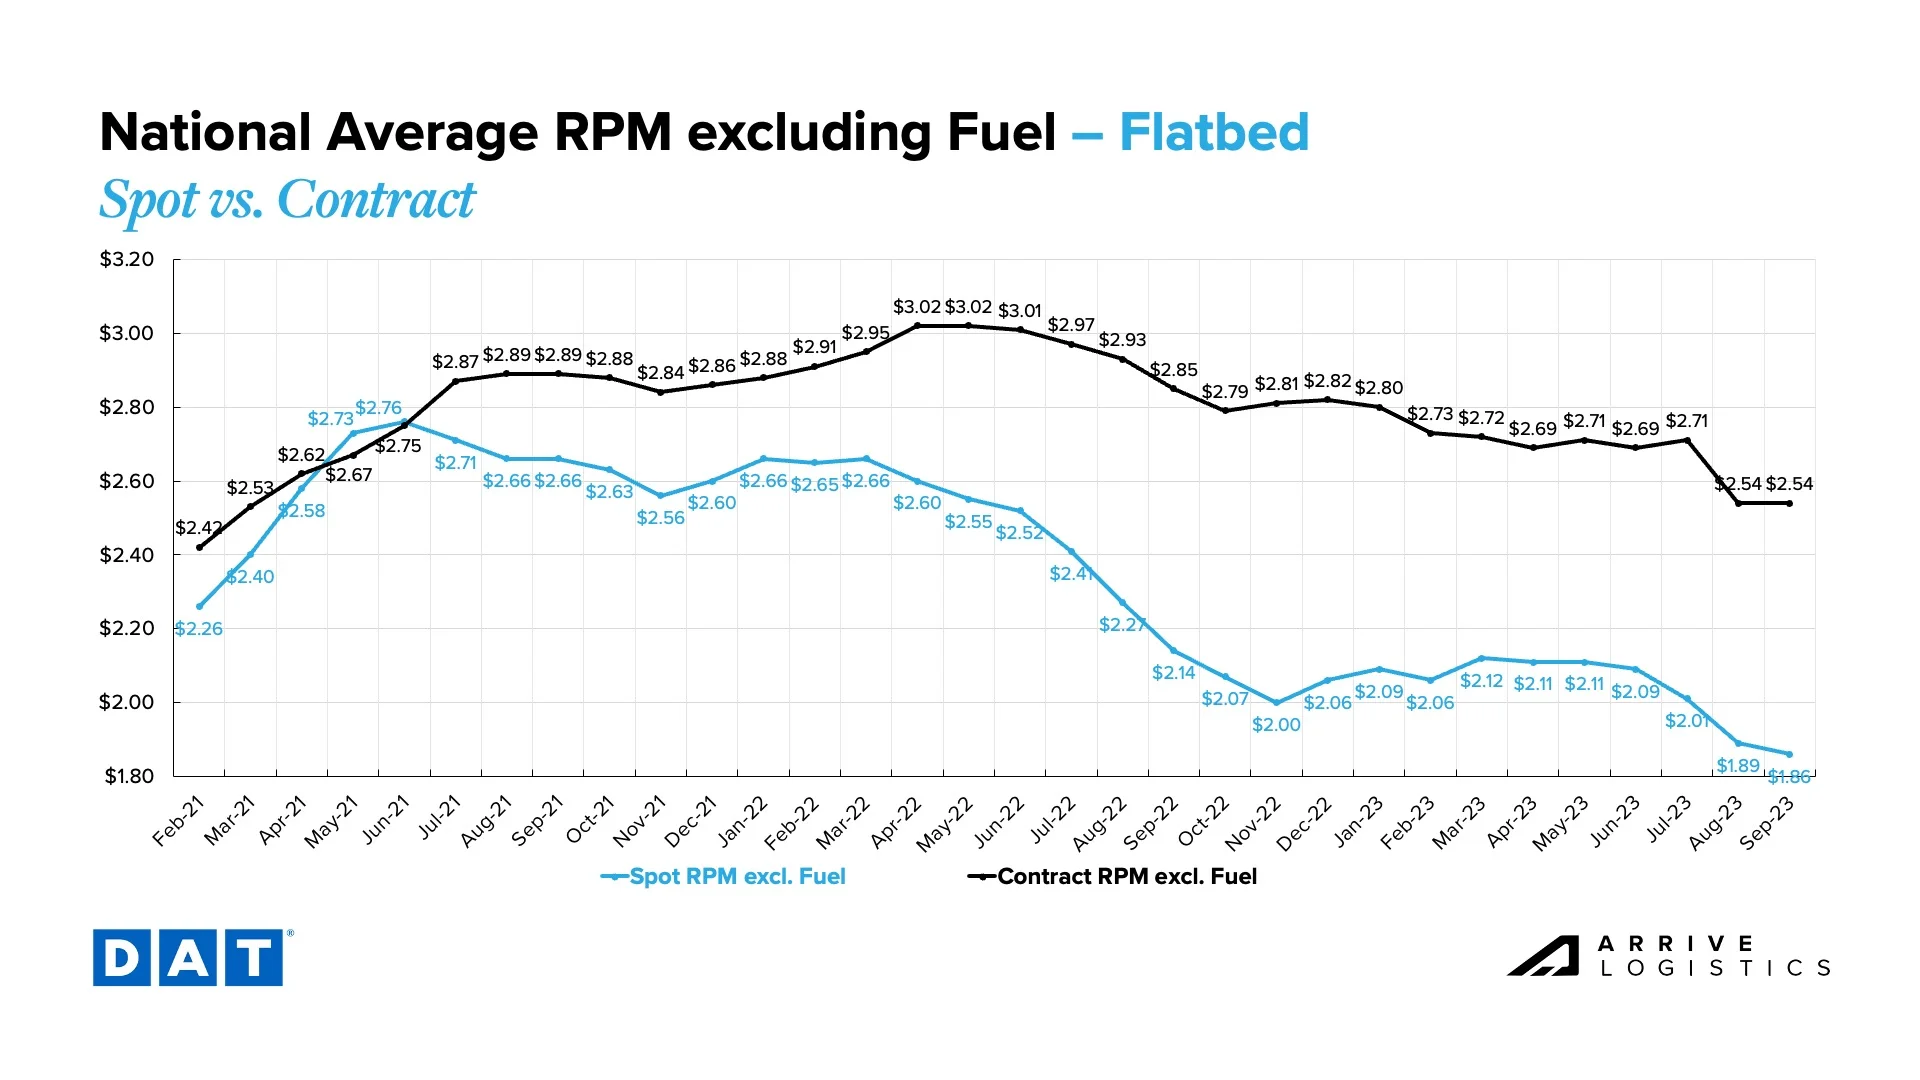 Figure 18: DAT Flatbed National Average RPM Spot vs. Contract
Conditions continue to worsen for carriers in September. Not only have spot rates fallen considerably over the past 18 months, but if the recent rise in fuel costs persists, it could cause many more operating authorities to shut down.
Carriers have largely been patient through the down cycle, but conditions are starting to take a toll as the capacity correction continues. With only a modest upside to truckload demand on the horizon, carriers are unlikely to see conditions improve meaningfully through the year’s end beyond a few seasonal periods of opportunity. Thus, carrier exits will likely increase in the coming months.
This month, high revocations again led to a negative net change in the carrier population. Strong contract service numbers indicate the correction is far from over, but this trend will inevitably lead to a capacity crunch, as it always does in the market cycle.
Increased operating expenses are the primary culprit causing carriers to close, as overall rates are still high compared to historical (pre-pandemic) levels. This trend continues to drive record-high revocations of authority, although August totals were the lowest in more than a year at just over 6,400 carriers.
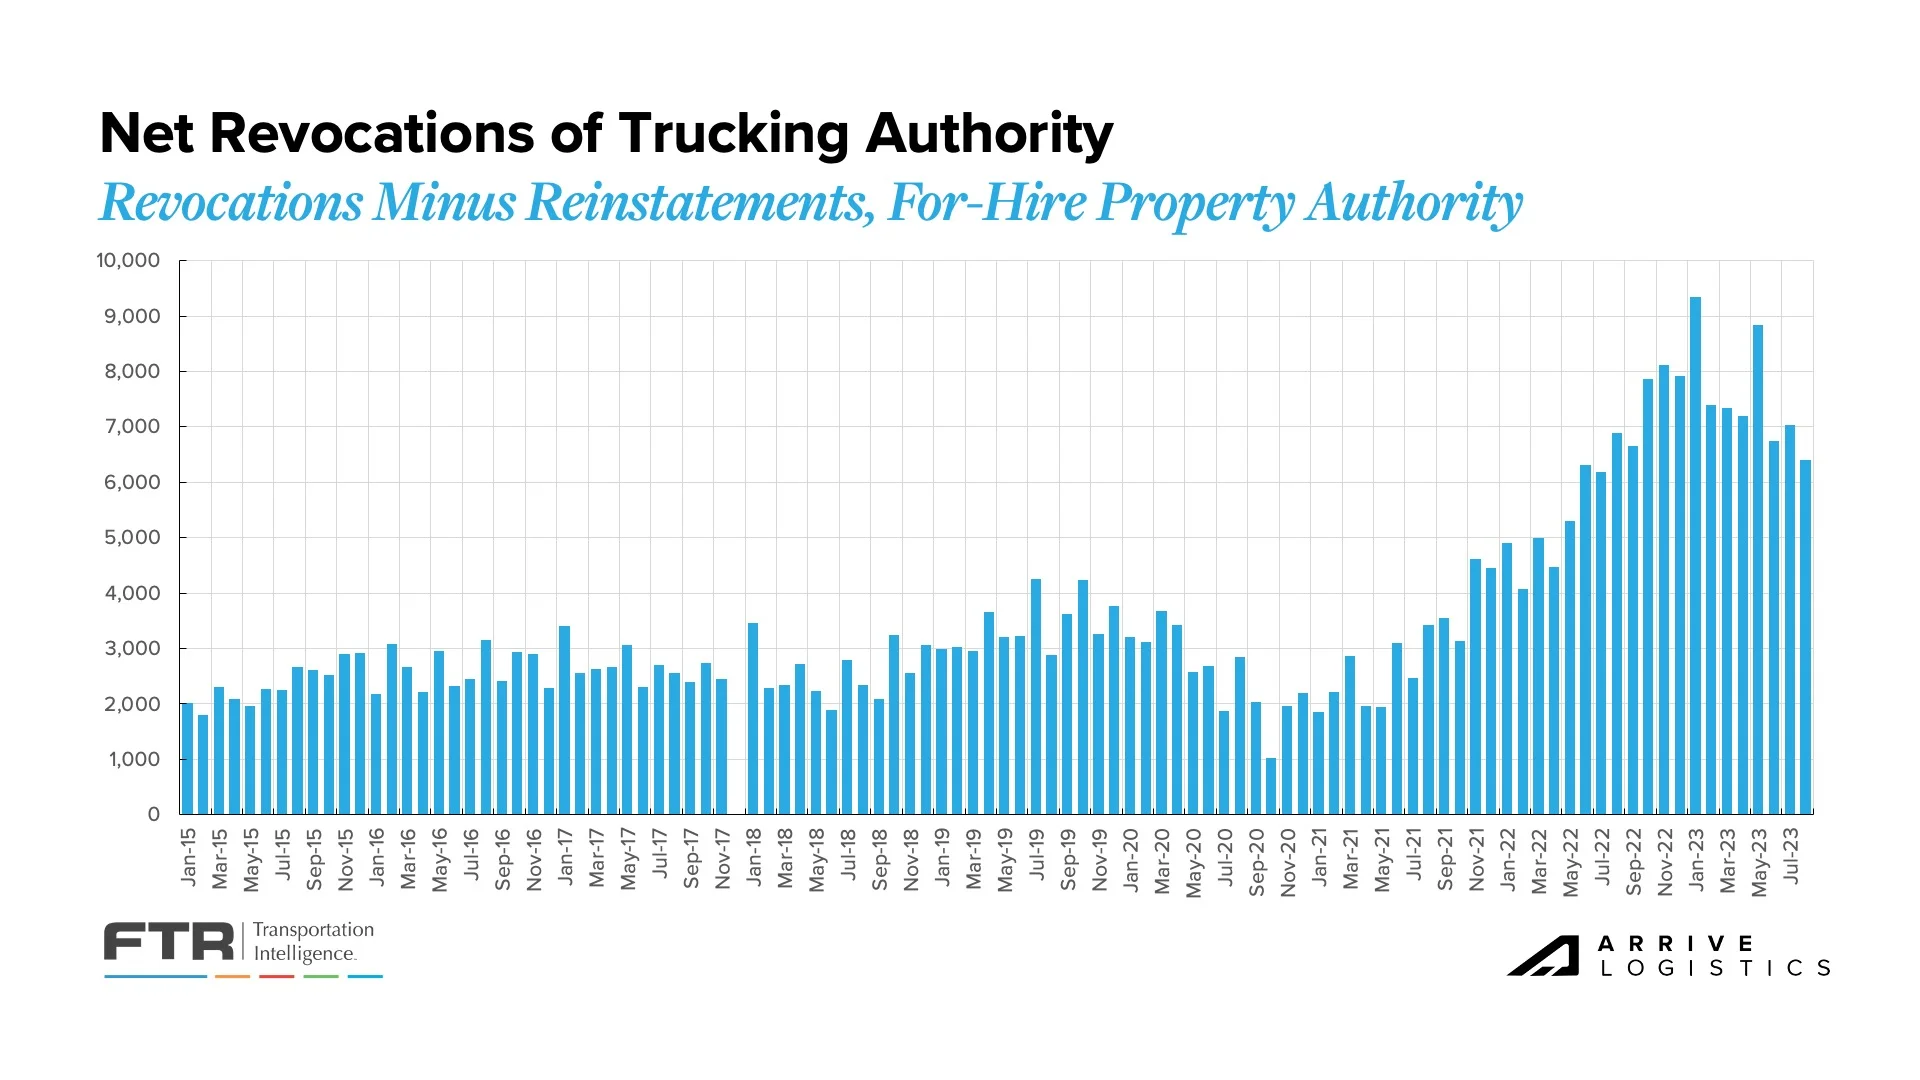 Figure 19: Net Revocations of Trucking Authority: FTR Analysis of FMCSA Data
Total employment has reached the lowest level since March of 2022 after dropping by more than 41,000 jobs over the past three months. Though this is largely due to Yellow closing in August, some of those job losses may show up in September.
Given the worsening truckload rate environment, the trucking employment plateau observed in the first half of 2023 defied expectations. Carriers have focused on retaining drivers, but the longer current conditions persist, the more likely overall employment will fall further.
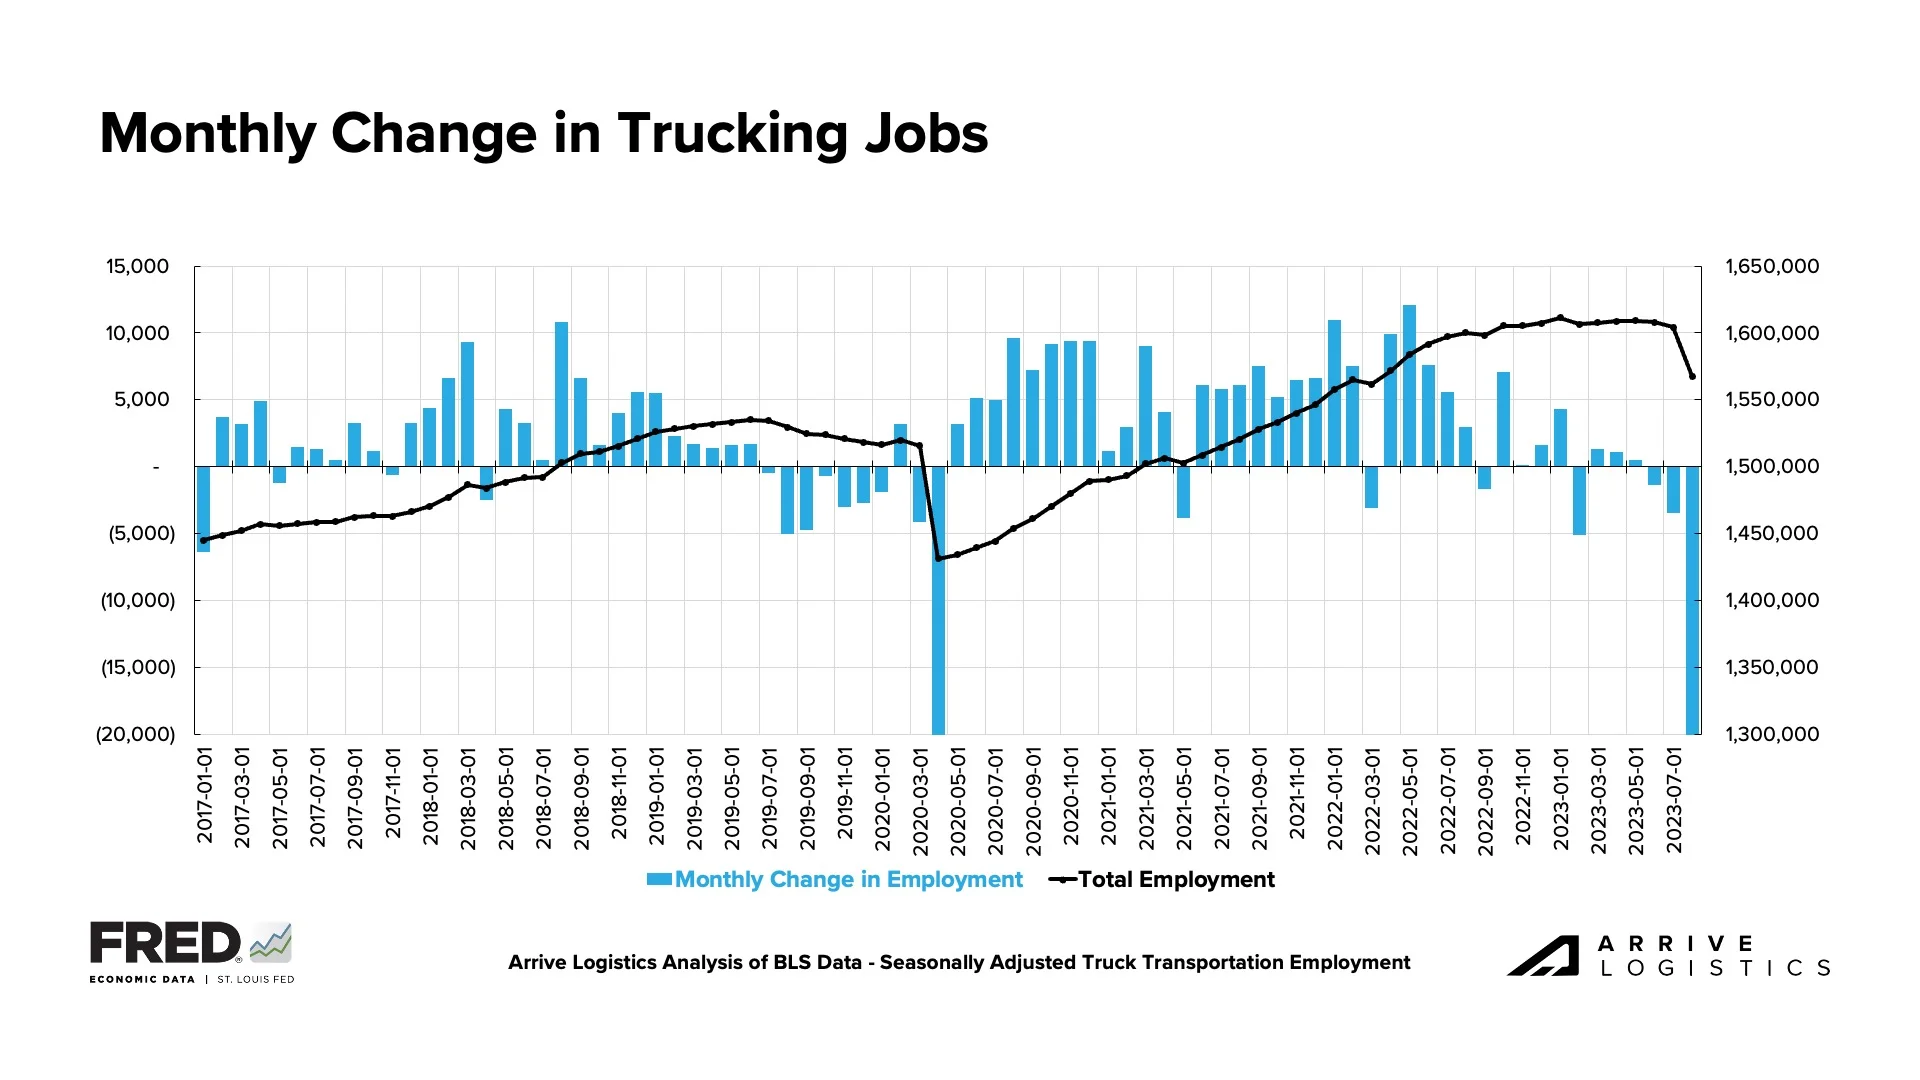
Figure 20: FTR’s Monthly Change in Trucking Jobs
A key trend we’re still watching is revocations outpacing new carriers entering the market for 10 of the last 11 months, reducing the total number of carriers. A significant amount of capacity that entered the market over the last few years remains unutilized, so we expect this disparity to continue for at least the near term.
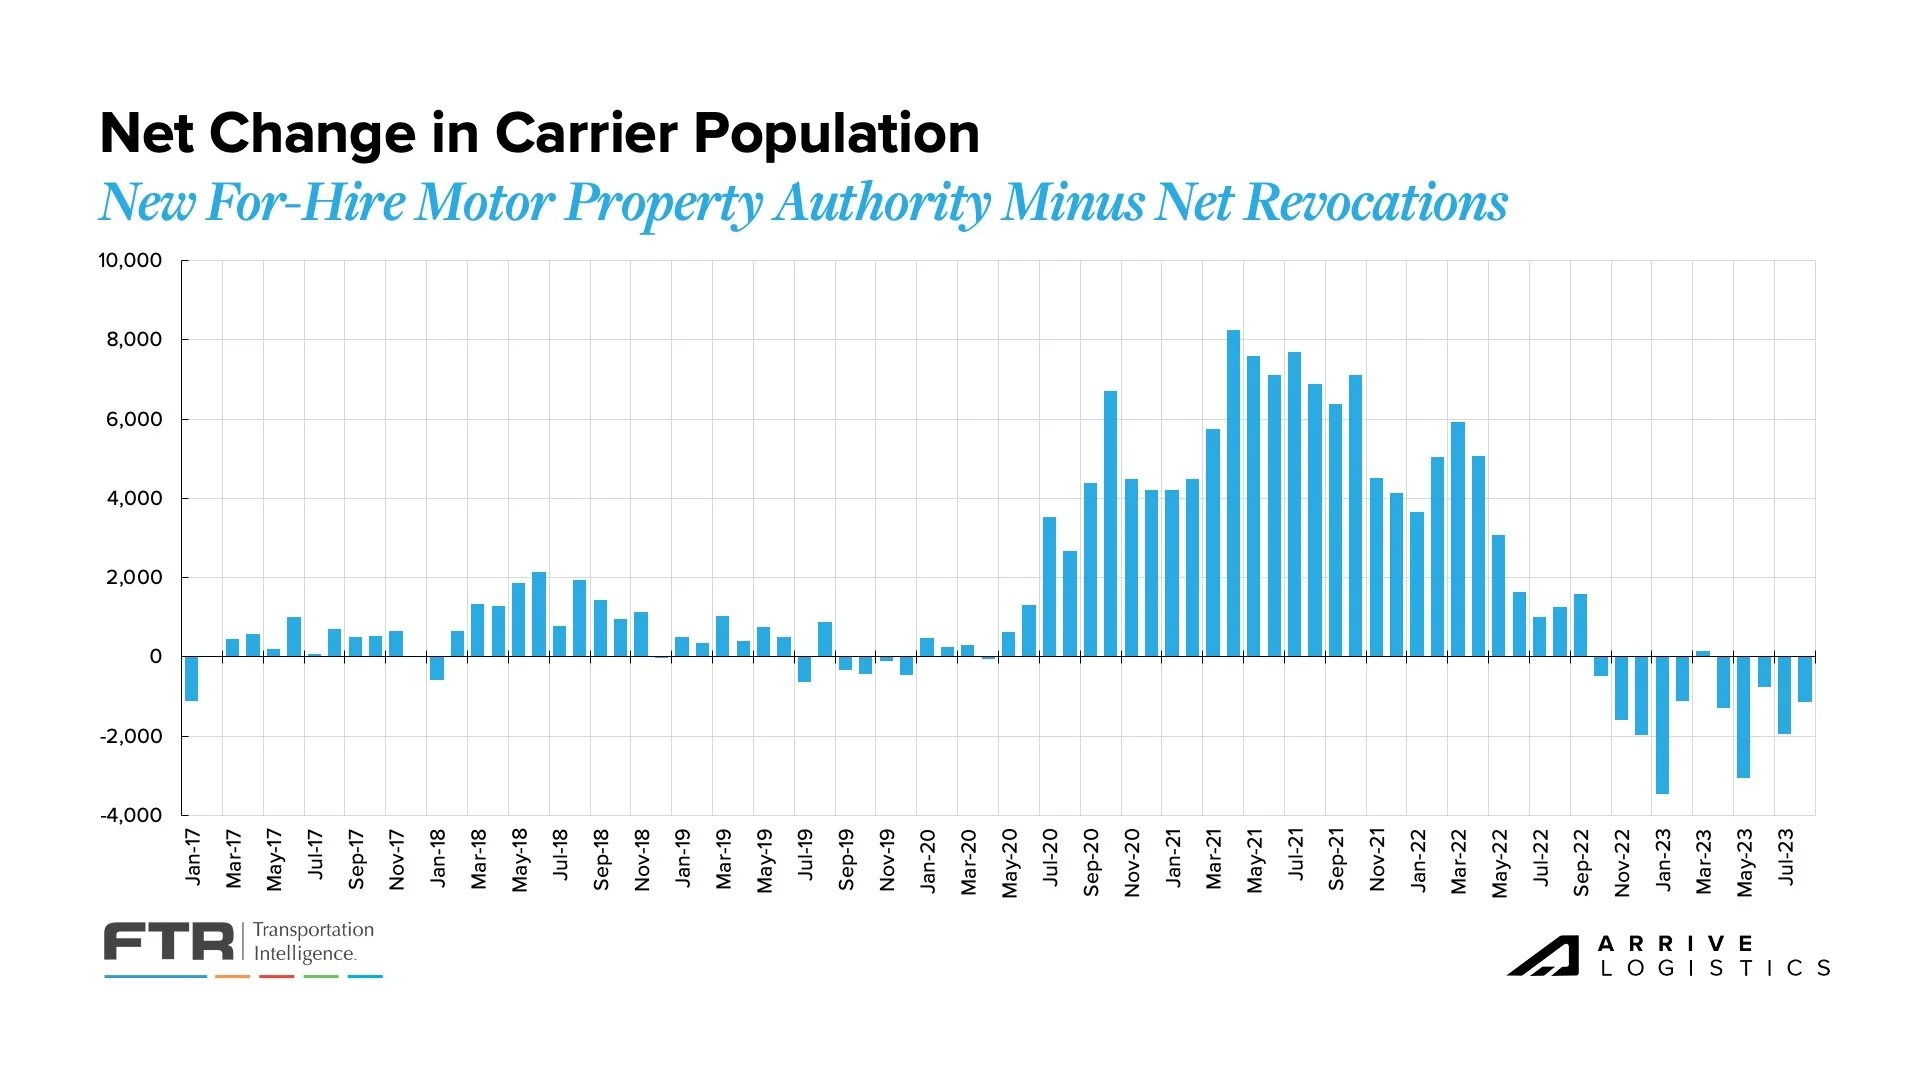 Figure 21: Net Change in Carrier Population: FTR Analysis of FMCSA Data
Recent truckload demand data is encouraging. With tonnage rising, it is easy to point to slowing destocking efforts as an ongoing and future demand driver. Volumes should also get a boost from normalizing retail ordering patterns as the inventory cycle resets.
On the flip side, there are still concerns about manufacturing trends, consumer spending, and 2024 housing and construction trends amid the pending resumption of student loan payments and the potential for an extended period of elevated interest rates.
The National Retail Federation (NRF) recently reported that import cargo volumes at the nation’s major container ports may hit the 2 million TEU mark for the second consecutive month in September and remain there in October. NRF Vice President Jonathan Gold says, “These are strong numbers, and a sign retailers are optimistic about the holiday season since they don’t import merchandise unless they think they can sell it.” This means we could see a good finish to peak season, especially if consumers show strength early on.
If consistent import volumes continue through Q4, year-over-year declines of 11.4% in August could flip to 12% increases in year-over-year import growth by December. This gives some context to how the inventory cycle’s reset could impact demand and just how large a step back retailers took a year ago to correct their overstocked inventories.
![]()
Figure 22: NRF Monthly Imports
The latest ISM manufacturing report indicated more easing backlogs as new orders contracted for the twelfth consecutive month amid slowing production. The new orders index contracting adds further uncertainty about future backlogs and, in turn, truckload demand. Manufacturing was expected to be one of the main volume drivers in 2023, and if contraction continues, demand will likely fall further than previously forecasted. However, stable production levels indicate the sector still has pent-up demand, which should enable healthy volumes in the near term.
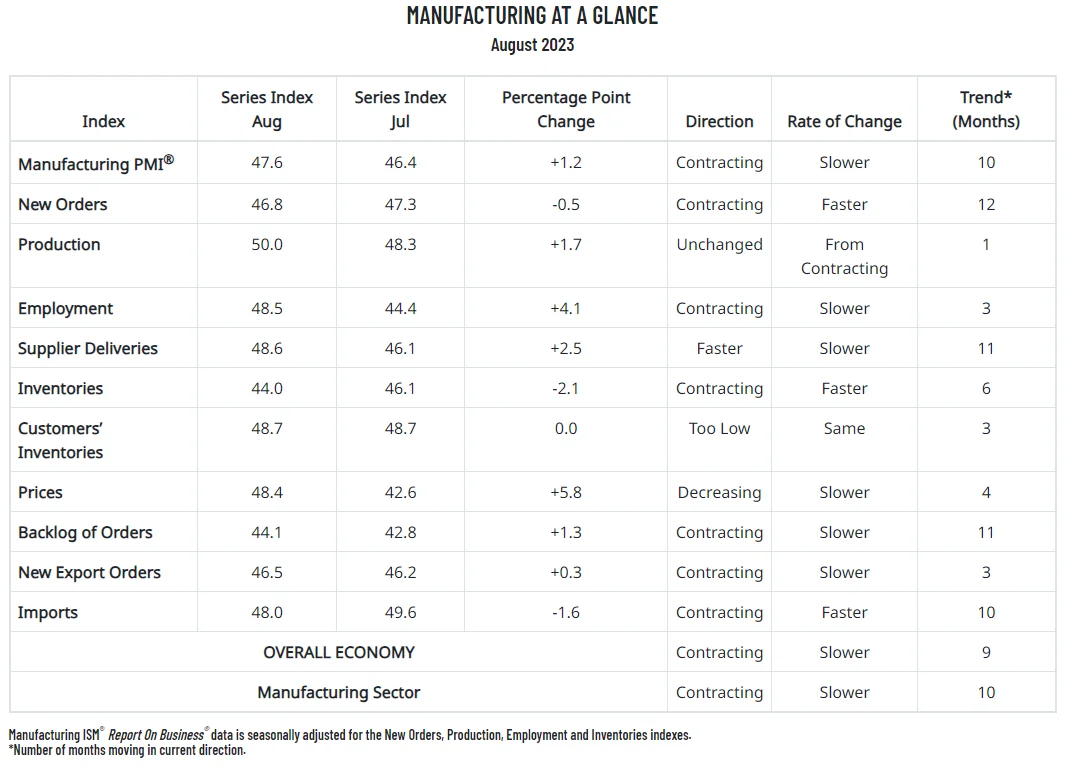 Figure 23: ISM Manufacturing Report, Manufacturing at a Glance
 Figure 24: Monthly Business & Economic Highlights
FTR’s latest truck loadings forecast for 2023 improved slightly and turned positive this month, increasing from -0.1% year-over-year growth a month ago to 0.2% as of this month. FTR noted that the latest outlook indicates stronger activity for loadings related to the automotive and construction sectors but weaker activity for food and chemicals. The 2024 outlook saw a meaningful positive growth revision, from 0.2% to 0.9%, but slow growth will likely continue into next year.
 Figure 25: FTR’s Truck Loads Summary
August CPI data showed that inflation will likely remain sticky even though price increases have cooled notably. While there is no direct relationship to truckload demand, it is easy to make a connection between elevated interest rates and slowing freight volumes — this is the concern as we look towards 2024.
If inflation remains above the target, it is unlikely that the Fed will lower interest rates, leaving questions about whether the inventory cycle reset will be enough to stabilize freight volumes. If inflation were to ease, however, it would open the option for the Fed to lower interest rates, which would almost certainly mean increased housing activity and capital investment in manufacturing, two sectors that contribute meaningfully to freight demand and are currently slumping.
 Figure 26: New York Times Inflation Data
Bank of America card data showed consumer spending per household increased by 0.4% year-over-year in August. However, card spending per household dropped by 0.2% month-over-month on a seasonally adjusted basis.
Spending was weak across most categories except gas, where price increases were mostly to blame. Bank of America noted that the monthly spending decline was not related to Hurricane Idalia or pending student loan payment resumptions; it was simply a return to trend-like spending. Therefore, the August cooldown need not disrupt the broader narrative of consumer resilience. As long as the labor market remains healthy, BofA remains positive on the consumer outlook.
 Figure 27: Bank of America Aggregated Monthly Card Spending


