
"*" indicates required fields
"*" indicates required fields
"*" indicates required fields


The freight market followed typical seasonal trends in August and early September. Demand levels continued to stabilize as expected, and capacity remained abundant. Earlier this month, the Fed cut interest rates for the first time in four years. While no immediate impacts are expected, future cuts could catalyze demand in 2025. Ultimately, the freight environment continues to approach equilibrium, with Q4 trends expected to mirror those of 2023.
We are closely monitoring two developing situations that could have significant implications for the freight market: the East and Gulf Coast port strike and Hurricane Helene’s fallout. Please contact your account representative if you have questions or concerns about how these events might impact your operations.
Strike: The strike began on Tuesday, October 1, impacting over 30 ports along the East and Gulf coasts. As the strike continues, port operations will remain stopped and could create a significant shipment backlog. The extent of the disruption will depend on the strike’s duration: Should it last a week or longer, we anticipate significant congestion at the ports, resulting in a demand surge once operations resume.
Hurricane Helene: Hurricane Helene ravaged the Southeast during the second half of last week, leading to widespread power outages and road and rail closures. Several areas are still without power and many businesses remain closed. Recovery efforts are now underway and are expected to last several months, which could create regional rate and routing guide volatility in the weeks and months ahead.
"*" indicates required fields
Spot postings declined on a seasonal and annual basis in August.
Trucking employment numbers continue to decline, indicating capacity is undergoing attrition due to poor market conditions. However, overall levels remain elevated.
Import levels remain strong despite a small pullback from July. The risk of an East and Gulf Coast port strike on October 1st could create freight market volatility, especially in regions surrounding ports.
Rates moved in line with expectations, and the large spot-contract rate gap continues to mitigate the market’s vulnerability to sustained disruption.
Private fleets continue to invest in equipment and, as a result, have increased truckload market share. This trend has reduced available spot market demand and put downward pressure on spot rates.
Interest rates were cut by 50 basis points. While this will not immediately spur demand, future interest rate cuts are the primary upside risk to our forecast.
What’s Happening: Spot demand declined while contract volumes remained stable.
Why It Matters: The market environment remains soft, with no change imminent.
Demand trends remained stable with no major surprises. August truckload volumes eased with seasonal expectations, then reversed course in September and started to tick upward. Market conditions followed normal seasonal patterns over the past year and should continue to through year-end, with increased volatility around the holidays.
The Sonar Contract Load Accepted Volume Index (CLAV) measures accepted load tenders moving under contractual agreements. It is similar to the Outbound Tender Volume Index (OTVI) but removes all rejected tenders.
As of mid-September, the CLAV index shows a month-over-month increase in accepted volumes and remains up compared to September 2023. The index shows a similar pattern to previous years when it trended up through the end of the third quarter before easing in early Q4. This results from late-year retail peak season prep overlapping with other seasonal activity increases.

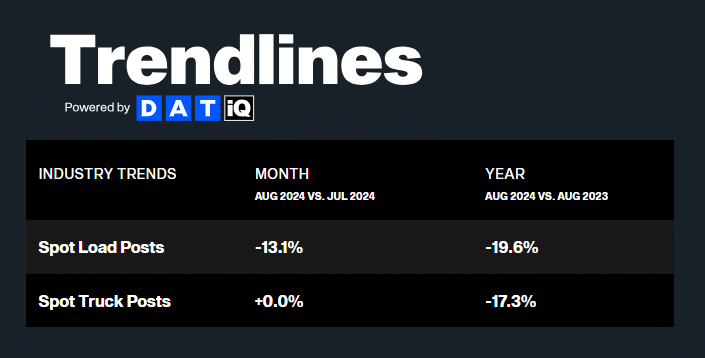
DAT reports that spot load postings fell by 13.1% month-over-month in August and were down nearly 20% from August 2023. The month-over-month decline follows seasonal expectations as August tends to be quieter than July. While the year-over-year decline seems large, it significantly improved from the 41.4% year-over-year decline in August 2023. This trend indicates that traditional spot load boards are experiencing reduced activity due to not only lower truckload volumes but other factors as well, such as theft risk, rate API utilization and private fleet insourcing.
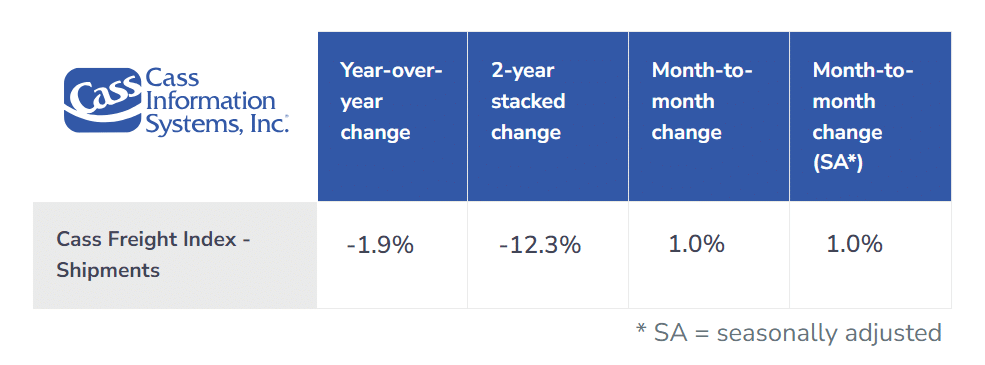
The Cass Freight Index’s shipments component is a good indicator of overall market health because it encompasses both spot and contract freight based on bill data. The August reading showed shipments increased by 1% month-over-month but declined nearly 2% year-over-year. Comparing this to DAT spot posting data, it is safe to assume that overall truckload demand is steady while for-hire demand continues to fluctuate. Given the pullback in traditional spot activity, we expect less market volatility and more rate stability moving forward.
What’s Happening: Supply remains plentiful amid low tender rejection rates.
Why It Matters: Abundant capacity will keep rates soft.
Despite persistently low rates, resilient carriers have helped keep capacity steady and sufficient to service demand. Limited and low-rate spot market opportunities continue to encourage carriers with contractual volume to capitalize on strong rates by honoring their commitments. While obtaining precise capacity data remains challenging, recent trends and flattening rates indicate market stability as we move into Q4.
The Sonar Outbound Tender Reject Index (OTRI), which measures the rate at which carriers reject the freight they are contractually required to take, remains closely in line with September 2023. There has been no significant routing guide disruption since the Fourth of July, which should continue, save for any unforeseen events. 2023 curves on the van and reefer tender rejection charts are a strong predictor of routing guide challenges as the year progresses.
On a year-over-year basis, temp control equipment volatility increased through the summer peak season but was lower through Labor Day. This trend deviates from past peak seasons but aligns with typically soft dry van trends through mid-Q3. Despite the recent softness, we expect increased temp control tender rejections over the next few months, especially in the Pacific Northwest and Upper Midwest, ahead of Thanksgiving and Christmas.


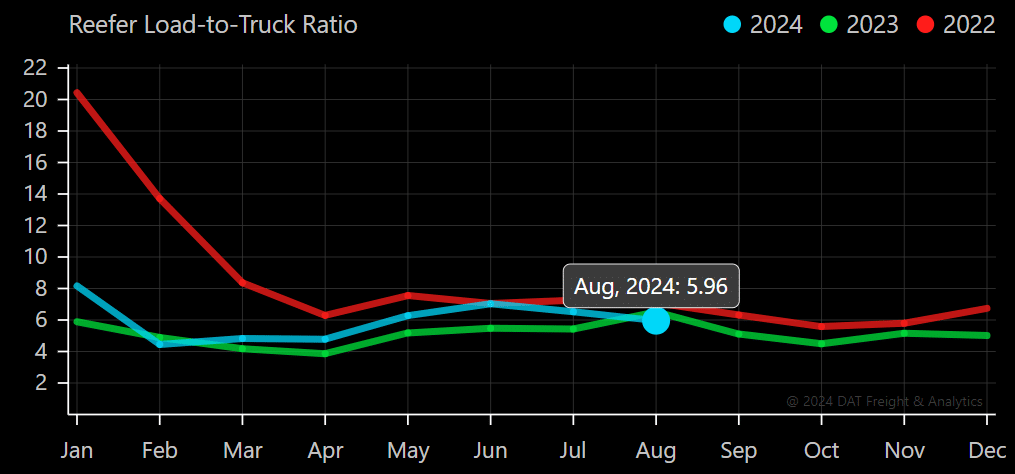
The DAT Load-to-Truck Ratio measures the total number of loads relative to the total number of trucks posted on its spot board. The dry van reading continued to decline, reaching 3.64 in August. This aligns with expectations, as decreased volume and stable capacity lead to lower load-to-truck ratios. Reefer markets followed a similar trend, with load-to-truck ratios falling to 5.96 in August.
The Morgan Stanley Dry Van Freight Index is another measure of relative supply; the higher the index, the tighter the market conditions. The black line with triangle markers on the chart provides a great view of what directional trends would be in line with normal seasonality based on historical data dating back to 2007.
The mid-September reading showed trends following the 10-year average: Tightening in early to mid-July and then softening. Based on historical patterns, we expect increasing challenges through the end of Q3, followed by easing pressure in early Q4. The index is also up year-over-year, indicating a similar story as tender rejection and load-to-truck ratio data.
The reefer index continues to closely follow the 10-year average, while the flatbed index is well below the historical average but in line with 2023 levels.
Morgan Stanley Dry Van Truckload Freight Index

What’s Happening: Rates are following normal seasonality.
Why it Matters: Rate patterns should continue to follow those of Q4 2023.
As supply and demand find balance, rates are following the floor and deviating in line with typical seasonality. Rates rose around Labor Day but fell shortly after, as expected.
We expect rate fluctuations similar to 2023 as Q4 begins, with volatility increasing in certain regions. However, potential East and Gulf Coast port strikes amid hurricane season could cause routing guide shake-ups if the right conditions materialize.
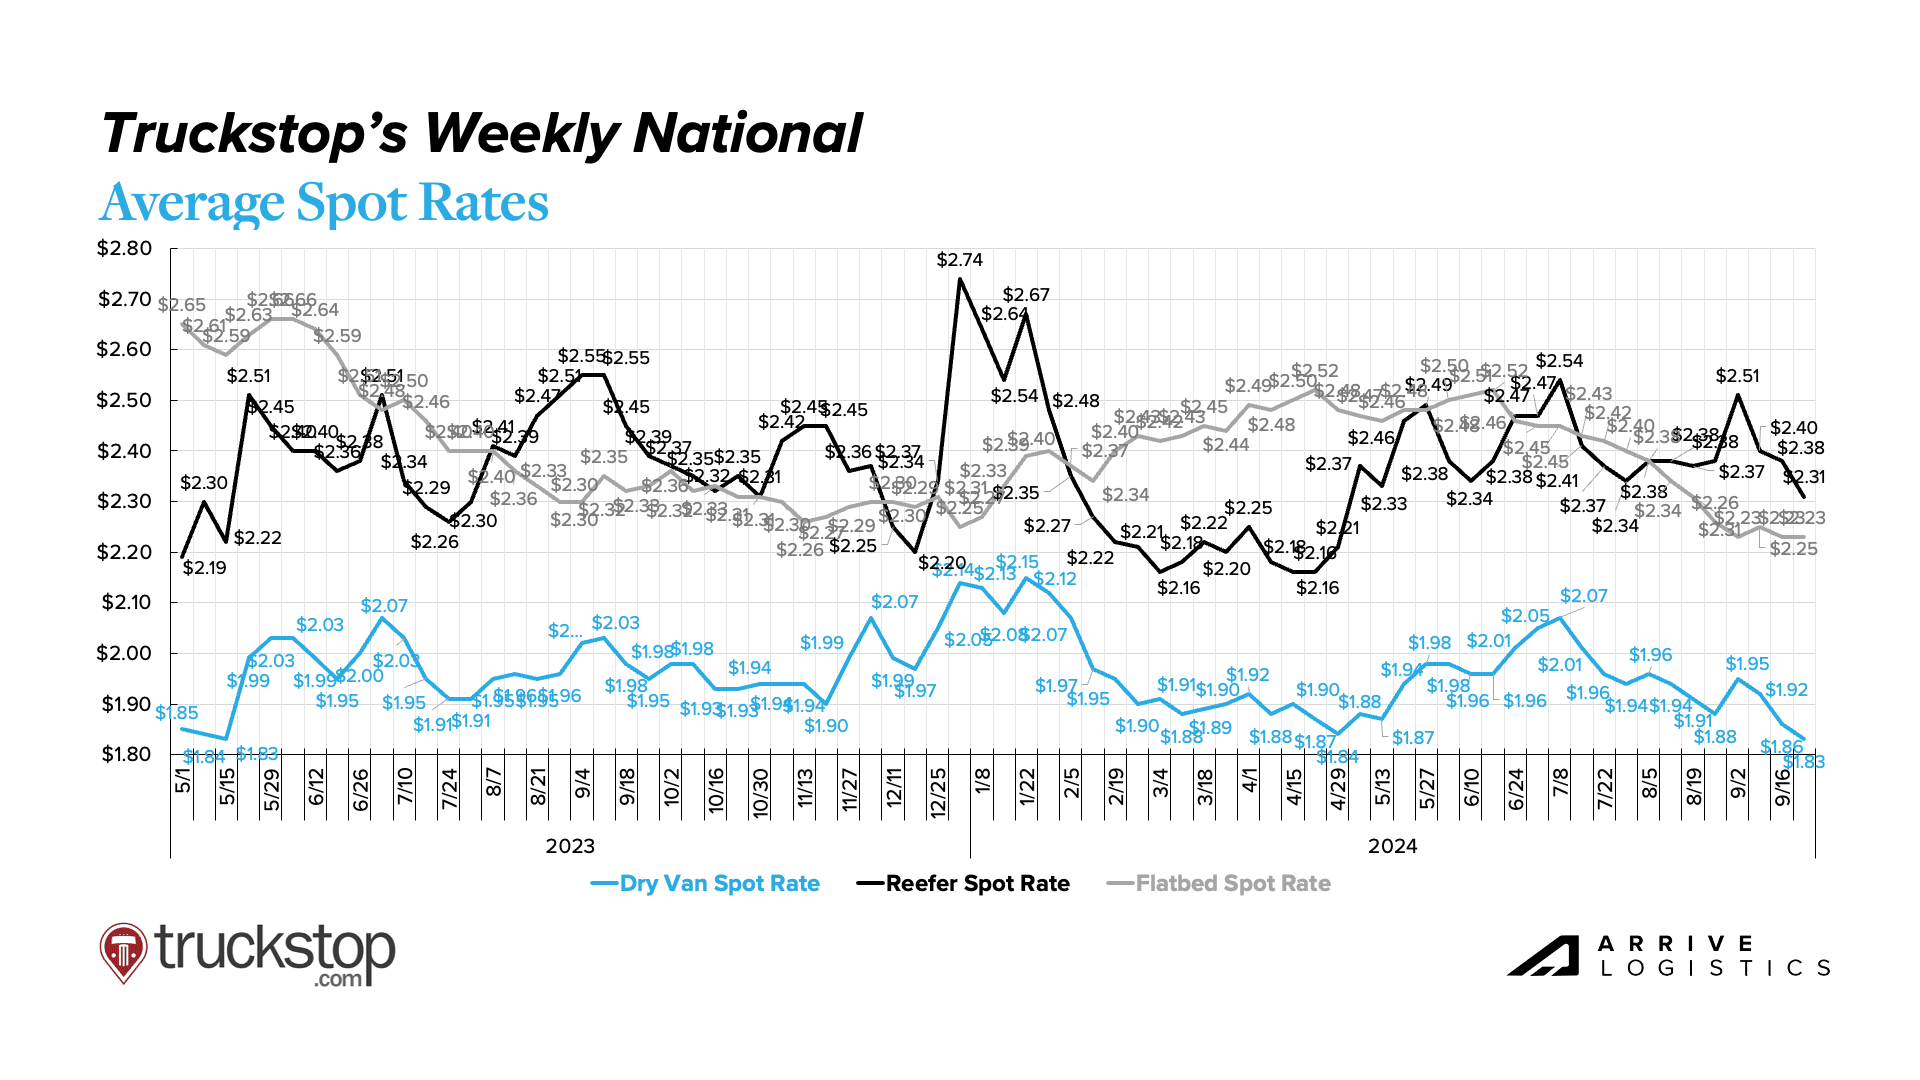
According to DAT, spot rates (including fuel) across the three major modes dropped from August to September. Dry van rates declined sharply by $0.05 per mile from July to August and are down another $0.02 per mile in mid-September. Reefer and flatbed rates followed a similar pattern, declining by $0.03 per mile and $0.01 per mile from August to mid-September. The green shoots for rate recovery and increased vulnerability to disruption discussed in the summer are fading as rates return to Q2 2024 levels. This trend provides strong evidence that the market is following the typical annual demand cycle with no imminent sign of a meaningful shift.
DAT Monthly Rate Trends
National diesel prices continue to decline steadily, offering relief to carriers with lower fuel efficiency. The decline comes amid elevated domestic fuel inventories, strong production and falling demand. Though Hurricane Helene could create some temporary fuel price volatility, overall, prices should remain low.
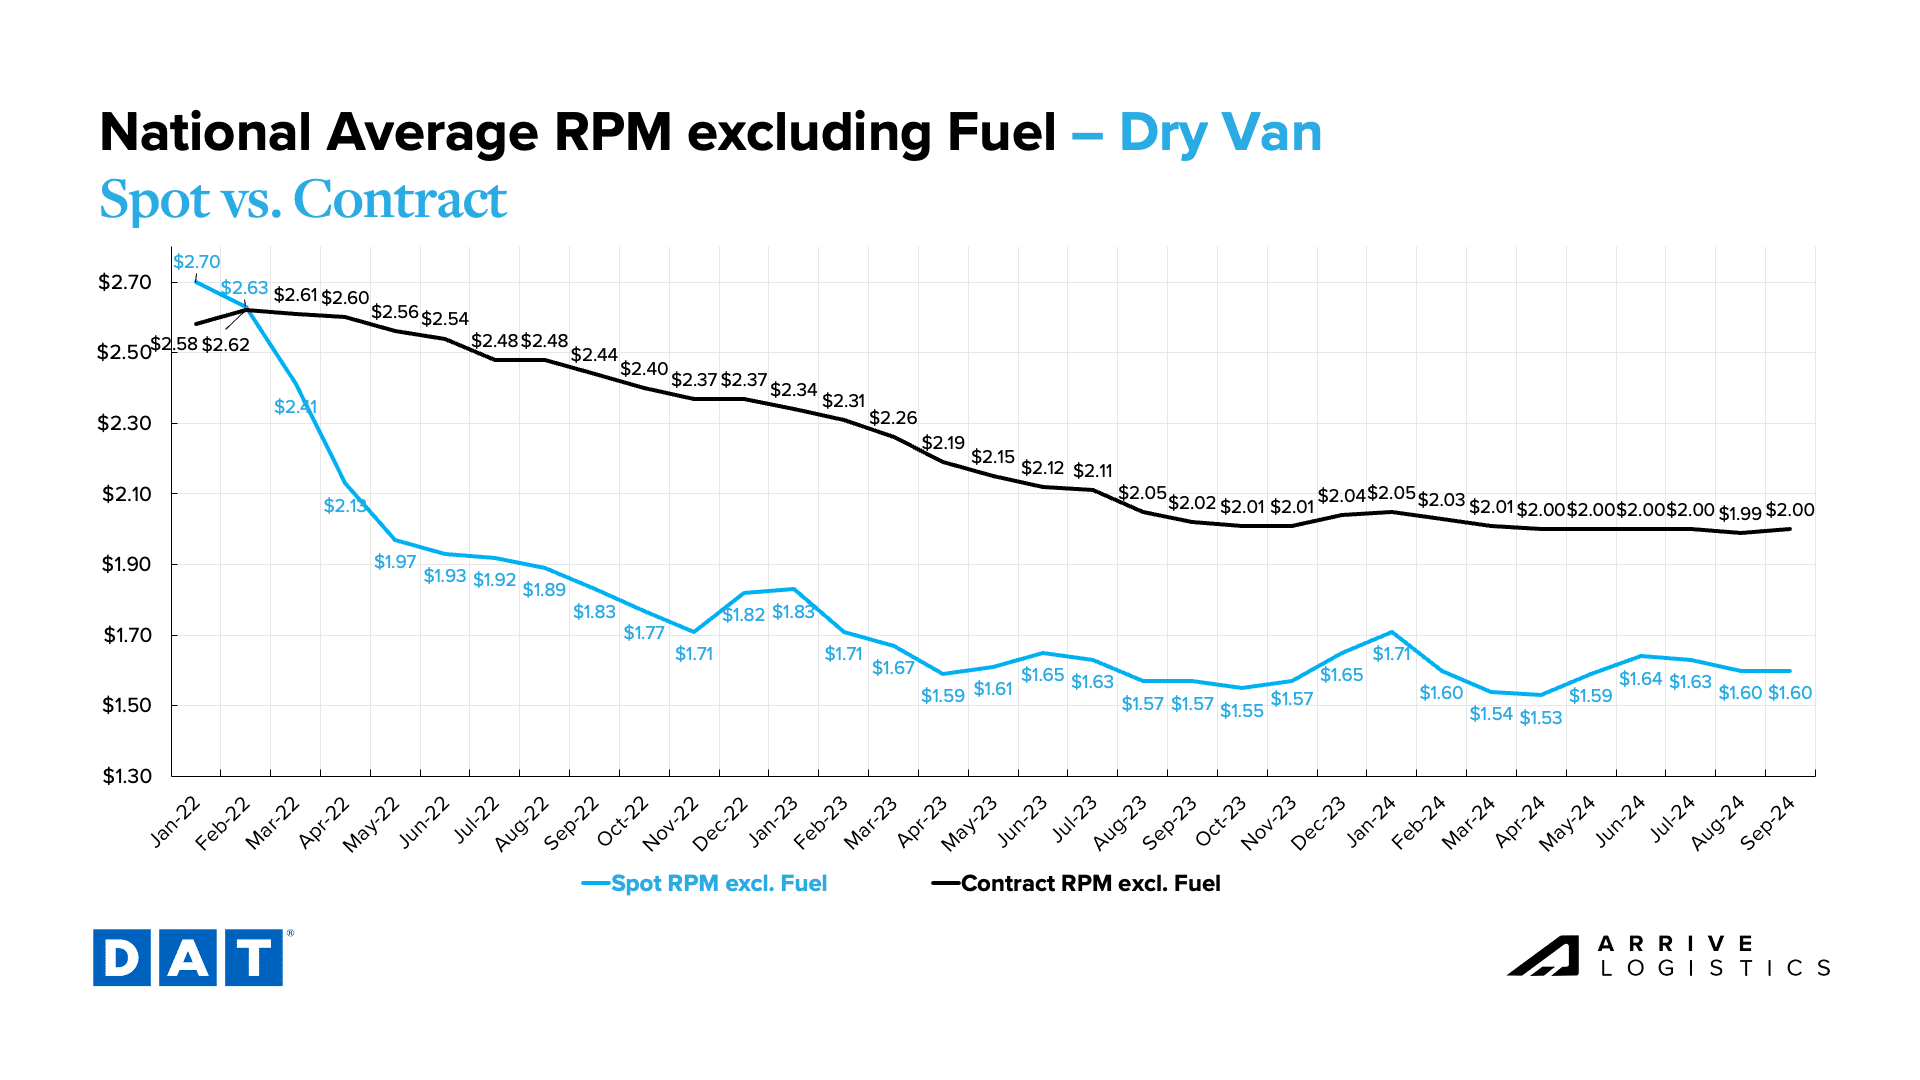
As fuel prices fall, DAT reports flat dry van linehaul rates of $1.60 per mile in September, reflecting spot market stabilization following the summer peak season. Contract rates are steady but have increased slightly through mid-September — if current rate trends hold, this would be the first month of sequential contract rate increases since January 2024. At $0.40 per mile, the spot-contract gap remains historically wide, leading to a highly resilient market environment.
The reefer market has settled, with trends mirroring the dry van market. Month-over-month spot rates are flat through mid-September, hovering around $1.96 per mile. Temp control rates were flat through the summer, but we expect them to tick up later in Q4, especially in northern states. Contract rates have remained stable, limiting the pressure of a closing spot-contract rate gap, although conditions are slightly tighter than dry van freight.

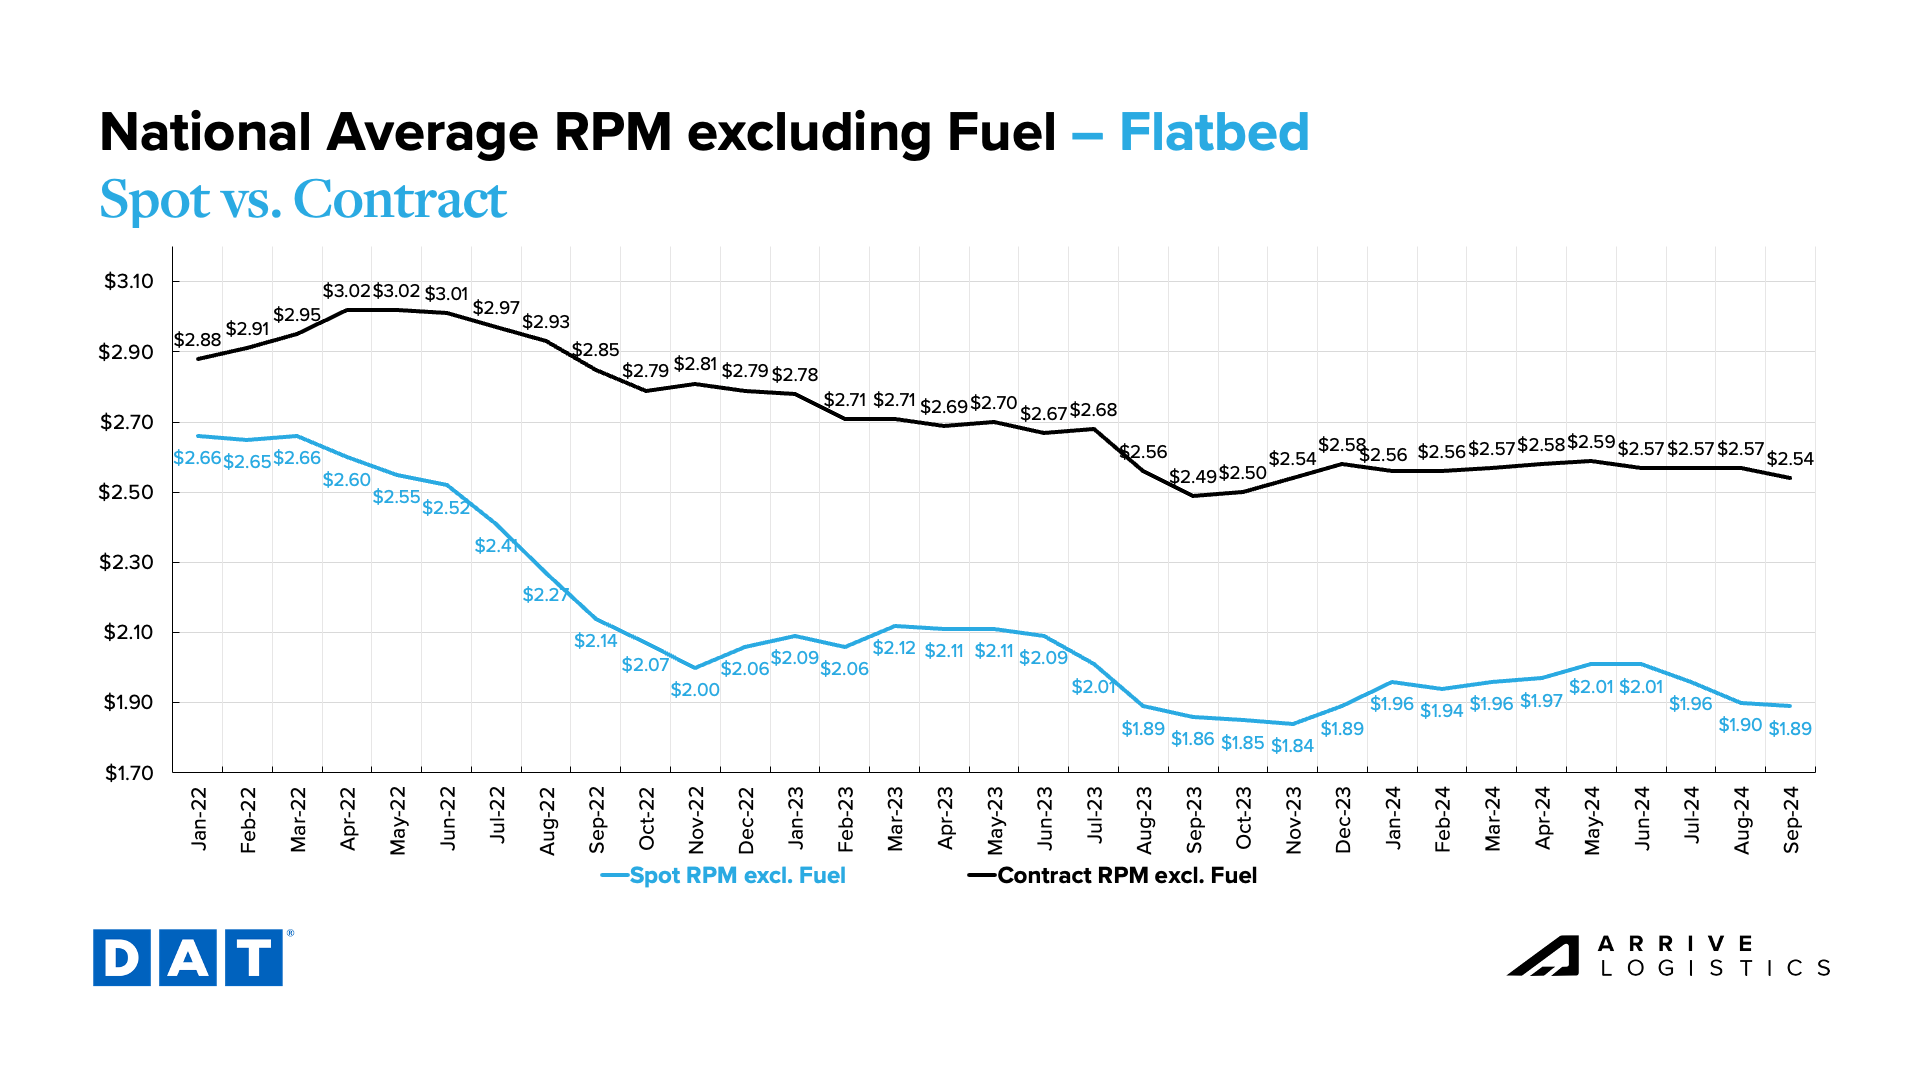
Flatbed rates continue to deviate from dry van and temp control trends. Open-deck spot rates are down from the summer peak as projects wrap up ahead of winter, but contract rates remain steady, hovering a striking $0.66 per mile above current spot rates.
What’s Happening: The rail strike lasted less than a day, and operations are back in full swing.
Why It Matters: Market conditions have normalized and will likely hold into early Q4.
What’s Happening: Rates are falling in certain regions as capacity softens.
Why It Matters: The market continues to move toward balance.
What’s Happening: Tightness is moving up the Atlantic Coast.
Why It Matters: Regional rates are rising as a result.
East Coast
Midwest
South Central
West
PNW
What’s Happening: Flatbed demand is steady.
Why It Matters: Rates are following typical seasonality.
What’s Happening: Private Fleet investment in tractor count growth is increasing private fleet market share of truckload volumes.
Why It Matters: This is limiting spot market demand for for-hire carriers and adding excess capacity to the market.
Investment in expanding tractor counts by private fleets is boosting their share of truckload volumes. This growth is reducing spot market demand and contributing to excess capacity in the market.
FTR’s latest revocation data showed a small carrier population increase for only the third time in the past 22 months. Revocations declined month-over-month amid increasing new carrier entrants, indicating the carrier population remains resilient despite low revenues and stable expenses. However, recent fuel price declines could offer carriers enough relief to hold out for potential revenue gains when rates tick up in Q4.

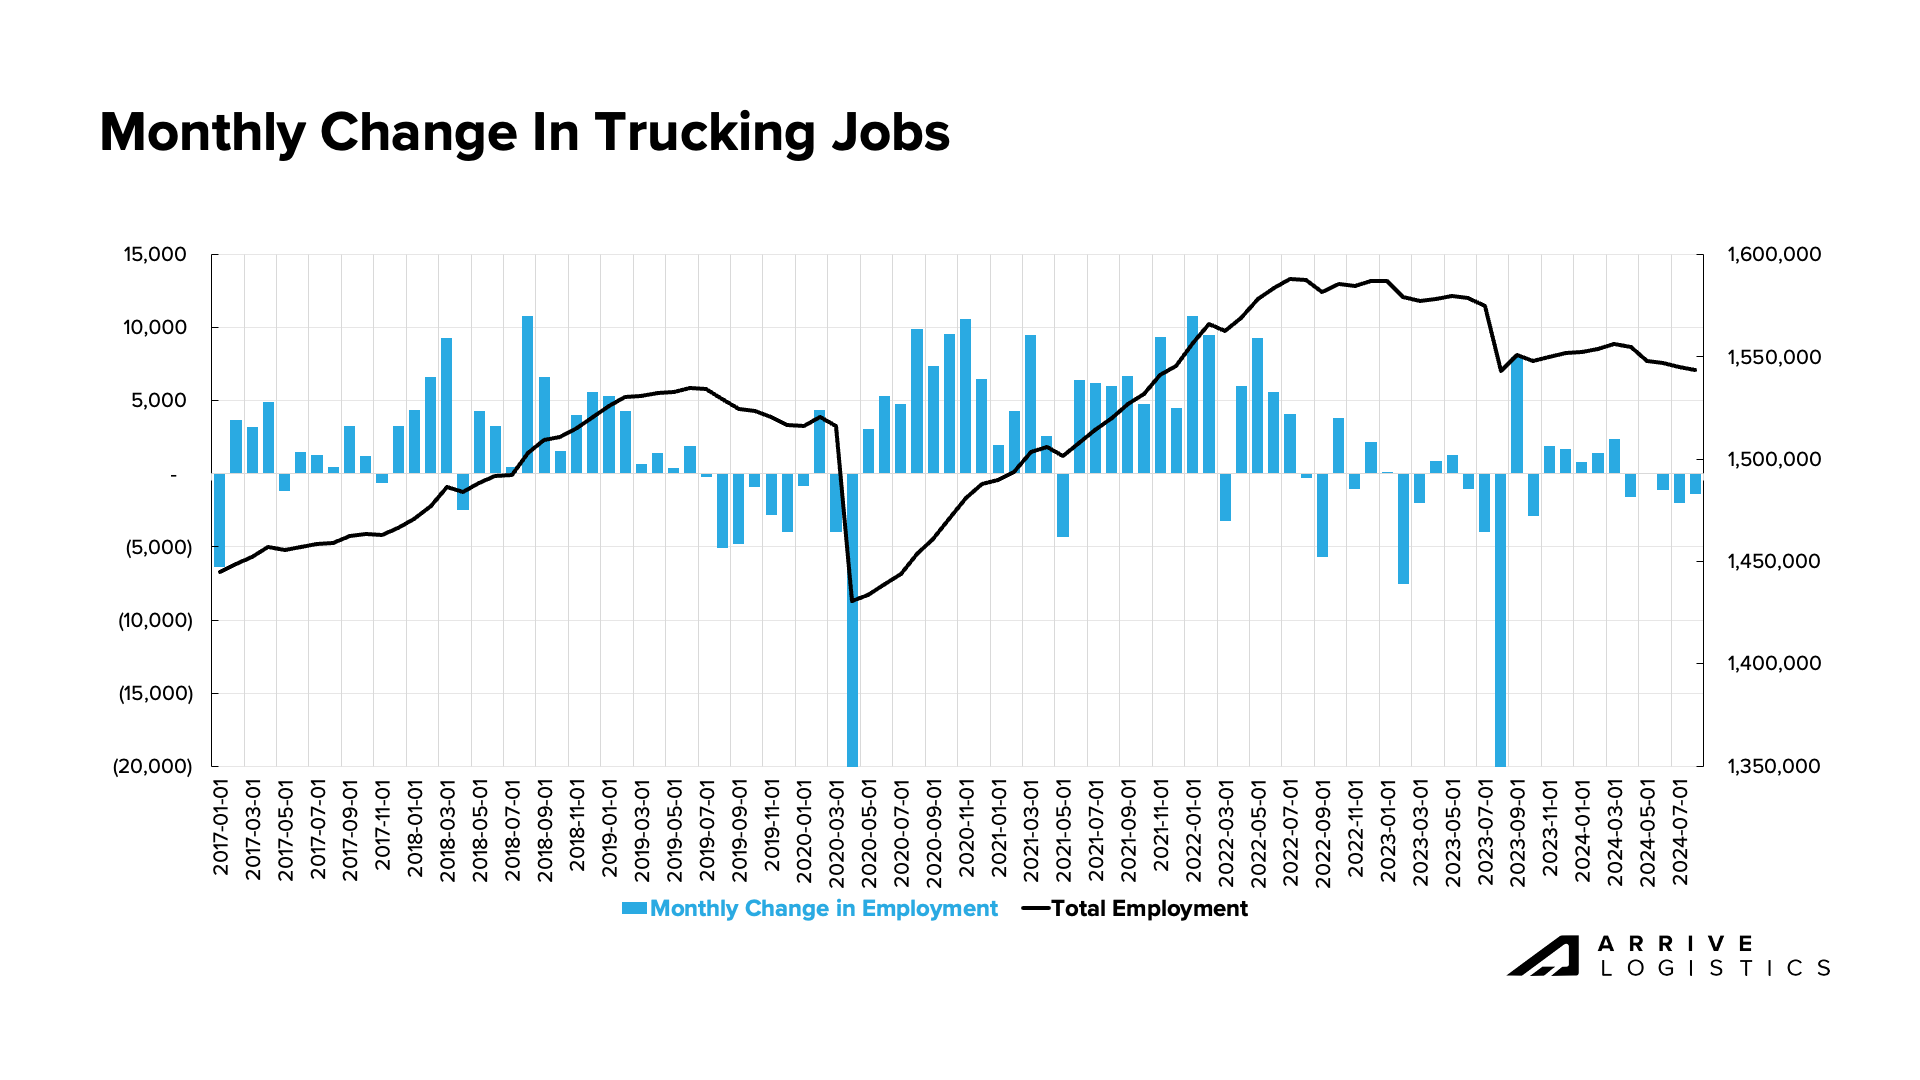
Trucking jobs fell by 1,400 in August due to persistently poor spot rate conditions and increased competitiveness on contractual rates. This was the fifth consecutive month of seasonally adjusted job losses, with nearly 13,000 jobs lost since the April report. Anecdotally, there is no reason to expect much volatility in the spot market through the remainder of the year based on how easily supply handled Labor Day demand. Our forecast shows that significant rate recovery is still some time away, so we expect a continued reduction in carrier market participants.
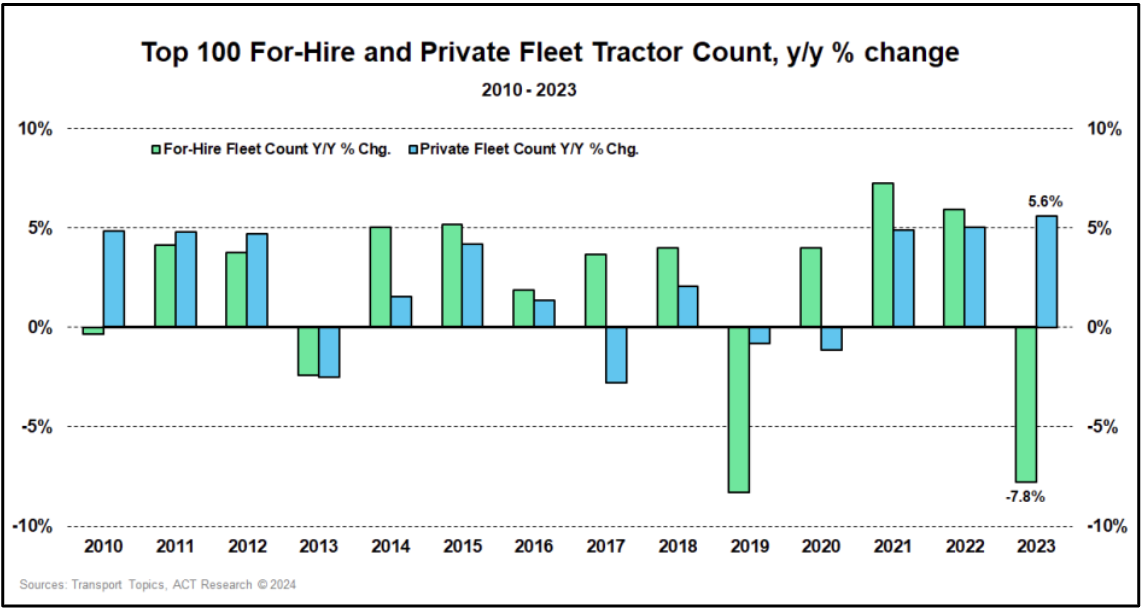
One of the more notable capacity trends of 2024 has been private fleets’ ongoing expansion investments. In 2023, the top 100 private fleets grew tractor counts by 5.6%, while the top 100 for-hire fleets decreased tractor counts by 7.8%. Investments continued in 2024 based on anecdotes from Arrive’s private fleet network, who say expansion has helped them capture significant value. As a result, private fleet shipments are up around 5% year-over-year, while overall freight shipments are down around 1% year-over-year, indicating that private fleets have gained meaningful market share.
This trend could endure deep into 2025 as private fleets continue to secure volumes that historically would be available in the for-hire market. In turn, for-hire spot market demand could suffer, as could opportunities for carriers seeking backhauls to their outbound markets. These factors would create downward rate pressure and easing spot market supply conditions.

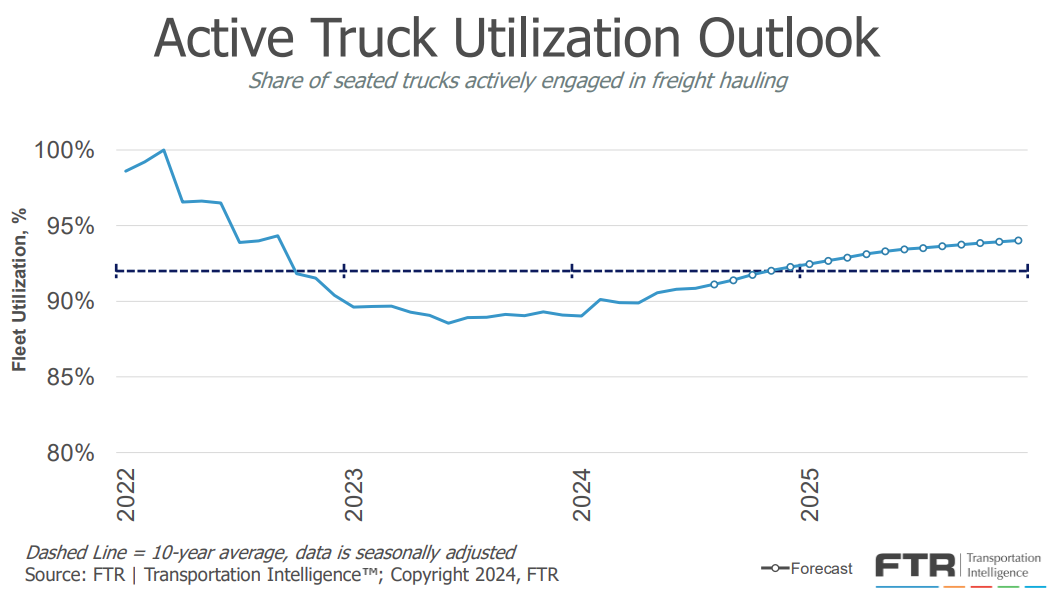
FTR’s latest truck utilization forecast shows 91% utilization, just below the 10-year average of 92%. The updated forecast received a meaningful downward revision from the one prior, which showed utilization exceeding 92% in late summer. If conditions hold, utilization will hit 92% toward the end of the year, and by Q2 2025, it should pass 93% due to pullbacks in equipment orders and stable driver employment.
What’s Happening: A potential port strike amid high import volumes could disrupt markets.
Why It Matters: Increased activity around port cities could create regional delays and rate volatility.
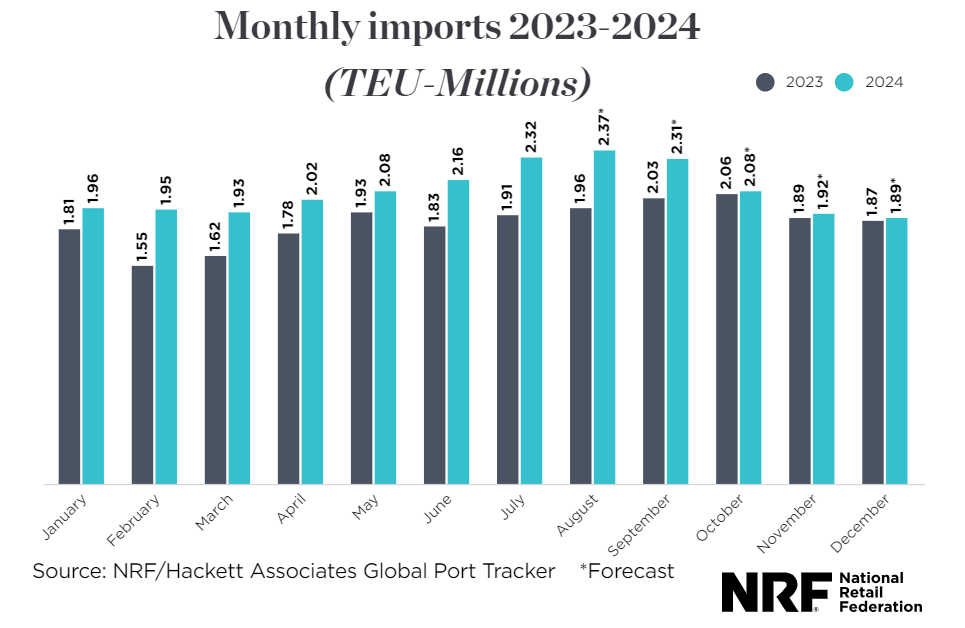
Forecasts continue to show stable freight volume. Both upside and downside risks are present, but there is no clear indication that demand shifts will impact the market in the near term. The latest National Retail Federation (NRF) forecast calls for year-over-year import increases for the remainder of 2024, with 25 million TEUs expected in total. This would be an increase of 12.1% from 2023 and half a million less than in 2022.
However, there is a relatively high likelihood that East and Gulf Coast port workers will strike on October 1st, leading to delays and disruptions. Some retailers are rushing to bring in shipments before the strike or rerouting them to West Coast ports. If a lengthy strike occurs, shipment backlogs will grow and cause volatility once it ends.
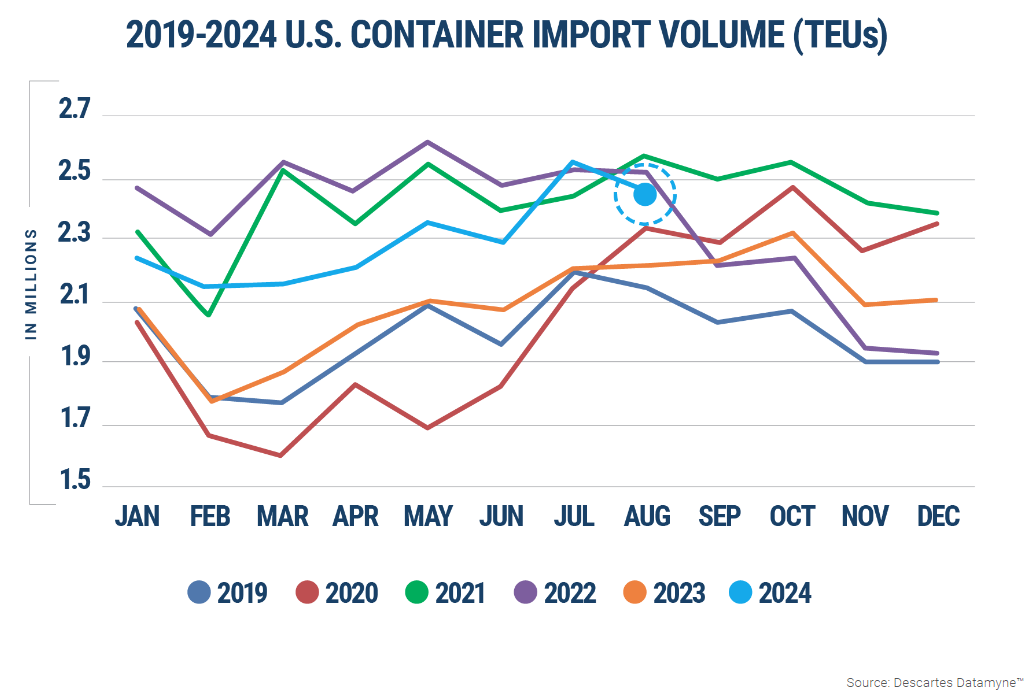
August import data from Descartes tells a story similar to the NRF forecast, showing import levels well above 2023 despite a significant pullback in August. Descartes also notes that imports through the first eight months of 2024 are up nearly 16% from the same time in 2019.
Elevated import numbers are contributing to stable volume across modes. However, despite this significant year-over-year growth, we don’t expect any major changes in the truckload rate environment heading into Q4.
Economic trends in freight-related industries remain relatively soft. Manufacturing is flat year-over-year and housing starts are down 16% year-over-year. However, there are positive signs in the general economy, as retail activity had its best month since January 2023 and was up 2.7% from July of last year.

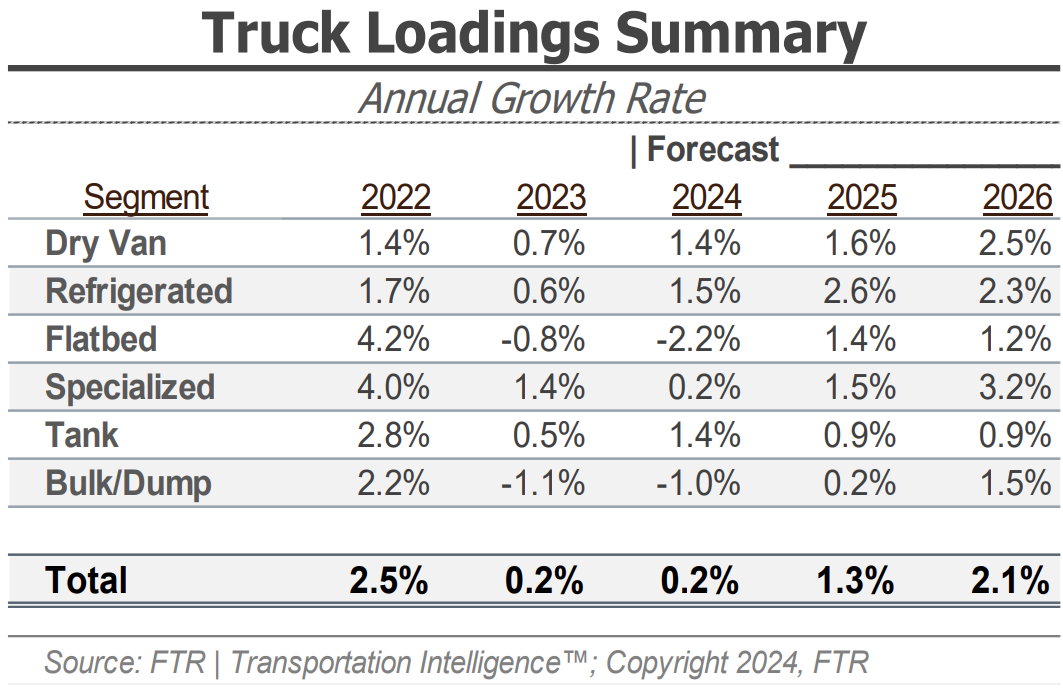
FTR’s latest truck loadings forecast received a significant downward revision that now projects loadings to grow by just 0.2% year-over-year in 2024; the previous forecast called for a 1.6% annual increase. A dry van forecast adjustment from 2.4% to 1.4% drove the revision. FTR noted broad-based industrial sector stagnation and downward revisions across almost all commodities since the previous outlook. Refrigerated loads are now expected to grow by just 1.5%, down from 2.7%, due to weakening food and non-food commodity trends. The largest annual decline is still expected to be in the flatbed market, with 2024 loadings expected to fall by 2.2% from 2023.
Ultimately, FTR still believes the market will end the year with more truck loadings than in 2023, albeit by only a small margin. These trends support the low likelihood of a significant market shift in 2024, with potential improvements coming in 2025.
What’s Happening: The Fed cut interest rates for the first time in four years.
Why It Matters: While no immediate impacts are likely, additional interest rate cuts could spur additional spending in 2025.
Earlier this month, the Fed cut interest rates for the first time in four years. The cut of 50 basis points indicates that the Fed believes the economy has slowed and they must now spur economic activity. Future cuts are the primary upside forecast risk, especially if several more happen this year. Lower interest rates should drive spending and positively impact freight volumes, but we are unlikely to see the impact until at least the first half of 2025.
Inflation continues to trend in the right direction, reaching 2.5 in August, the lowest level since the pandemic began. Falling inflation rates are a welcome sign for consumers, although it still may be some time before spending activity shifts meaningfully.
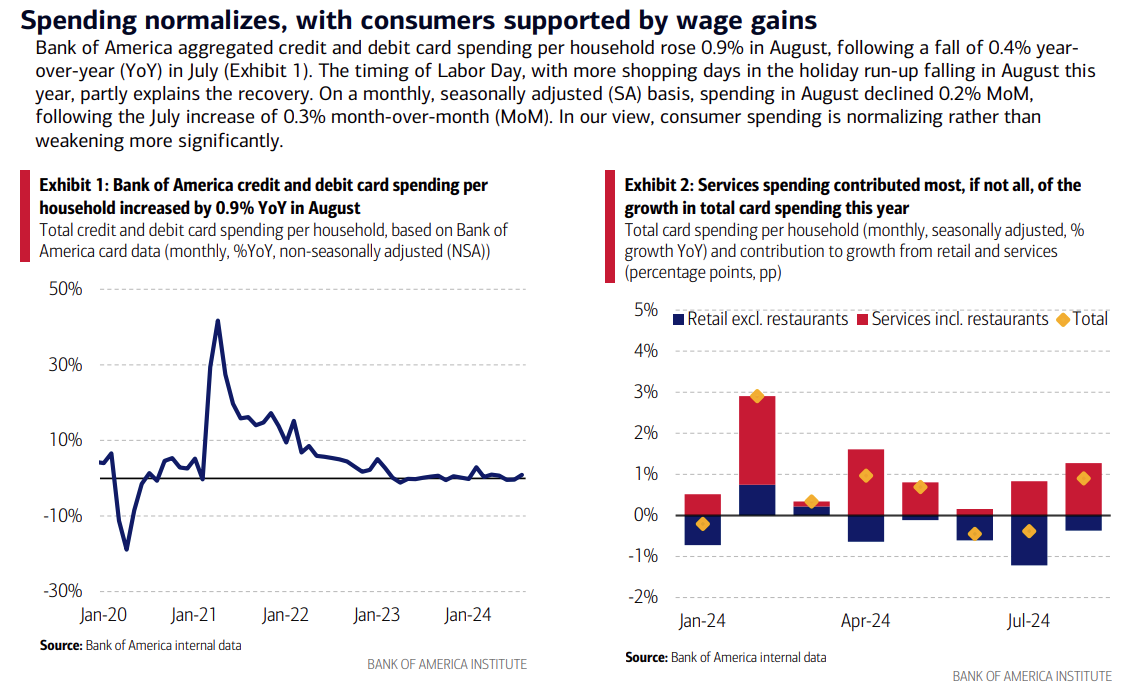
Bank of America continues to show credit card spending stability, reporting a 0.9% year-over-year increase in August that was aided by the timing of Labor Day, which allowed for more “shopping days” this year. As a result, seasonally adjusted spending was down 0.2% in August. Goods spending declined year-over-year, with only February and March showing year-over-year growth. Additionally, back-to-school spending was weaker than in 2023, which could have resulted from declining inflation.
Ultimately, economic spending trends look stable. Declining interest rates indicate potential spending growth in 2025, which would positively impact freight volumes.
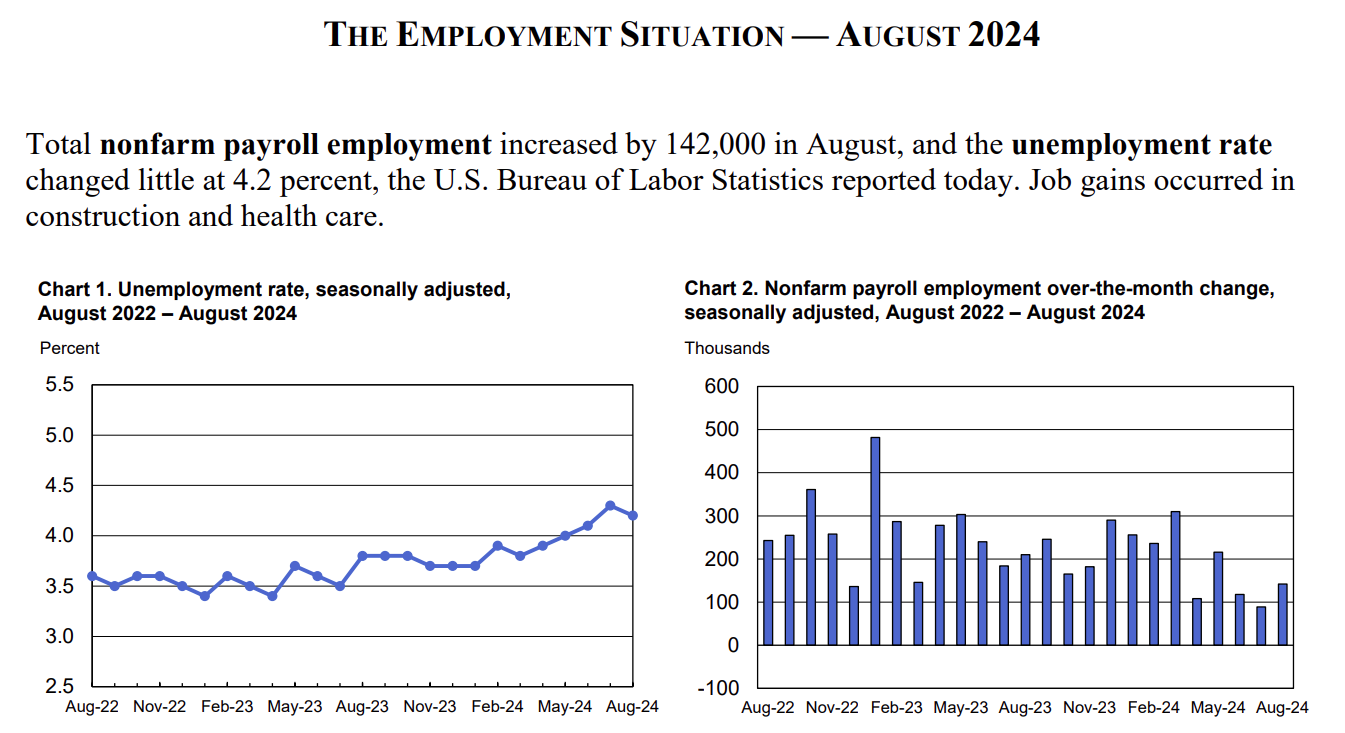
The labor market remains in flux. Year-over-year, the unemployment rate rose from 3.8% to 4.2%, or 6.3 million people to 7.1 million. These numbers show cracks in the labor environment, with potential downside risk if they worsen. More interest rate cuts should mitigate that risk, but it is too soon to know for sure. We can expect lower consumer spending and declining freight demand if the employment market worsens.
Freight market conditions are what we expected following Labor Day and a soft August. Rates followed seasonal expectations and should continue to for the remainder of 2024. Demand is stable, but the contract market is stronger than the for-hire market. Supply is plentiful, and private fleets’ investment in expansion has enabled them to take more spot market share.
Ultimately, our outlook for the remainder of the year is unchanged: Seasonal patterns should hold throughout Q4. The potential for severe weather and port strikes presents risks, but the environment is unlikely to change significantly in the coming months.
The Arrive Monthly Market Update, created by Arrive InsightsTM, is a report that analyzes data from multiple sources, including but not limited to FreightWaves SONAR, DAT, FTR Transportation Intelligence, ACT Research, Morgan Stanley Research, Bank of America Internal Data, Journal of Commerce, Stephens Research, National Retail Federation and FRED Economic Data from the past month as well as year-over-year. We understand market data is vital in making real-time business decisions. At Arrive Logistics, we are committed to giving you the data and insights you need to better manage your freight.

