Need Help
close button

How can we help?

Select One:
Arrive Insights™

June 2025 Freight Market Update

Table of Contents

Market Memo

From the Desk of David Spencer

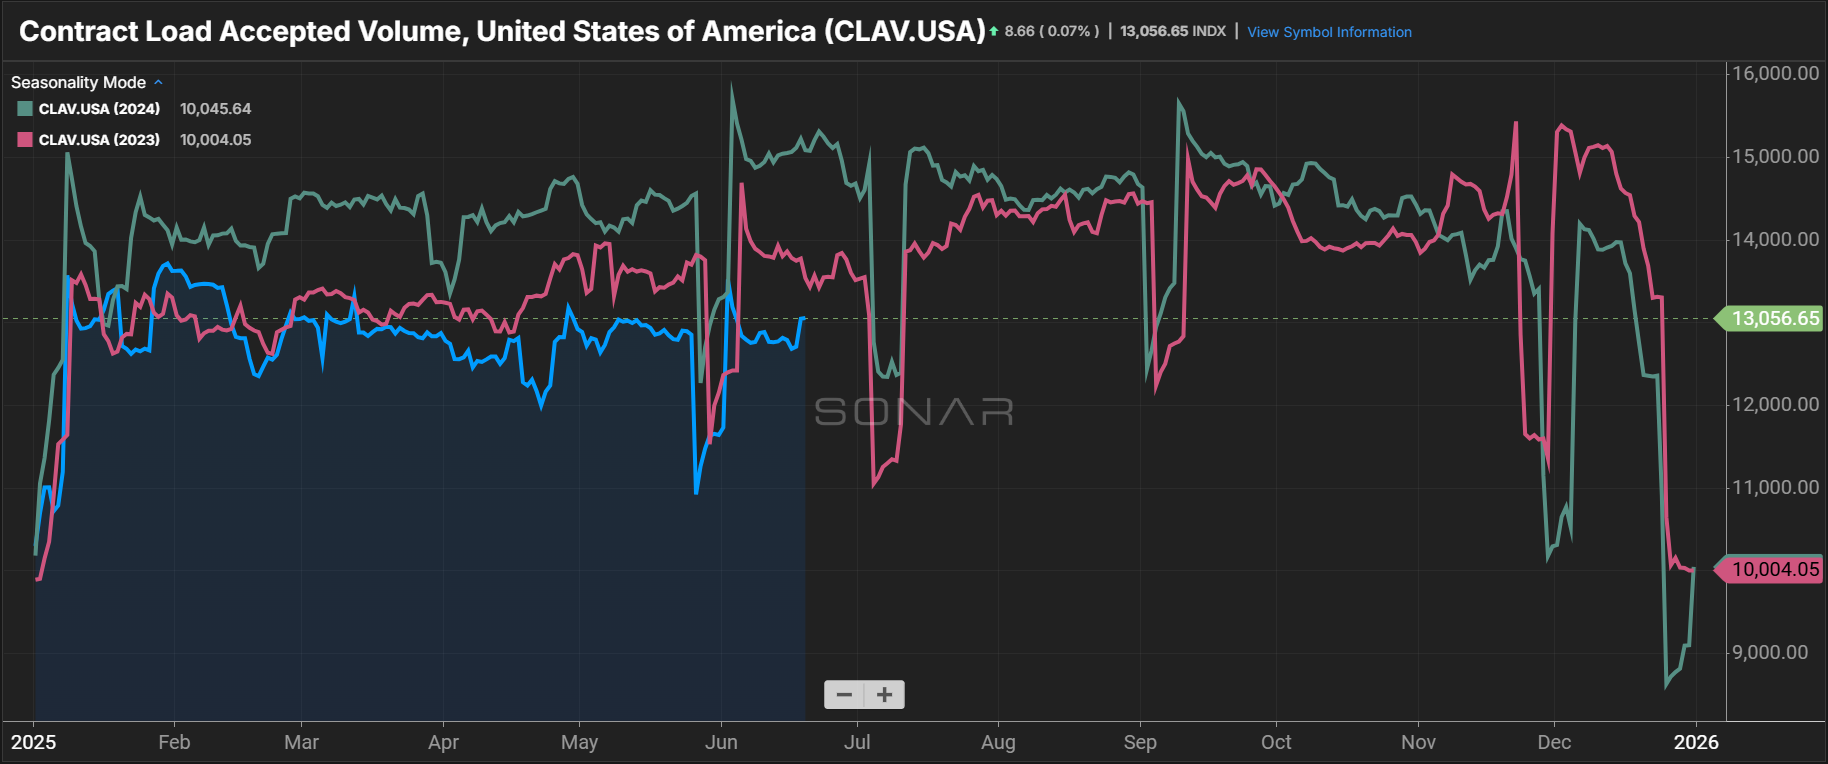
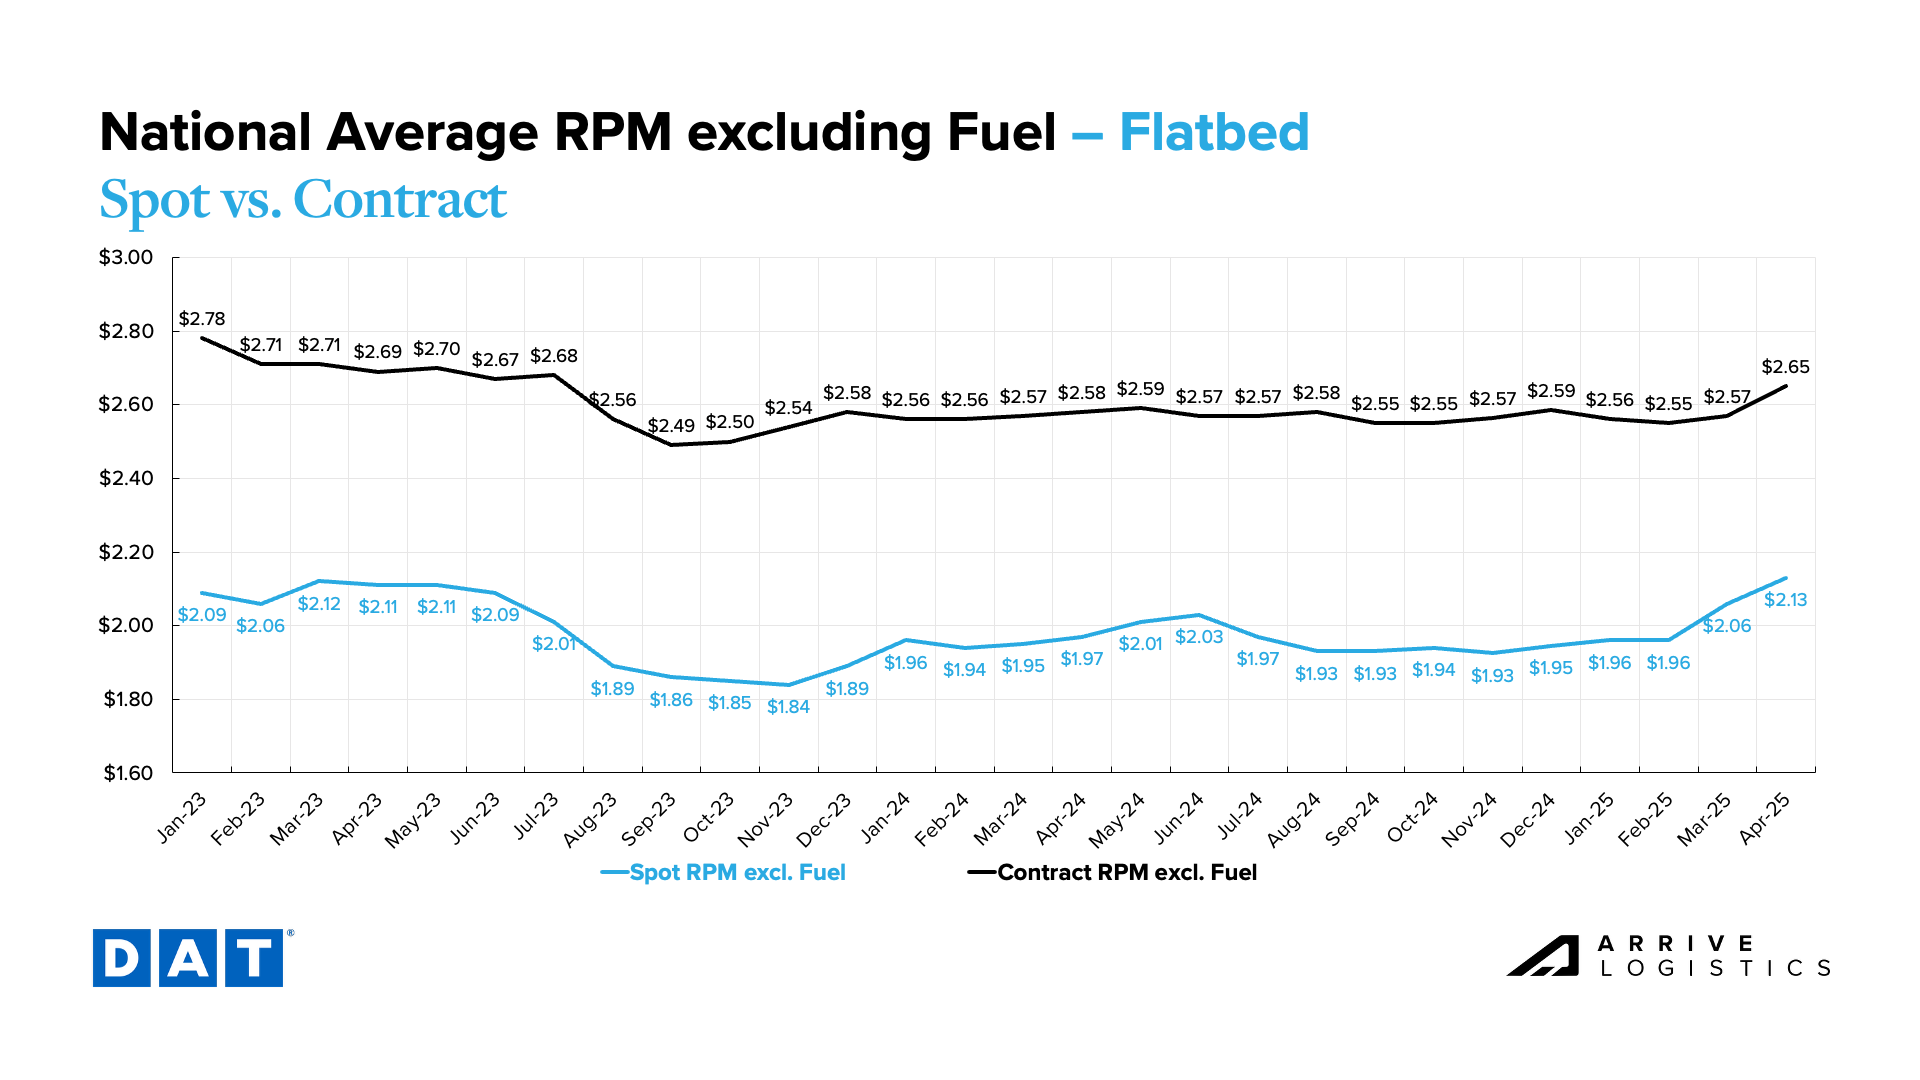
May data showed continued seasonality in a freight market that remains in somewhat of a holding pattern. Aside from temporary volatility as supply contracted around Roadcheck Week, the narrative of the last few months held true: low volume, persistently strong supply and spot rates that settle as quickly as they spike.

While we don’t anticipate a near-term demand disruption significant enough to trigger sustained inflationary conditions, several variables could shape the market’s trajectory through the remainder of peak season.

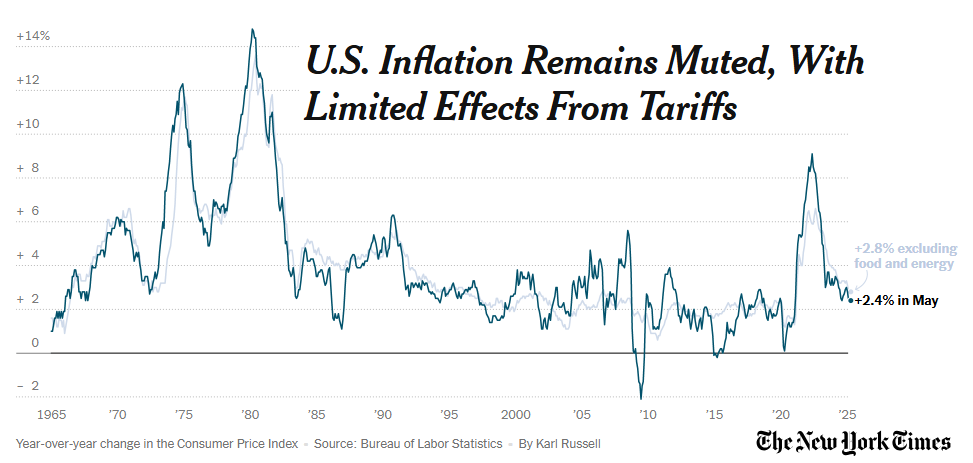
First, while it’s challenging to predict a precise outcome, the pending court decision on the legality of elevated U.S. tariffs could prove to be a critical turning point in the ongoing trade war. The impact of increased U.S.-China tariffs has started to materialize in the data, particularly on the import side. That said, the recent reduction of some tariffs has temporarily eased pressure, and forward-looking import data—on orders placed but not yet shipped—suggests a volume recovery may be on the horizon.

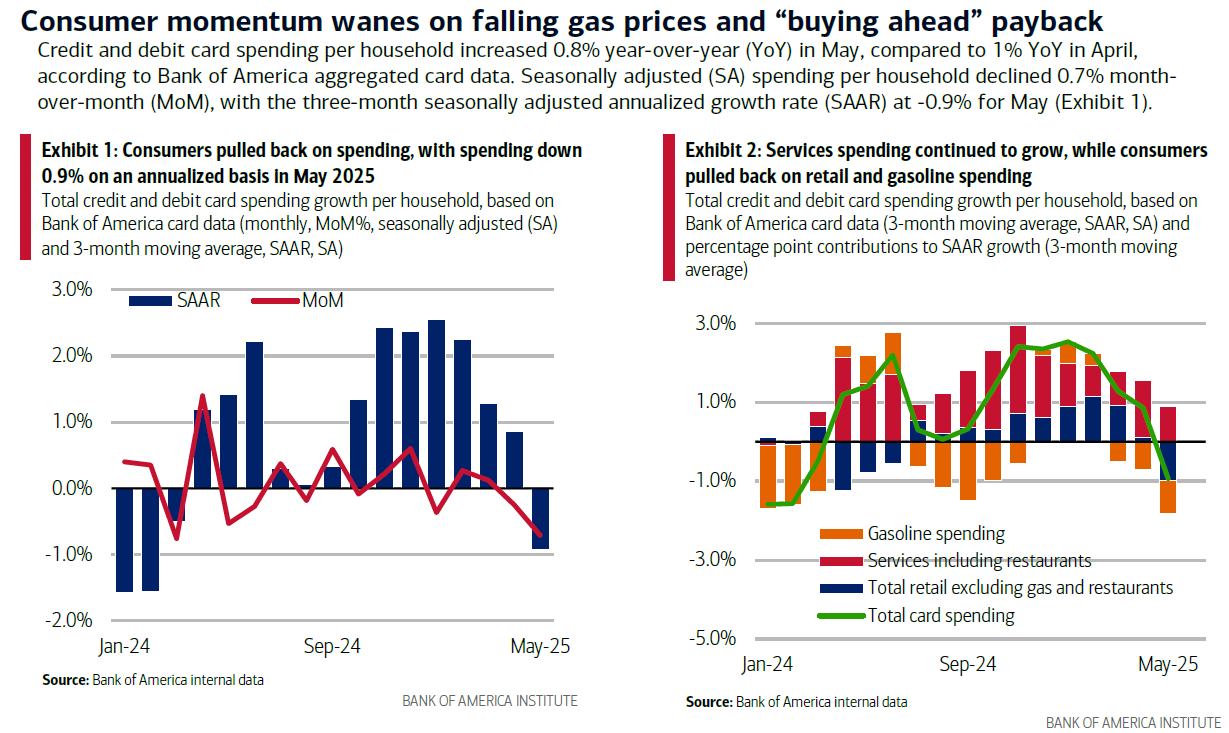
However, economic headwinds are also a key factor, as rising prices have led to cooling consumer spending that could put demand at greater risk of faltering.

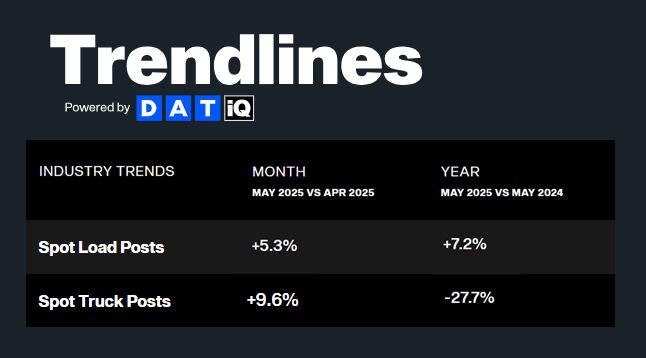
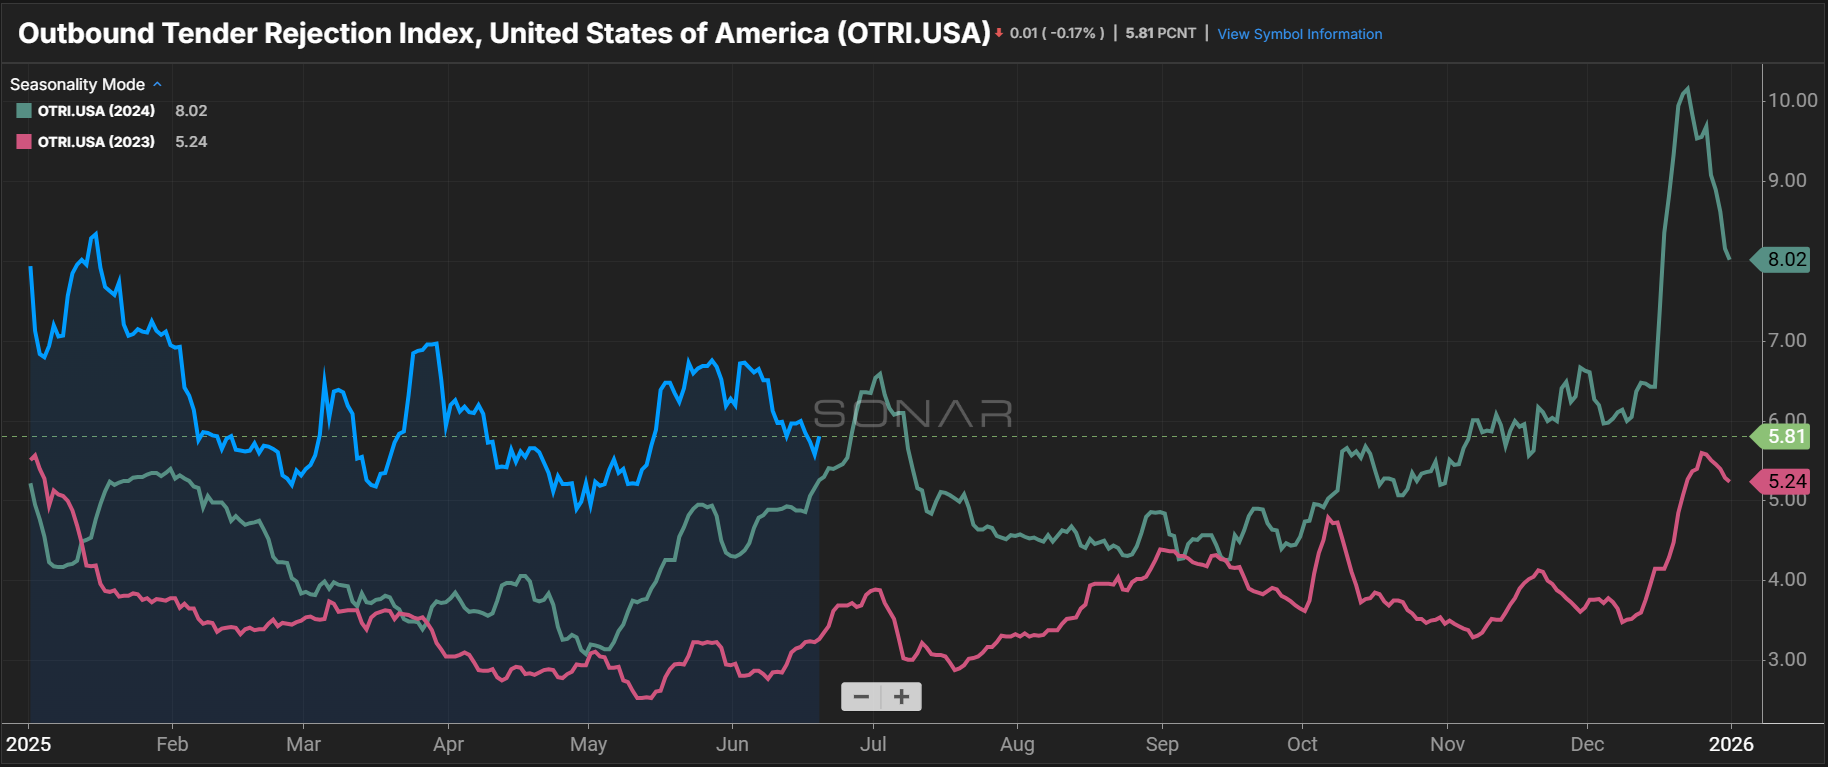
Meanwhile, resilient carriers are supporting strong supply levels amid ongoing volume declines, limiting upward rate pressure even as spot activity briefly increased last month. If sluggish demand and elevated capacity levels persist, it could limit any upside market potential in the coming months. 

New and forthcoming regulations from the Federal Motor Carrier Safety Administration—such as identity verification and English proficiency requirements—might also begin to reduce available capacity, though the exact timing and impact of the changes remain uncertain.

With the May market test behind us, all eyes now turn to how conditions will shape up amid these variables ahead of the Fourth of July holiday. 

For a closer look at what’s happening across demand, supply and rates, keep reading.

Arrive Logistics VP of Market Intelligence David Spencer Headshot
David Spencer
VP of Market Intelligence

Key Takeaways

  • Demand weakness remains a central theme in the truckload market, as imports dipped and manufacturing activity contracted further in May.
  • Although end-of-month positioning and the Fourth of July will likely bring some rate volatility, tight conditions seen in late May have given way to seasonal underperformance so far in June, with both tender rejections and spot rates continuing to decline.
  • Overall capacity levels remain stable, but persistently low equipment orders could lead to a reduction in the tractor population.
  • Enforcement of the Executive Order on English language proficiency is set to begin June 25. While the exact nature of enforcement remains unclear, the change is expected to cause some capacity attrition over time.
  • A recovery in import ordering patterns amid the pause in elevated China tariffs is expected to drive a rebound in import-related truckload demand in the coming weeks and months, though the duration of that rebound remains uncertain.
  • Spot rates are expected to climb heading into the Fourth of July, but should normalize relatively quickly after the holiday as broader demand weakness continues.
  • The ongoing conflict in the Middle East is likely to drive fuel prices higher, increasing freight costs for shippers and financial pressure for carriers.
  • A resilient economy and steady consumer spending are helping stabilize freight demand. Still, ongoing uncertainty and irregular, tariff-driven shipping patterns are contributing to what is expected to be a prolonged freight recession. Greater clarity on tariffs and broader economic conditions should help restore more typical behavior from both consumers and businesses once established.

Truckload Demand

Looking Back

Spot activity increased during Roadcheck Week, though it was largely due to reduced capacity on the road versus surging demand. Otherwise, volume trends remained soft. Load volumes declined on both a year-over-year and two-year basis, extending the persistently weakening demand trends throughout this spring.

Import volumes also dropped sharply from April to May, driven primarily by the initial round of high tariffs on Chinese goods, which slowed inbound shipments and pushed total import levels well below early-year benchmarks. The result was a quieter May than normal, even after adjusting for seasonality.

Looking Ahead

While brief periods of volatility should continue as peak season marches on, near-term demand is expected to remain under pressure through the end of the quarter. However, recent import order activity has led to at least a short-term recovery in volume, with the potential for further gains in June and July if overseas ordering patterns continue.

Even so, domestic demand faces additional headwinds. Manufacturing activity contracted for the third straight month, with production, new orders and backlogs all trending down. Combined with elevated prices and cooling consumer spending, these trends suggest limited upside for freight volumes in the coming months.

Contract Load Accepted Volume, SONAR

Chart Notes
  • Contract volumes continue to show weakness: FreightWaves SONAR data shows accepted contract volumes have trended downward since late Q3 2024 and remained 13%-15% lower year-over-year through early June. Easing demand continues to shift the supply-demand balance, keeping rates relatively stable.

DAT Trendlines

Chart Notes
  • Reefer and flatbed volumes drove spot demand in May, while Roadcheck Week triggered significant capacity reductions: According to DAT, total spot volumes rose 7% year-over-year, led by a 15% increase in reefer and a 12% increase in flatbed postings. Van volumes held flat. Equipment postings declined 28% year-over-year in May—the 23rd consecutive monthly drop—as many carriers opted to sit out during Roadcheck Week.

Cass Freight Index Report – May 2025

Chart Notes
  • Cass Freight Index illustrates recent demand weakness: May volumes declined more than expected for this time of year, likely due to tariff impacts on imports and pre-tariff inventory builds earlier in 2024. The index’s one- and two-year stacked changes—down 3.6% and 7.5% in April—fell further in May as a result.

Cass Freight Index Shipments Forecast – May 2025

Chart Notes
  • Continued demand weakness likely in 2025: In their latest truckload demand forecasts, ACT Research and Cass acknowledged that recent progress in trade negotiations with China may lift near-term volumes slightly, but still project negative demand growth through mid-2026 as inflation and weaker consumer spending power reduce goods consumption.

Descartes U.S. Container Import Volume

Chart Notes
  • Imports decline in May: Descartes data shows imports fell 9.7% month-over-month and 7.2% year-over-year, reflecting the impact of elevated tariffs on China. Imports from China dropped more sharply, down 20.8% month-over-month and 28.5% year-over-year.

Inbound Ocean TEUs Volume Index, SONAR

Chart Notes
  • Import orders show strong initial recovery amid tariff pause: The pause on elevated tariffs on China spurred a sudden rise in import orders to levels above prior years, signaling a potential near-term demand surge. However, the recovery may be short-lived, with inventory levels high and consumer goods spending weakening.

Manufacturing at a Glance, Manufacturing ISM

Chart Notes
  • Manufacturing contracts: The ISM Manufacturing Index declined for the third straight month, with new orders, production and backlogs all showing contraction. As a key driver of freight activity, continued manufacturing weakness is likely to further pressure demand.

Monthly Business & Economic Highlights, FTR

Chart Notes
  • Economic forecasts lowered: Tariff-related risks and broader uncertainty are contributing to economic slowdowns. FTR analysts expect declining production and imports to further reduce freight demand, but noted that a recent court ruling and temporary stay on tariff enforcement complicate the outlook.

Truckload Supply

Looking Back

Normal seasonal supply trends also continued to play out in May and early June. Van and reefer load-to-truck ratios and rejection rates rose during Roadcheck Week—both month-over-month and year-over-year—and remained elevated through Memorial Day before easing as capacity returned to the market. Meanwhile, the flatbed market has finally cooled from recent peaks.

Looking Ahead

Supply levels should hold steady through at least the end of the quarter. While some tightening is possible in the lead-up to July Fourth, market conditions will likely mirror those seen around Roadcheck Week and Memorial Day.

However, with new truck orders trending below replacement levels as private fleets and other carriers continue to dial back investment amid ongoing demand uncertainty, supply could face challenges if volume surges back later this year.

Outbound Tender Reject Index, SONAR

Chart Notes
  • Tender rejections easing throughout early June: After spiking in May during Roadcheck Week and Memorial Day, the SONAR OTRI shows rejections easing into mid-June. Slowing volumes have contributed to a prolonged early-month lull, though some short-lived volatility is still expected ahead of the end-of-month and quarter push leading into Independence Day.

Van Outbound Tender Rejection Index, SONAR

Chart Notes
  • Dry van rejections trail typical mid-June trends: Although conditions are expected to tighten at the end of the month, rejections have continued to fall, bucking the mid-June increases seen in 2023 and 2024. The trend suggests weakening demand is limiting peak season volatility, at least for now.

Reefer Outbound Tender Rejection Index, SONAR

Chart Notes
  • Reefer tender rejections less affected by tariff disruptions: Reefer rejections have followed more typical seasonal patterns than van. Tightness remains concentrated in key summer produce regions, particularly the Southeast and central California.

Flatbed Outbound Tender Rejection Index, SONAR

Chart Notes
  • Flatbed rejection rates return to normal levels: Tariff-related disruptions aligned with the start of open deck season, putting pressure on routing guides early in the year. However, conditions eased rapidly in late May and early June.

Van Load-to-Truck Ratios

Reefer Load-to-Truck Ratio

Chart Notes
  • Dry van and reefer ratios rise in May: Van and reefer load-to-truck ratios followed typical seasonal trends and remained elevated compared to prior years, mirroring tender rejection patterns.

Flatbed Load-to-Truck Ratios

Chart Notes
  • Flatbed load-to-truck ratios ease but remain elevated: Flatbed capacity tightened significantly in early 2025. While conditions softened in May, overall tightness remains well above recent years, according to DAT.

Morgan Stanley Dry Van ONLY Truckload Freight Index

Chart Notes
  • Morgan Stanley index shows strong seasonality for van and reefer, softer trends for flatbed: Van and reefer indexes are trending well above the long-term average, with van showing a strong response to Roadcheck Week. Both are beginning to revert closer to long-term averages but continue to outperform them. Flatbed conditions have eased in recent months and are now trending near 2024 levels.

Morgan Stanley Reefer Truckload Freight Index

Morgan Stanley Flatbed Truckload Freight Index

Carrier Revocations, New Carriers & Net Change in Carrier Population, FTR

Chart Notes
  • Carrier population grows in May: The carrier count rose by 600 in May, marking the second consecutive increase and the largest since September 2022, according to FTR.

Class 8 Tractor Net Orders, ACT Research

Chart Notes
  • Tractor orders recover slightly but remain below replacement levels: Class 8 tractor orders rose from 4,019 in April to 7,500 in May, but remained 32% lower year-over-year. With May’s pace annualizing to roughly 128,000 units, orders continue to fall short of the estimated 150,000 needed to support fleet replacement.

Monthly Change in Trucking Jobs, FRED Economic Data

Chart Notes
  • May employment positive year-over-year for first time since April 2023: Despite a slight decline in May, total employment remains up nearly 11,000 jobs since October 2024 and 9,300 over the past three months. However, softening demand may drive pullbacks later in the year.

Active Truck Utilization, FTR

Chart Notes
  • Truck utilization dips further: FTR’s truck utilization forecast declined again as expectations for loadings were revised downward, but analysts noted some upside potential if ongoing freight weakness accelerates driver attrition.

U.S. Class 8 Tractors Backlog & Backlog/Build Ratio, ACT Research

Chart Notes
  • Backlog-to-build ratio falls: Class 8 tractor backlogs declined by about 6,500 units in May, reducing the backlog-to-build ratio from 6.1 months to 5.0 months.

For-Hire Driver Availability Index, ACT Research

Chart Notes
  • Driver availability softens further: March marked the 35th consecutive month of softening in ACT Research’s Driver Availability Index, which rose 3.0 points. A key driver is owner-operators relinquishing authority and moving to larger fleets.

For-Hire Trucking Survey: Supply-Demand Balance, ACT Research

Chart Notes
  • Short-lived May tightness improved market balance: Capacity reductions during Roadcheck Week, coupled with flat volumes, brought greater balance to the market in May. However, that balance may prove temporary as conditions will likely soften again after July Fourth.

Truckload Rates

Looking Back

Truckload rates followed normal seasonal patterns in May. Weekly rate data showed a similar trend to last year, with elevated late-month activity giving way to softer conditions in early June as the urgency around Roadcheck Week and Memorial Day subsided.

Still, with tender rejection rates fading toward 2024 levels and only regionalized seasonal demand surges making an impact to rates, national trends continue to reflect the broader narrative of weakening volumes and ample capacity.

Looking Ahead

July Fourth falling on a Friday this year will create a short shipping week that could drive significant volatility ahead of the holiday weekend. Given the prevailing market narrative, though, any rate increases will likely fade quickly as conditions normalize and enter a period of seasonal softening through July and August. 

The only near-term variable that could delay that downturn is CVSA Operation Safe Driver Week (July 13–19), which may reduce capacity if enforcement is particularly strict this year.

Notably, fuel prices have also climbed 20% over the past month, and further increases could follow if the conflict in the Middle East escalates.

Truckstop Weekly National Average Spot Rates

Chart Notes
  • Rates follow seasonal norms with signs of softening: Van and reefer rates peaked around Roadcheck Week, mirroring 2024 trends, and then declined more quickly in the weeks that followed. As with tender rejections, early June shows slight underperformance to typical seasonal patterns, signaling continued demand weakness.

DAT Monthly Rate Trends

Chart Notes
  • Van rates rise into end-of-quarter push: All-in dry van rates rose $0.03 per mile in May and are up another $0.02 heading into the end-of-month and end-of-quarter push before the Fourth of July.
  • Reefer and flatbed rates hold steady in June: Reefer rates climbed $0.08 in May but slipped $0.01 in mid-June. Flatbed rates remain stable, holding steady from April through mid-June.

DAT Fuel Trends

Chart Notes
  • Diesel prices trend downward, but increases likely: June diesel prices were relatively low through the first half of the month, but rising crude prices—driven by escalating conflict in the Middle East—are expected to push pump prices higher in the coming weeks.

DAT Dry Van National Average RPM Spot vs. Contract

Chart Notes
  • Dry van linehaul rates follow seasonal norms: As is typical for this time of year, spot linehaul rates remain elevated from pre-Roadcheck Week lows. Early June softness has kept month-over-month trends stable, but expected late-month increases could shift that. Year-over-year, spot rates rose 1.9% from $1.59 per mile in May 2024 and are currently even with June 2024 levels.
  • Spot-contract gap tightens slightly: As spot rates climbed in May and June, the dry van spot-contract gap narrowed from $0.43 per mile in April to $0.38 in early June. A smaller gap suggests greater market sensitivity to disruption, though the current reading still signals limited risk of sustained volatility.

DAT Temp Controlled National Average RPM Spot vs. Contract

Chart Notes
  • Reefer linehaul rates rise with peak season demand: Spot linehaul rates climbed from $1.86 per mile in April to $1.95 in May 2025. Year-over-year, rates were up 0.5% from $1.94 per mile in May 2024.
  • Reefer spot-contract gap widens as spot rates fall: As spot rates picked up in May and June, the reefer spot-contract gap narrowed slightly from $0.45 per mile in March to $0.36 in May and currently sits at $0.39 in early June. A narrower gap typically indicates greater market sensitivity to disruption; however, the risk of sustained disruption remains low given the current reading.

DAT Flatbed National Average RPM Spot vs. Contract

Chart Notes

  • Flatbed linehaul rate growth holds steady: After strong early-season gains, flatbed spot linehaul rates have stabilized into June. Rates rose 5.5% year-over-year in May and are up 4.4% so far in June.

Economic Conditions

Looking Back

Economic conditions remained stable through May. Inflation ticked up slightly and led to higher prices, but the labor market was strong enough to stave off sharp spending declines. However, softening manufacturing and uncertainty around trade and monetary policy point to a muted economic outlook.

Looking Ahead

Labor market strength should continue to support consumer health through the end of the quarter, but if other downside risks continue on their current trajectory, freight volumes could be negatively affected.

Consumer Price Index, New York Times

Chart Notes
  • Prices rise just 0.1% in May as inflation softens: The May CPI reading eased more than expected, signaling continued progress on inflation. While the result is encouraging, tariffs are still expected to push prices higher later in the year. The Fed held rates steady in its latest decision, and continued inaction should limit any near-term freight demand impact from rate changes.

Bank of America Total Card Spending, Bank of America Consumer Checkpoints

Chart Notes
  • Signs of consumer spending weakness in May: Bank of America reported that seasonally adjusted household spending declined 0.7% month-over-month in May and rose 0.8% year-over-year. Analysts noted that the May slowdown could signal weakening consumer momentum, though the labor market continues to provide support.

Employment Situation – May 2025, U.S. Bureau of Labor Statistics

Chart Notes
  • Unemployment unchanged, payrolls increase: The unemployment rate has held within a narrow range of 4.0% to 4.2% since June 2024 and was unchanged from May 2025 to June 2025. A stable labor market continues to support healthy consumer spending, which should help sustain freight demand.

Navigate the freight market
with confidence.

Get this free report delivered straight to your inbox every month.

Download June 2025 Freight Market Update

Scott Sandager,
Chief Administrative Officer 

Scott Sandager is the Chief Administrative Officer at Arrive Logistics. He joined Arrive in 2018, bringing over 14 years of logistics and brokerage experience, with expertise in project and change management, organizational design, talent development and customer satisfaction. Scott previously held many diverse roles of increasing responsibility with AFN, a Chicago-based freight brokerage.

Subscribe to receive freight market updates​​

"*" indicates required fields


Subscribe to receive freight market updates

Quick Apply

"*" indicates required fields

Max. file size: 50 MB.

Arrive Carrier Requirements

Please have the following info ready to complete registration

  • MC, MX, DOT, or state reg #
  • Tax ID & W9 info
  • Cert of Insurance: $100k cargo, $1M Auto, & $1M commercial general liability coverage
  • Active Common or Contract Authority (365+ days)
  • Safety Rating of at least Satisfactory (or None)

Fraud Prevention

Freight fraud continues to impact our industry. We encourage shippers and carriers to reach out to Arrive immediately if there is ever a shipment in question that may be subject to fraud (including fictitious actors and websites). Arrive will not ask you to pay upfront for any dedicated lane or committed capacity program. If the offer you are receiving sounds too good to be true or unrealistic, it may be fraud. Arrive Logistics recommends verifying all communications come from our registered email domain is @arrivelogistics.com. Our 24/7 phone number is 888-861-0650 and our leadership team can also be reached at feedback@arrivelogistics.com.

Use of Cookies

We use cookies to enhance your browsing experience, serve personalized ads or content, and analyze site traffic. By continuing to use this website, you acknowledge and consent to our use of cookies as detailed in our privacy policy.

Get Access to the Shipper Portal

Current Customers

Already shipping with Arrive?

Connect with your representative to get access to your ARRIVEnow Shipper Portal. Can’t connect with your rep? Use this form to reach out.

New Customers

Not shipping with Arrive yet?

If you’re not an Arrive customer, please join our network to access the portal.

Carrier Scorecard Feedback

Contact Us

"*" indicates required fields

Matt Pyatt, Chief Executive Officer

Matt Pyatt is the Chief Executive Officer of Arrive Logistics. He co-founded Arrive with President Eric Dunigan in 2014 after building his career at Command Transportation. As CEO, he is responsible for overseeing the company’s financial health, strategic vision and culture, as well as building a scalable leadership team to support Arrive’s growth.

Request Arrive's SOC 2 Report

Eric Dunigan,
President & Co-Founder

Eric Dunigan is the President of Arrive Logistics. He began his career at Command Transportation before co-founding Arrive with Matt Pyatt in 2014. As president, he is responsible for driving revenue and growth, as well as leading the Strategic Partnerships team — a veteran group of supply chain experts who work with Arrive’s customers to reimagine their shipping strategy.

Arrive Logistics VP of Market Intelligence David Spencer Headshot

David Spencer,
VP of Market Intelligence

David Spencer is the Vice President of Market Intelligence at Arrive Logistics. David joined Arrive in 2017 after spending six years at AFN focused on business intelligence. His department provides critical market data and expert analysis to internal teams and publishes monthly market updates for shippers and carriers under the Arrive Insights banner.

Andrew Clarke, Board Chair,
Arrive Logistics and Global Critical Logistics

Andrew Clarke is Board Chairman for Global Critical and DCLI, Inc., and a board member for Arrive Logistics and Element Fleet Management Corp. His 20 years of global transportation and logistics experience include time as CFO of C.H. Robinson, CEO of Panther Expedited Services, Inc. and SVP and CFO roles at Forward Air Corporation.

Dean Croke,
Principal Analyst
at DAT Freight and Analytics

Dean Croke is a Market Analyst at DAT Solutions, where he focuses on freight market intelligence and data analytics. His 35 years of experience with data analytics, transportation, supply chain management, mining and insurance risk management include time as co-founder of FleetRisk Advisors and in a number of other high-level roles with FreightWaves, Spireon, Lancer Insurance, Omnitracs Analytics (formerly Qualcomm) and more.

Asanka Jayasuriya,
CTO and Partner at 8VC

Asanka Jayasuriya is the CTO at 8VC. He is an accomplished engineering and product leader with 20+ years of experience in the cloud. He has a strong background in enterprise SaaS, PLG products, infrastructure, and security. Notably, he served as CTO and SVP of Engineering at SailPoint, leading their successful transition to the cloud and successful exit event. He also held senior leadership roles at InVision, Atlassian, and Amazon, driving growth, operational excellence, and innovation. At 8VC, Asanka works with the entrepreneurs and leaders in our portfolio as a virtual CTO supporting their growth.

Chad Eichelberger,
President at Reliance Partners

Chad Eichelberger is the President of Reliance Partners. Since 2015, he’s leveraged his extensive experience in risk management, compliance, best practices and contracts to lead the company’s logistics and truck insurance strategy and operations. Chad was previously the President of Access America Transport, where he led the company from $8M to over $600M in revenue.

Barry Conlon,
CEO & Founder at Overhaul

Barry Conlon is the CEO and founder of Overhaul, the global leader in active supply chain risk management and intelligence. With a remarkable career spanning over 30 years in supply chain security, he is widely regarded as a trailblazer in modern-day supply chain security standards and best practices.

Tim Denoyer,
VP and Senior Analyst at ACT Research

As VP and Senior Analyst at ACT Research, Tim analyzes commercial vehicle demand and alternative powertrain development (i.e. electrification), and authors the ACT Freight Forecast, U.S. Rate and Volume Outlook. He previously spent fifteen years in equity research focused primarily on the transportation, machinery, and automotive industries, and co-founded leading equity research firm Wolfe Research.

Download this Report

"*" indicates required fields

Add me to the monthly distribution