"*" indicates required fields
"*" indicates required fields
"*" indicates required fields

This document contains our comprehensive outlook for national dry van and reefer truckload rates for November 2022 through December 2023. The Arrive Insights® team generated this forecast through a combination of extensive historical research and output from the predictive models built into ARRIVEnow, our proprietary technology platform.
Successfully navigating freight market ebbs and flows begins with a basic understanding of the relationship between rates and the unique components of truckload supply and demand. Simply put, high or increasing demand and tight capacity will cause upward rate pressure, whereas low or easing demand and ample available capacity will drive rates down.
By tracking directional trends for truckload demand (volume) and available capacity (trucks) in the market at any given time, we can predict rate trends with a high degree of accuracy and consistency.
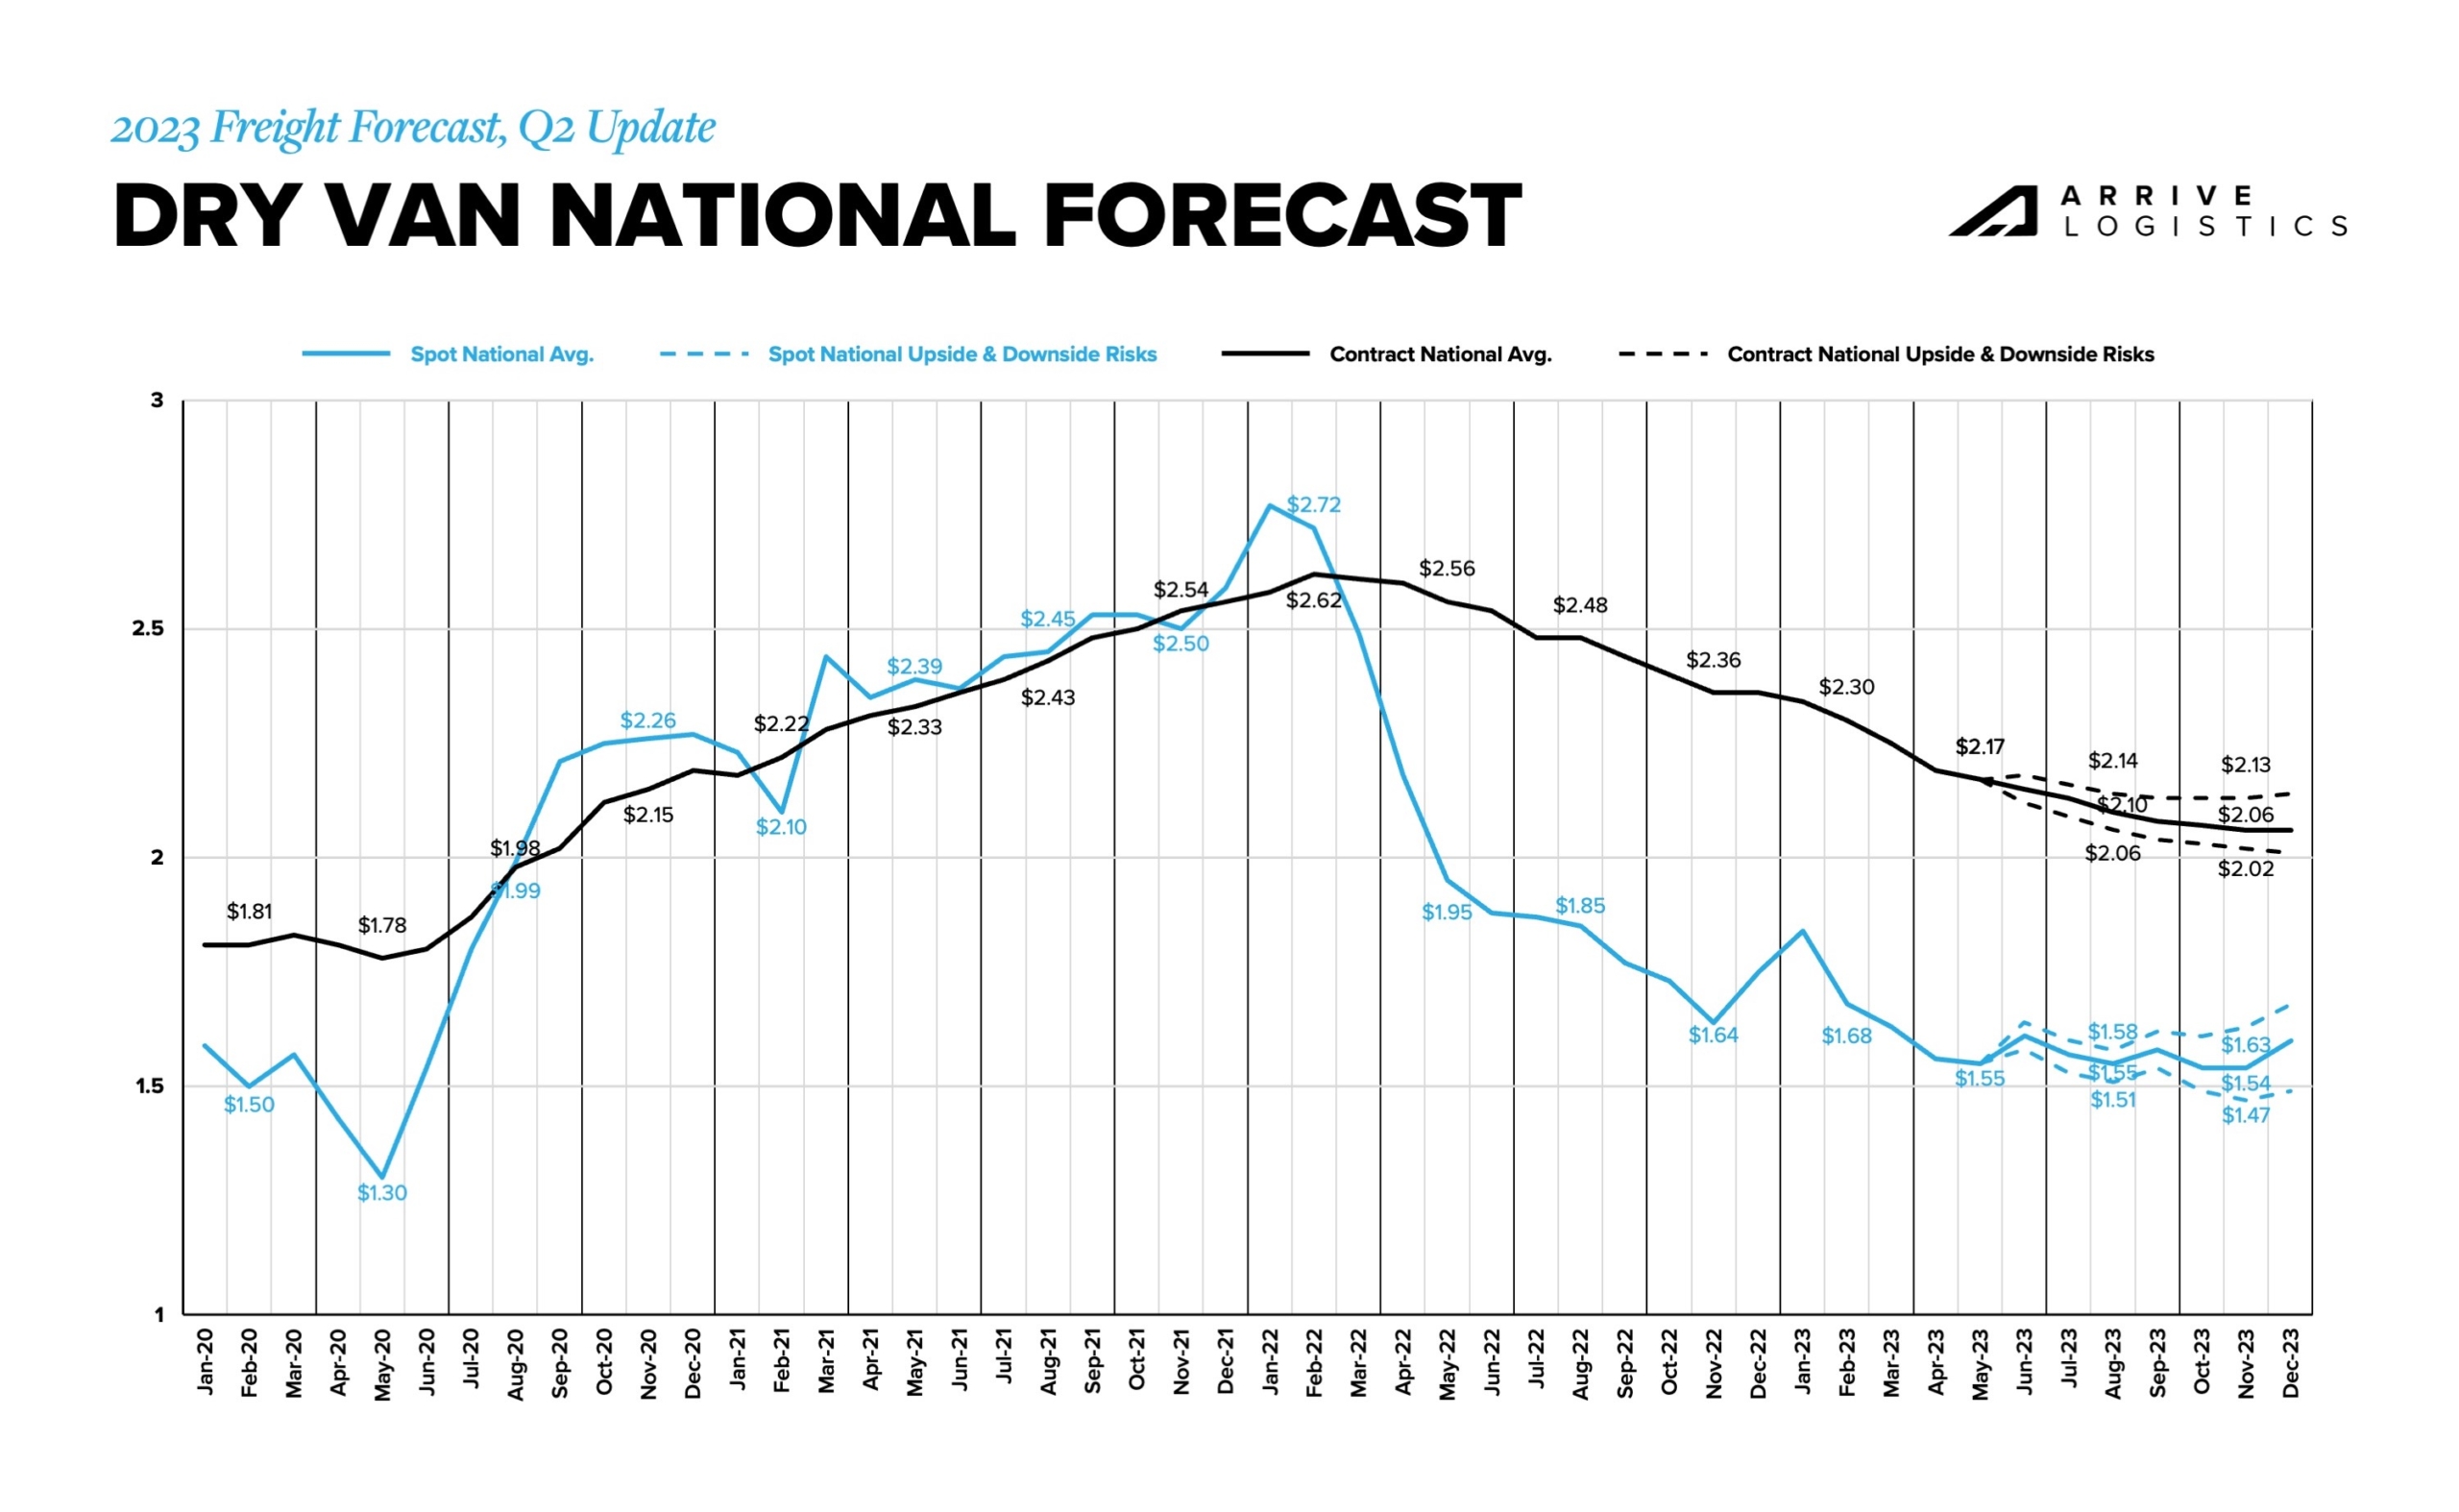
Overall, rate movements have aligned with the first forecast we released in October 2022 and the update published in Q1. Rates trended closer to the downside range of the forecast in Q2 due to persistently soft spot market demand and stubbornly sticky truckload capacity.
Coming into 2023, we anticipated rates would bottom out in April, and while that may have been the case from a week-to-week perspective, van spot rates actually fell slightly below April in May. Normal seasonality has since returned, also in line with our expectations.
Looking ahead, downward pressure on contract rates will persist as the economy and truckload demand normalize toward pre-pandemic levels. Excess capacity accumulated over the last few years is beginning to unwind. For now, though, it remains sufficient and should drive a prolonged period of spot market equilibrium and deflationary contract rates as the gap between the two closes.
Our Q1 update forecasted van spot rates would fall through Q2, bottoming out in April and remaining low in May ahead of the summer peak season. Soft spot demand and a well-supplied capacity market enabled that prediction to play out. However, rates trended toward the low end of the forecasted range, indicating that the greater downside risk scenario unfolded.
Average deviations in our forecasted rates relative to the actual rate of -$0.02 and $0.01 in February and March grew to $0.05 and $0.07 in April and May as rates fell more quickly than anticipated. Directionally, rates moved in line with our forecast, except for May. We predicted a slight increase due to the impact of CVSA Roadcheck and the onset of the summer peak season ahead of Memorial Day. However, softer-than-expected conditions in early May were too much for the elevated rates to overcome later in the month.

Spot rates are typically negotiated as all-in rates, so rapid fuel price fluctuations can contribute to forecast deviations. For example, following a $0.14 per mile decline from November to February, the average fuel surcharge declined by $0.11 per mile from February to June, likely leading to some linehaul forecast volatility. Fuel prices have since stabilized, hopefully allowing for more steady and predictable spot linehaul rates in the future.

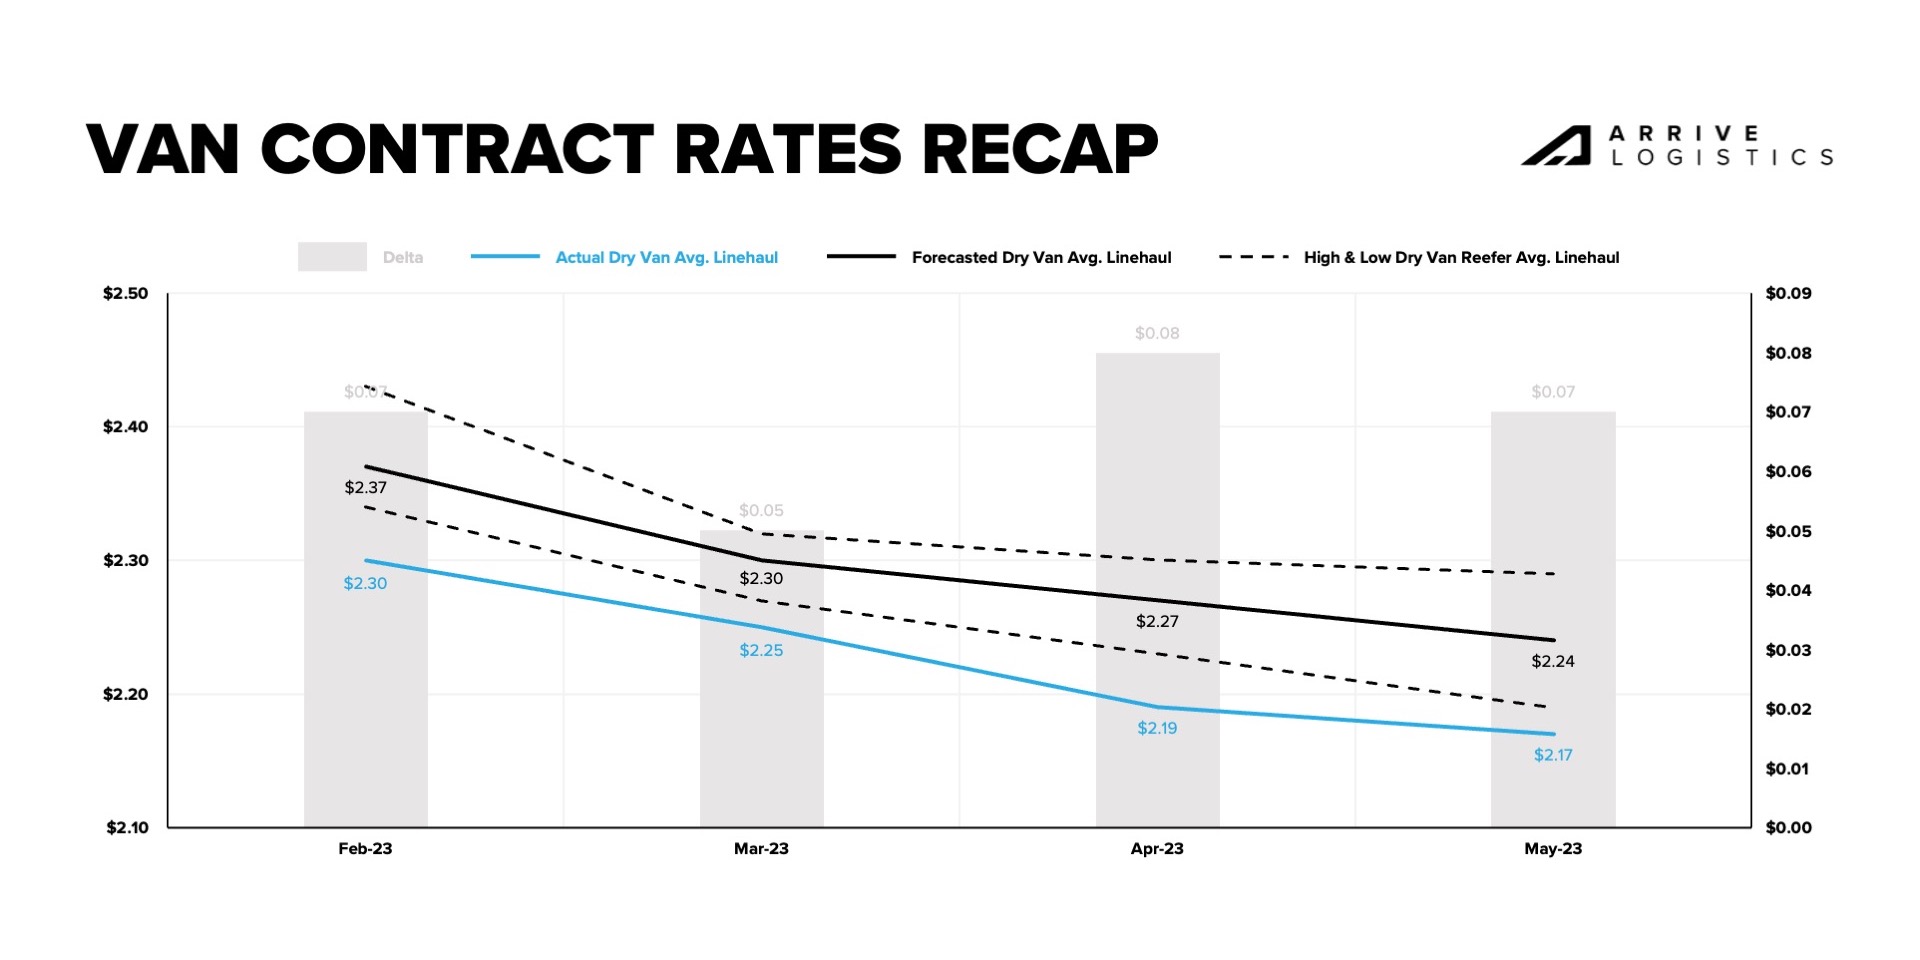
At the beginning of March 2023, DAT reported a February van contract rate of $2.33 per mile, excluding fuel. That number adjusted to $2.30 per mile, excluding fuel, as the month went on. Though such adjustments are not uncommon in DAT data, ones of this size are, and it shifted our contract rate baseline by $0.03 before the forecast even went live.
With that in mind, we recommend reviewing the monthly predicted rate movements when using this forecast for planning purposes. For example, we forecasted contract rates to fall between $0.04 and $0.14 per mile, excluding fuel, from February to May, with a decline of $0.09 per mile being the most likely scenario. The actual rate decline was $0.13 per mile, meaning our forecast was within $0.04 per mile of actual contract rate movements. Directionally, rates moved in line with expectations, falling each month.
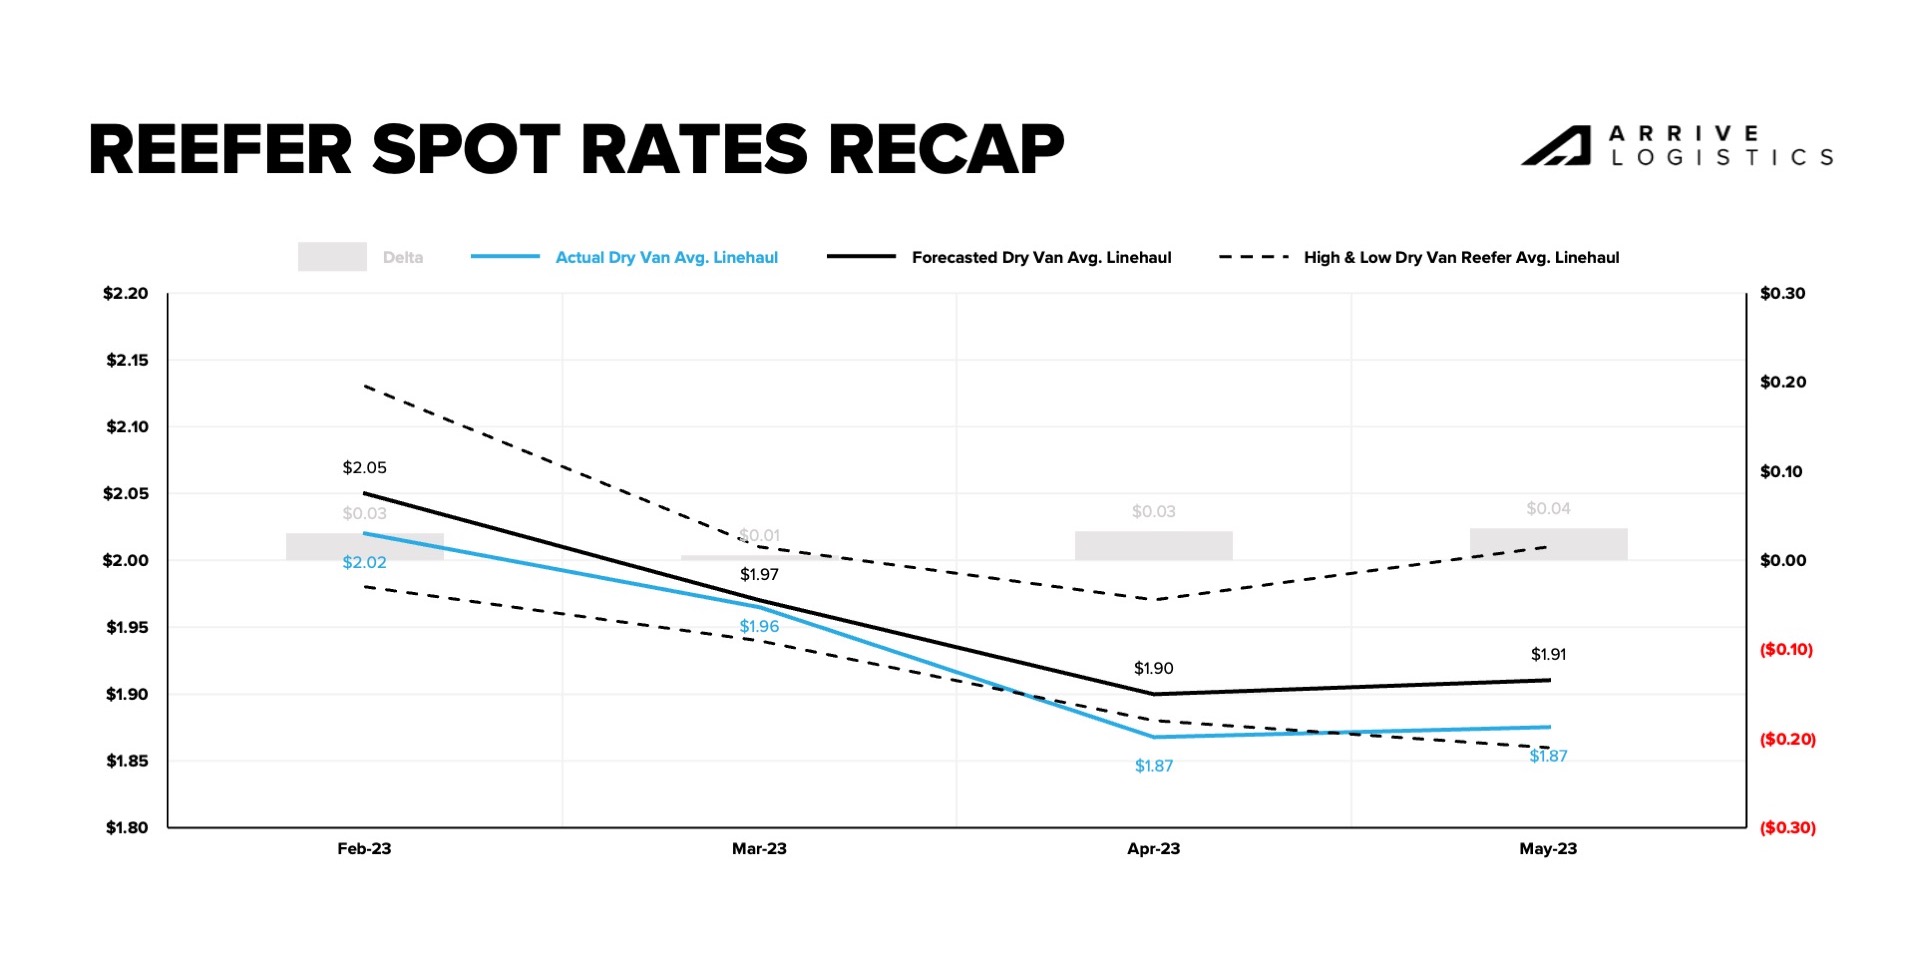
Reefer spot rates followed a similar trend to van spot rates over the last quarter. Similar to our updated Q1 van forecast, we predicted reefer spot rates would fall through Q2, bottoming out in April and remaining low in May ahead of the summer peak produce season. As expected, rates trended closer to the downside risk scenario due to soft spot demand and a well-supplied capacity market.
Average deviations in our forecasted rate relative to the actual rate remained low, trending at $0.01 in March, $0.03 in April and $0.04 in May as rates fell slightly lower than anticipated. Directionally, rates moved perfectly in line with our forecast, bottoming out in April before a slight increase in May with the onset of the summer peak season late in the month.
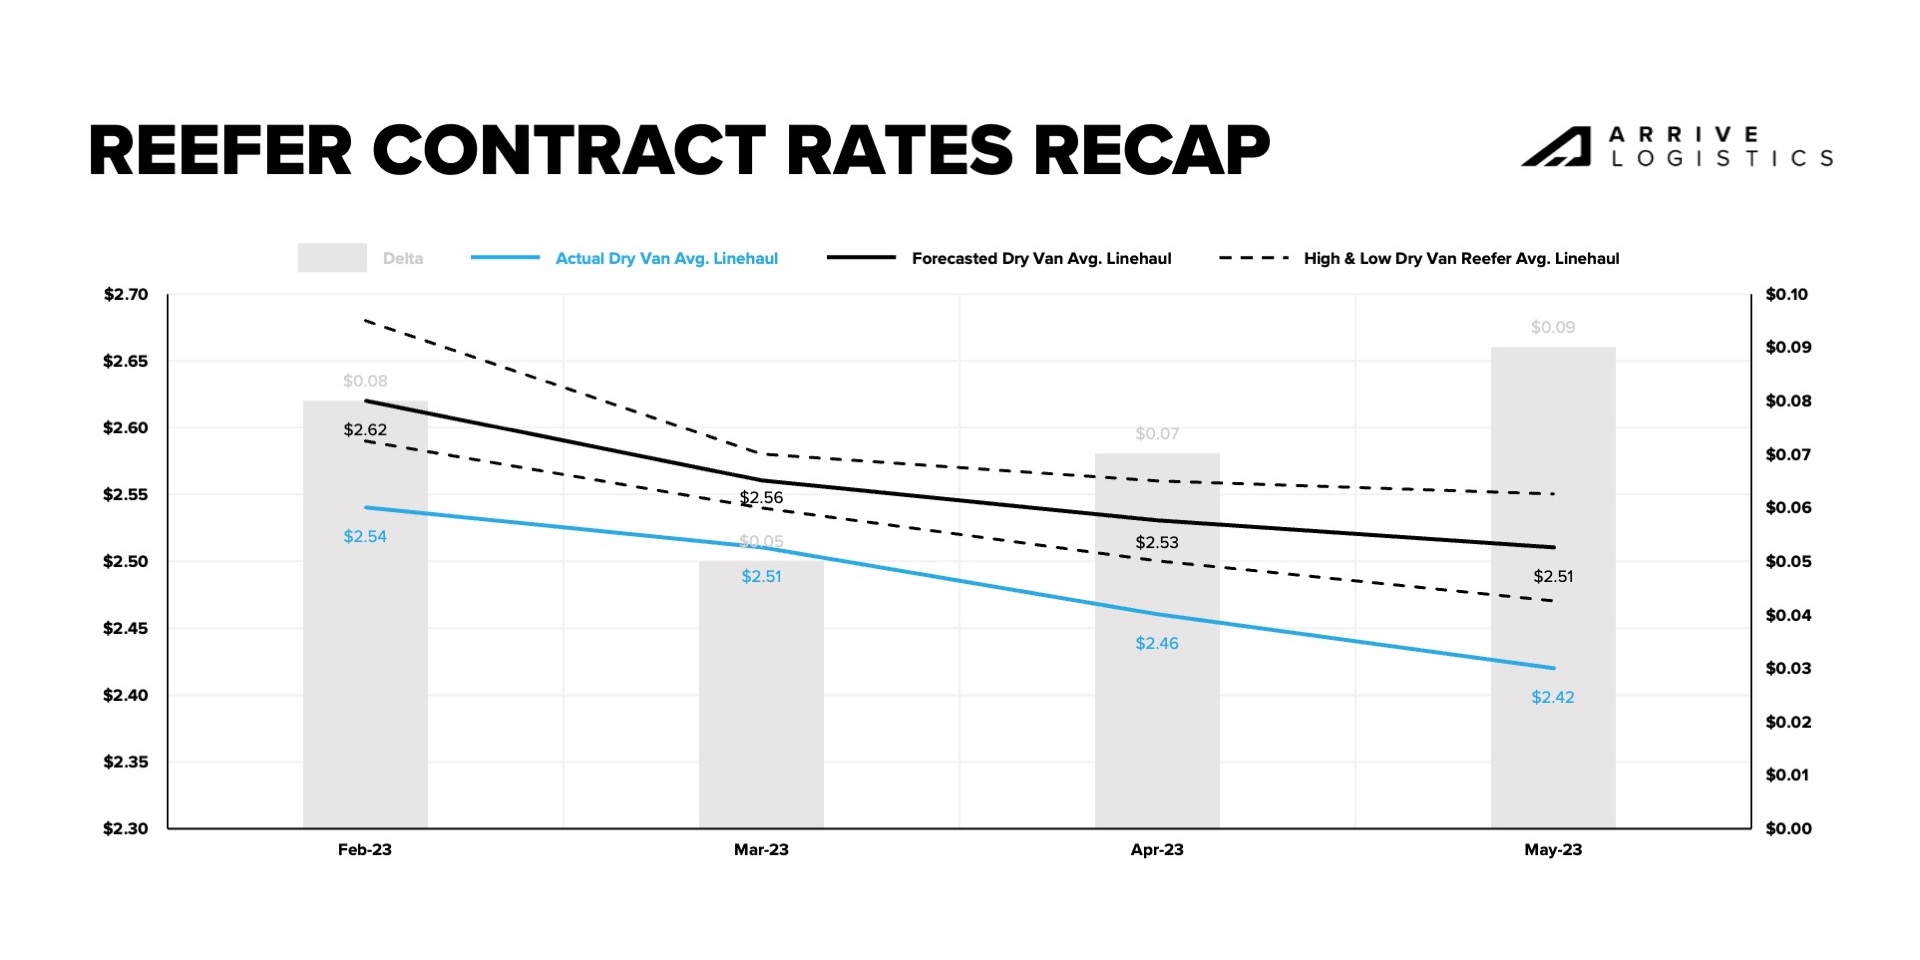
DAT reefer contract rates shifted similarly to van contract rates in February, so the same baseline adjustment rule applies here. We forecasted contract rates would fall between $0.02 and $0.10 per mile, excluding fuel, from February to May, with a decline of $0.06 per mile being the most likely scenario. Directionally, rates moved right in line with expectations, falling each month. However, the actual rate decline was $0.11 per mile, meaning our forecast was within $0.05 per mile of actual contract rate movements. This result illustrates an environment where shippers have been quickly and aggressively lowering contract pricing on reefer freight at a time when we would expect to see seasonal demand lead to more stable rates.
We anticipate spot rates will remain relatively stable, rising and falling in line with typical seasonal expectations, as contract rates continue to normalize and the gap between the two gradually closes throughout the year.
The capacity correction is underway, but it will be some time before the market becomes vulnerable to longer-term disruption.
Freight tonnage is unlikely to give trucking conditions a meaningful boost and continues to experience greater downside risk as economic conditions normalize toward pre-pandemic levels.

This forecast outlines what we believe will be the most likely scenario given the information available at the time of writing. However, unforeseen events, including but not limited to the following, may cause market volatility that impacts these projections.
The Russia/Ukraine conflict significantly impacted freight markets in 2022 and remains a large risk in 2023. Similarly, tensions between China and Taiwan may impact Asia-U.S. relations and trade, including Taiwan’s prominent semiconductor production.
We accounted for current economic conditions and the prospect of a late 2023/early 2024 recession in this forecast. However, conditions may worsen faster than expected, resulting in declining trucking demand due to dwindling consumer demand and manufacturing pullbacks.
Severe weather is a frequent source of freight market disruption. Though winter storms tend to have the greatest impact, healthy capacity should help mitigate any significant issues if major weather events occur.
Spot rates are below public truckload carriers’ operating cost per mile for the third consecutive quarter. When this occurs, it usually isn’t long before spot rates rebound or experience some upward pressure because rates can only fall so far before carriers start to lose money and decide to sit out or leave the market entirely. This scenario creates a floor for rates and is why our forecasted spot rates typically trend to the downside.
Rapidly changing fuel surcharges can make measuring forecast errors more complex. They can also create different behavioral profiles for shippers and carriers in the marketplace. For example, rapidly declining fuel costs drive more favorable conditions for carriers and alleviate pressure on shippers looking for cost reductions. Historically fuel prices have remained relatively stable, but over the past year, we have redefined what fuel price volatility looks like.
The national average spot rate per mile aggregates the weekly market-to-market, 7-day spot rates on lanes of 500 miles or more. The thresholds on market-to-market and 7-days help ensure we are using lanes of higher density, which are more representative of the true cost of most lanes. Additionally, the minimum threshold of 500 miles eliminates the inclusion of short hauls, which could inflate the index based on the rate per mile.
The national average contract rate per mile is sourced from DAT data and underwent no additional aggregation.