"*" indicates required fields
"*" indicates required fields
"*" indicates required fields

This document contains our comprehensive outlook for national dry van and reefer truckload rates for October 2023 through December 2024. The Arrive Insights® team generated this forecast through a combination of extensive historical research and output from the predictive models built into ARRIVEnow, our proprietary technology platform.
Successfully navigating freight market ebbs and flows begins with a basic understanding of the relationship between rates and the unique components of truckload supply and demand. Simply put, high or increasing demand and tight capacity will cause upward rate pressure, whereas low or easing demand and ample available capacity will drive rates down.
By tracking directional trends for truckload demand (volume) and available capacity (trucks) in the market at any given time, we can predict rate trends with a high degree of accuracy and consistency.
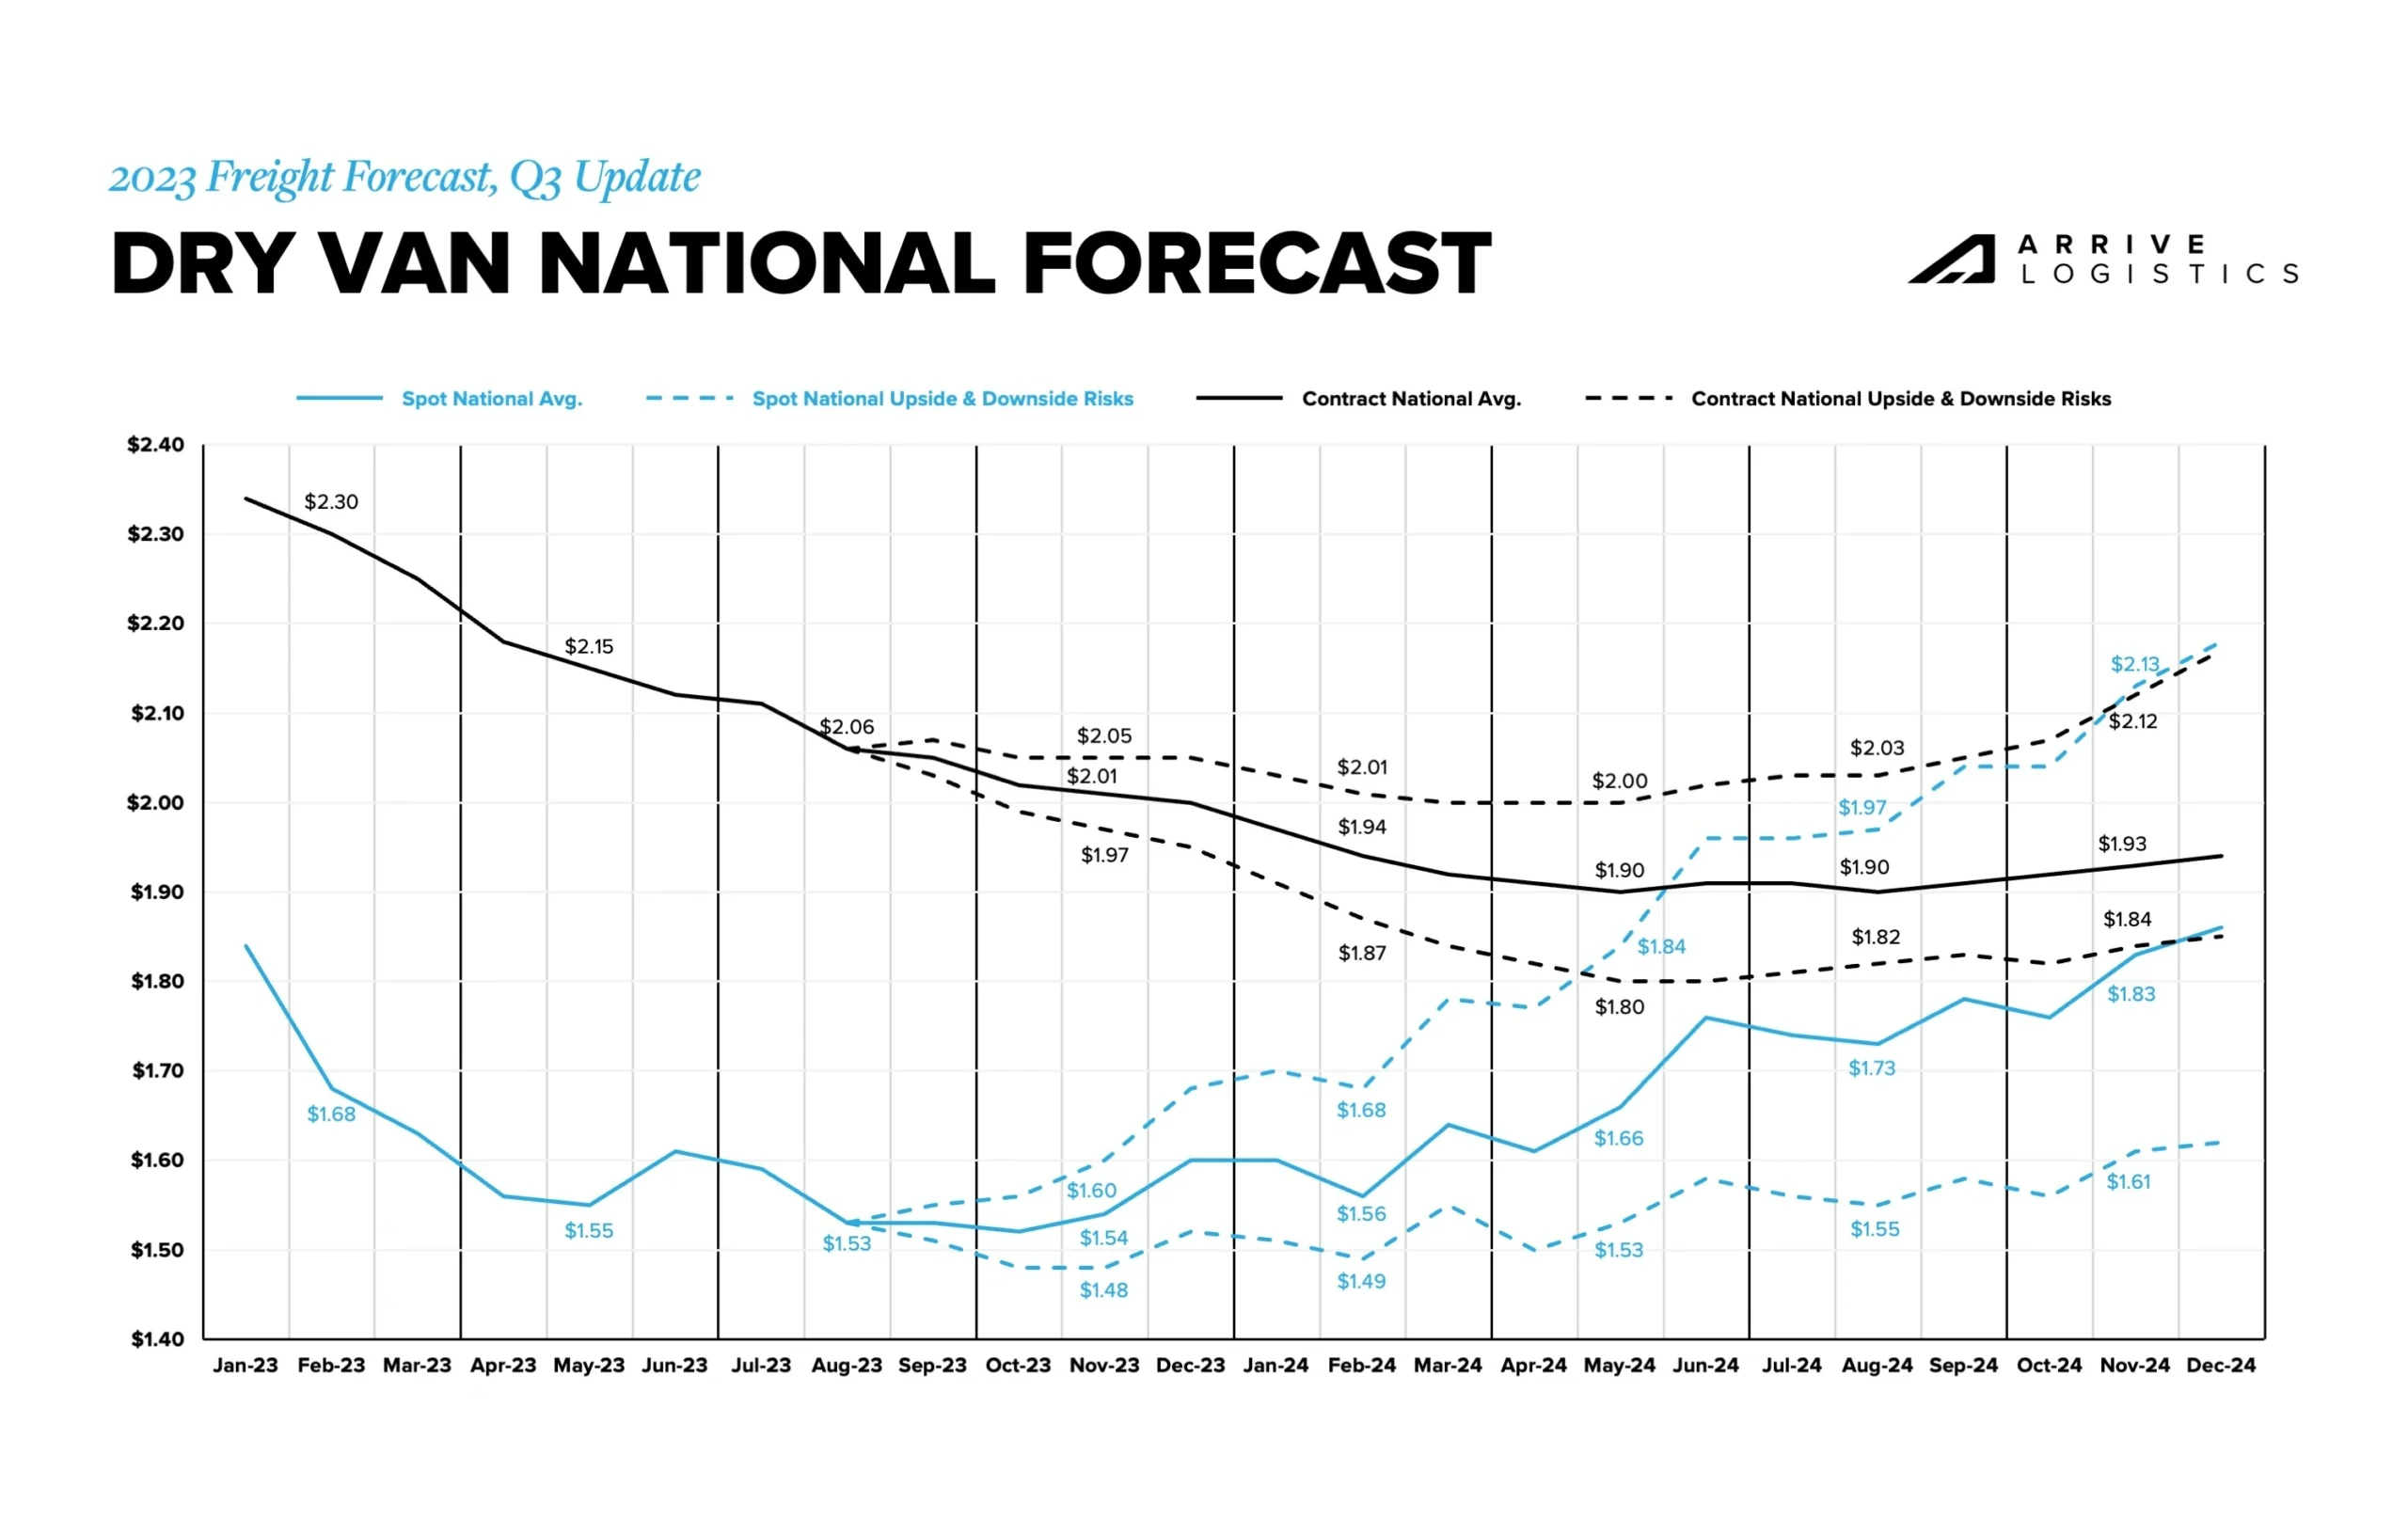
We anticipate spot rates will begin increasing at the start of Q4 2023, and the floor will increase throughout the year. Contract rates will continue to normalize but at a slower rate, finding a floor sometime in Q2 or Q3 2024. The shrinking spot-contract rate gap will leave the market vulnerable to significant disruption, making the upside risk scenario more likely; however, downside risk remains amid economic uncertainty.
Freight tonnage is unlikely to improve trucking conditions meaningfully, but the inventory cycle reset should help keep demand flat or even drive slow growth. Downside risk remains as economic conditions normalize toward pre-pandemic levels.
The capacity correction is underway, but it will be some time before the market becomes vulnerable to longer-term disruption.

This forecast represents what we believe will be the most likely scenario given the information available at the time of writing. The up and downside risk scenarios illustrated may come to fruition if unforeseen events occur, including but not limited to:
The Russia/Ukraine conflict significantly impacted freight markets in 2022 and remains a large risk in 2023. Similarly, tensions between China and Taiwan may impact Asia-U.S. relations and trade, including Taiwan’s prominent semiconductor production.
Although a recession is likely off the table in the short term, uncertainty for economic conditions remains. Elevated interest rates and student loan repayments could cause conditions to worsen faster than expected, resulting in declining trucking demand due to dwindling consumer demand and manufacturing pullbacks.
Severe weather is a frequent source of freight market disruption. Though winter storms tend to have the greatest impact, healthy capacity should help mitigate any significant issues if major weather events occur.
Spot rates remained below public truckload carriers’ operating cost per mile for most of the past year. When this occurs, it usually isn’t long before spot rates rebound or experience some upward pressure because rates can only fall so far before carriers start to lose money and decide to sit out or leave the market entirely. With capacity exiting the market, spot rates will likely continue to see a floor reset higher after each period of seasonal volatility.
Rapidly changing fuel surcharges have and may continue to make measuring forecast errors more complex. They can also create different behavioral profiles for shippers and carriers in the marketplace. For example, rapidly declining fuel costs drive more favorable conditions for carriers and alleviate pressure on shippers looking for cost reductions. As of late, however, increasing fuel costs have put additional financial stress on carriers, particularly those operating in the spot market. Historically, fuel prices have remained relatively stable, but over the past 18 months, we have redefined what fuel price volatility looks like.
Overall, 2023 rate movements have aligned with our initial forecast from October 2022 and the subsequent update published in June. A bifurcation of trends has emerged across van and reefer equipment, with van rates trending toward the downside and reefer rates leaning slightly to the upside. Rate volatility correlated closely with reefer routing guide challenges, indicating the freight market recovery may be further along for reefer than van equipment.
There should not be any major freight market surprises for the remainder of this year, but shippers should remain diligent and discerning despite the muted peak season narrative. While the typical lane and regional challenges may be somewhat reduced, they will still exist, particularly for reefer equipment. Expect disruptions in routing guides for reefer equipment in the busy weeks leading up to Thanksgiving and Christmas.
Looking ahead to 2024, we anticipate year-over-year growth for spot rates for van and reefer equipment will turn positive as early as March. Demand growth may be flat or slow, but it will be driven by the resetting inventory cycle and ongoing carrier exits, resulting in upward pressure on the spot rate floor. Additionally, declining contract rates due to the Q4-2023 and Q1-2024 bid seasons will help close the spot-contract rate gap, leaving the market more vulnerable to seasonal demand surges and other disruptive events throughout 2024.
Our Q2 update forecasted van spot rates would follow the normal seasonal demand trends, falling in July and August before picking back up in September.
Soft spot demand and a well-supplied capacity market helped bring that prediction to fruition. However, rates trended toward the low end of the forecasted range in August and September due to rapidly increasing fuel prices, which tend to have an inverse relationship to linehaul rates as many carriers prefer to negotiate “all-in” rates. Although all-in rates rose, linehaul rates dropped notably.
Directionally, rates moved in line with our forecast throughout the quarter. However, the deviation between our forecasts and the actual rates increased from an average of $0.00 to -$0.02 in June and July to $0.02 and $0.05 in August and September due to linehaul rates falling faster than expected in August and rising slower in September.

The average fuel surcharge increased by $0.11 per mile from July to September, contributing to linehaul forecast volatility. Fuel price movements have momentarily stabilized, which should help make future linehaul rates more predictable. However, if fuel prices return to what they were in May, June and July, they will likely have an inflationary effect on linehaul rates.

At the beginning of July 2023, DAT reported a June van contract rate of $2.15 per mile, excluding fuel. That number was adjusted to $2.12 per mile, excluding fuel, as the month went on. Such adjustments are not uncommon, and this one shifted the contract rate baseline by $0.03 before our last forecast was published.
With that in mind, we recommend reviewing the monthly predicted rate movements when using this forecast for planning purposes. For example, we forecasted contract rates to fall between $0.02 and $0.11 per mile, excluding fuel, from June to September, with a $0.07 per mile decline being the most likely scenario. The actual rate decline was in fact $0.07 per mile, meaning our forecast was spot on by the end of the quarter. Directionally, rates moved in line with expectations, falling each month.

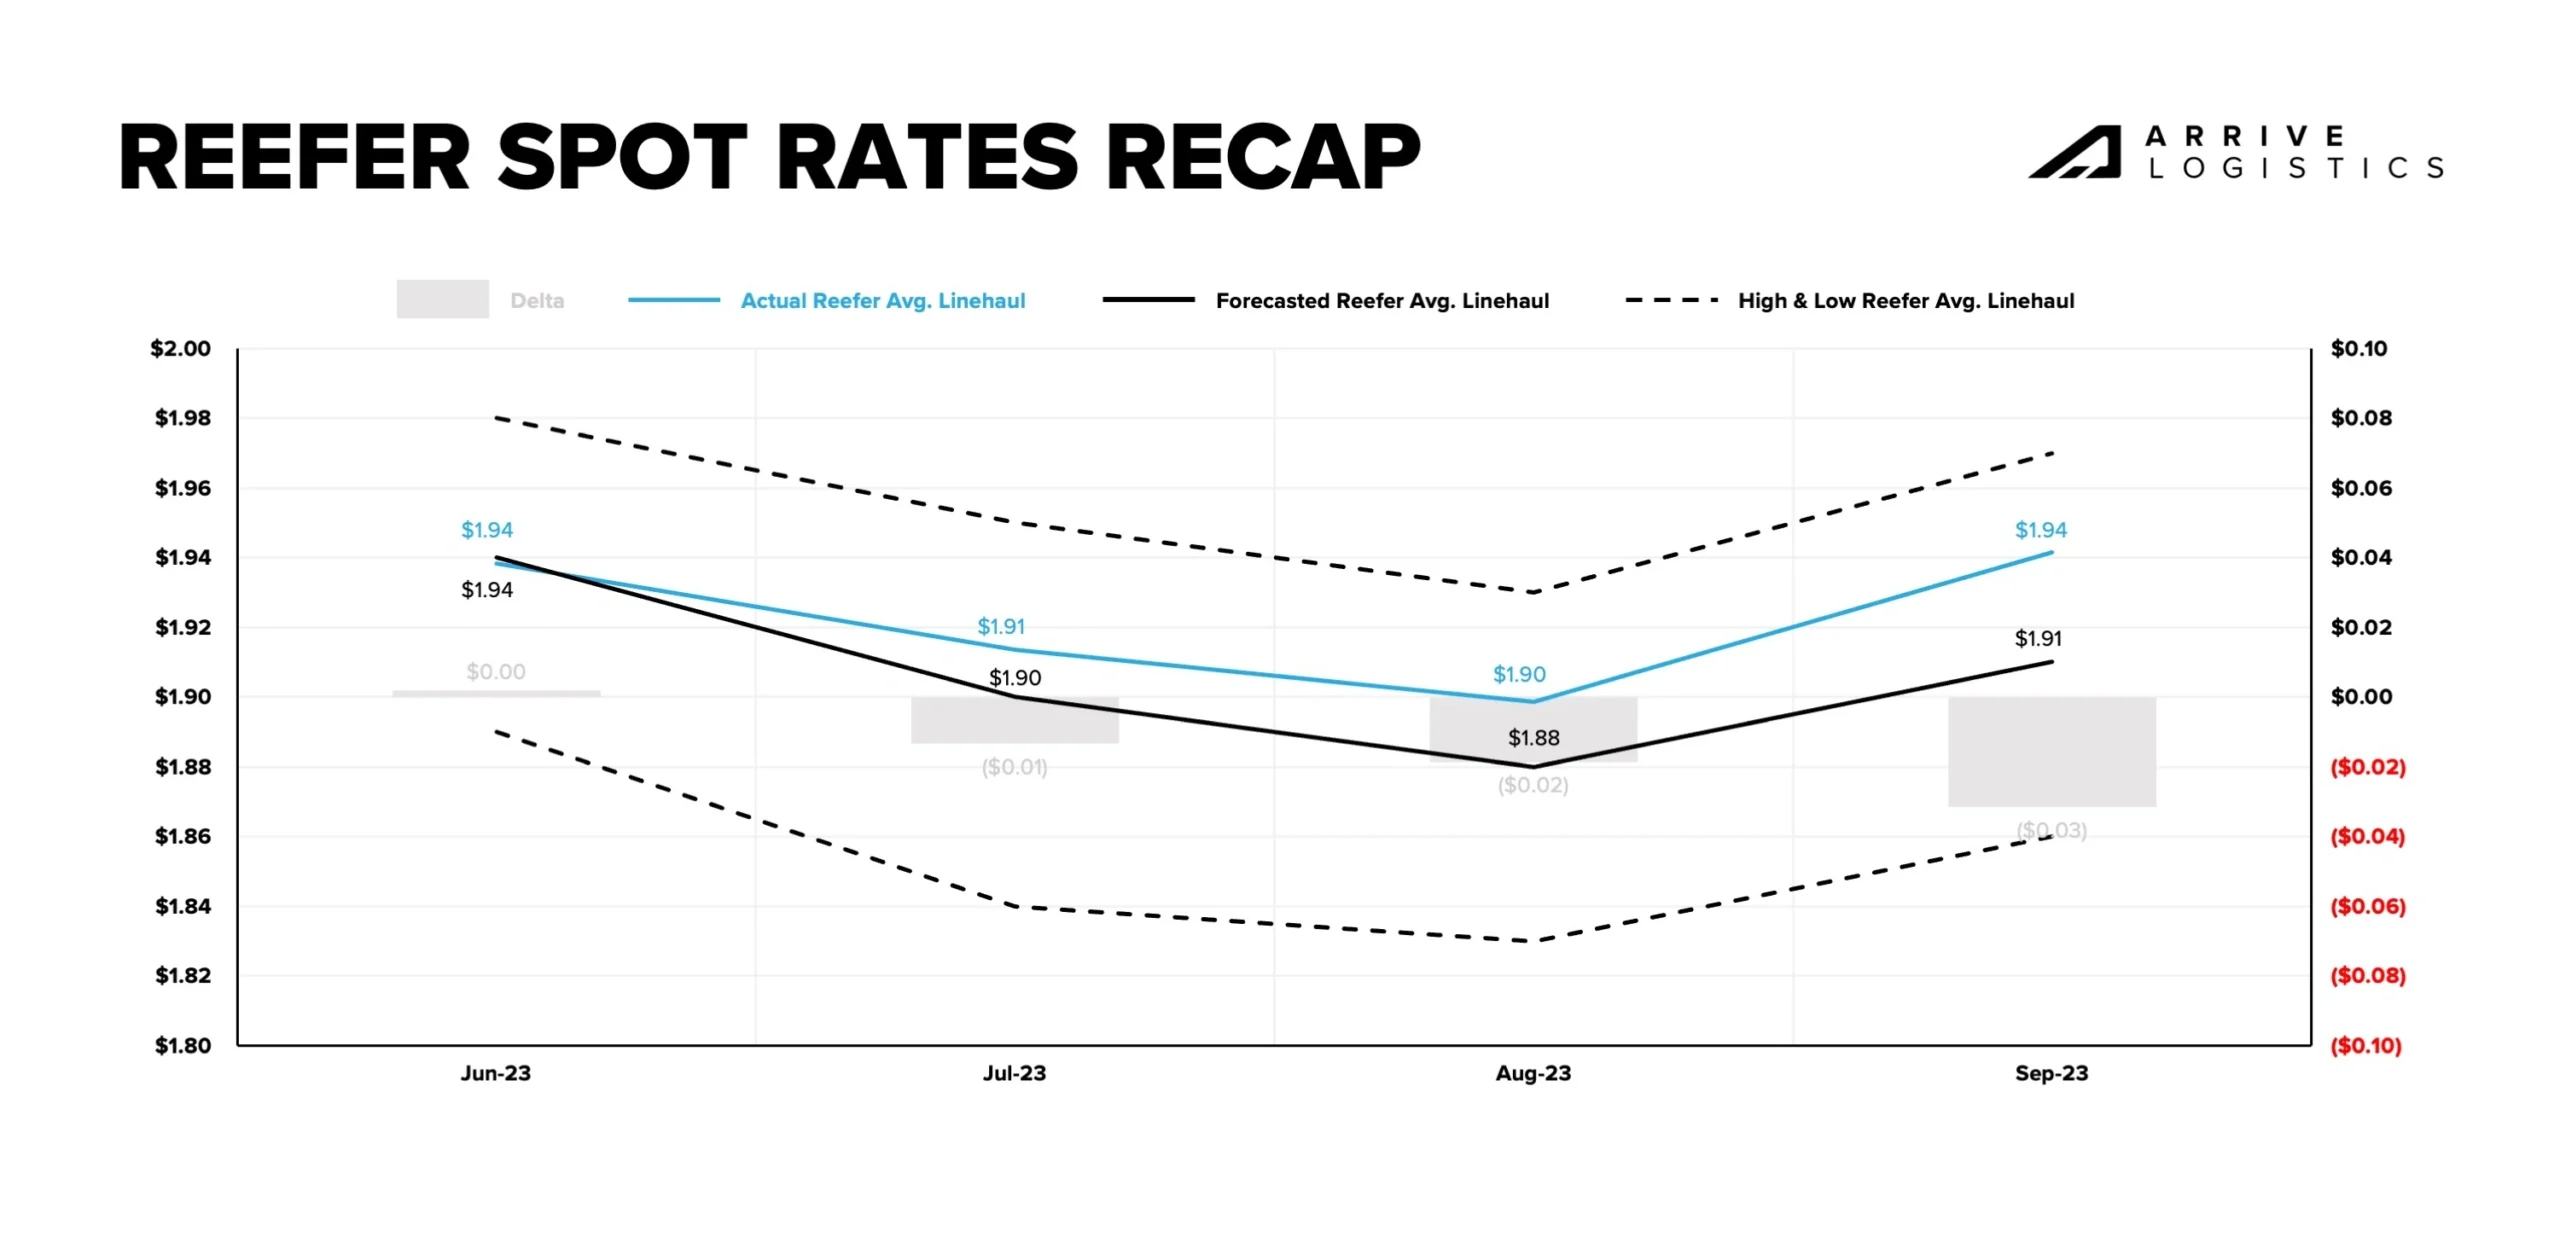
Reefer and van spot rates trended similarly over the last quarter, but reefer linehaul rates increased significantly faster in September. Seasonal produce demand caused meaningful routing guide disruptions, driving up demand and rates in certain regions. Rapidly rising fuel prices also impacted reefer linehaul rates, making the September increase even more significant.
Average deviations in our forecast relative to actual rates increased slightly month-over-month as reefer rates outperformed expectations, growing from -$0.01 in July to -$0.02 in August and -$0.03 in September. Directionally, rates moved perfectly in line with our forecast, bottoming out in August before picking up again in September to Labor Day and the end-of-quarter push.
DAT reefer and van contract rates shifted similarly in June, so the same baseline adjustment rule applies. We forecasted that May to September contract rates would fall between $0.02 and $0.11 per mile, excluding fuel, with a decline of $0.07 per mile being the most likely scenario.
Directionally, rates moved mostly in line with expectations, falling each month. The actual rate decline was $0.06 per mile, meaning our forecast was within $0.01 per mile of actual contract rate movements by the end of the quarter.
This result illustrates an environment where shippers realized more affordable contract pricing on reefer freight even as seasonal demand led to rising rates.

The national average spot rate per mile aggregates the weekly market-to-market, 7-day spot rates on lanes of 500 miles or more. The thresholds on market-to-market and 7-days help ensure we are using lanes of higher density, which are more representative of the true cost of most lanes. Additionally, the minimum threshold of 500 miles eliminates the inclusion of short hauls, which could inflate the index based on the rate per mile.
The national average contract rate per mile is sourced from DAT data and underwent no additional aggregation.