Need Help
close button

How can we help?

Select One:

April Market Update

Author: arrivedev
Shape

MONTHLY MARKET UPDATE

April 2021 The Arrive Monthly Market Update, created by Arrive Insights, is a report that analyzes data from multiple sources including but not limited to FreightWaves SONAR, DAT, FTR Transportation Intelligence, Morgan Stanley Research, Bank of America Internal Data, Journal of Commerce, Stephens Research, National Retail Federation and FRED Economic Data from the past month as well as year-over-year. We know that market data is vital to making real-time business decisions, and at Arrive Logistics, we are committed to giving you the data you need to better manage your freight.

Listen to this month’s Market Update!

EXECUTIVE SUMMARY

Carriers will retain pricing power throughout the second quarter. This will lead to a continuation of the active spot market and high truck costs in the coming months due to a strong demand outlook and a weak outlook for capacity. The forecast for the back half of the year depends on carriers’ ability to add drivers and new equipment to levels sufficient enough to support volatile demand trends.


  •  Volatile demand trends persisted in March following a weather driven disruption in February that exposed a significant undersupply of capacity in the domestic freight market.
  •  DAT reported 22% month-over-month and 130% year-over-year growth in spot volumes in March.
  •  Rates have not yet trended down despite load to truck ratio and tender rejection data indicating that conditions have slightly softened in early April.
  •  Carriers are demanding a premium on their committed capacity, resulting in contract rate increases of 26% from $2.15 per mile in January to $2.70 in the first week in April.
  •  The biggest obstacles for truckload supply recovery continue to be semiconductor shortages, causing delays in new truck production, and ongoing driver availability issues.
  • Although contract rates continue to climb, shippers that secure dedicated capacity on consistent, high volume lanes, are going to have the greatest control over their transportation spend in the coming year.
  •  An improving economy, restocking of depleted inventories and normal seasonal trends such as produce and summer peak seasons should continue to support healthy demand trends in the coming months.
  • Consumer behavior patterns have begun to shift as spending on pent-up demand for travel and entertainment are enabled by the vaccine distribution, and the government stimulus enables increased spending on durable goods.

TRUCKLOAD DEMAND

Freight volumes remained elevated throughout March following the surge in demand resulting from the winter storms that wreaked havoc across the south in February. Shipper routing guides failed as capacity networks were disrupted, resulting in an increase in contract tender rejections and a flood of freight to the spot market. Freight volumes have begun to ease in early April, following the end of quarter push, but overall demand remains strong. The backlog at the ports has provided a steady stream of volume in the form of imports, and the low inventory levels that have fueled increased demand throughout the pandemic are not getting any better.

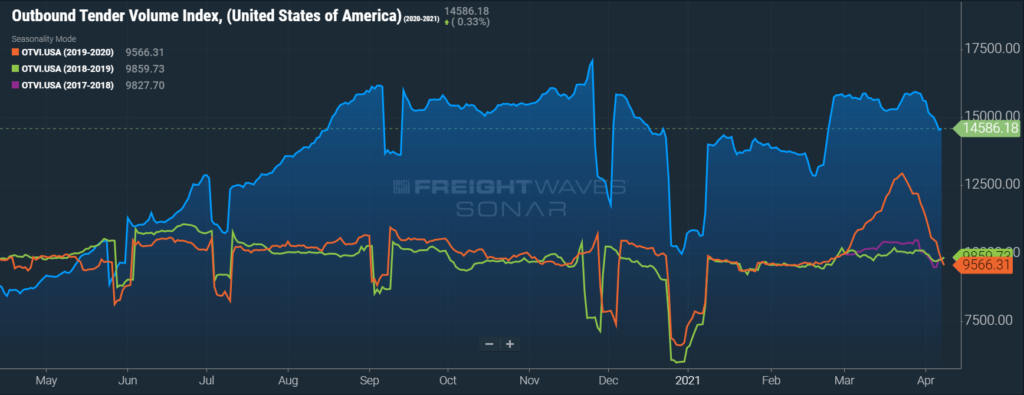
FreightWaves SONAR Outbound Tender Volume Index (OTVI), which measures contract freight volumes across all modes, was up nearly 38% year-over-year on March 31st. It is important to note that OTVI includes both accepted and rejected load tenders, so we must discount the index by the corresponding Outbound Tender Rejection Index (OTRI) to uncover the true measure of accepted tender volumes. If we were to apply this method to the year-over-year OTVI values, the increase in volume drops to 23%. This was a large increase from just eight days earlier, when the OTRI adjusted volume index was only up 8.4% year-over-year when 2020 freight volumes surged and panic buying reached its peak. The dry van and reefer tender volume indices were also up more than 60% and 88% year-over-year at the end of the month, which equated to 42% and 36% increases in actual volumes for the two modes, respectively. Tender volumes for both dry van and reefer have fallen in early April, with OTRI adjusted dry van volumes down 6% and OTRI adjusted reefer volumes down 9% since their peak on March 28th.

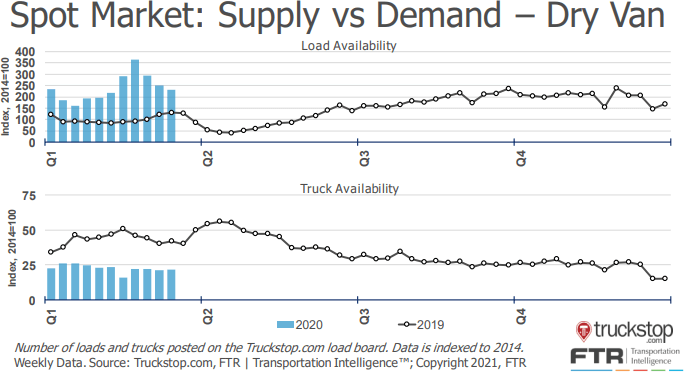
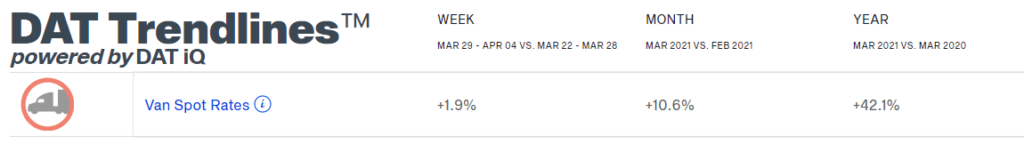
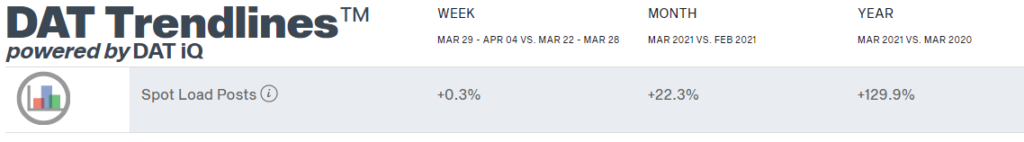
DAT reported that dry van spot load posts increased sharply in March, climbing by 22.3% month-over-month and 129.9% year-over-year. Spot volume growth slowed recently with only a 0.3% increase since last week, following the last full week of the quarter.

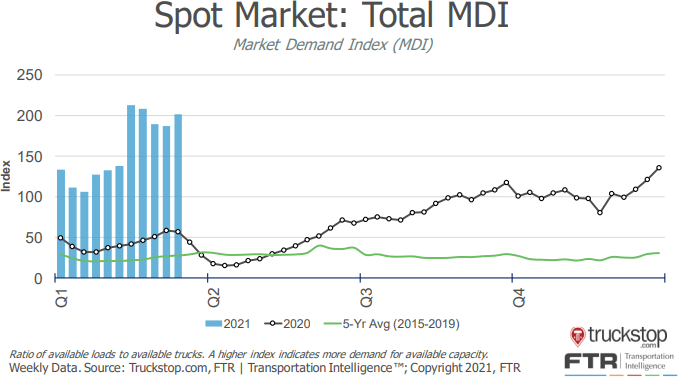
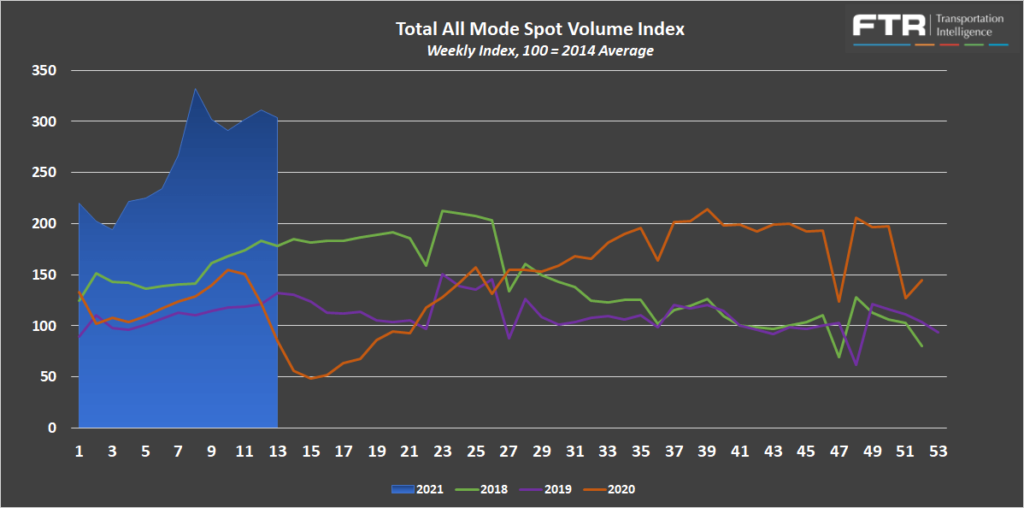
FTR and Truckstop’s Total All Mode Spot Volume Index is down 8.5% from the high in late February but is now up 257% year-over-year. After falling early in the month, the index climbed as it approached the end of the month and quarter, resulting in a relatively flat increase of just 0.5% from the start of the month.

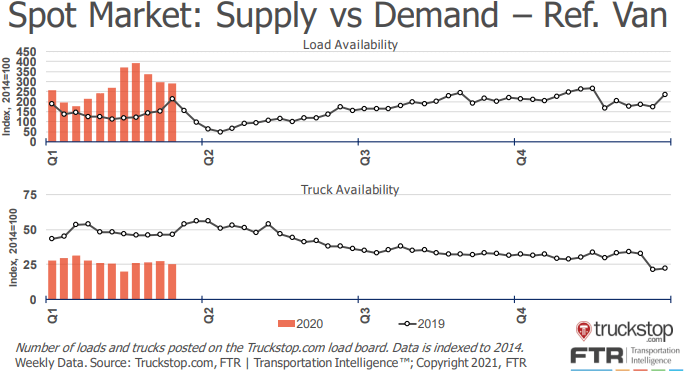
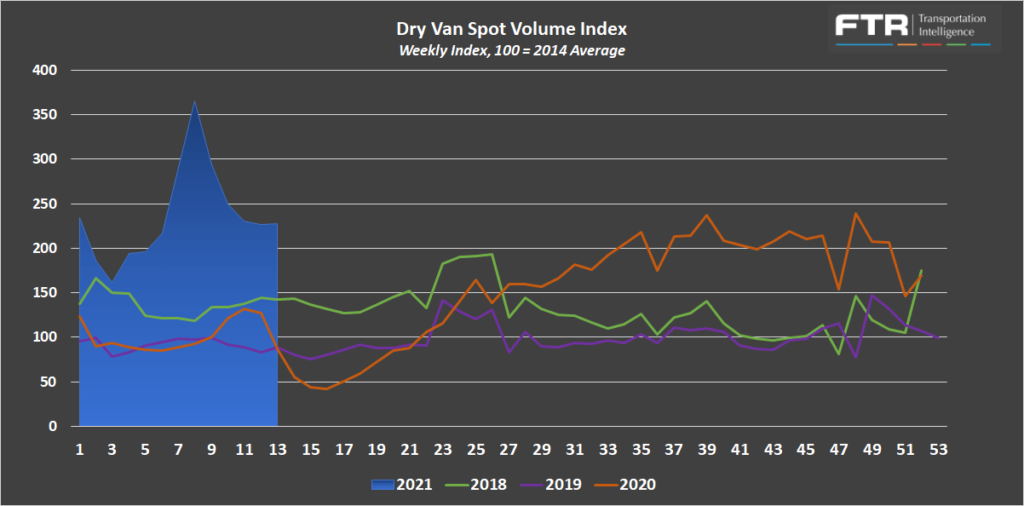
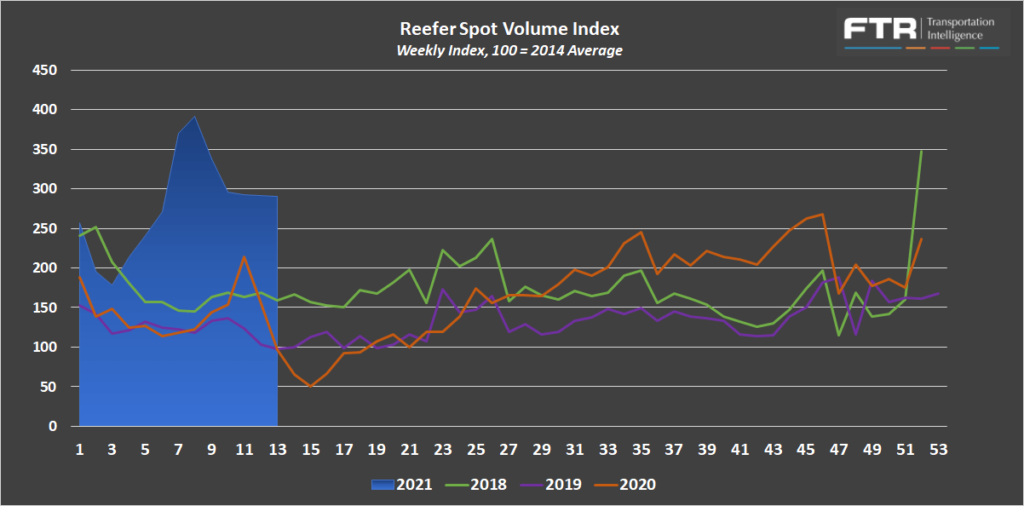
The Dry Van Spot Volume Index is down 38% from the high in late February and up 161% year-over-year, and the Reefer Spot Volume Index is down 26% and 199% over the same time period.

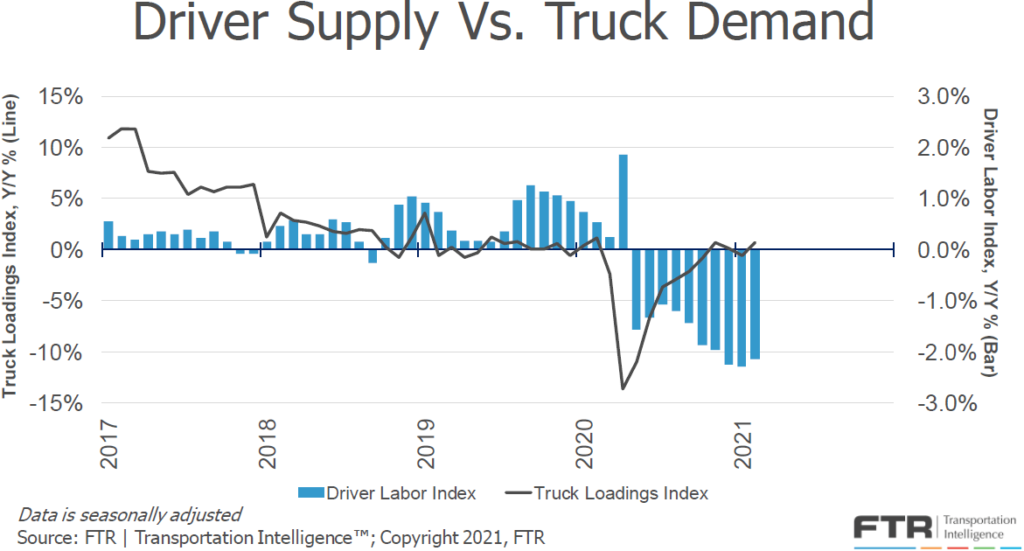
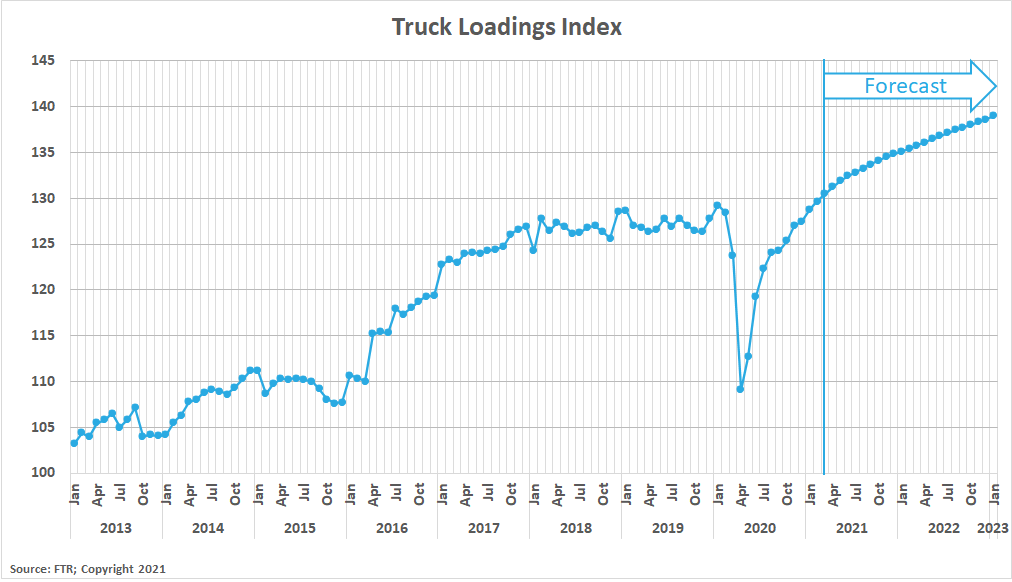
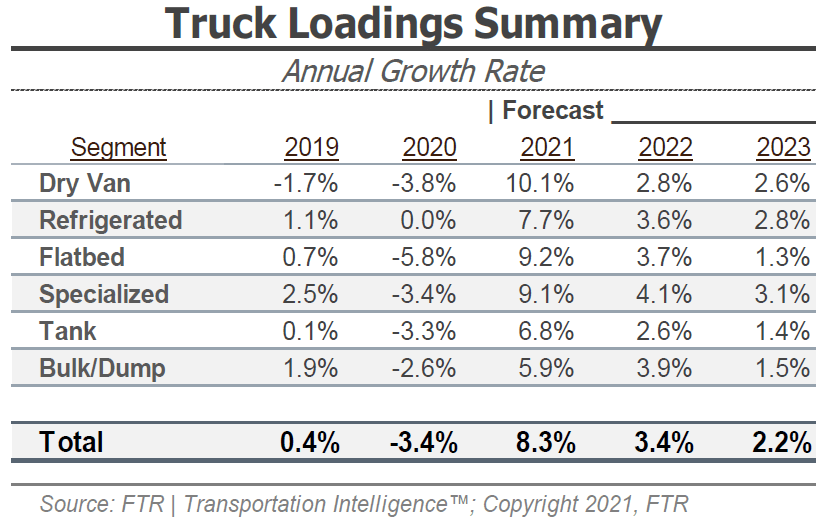
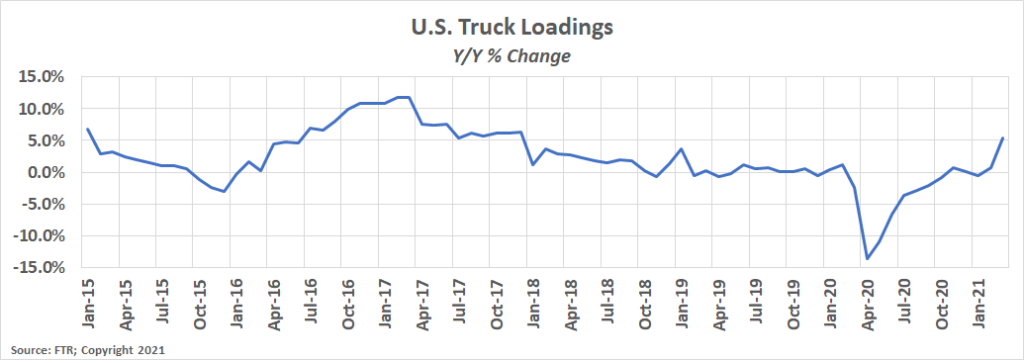
FTR’s Truck Loadings Index was up by 5.3% year-over-year in March after rising by 0.8% month-over-month from February. This is the first year-over-year increase of more than 5% since December 2017. Moving forward in 2021, year-over-year comparisons will be mostly irrelevant as the initial stages of the pandemic created highly volatile demand beginning in March 2020. The two-year trend should give us a better indication of monthly growth. March 2021 truck loadings were up 2.8% from March 2019 truck loadings, an increase from 1.8% in the two-year period beginning February 2019.

TRUCKLOAD SUPPLY


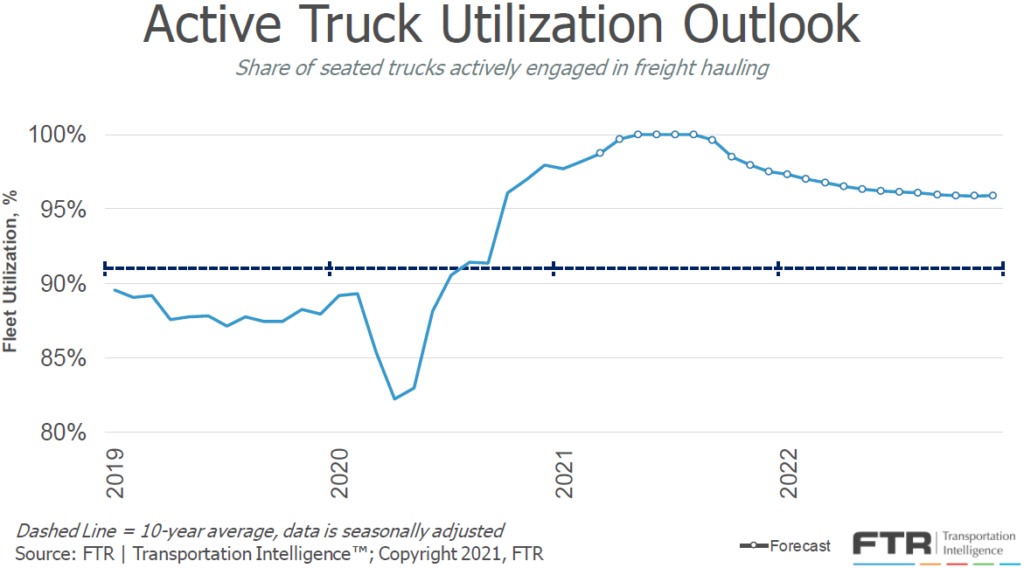
Truckload supply became extremely constrained following the winter storms in February. Fluctuations in demand created surges in spot volume activity as capacity networks were thrown out of balance. There wasn’t much of a change in the capacity environment throughout March as conditions remained tight leading up to the end of the month and quarter. In early April, however, the data suggests that the peak of tightness has likely passed.

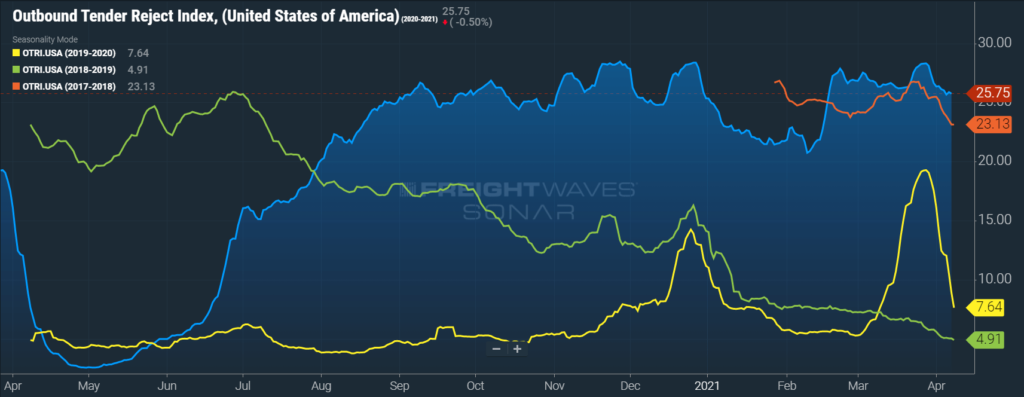
Sonar Outbound Tender Reject Index (OTRI) measures the rate at which carriers are rejecting the freight that they are contractually required to take. This index tends to follow the changes of  spot freight activity — the higher the tender rejections, the higher the spot volumes. Tender rejections peaked at more than 28% on March 28th, just shy of the all-time record high. The index currently sits at 25.75%. This decline illustrates that conditions have moderated early in the second quarter. This trend aligns with normal seasonality, which would indicate things should soften further, before starting to heat up again in mid to late May. That being said, conditions have been far from normal over the past year, so we recommend remaining vigilant as conditions could shift quickly.

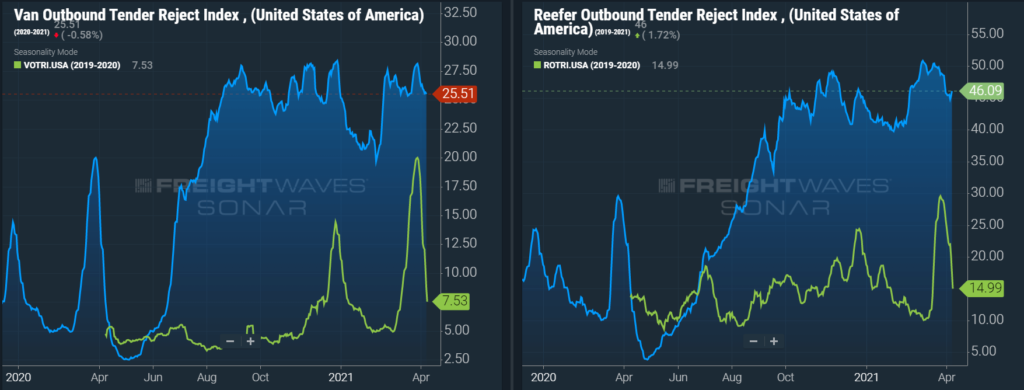
The trends were consistent across the different equipment types as both dry van and reefer rejections have fallen from a peak in late March. Dry van tender rejections currently sit at 25.51%, and reefer tender rejections currently sit at 46.09%.

OTRI climbed to 28.31% late in March before falling to 25.75% in early April.
Van and Reefer Tender Rejections both trended up late in the month before easing early in the second quarter.


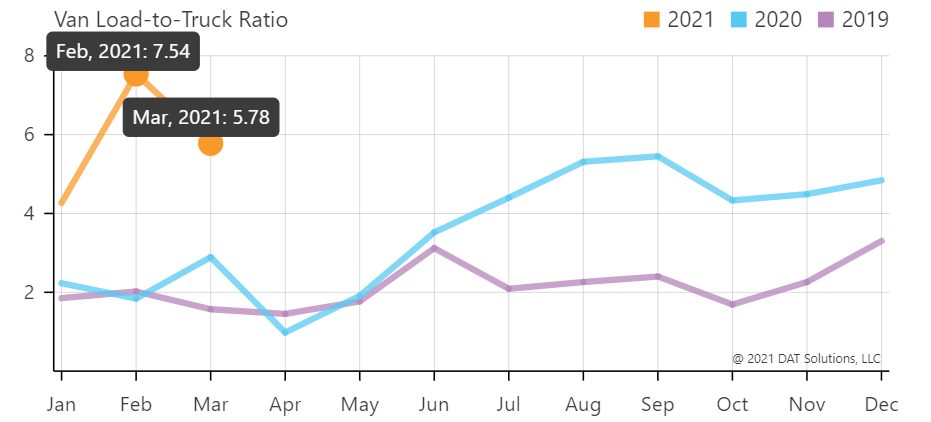
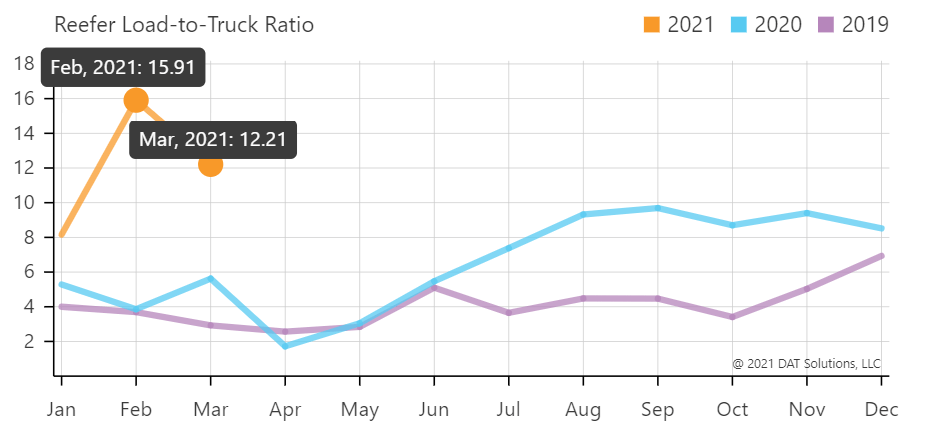
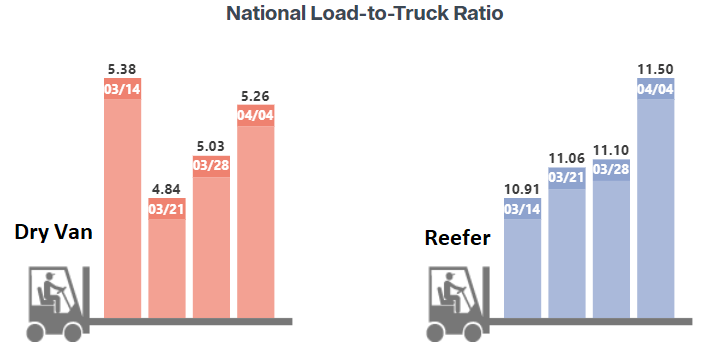
The DAT Load to Truck Ratio measures the total number of loads posted compared to the total number of trucks posted on their loadboard. In March, the Dry Van Load to Truck Ratio fell to 5.78, a decrease of 23% month-over-month, and an increase of 100% year-over-year. The Reefer Load to Truck Ratio fell 12.21 in March, an increase of 23% month-over-month and an increase of 117% year-over-year.


The weekly load to truck ratios show increasing tightness over the prior three weeks for dry van and over the past four weeks for reefer equipment types, demonstrating increased spot market tightness due to the end of month and quarter. Although not shown, we anticipate load to truck ratios to fall once data from the week ending April 11th is made available. Demand has eased slightly early in the month, which should relieve some pressure on capacity in the marketplace.

The Morgan Stanley Dry Van Freight Index is another measure of relative supply. The higher the index, the tighter the market conditions. The index indicates that conditions have softened following the dramatic tightening of capacity seen in February. The forecast suggests that the second quarter should play out similar to 2018, when conditions eased in April and early May before peaking below the high point seen in the first quarter.

The Truckstop/FTR Market Demand Index measures the ratio of available loads to available trucks. In the first two sets of charts below, load and truck availability are plotted separately for both dry van and reefer freight. Load availability decreased but remained up year-over-year, while truck availability was mostly flat year-over-year for both equipment types. These trends are indicative of easing market conditions as demand has trended down relative to supply. The total Market Demand Index is down 21% from the high last month but up 538% year-over-year and 341% from 2019.

TRUCKLOAD RATES

The winter storms marked a turning point for rates that had been on the decline early in the first quarter. Van and reefer spot rates have both increased rapidly since mid February, with the trend continuing in early April despite the data indicating softening market conditions. Dry van spot rates increased by 10.6% from $2.40 per mile in February to $2.66 in March. On a year-over-year basis, dry van spot rates are up more than 42%. Contract rates were deeply impacted by the weather driven disruption, increasing by 26% from $2.15 in January to $2.70 in the first week in April. The recent increases have resulted in both the current spot and contract rates hitting a new all-time high.

The Contract-Spot Van Rate Spread has flipped back to negative $0.06 per mile in March after trending positive in January and February for the first time since July.

Sharply increasing contract rates in 2021 illustrate insufficient capacity to support the surges and volatility in demand. The winter storms spotlighted how sensitive the capacity market is to shifts in demand, and shippers aren’t taking any chances, looking to lock in new contracts at rates well above previously seen levels in an attempt to secure consistent capacity. It is clear they are willing to pay a premium to ensure predictable transportation costs.

CAPACITY OUTLOOK

The outlook for capacity remains largely unchanged. Challenges in Class 8 truck production and the continued driver availability issues remain the biggest obstacles to a recovery in truckload supply. Until these issues are resolved, we expect to see demand volatility continue to result in highly unstable market conditions.

Truck loadings are now trending up, while driver supply lags behind on a year-over-year basis. This lasting imbalance highlights how capacity has become so deficient in relation to demand. Volumes have continued to grow while driver supply falls. The chart below shows FTR’s forecast for truck driver pressure peaking in Q2-2021 and remaining elevated through 2022. This supports the outlook that capacity constraints will drive unpredictable rate environments as demand ebbs and flows. Despite contract rate increases, we are still advising shippers to secure dedicated capacity on their consistent, high volume lanes to maintain control over their transportation spend in the coming year.

FTR has revised their forecast for active truck utilization, the share of seated trucks actively engaged in freight hauling, to extend the period of 100% utilization by several months. Active truck utilization is now forecast to max out at 100% in June and remain there without easing until the fourth quarter. This adjustment is based on continued challenges in driver availability and continued growth in truckload demand.

FTR reports that new truck orders continued their strong pace in March, with preliminary results indicating 40,800 new Class 8 trucks were ordered in the month. A 1.5% decrease from 41,415 in February but a 495% increase from 6,854 in March 2020. This is now the seventh straight month with new orders coming in above the 20,000 units required to sustain current levels of capacity. Typically, this would be a strong indicator that capacity is making a recovery, but shortages in the semiconductors needed to produce the microchips required to operate a truck are leading to delays in the delivery of new units. Delivery estimates are still being pushed out to 2022 for many models.

VOLUME OUTLOOK

The outlook for demand remains strong. FTR’s latest truck loadings forecast shows slightly stronger outlooks in most major commodity groups, resulting in an increased 2021 freight outlook. The forecast shows an increase in monthly truck loadings resulting in a total increase of 8.3% for the full year, up from 7.8% a month ago. Refrigerated and flatbed loadings made up the majority of the forecast increase as the dry van outlook remained unchanged.

Congestion at the ports has made it difficult for retailers to build up inventories, fueling the need for continued restocking as sales outpace the arrival of new goods. This situation is only expected to worsen, particularly for clothing and department stores where sales are expected to rise now that additional stimulus money has hit the economy, and the continued rollout of the vaccine should support increased spending at brick and mortar locations. Sales will likely increase faster than additional inventory can be added, which would result in things getting worse before they get better. In furniture, home furnishings, electronics and appliances, the situation has already gone from bad to worse. Inventories are down 5%, and sales are up more than 6%, which has resulted in increasing inventory pressure. Lead time and planning is essential for shippers who rely on imported raw materials for production or imports to replenish inventories.ullamcorper mattis, pulvinar dapibus leo.

ECONOMIC INDICATORS AND CONSUMER SENTIMENT

The Bank of America (BofA) consumer spending data provides visibility into the changing consumer behaviors and spending patterns. Positive impacts from the economic stimulus and the continued reopening of states were the key stories that emerged in the spending data in March. According to BofA Global Research, stimulus recipients are still spending 30% more than those that did not receive a payment, but the boost in spending started to fade just seven days after the first checks arrived. This increase in spending should absolutely support the continuation of healthy truckload demand.

We must note that beginning in March, the two-year change is more representative of the underlying trend due to the impact from the pandemic lockdowns a year ago. For example, total card spending is up 67% year-over-year but just 20% compared to 2019, for the 7-day period ending April 3rd.

When looking at monthly card spending by major category, airlines increased the most sequentially in consumer spending month-over-month in March. This is evidence that as states continue to reopen, we should expect to see pent-up demand for travel and entertainment drive spending growth in new areas. This shift in consumer behavior and spending should result in fluctuations in truckload demand that would require capacity networks to adjust to new demand pressures, potentially causing an extension in the current market disruption.

Even though we have seen an increase in spending on travel and lodging, there is still a long way to go in order to reach normal levels. In the case of durable goods, consumer spending is still trending well above pre-pandemic levels.

The unemployment trends continue to be concerning, remaining mostly flat throughout March. Initial claims in the most recent week came in at 744,000 and continued claims are more than 3.7 million on a weekly basis.

Contact Us

"*" indicates required fields

Carrier Scorecard Feedback

Get Access to the Shipper Portal

Current Customers

Already shipping with Arrive?

Connect with your representative to get access to your ARRIVEnow Shipper Portal. Can’t connect with your rep? Use this form to reach out.

New Customers

Not shipping with Arrive yet?

If you’re not an Arrive customer, please join our network to access the portal.

Use of Cookies

We use cookies to enhance your browsing experience, serve personalized ads or content, and analyze site traffic. By continuing to use this website, you acknowledge and consent to our use of cookies as detailed in our privacy policy.

Fraud Prevention

Freight fraud continues to impact our industry. We encourage shippers and carriers to reach out to Arrive immediately if there is ever a shipment in question that may be subject to fraud. Arrive Logistics registered email domain is @arrivelogistics.com. Our 24/7 phone number is 888-861-0650 and our leadership team can also be reached at feedback@arrivelogistics.com

Arrive Carrier Requirements

Please have the following info ready to complete registration

  • MC, MX, DOT, or state reg #
  • Tax ID & W9 info
  • Cert of Insurance: $100k cargo, $1M Auto, & $1M commercial general liability coverage
  • Active Common or Contract Authority (365+ days)
  • Safety Rating of at least Satisfactory (or None)

Subscribe to receive freight market updates​

"*" indicates required fields

Quick Apply

"*" indicates required fields

Max. file size: 50 MB.

Download this Report

"*" indicates required fields

Add me to the monthly distribution