"*" indicates required fields
"*" indicates required fields
"*" indicates required fields

April 2021
The Arrive Monthly Market Update, created by Arrive Insights, is a report that analyzes data from multiple sources including but not limited to FreightWaves SONAR, DAT, FTR Transportation Intelligence, Morgan Stanley Research, Bank of America Internal Data, Journal of Commerce, Stephens Research, National Retail Federation and FRED Economic Data from the past month as well as year-over-year.
We know that market data is vital to making real-time business decisions, and at Arrive Logistics, we are committed to giving you the data you need to better manage your freight.
(Click to scroll to section.)
The severe gap between supply and demand became more clear in July as market fundamentals deviated from traditional patterns. A strong outlook for demand and a weak outlook for supply indicate further spot rate growth is likely through the remainder of the year. Elevated contract rates should provide improved tender acceptance rates for shippers, but those playing the spot market will likely incur volatile transportation costs.
• Nationwide freight volumes remained elevated in July, limited only by the amount of available capacity. As much freight is moving as there are trucks to move it.
• Declining tender rejections indicate elevated contract rates are resulting in higher levels of routing guide compliance through primary tender acceptance for shippers.
• Despite declining tender rejections, spot and contract rates continued to climb in July. This is a deviation from historical patterns and illustrates that improved routing guide compliance has not relieved any pressure in the spot market.
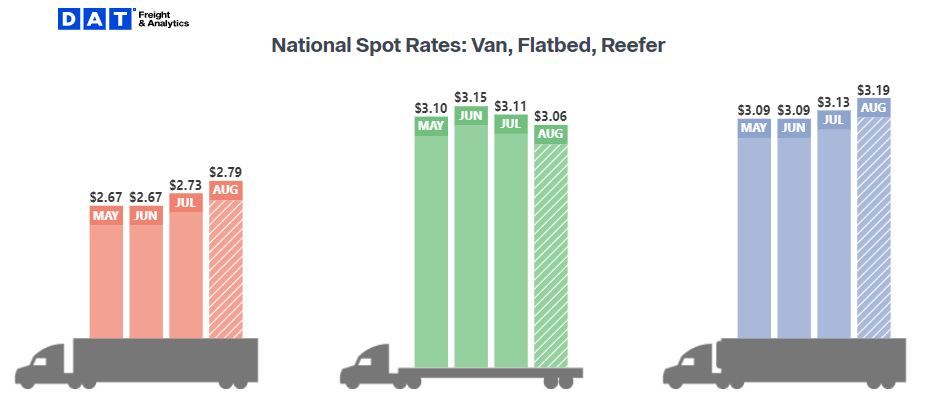
• National average dry van spot rates increased to a new all-time high of $2.73 per mile. Reefer spot rates fell slightly, but remained at $3.11 per mile, just shy of the $3.15 all-time high in June.
• The national average dry van contract rate per mile hit a new record high after its fourteenth straight increase, coming in at $2.84 per mile.
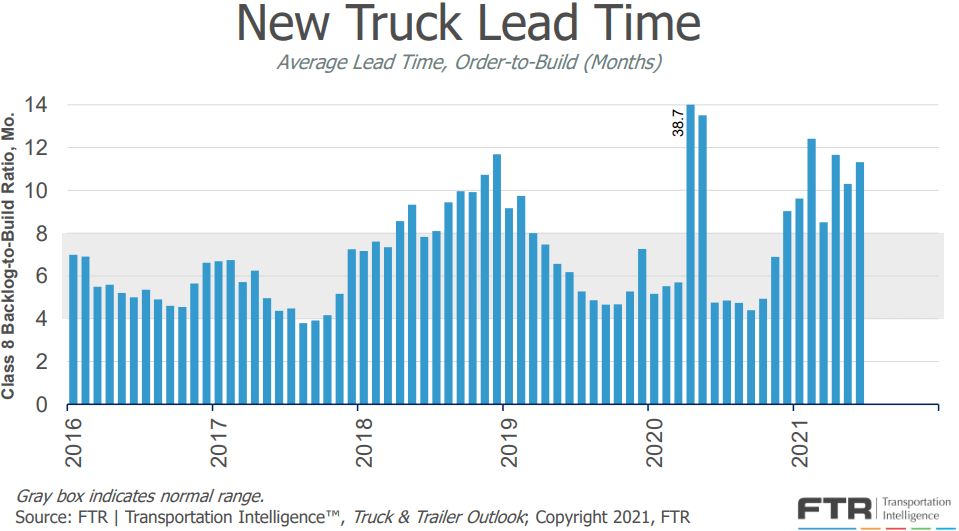
• Truckload supply recovery obstacles are vast. Issues range from parts and labor shortages at truck and trailer OEMs to driver shortages and are unlikely to be resolved in the near term.
• Demand is expected to remain strong, fueled by record imports and low inventories as we head into peak retail season.
There were signs of seasonal slowdowns throughout the month, but truckload demand remained highly elevated in July 2021. This was apparent across all modes of transport in both the spot and contract markets. In a typical year, we expect to see demand ease early in the third quarter, but this is no ordinary year. It seems all freight will move if there is capacity.
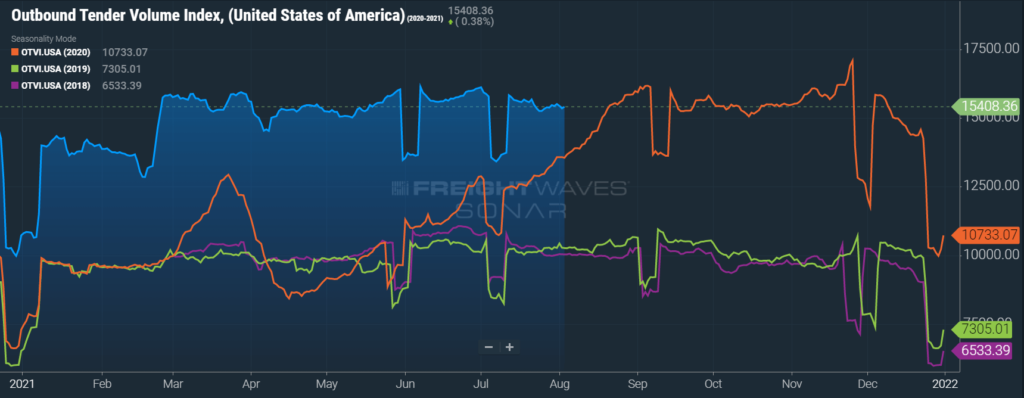
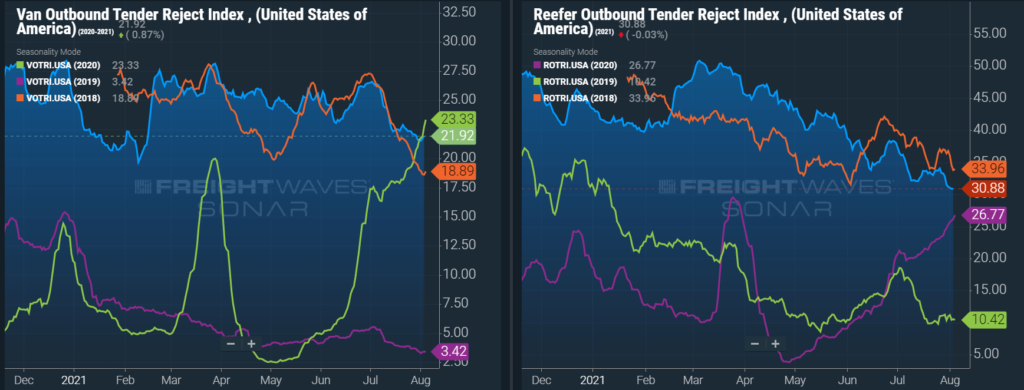
FreightWaves SONAR Outbound Tender Volume Index (OTVI), which measures contract freight volumes across all modes, was up 18% year-over-year at the end of July. It is important to note that OTVI includes both accepted and rejected load tenders, so we must discount the index by the corresponding Outbound Tender Rejection Index (OTRI) to uncover the true measure of accepted tender volumes. If we apply this method to the year-over-year OTVI values, the increase in volume drops slightly to 17%. Tender rejections are very similar to where they were a year ago, explaining why the OTRI adjusted measure is so close to the actual shift in OTVI.
When drilling down to specific equipment types, the dry van and reefer tender volume indices were both up 11% year-over-year at the end of the month, equating to an 11% increase and a 2% decrease in actual volumes for the two modes, respectively. Tender rejections for dry van equipment are dead even year-over-year, resulting in no adjustment to the dry van tender volume growth measure.
Tender Volumes are representative of nationwide contract volumes and act as an indicator of Truckload Demand
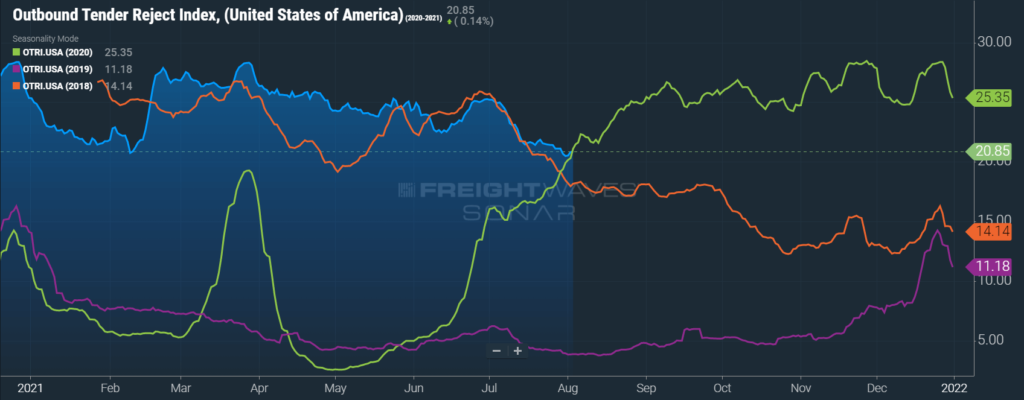
Tender Rejections indicate the rate at which carriers reject loads they are contractually required to take and acts as an indicator of the balance between Truckload Supply and Demand
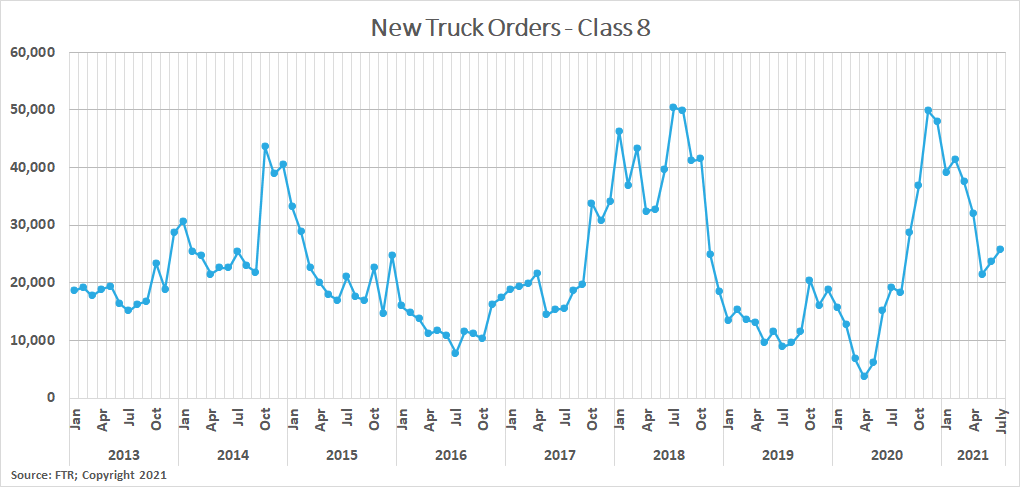
New Truck Orders is an indicator of the trucking industry’s health and carrier sentiment, as carriers typically invest in new trucks when demand and optimism are high.
Industrial Production measures the output of the industrial sector, including mining, manufacturing and utilities.
US Customs Maritime Import Shipments, China to the United States measures the total number of import shipments being cleared for entry to the U.S. from China.
Rate Spread measures the difference between the national average contract rate per mile and the national average spot rate per mile and is closely inversely correlated to movements in tender rejections and spot market volumes.
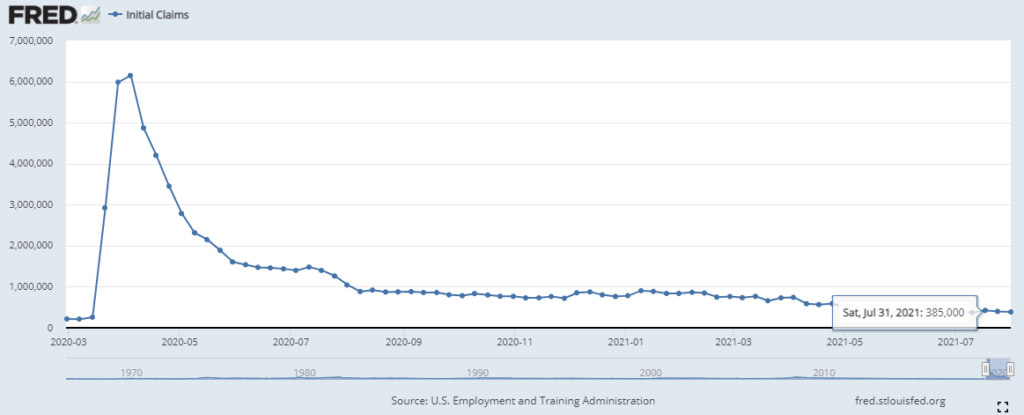
Weekly Jobless Claims are used as a barometer for the pace of layoffs in the general economy.
Unemployment Rate is the number of people who are unemployed that are actively seeking work.
"*" indicates required fields
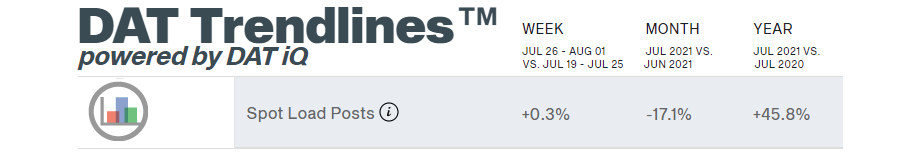
DAT reported dry van spot load posts fell 17.1% month-over-month in July but remained up by 45.8% year-over-year. This is a major pullback from June, when year-over-year spot load posts were up 101.5%. With load volumes growing rapidly at this time in 2020, year-over-year comparisons begin to trending back to historically normal ranges. Week-over-week spot volume growth shows a slight 0.3% increase, indicating steady volumes in the final week of July.
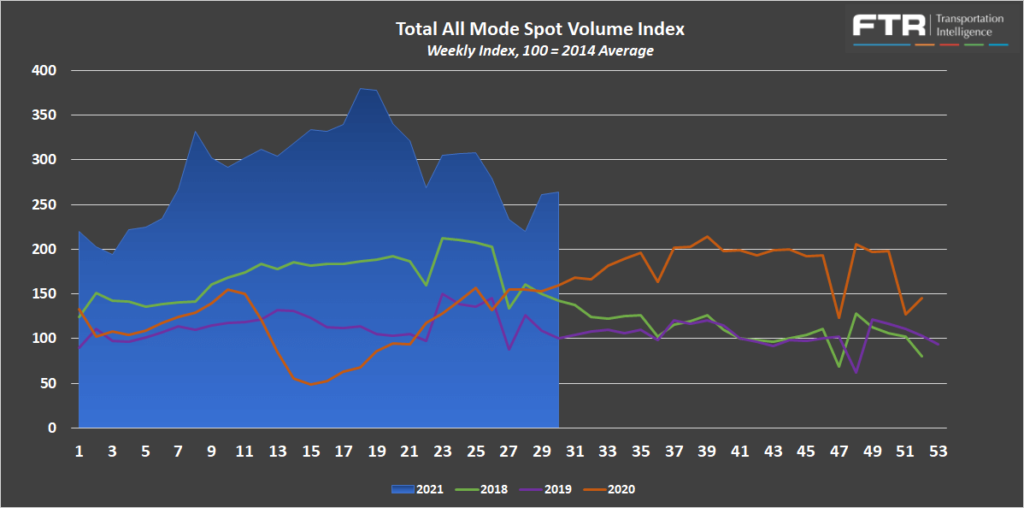
FTR and Truckstop’s Total All Mode Spot Volume Index finished the month up 20% from the low seen mid-month but still finished down roughly 6% month-over-month from June. The all- mode index remained up 66% year-over-year, down from 112% year-over-year at the end of June. This rapid decline in year-over-year comparisons aligns with other indices and is a result of the rapidly increasing volumes a year ago.
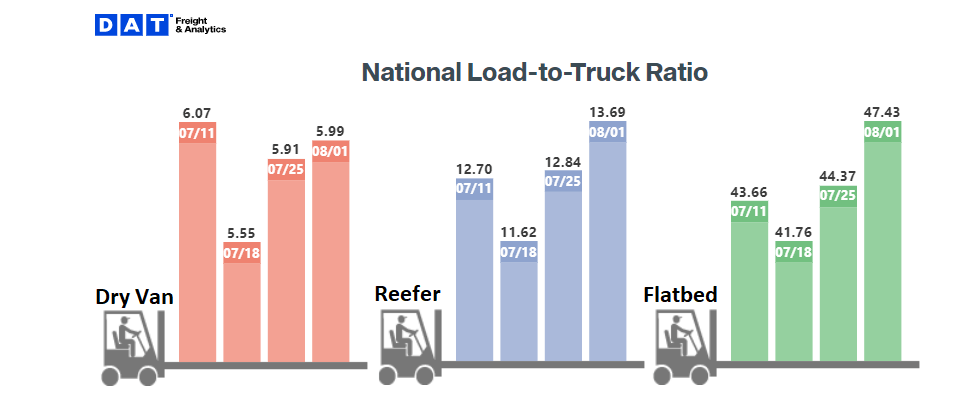
The DAT Load to Truck Ratio measures the total number of loads compared to the total number of trucks posted on their load board. In July, the Dry Van Load to Truck Ratio increased to 5.81, up 4.5% month-over-month and 32% year-over-year. The Reefer Load to Truck Ratio increased to 12.56, up 8.4% month-over-month and 70% year-over-year.
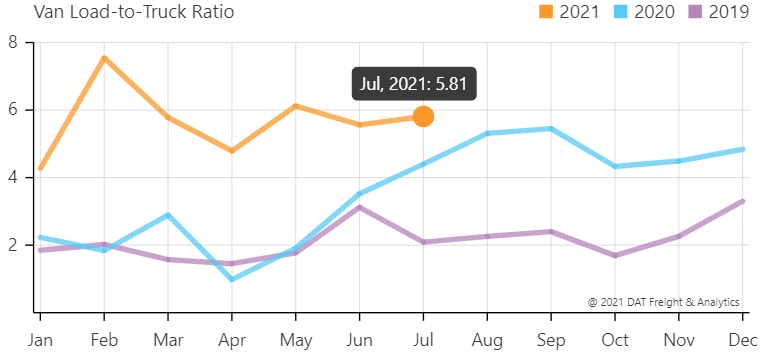
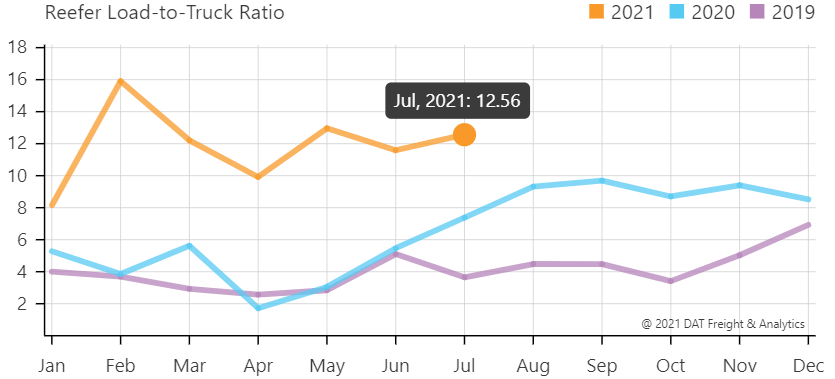
The weekly load to truck ratios show conditions eased early in the month but tightened in the back half across all three equipment types. This increase in tightness late in the month is a deviation from the normal seasonal trend that typically results in softening conditions from July Fourth through at least mid-August. If load to truck ratios remain elevated, expect to see further upward pressure on spot rates.
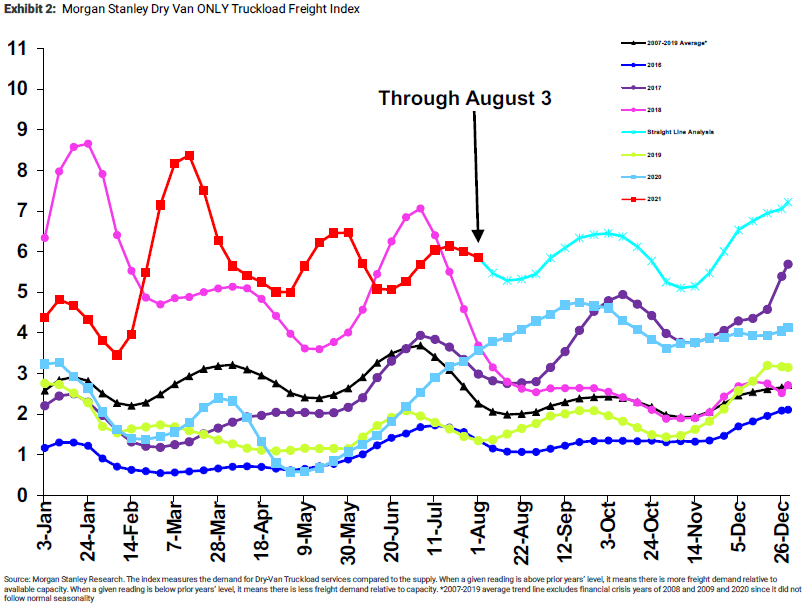
The Morgan Stanley Dry Van Freight Index is another measure of relative supply. The higher the index, the tighter the market conditions. According to the index, conditions opened up slightly as of late, but the data is two weeks in arrears and may not yet be capturing the tightening trend other indices have picked up on. Looking forward, normal seasonality indicates softening conditions in early August, but recent trends show the index will remain elevated through the remainder of the year, outperforming the straight-line forecast presented on the chart.
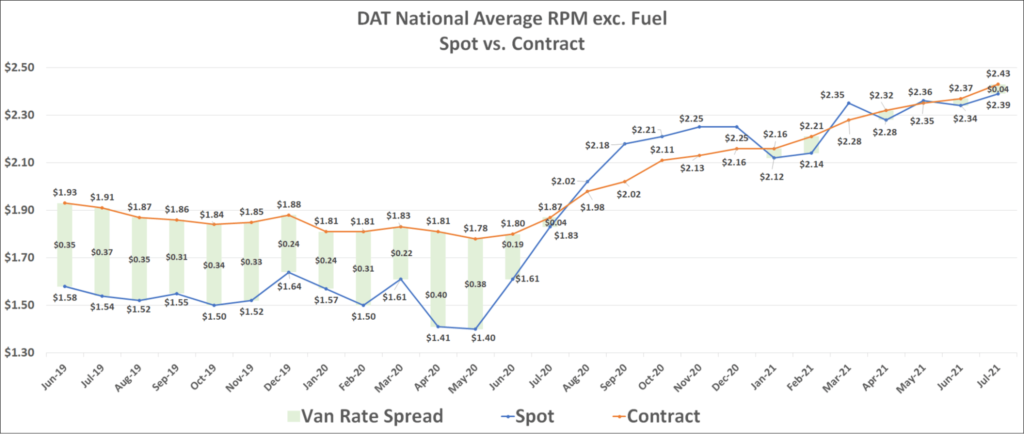
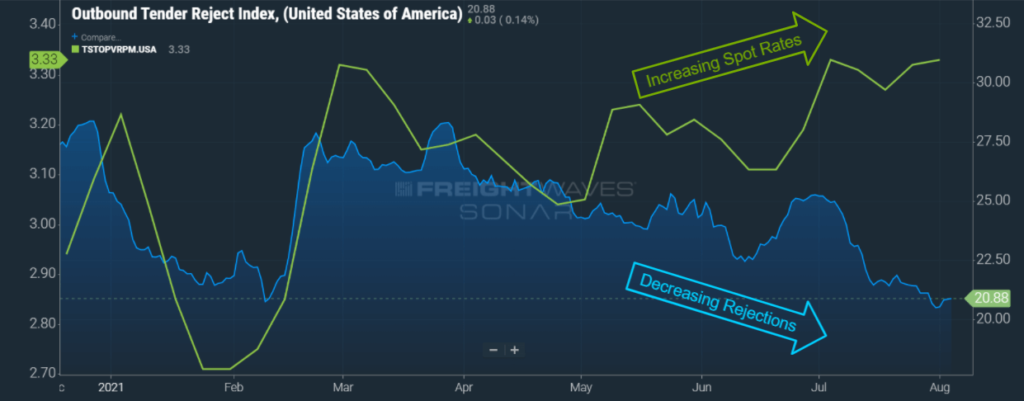
Contract rates, which have not declined month-over-month since May 2020, reached a new all-time high in July of $2.43 per mile, excluding fuel. Historically, there is a very strong correlation between contract tender rejections and spot rates. When one increases or decreases, the other does the same. Over the last few months, we saw the opposite trend set in. Despite decreasing tender rejection rates, spot rates continue to climb. The chart below illustrates this trend really taking hold throughout July.
Unprecedented demand levels and the high level of uncertainty shippers are facing when it comes to their transportation spend are major factors in driving this abnormal trend. Elevated contract rates are finally starting to result in increased tender acceptance, but capacity in the spot market is still stretched too thin for it to have made an impact. Recent trends indicate rates are not likely to see deflationary pressures in the near term.
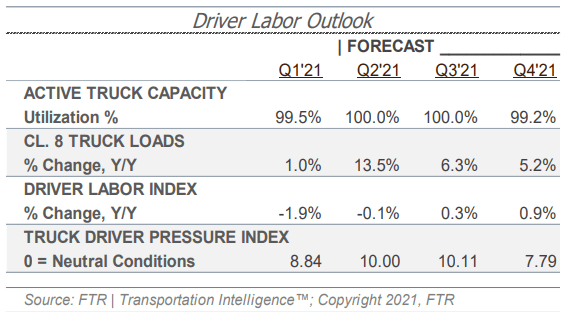
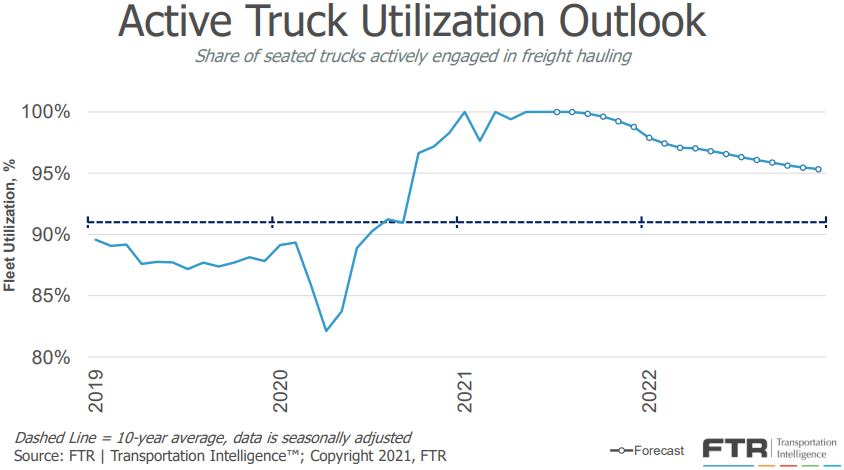
FTR’s forecast for truck utilization, the share of seated trucks actively engaged in freight hauling, shows active truck utilization remaining at 99% or higher through the remainder of 2021 and above 95% through 2022. For a point of reference, the average active truck utilization over the past ten years is 91%. FTR noted one risk to this forecast is if unemployment benefits are sharply reduced, higher rates of labor participation could mean capacity will return more quickly than expected.
FTR reports that new truck orders continued their upward trend in July, with preliminary results indicating 25,800 new Class 8 trucks were ordered in the month — an 8.8% increase from 23,720 in June, and a 34% increase from 19,213 in July 2020. This is now the eleventh straight month with new orders above the 20,000 units required to sustain current levels of capacity. FTR noted they expect an order surge when manufacturers start booking for 2022, but said that OEM’s had not yet indicated when that would be.
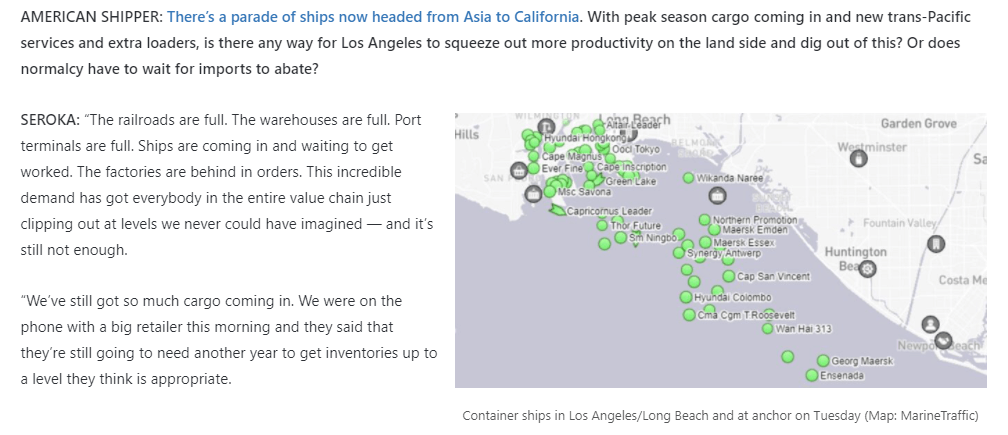
There is an incredible amount of freight already here, just sitting in a warehouse or rail yard waiting to be moved to its final destination. Seroka noted that Union Pacific had 25 miles worth of trains and BNSF had 22 miles of trains, all sitting outside of the Joliet, IL rail facility.
It is going to take time to work through all of these backlogs, especially with peak retail season on the way. Inventory shortages will need to build back up, once the backlogs are cleared.
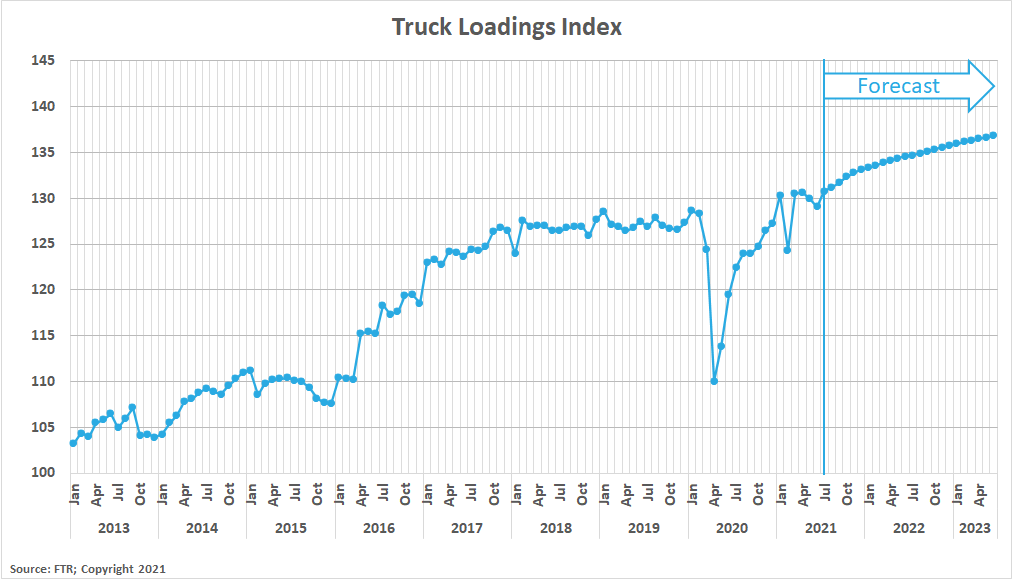
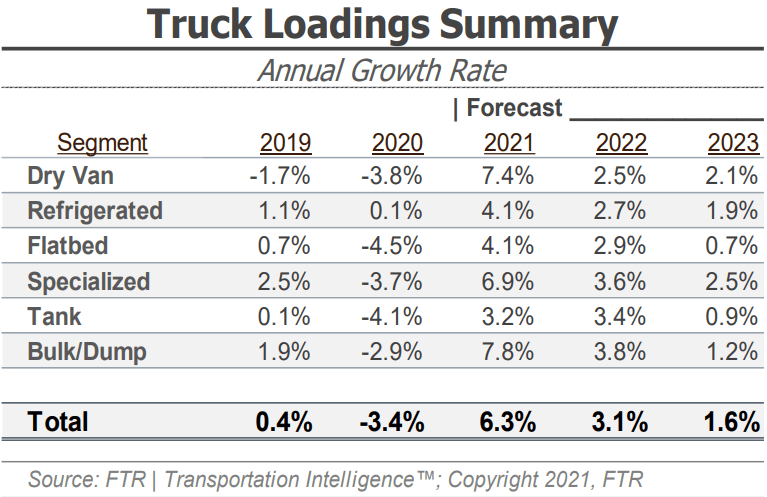
FTR’s latest truck loadings forecast shows a slightly weaker outlook, with a sharply improved forecast for chemicals driving tanker loadings to be the only segment seeing a higher forecast for 2021 than last month’s forecast. In the dry van sector, the forecast shows a total truck loadings increase of 7.4% for the full year, down from 8.3% a month ago. Refrigerated and flatbed loadings are both expected to see 4.1% increases in truck loadings in 2021. While reefer loadings forecasts are essentially unchanged, flatbed loadings forecast are down from 4.9% last month.
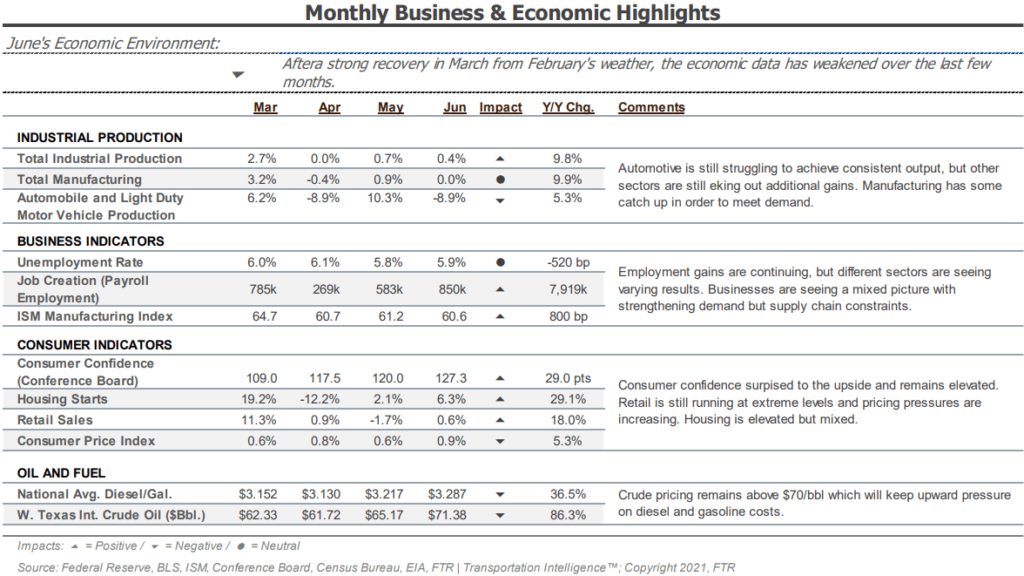
Although the economy saw several months of weaker data, year-over-year comparisons remain positive and the outlook for continued growth remains strong as the average American consumer is in a solid position as a result of government stimulus, improved employment opportunities and increasing wages.
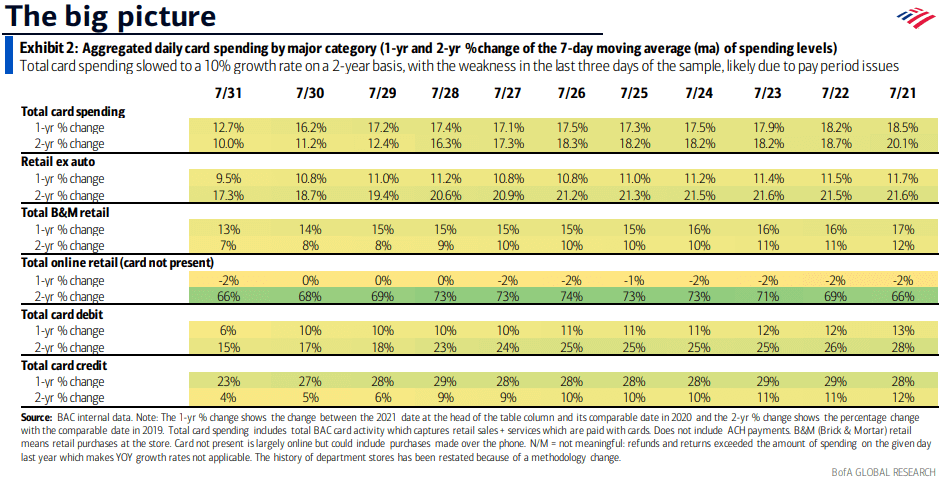
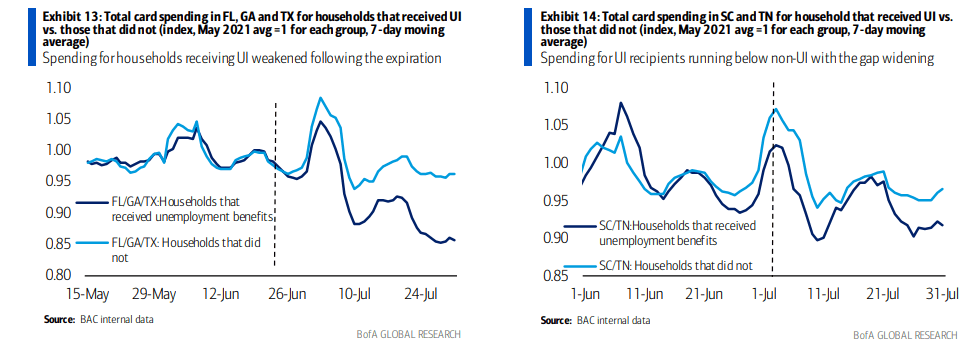
One of the main factors BofA is watching as it relates to spending is the impact of expiring unemployment insurance benefits. They monitored spending for those who had received benefits vs. those who had not, in states where the benefits were allowed to expire. After several weeks, spending from those previously receiving benefits began to lag further behind those who had not received benefits. This data supports the idea that if UI benefits are allowed to expire, we could see labor shortage issues at least partially resolved as individuals return to the workforce.
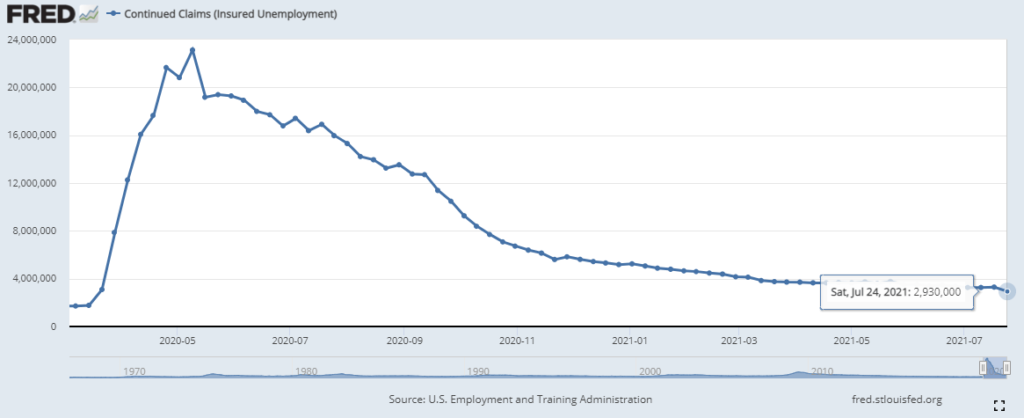
The unemployment trends continued to gradually improve in July. Initial claims in the most recent week came in at 385,000, roughly flat from last month, and continued claims are relatively down to 2.9 million from 3.3 million last month, on a weekly basis.
Market dynamics between spot rates and contract tender rejections in July helped expose how large the gap is between truckload supply and demand. Easing freight volumes and declining tender rejections are normally associated with declining spot rates, but instead, spot rates climbed to new all-time highs.
Conditions have been stable month-to-date in August, but early spot rate reports indicate the increasing rate trend will continue. This leaves little hope of seeing deflationary rate conditions by the end of the year, as the forecast for demand remains strong heading into peak retail season in the fourth quarter. Shippers with consistent and predictable freight volumes should lock in contract rates with reliable and trustworthy transportation providers to limit spot cost volatility in the fourth quarter.
There are still too many unknowns to forecast when capacity will catch up with demand, but low inventories and backlogs of freight across the country should result in elevated demand through the first quarter of 2022 at the earliest. Early second quarter is the soonest we believe rates will begin to ease. It is hard to imagine these conditions lasting another year, but all signs point in that direction.