
Truckload demand has been somewhat difficult to interpret over the past few months. It was clear there had been a shift of some sort, but determining what changed has proven elusive. Our evaluation is that while freight volumes remain relatively stable above historical levels, instead of loads moving via the spot market, shippers have seen better routing guide compliance enable a significant demand shift to the contract market.
The FreightWaves SONAR Outbound Tender Volume Index (OTVI), which measures contract tender volumes across all modes, was down 20.2% year-over-year in early August.
Of course, it is important to note that OTVI includes both accepted and rejected load tenders, so we must discount the index by the corresponding Outbound Tender Rejection Index (OTRI) to uncover the true measure of accepted tender volumes. The downward tender volume trend dropped to 5.5% below last August when applying this method to year-over-year OTVI values. Although this trend indicates a pullback from 2021, we recognize 2021 was an unprecedented year, and volumes remain elevated compared to pre-pandemic levels.
Tender rejection8s are down 70%, from 20.8% a year ago to 6.19% as of Tuesday, August 2nd, which helps explain the lower negative growth trend in accepted tender volumes compared to the decline in total tender volumes.
As for specific equipment types, the dry van tender volume index was down 21.9%, and the reefer tender volume index was down by 24.7%, equating to a 6.6% year-over-year decrease for actual van volumes and a 1.6% increase in actual reefer volumes. Dry van tender rejections are down more than 70% year-over-year. For reefer equipment, that number is as high as 78%.
Accepted contract volumes are down 5.5% y/y in early August, but remain above historical levels
An alternative method to load volumes when measuring demand is to look at a ton-miles index. This index can sometimes better estimate how much freight is moving and how far it has traveled than volumes, which do not consider how full trucks are when being run and the length of a haul. It is also spot and contract agnostic and thus offers a more complete view of the total market.
One such index is the For-Hire Trucking Ton-Mile Index (TTMI), published by Jason Miller, a professor at Michigan State University, and Yesimi Bolumole, a professor at The University of Tennessee, Knoxville. The most recent revision of the index indicates that total ton-miles in June 2022 were up 3.8% year-over-year. Given the current economic trends, it is fair to assume that ton-mile growth could slow in the months ahead, but recent trends support the likelihood of gradual shifts in demand.
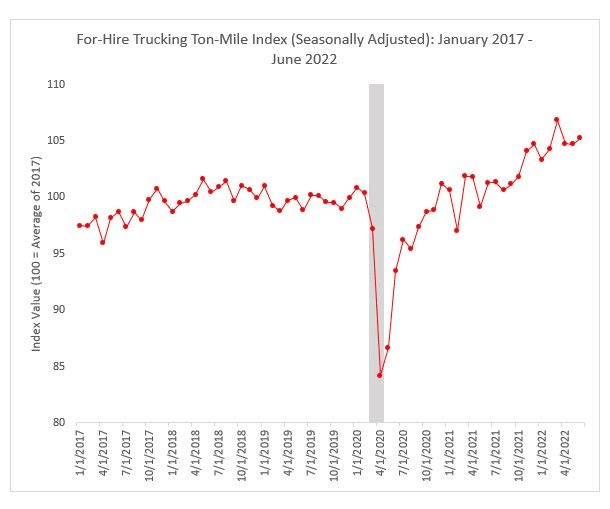 Trucking Ton-Mile Index Published by Jason Miller, a professor at Michigan State University and Yesimi Bolumole, a professor at The University of Tennessee, Knoxville.
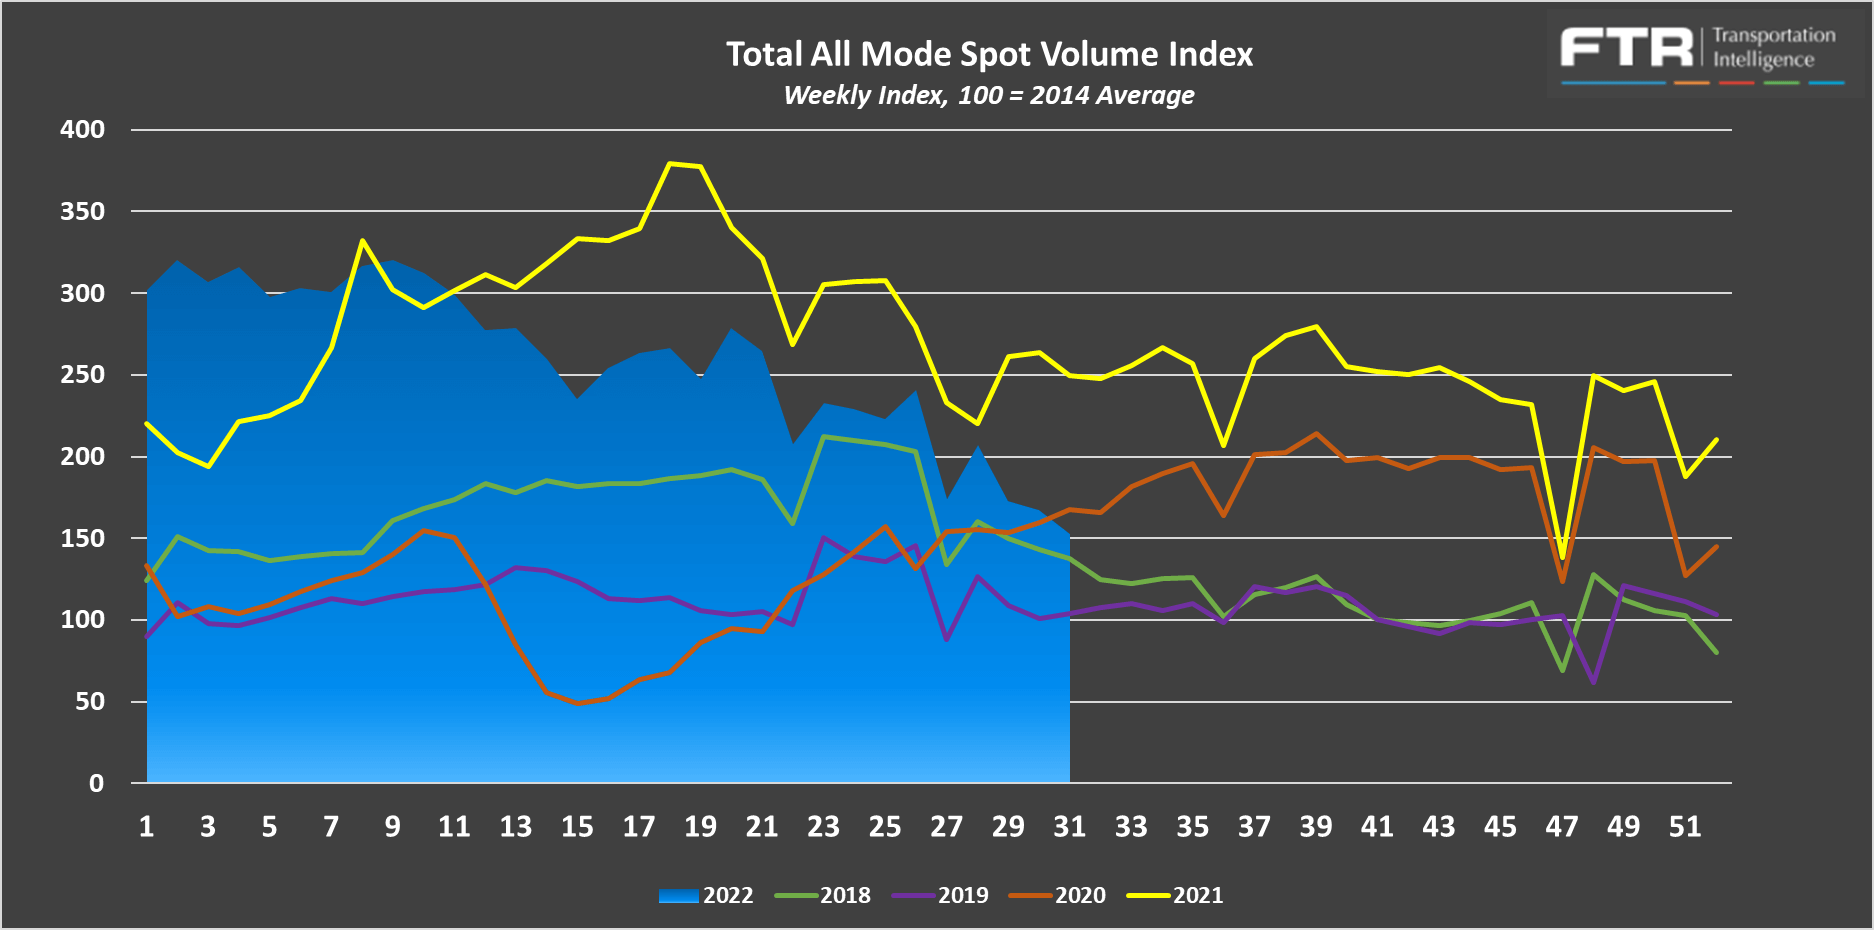
With the demand shifting away from the spot market, we continue to see negative spot demand growth. DAT data indicates that year-over-year spot volumes were down by 34% in July after falling by 26% month-over-month from June. Although we are used to seeing some slight sequential easing of spot demand in July, the decline in June is highly abnormal and demonstrates the continued shift of volumes to the contract market.
FTR and Truckstop’s Total All Mode Spot Volume Index helps illustrate that even though spot volumes are down from last year, they remain in line with pre-pandemic levels. The All Mode Index is now down 39% year-over-year but is up 46% from 2019.
Truckload supply has shown signs of stability over the past month. All indicators point to slight sequential capacity improvements and vast year-over-year improvements. That means while conditions in early August remain relatively similar to June and July, capacity has improved significantly compared to a year ago.
The Sonar Outbound Tender Reject Index (OTRI) measures the rate at which carriers reject the freight they are contractually required to take. The current rate is 5.99% in early August, which indicates shippers are seeing extremely high routing guide compliance on their contractual freight, matching the forecast from our July report.
The only other time rejection rates were this low at this time of year was in 2019. Easing seasonal demand and the gap between spot and contract rates were the main contributors to declines in tender rejections throughout the month.
Normal seasonality would point to slight increases in rejection rates as we approach Labor Day and move into the fourth quarter. Still, we don’t expect any noticeable jump at the national level until at least mid-November, in the weeks leading up to Thanksgiving.
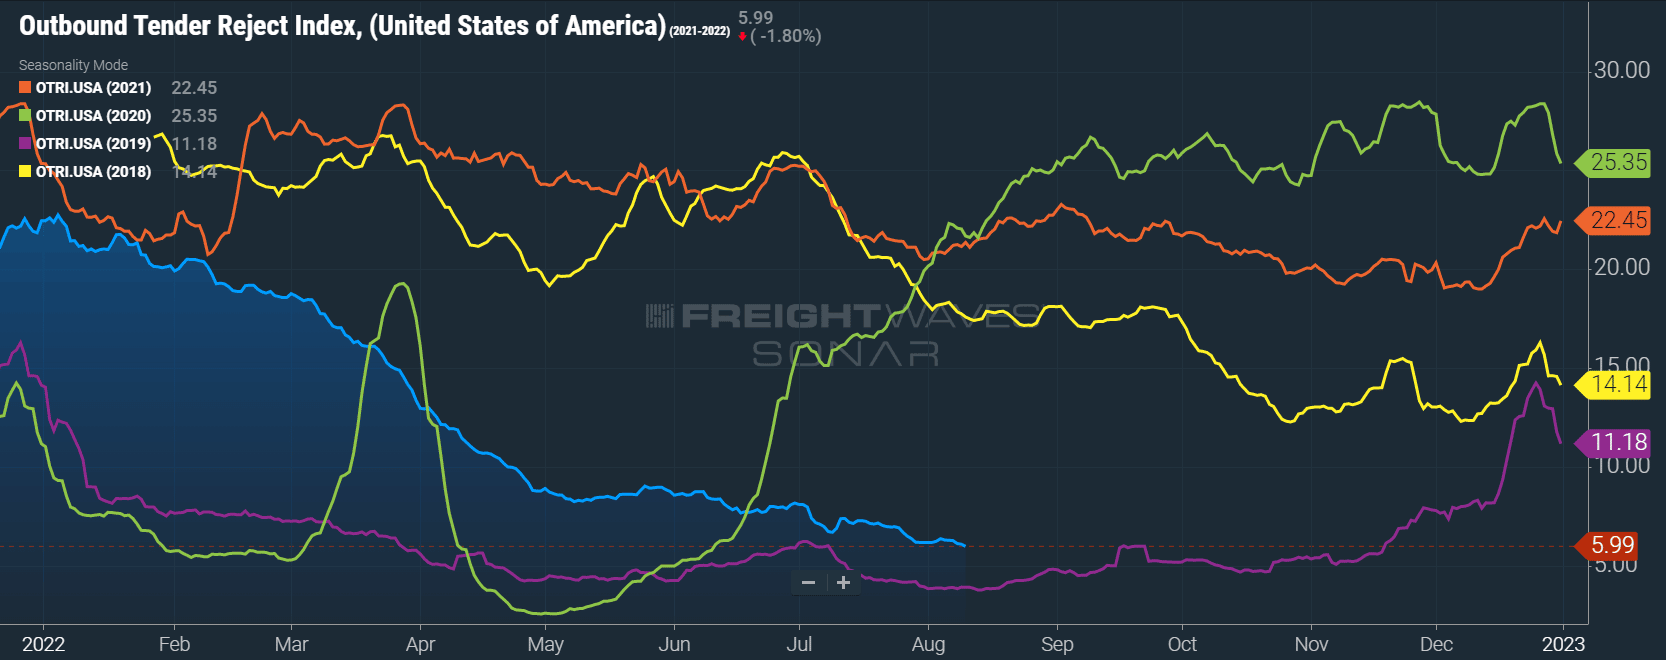
OTRI continued to normalize to equilibrium levels throughout July and early August, falling to less than 6%. A sign that strong routing guide compliance is here to stay.
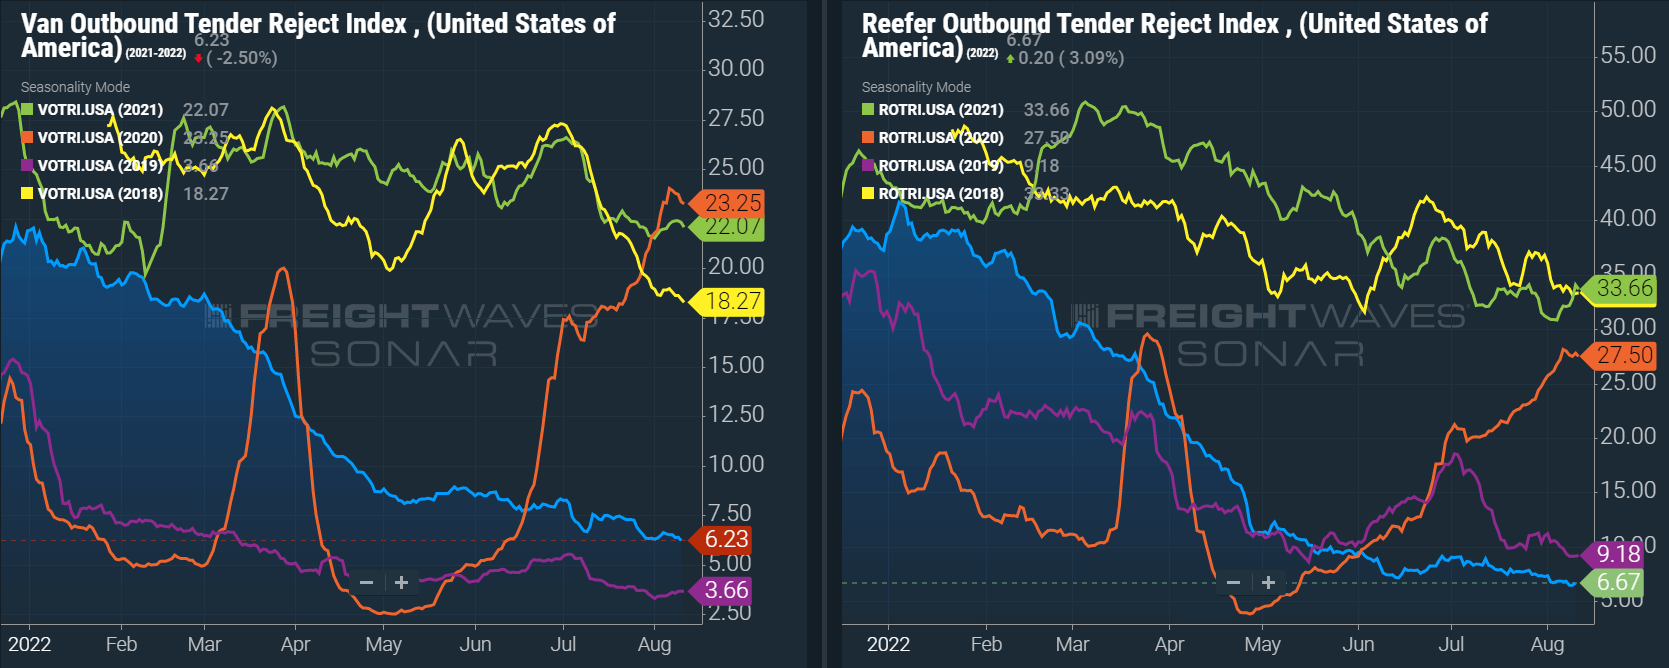
Dry van and Reefer tender rejections followed a similar trend to the all mode index, continuing to normalize through July and early August.
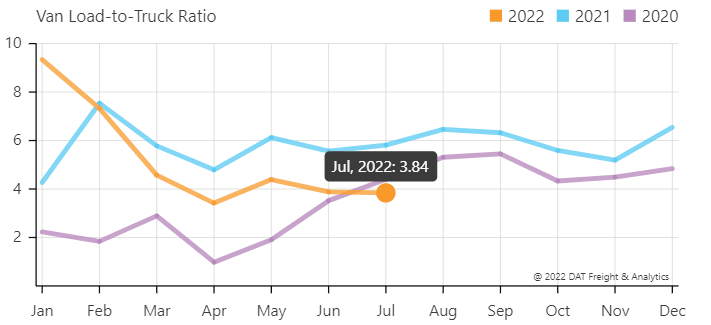
The DAT Load to Truck Ratio measures the total number of loads compared to the total number of trucks posted on their load board. In July, the Dry Van Load to Truck Ratio fell to 3.84, down just 0.8% month-over-month and 33.8% year-over-year.
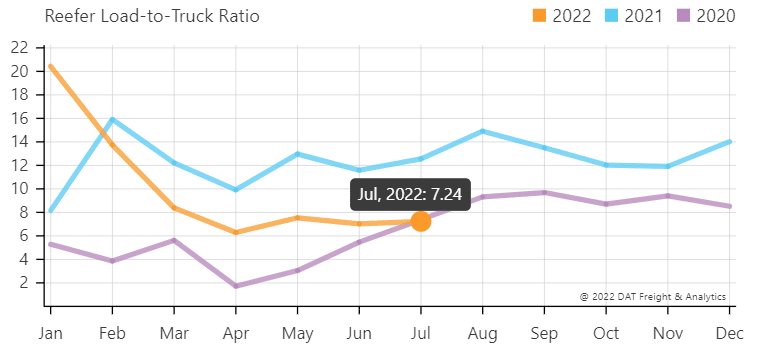
The Reefer Load to Truck Ratio increased to 7.24, up 3% month-over-month but down 42.3% year-over-year.
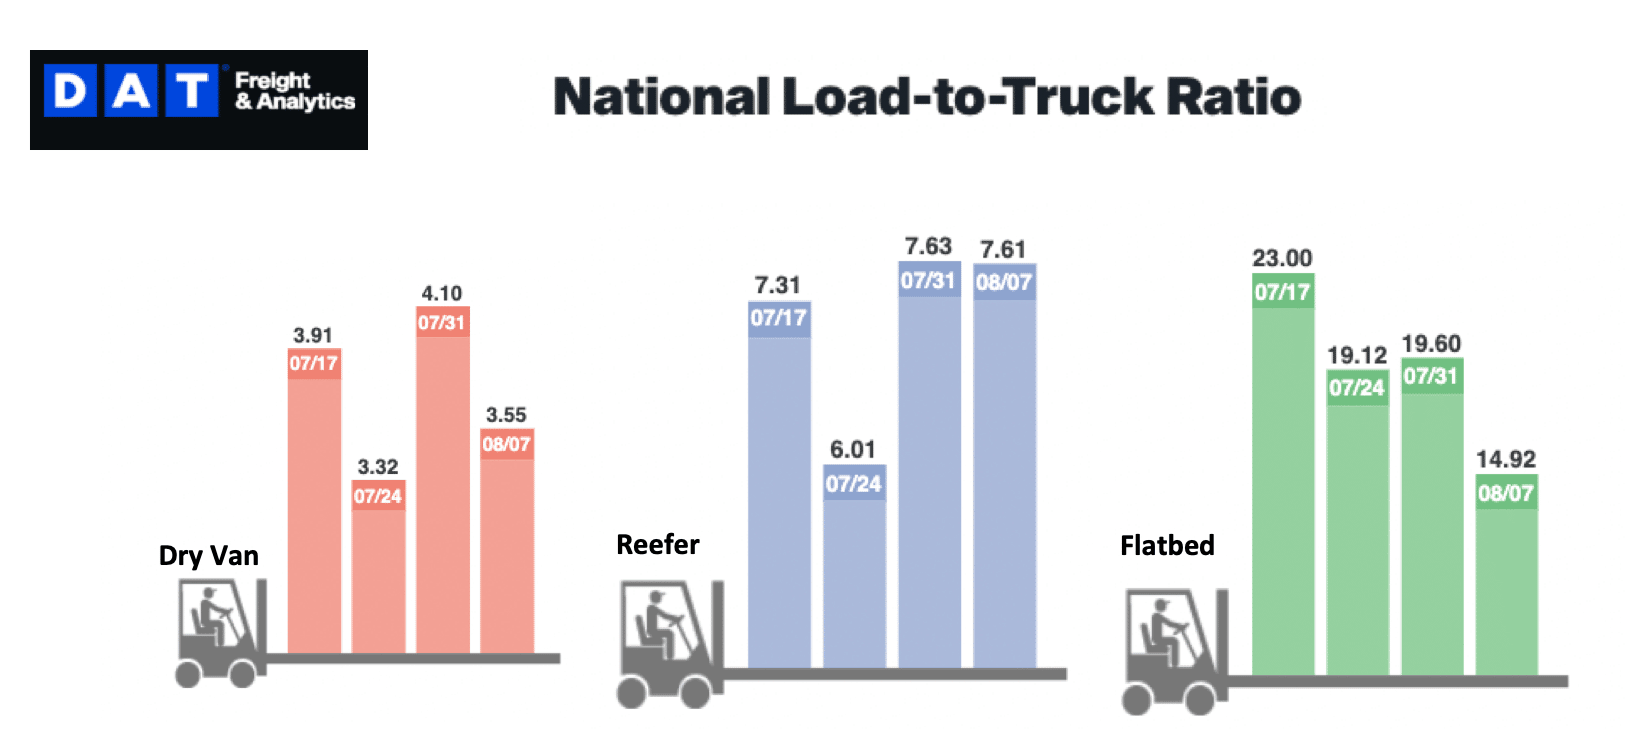
Weekly load to truck ratios for van and reefer saw some tightening in the last week of July but have started softening over the first week of August. We expect this trend to continue in the weeks ahead as demand eases in line with the seasonal demand slowdowns we typically see this time of year. However, we expect to see some short-lived volatility around Labor Day.
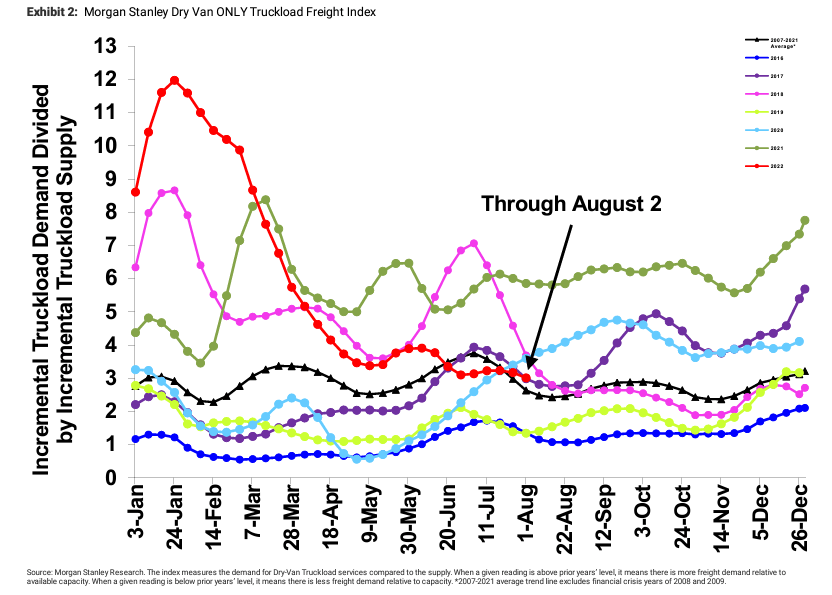
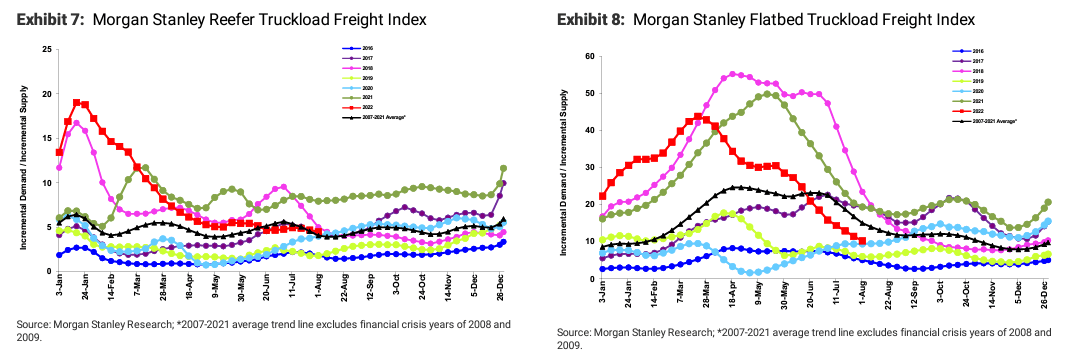
The Morgan Stanley Dry Van Freight Index is another measure of relative supply. The higher the index, the tighter the market conditions.
Data from the last six weeks supports our view of stable and even improving capacity conditions. The index showed some bias towards seasonal pressures but overall remained relatively flat. The black line with triangle markers on the chart provides a great view of what directional trends would be in line with normal seasonality based on historical data dating back to 2007. This data leads us to believe that conditions will continue to ease throughout the month.
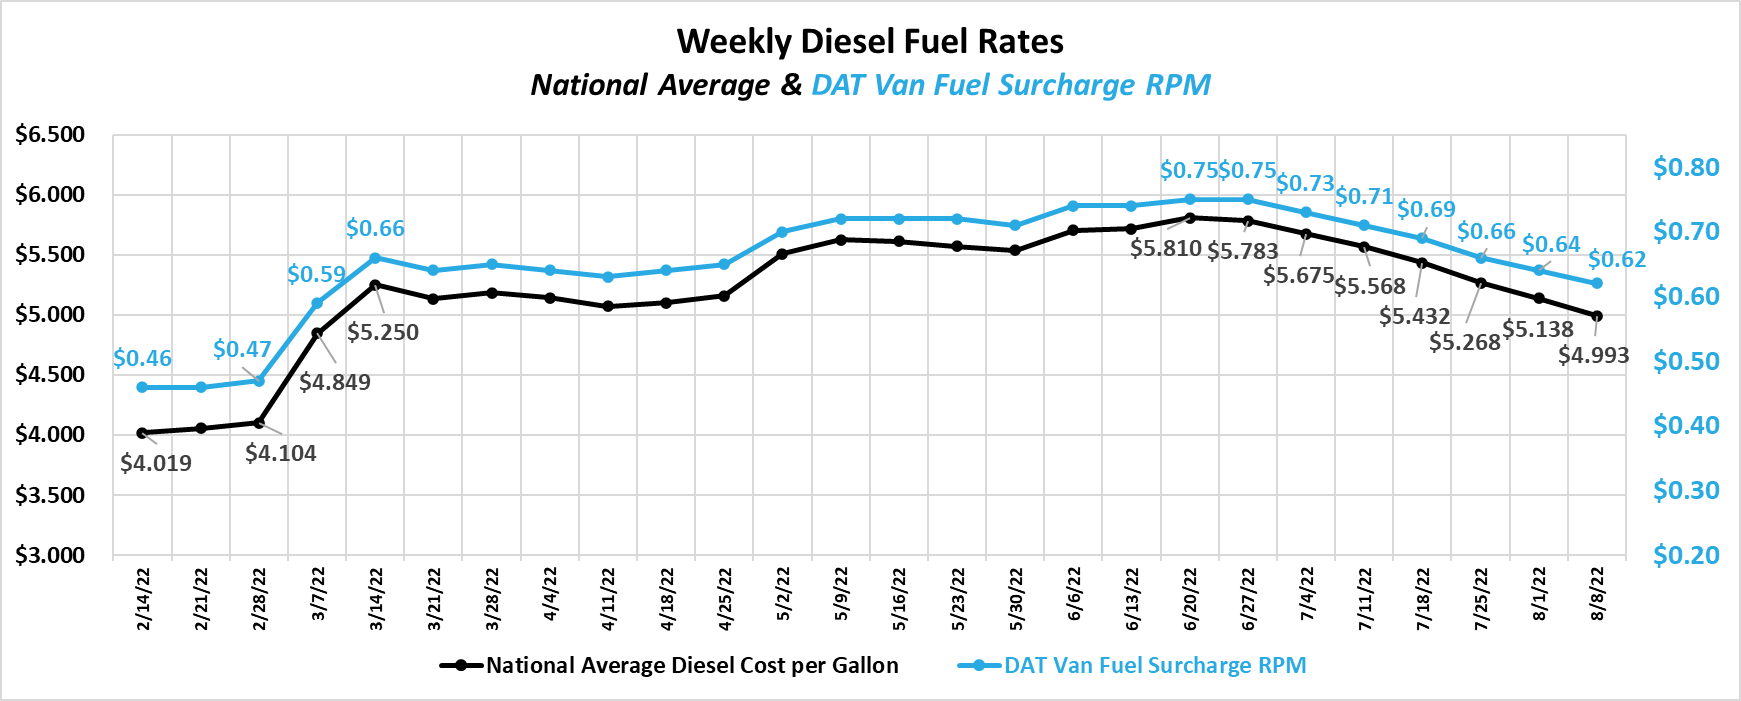
No variable has had a more significant impact on 2022 rates than fuel costs. In early March, rapid fuel cost increases helped drive improvements in contract tender acceptance rates, starving the spot market of demand and generating rapidly declining spot rates. From late June through early August, the national average cost per gallon of diesel fuel has fallen by more than $0.80, resulting in a decline in the van fuel surcharge rate per mile of $0.13, according to the DAT’s fuel schedule. We believe declining fuel costs, which can provide shippers with cost savings and lower carrier operating costs, will reduce the pressure on carriers to lower their linehaul rates.
Trends for all-in spot rates, including linehaul and fuel costs, continue to show sequential declines month-over-month. These drops, however, are driven mainly by the fuel cost declines in recent weeks. For example, all-in dry van spot rates have fallen by $0.05 month-over-month from $2.64 per mile in July to $2.59 in early August. The average fuel surcharge has fallen by $0.07 per mile over that same period. So, even though the total cost to shippers is falling, it appears as though the linehaul portion has seen an increase. We do not believe this linehaul cost increase is entirely dependable but rather a result of both the way spot rates are typically negotiated as all-in rates, and the standardized approach to backing out fuel costs.
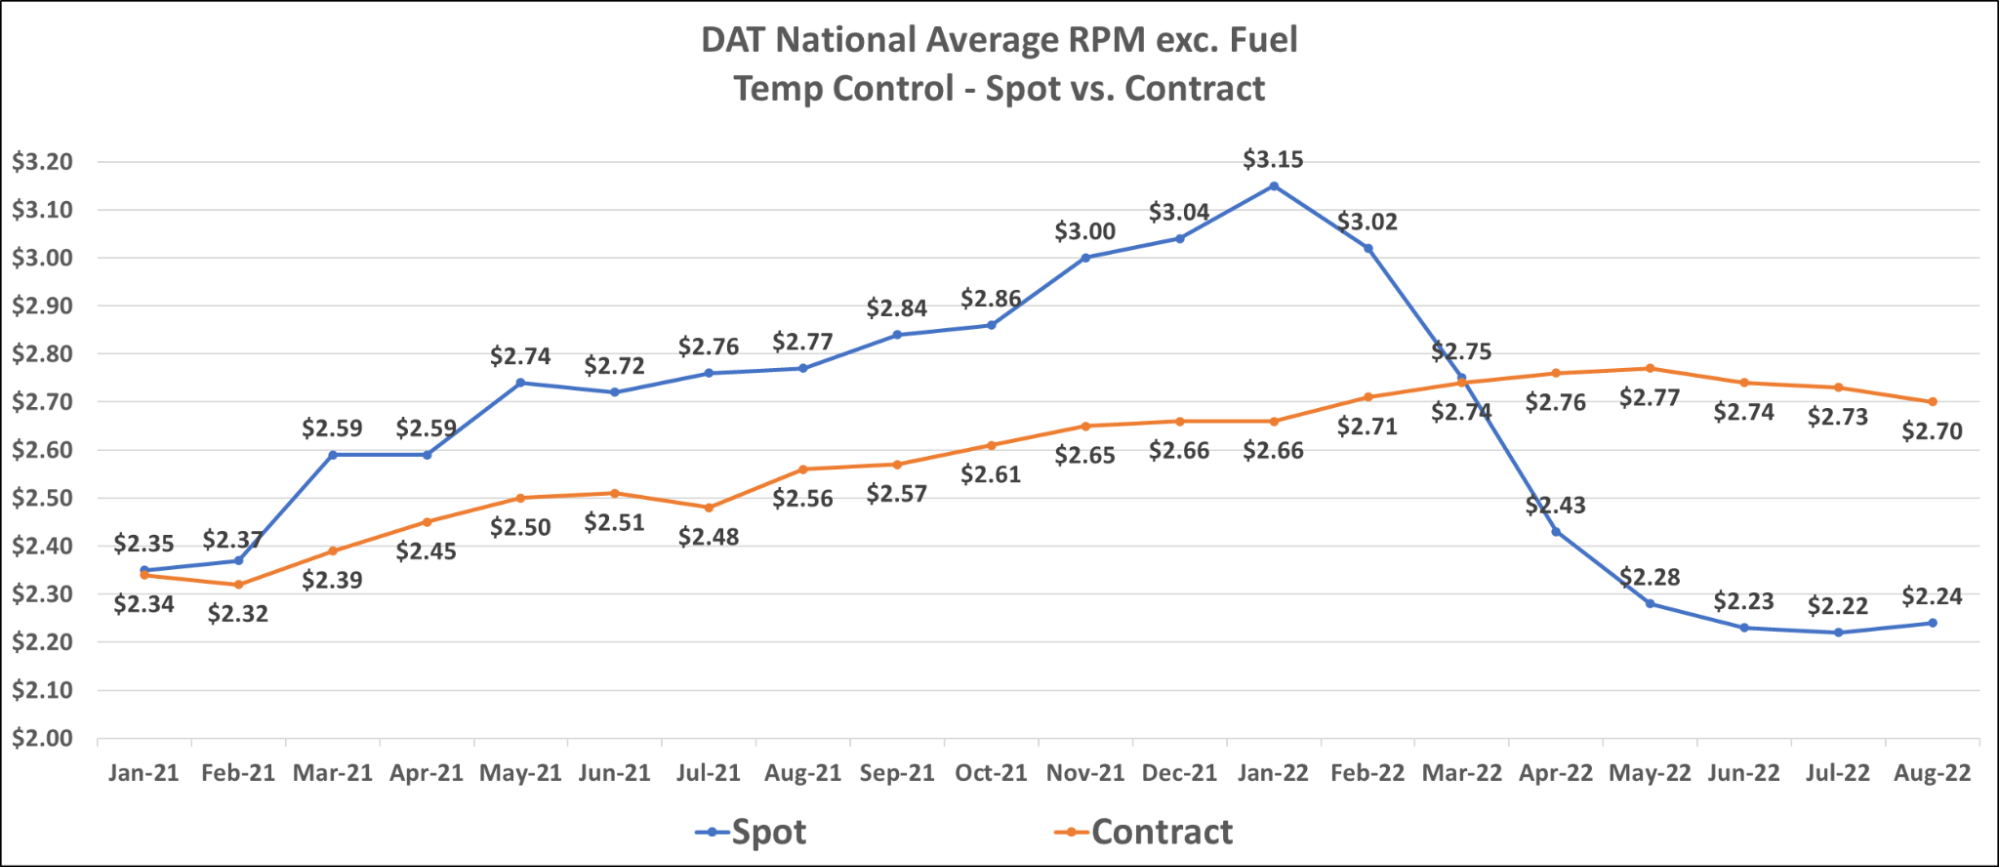
As noted above, we have seen somewhat strange trends with linehaul rates in early August. Van spot and contract linehaul rates are increasing into early August, while all-in rates show continued declines. With van contract rates still elevated significantly above spot rates, we expect to see ongoing downward pressure on contract rates until the gap between them closes further. The current dry van contract rate is $2.53 per mile, excluding fuel. An increase of 4.1% from $2.43 per mile in August 2021. Although rates remain up year-over-year, it is only a matter of time before we see contract rates display negative annual growth. In fact, we have already seen a 3.8% decline from the peak of contract rates, excluding fuel, in February.
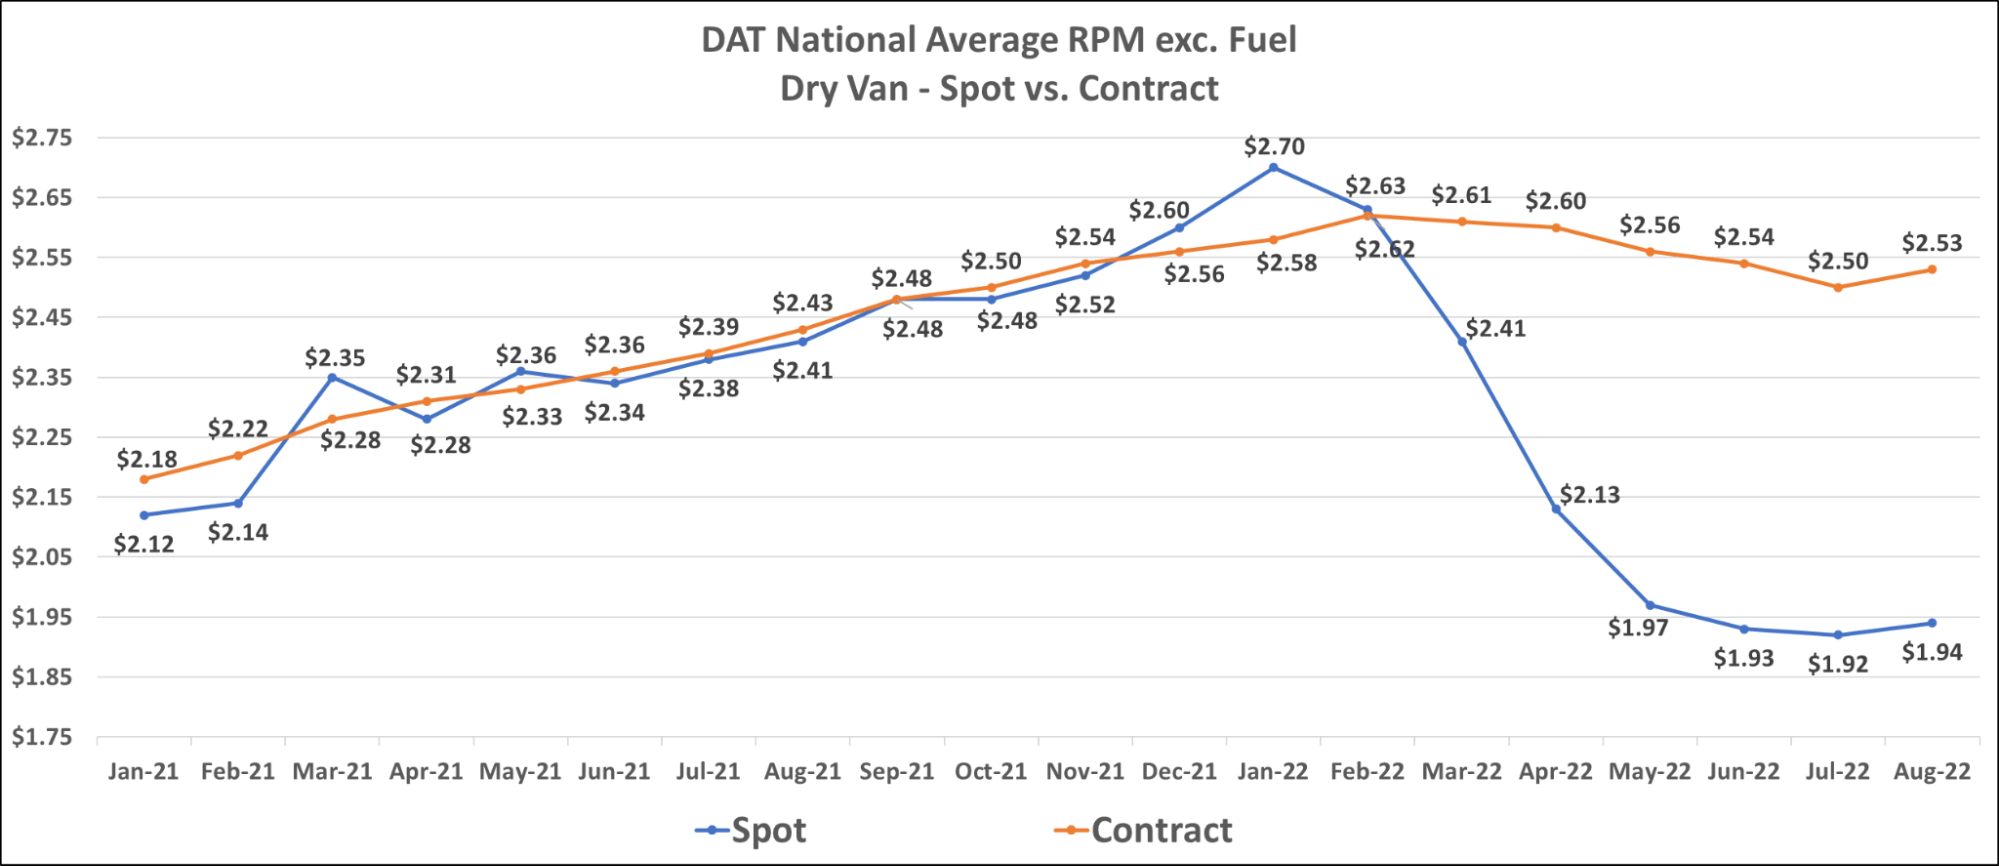
Dry Van spot and contract linehaul rates have trended up slightly in early August, as fuel savings have stabilized declines in the linehaul portion of truckload rates.
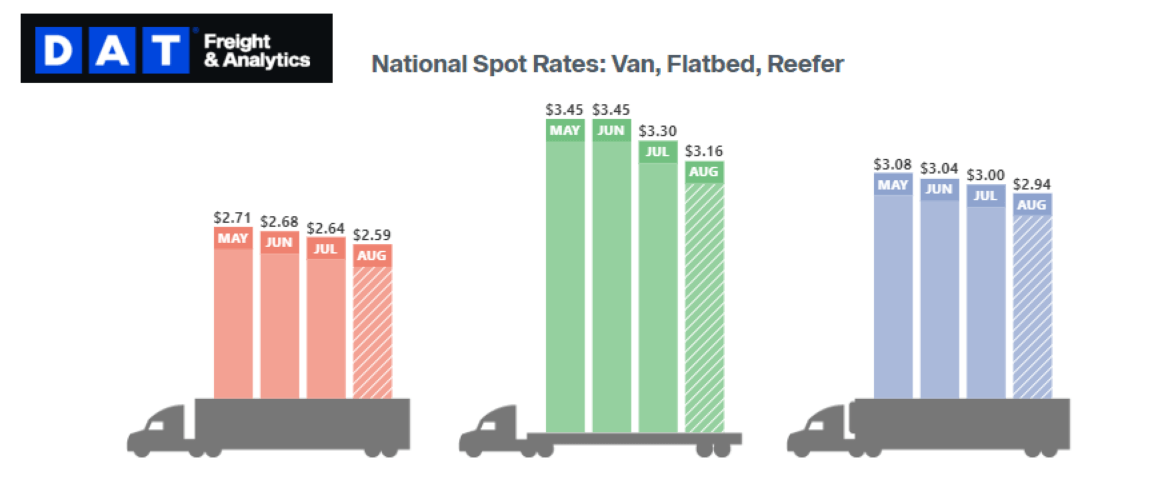
While reefer spot rates have experienced the same abnormal trend of decreasing all-in rates (with an increase in linehaul rates), reefer contract linehaul rates fell sharply enough to offset the declines in fuel surcharges. The current reefer contract rate is $2.70 per mile, excluding fuel. An increase of 5.5% from $2.56 per mile in August 2021. The current reefer spot rate is $2.24 per mile, excluding fuel. A decrease of 19.1% from $2.77 per mile in August 2021.
As we gear up for the fall harvest season, which begins in the next month or two, we expect to see some regional tightness in the typical areas such as Washington, Idaho, Minnesota, Wisconsin, Michigan, Pennsylvania and New York. We also expect outbound California produce demand to remain steady for the next month before tapering off into the fourth quarter.
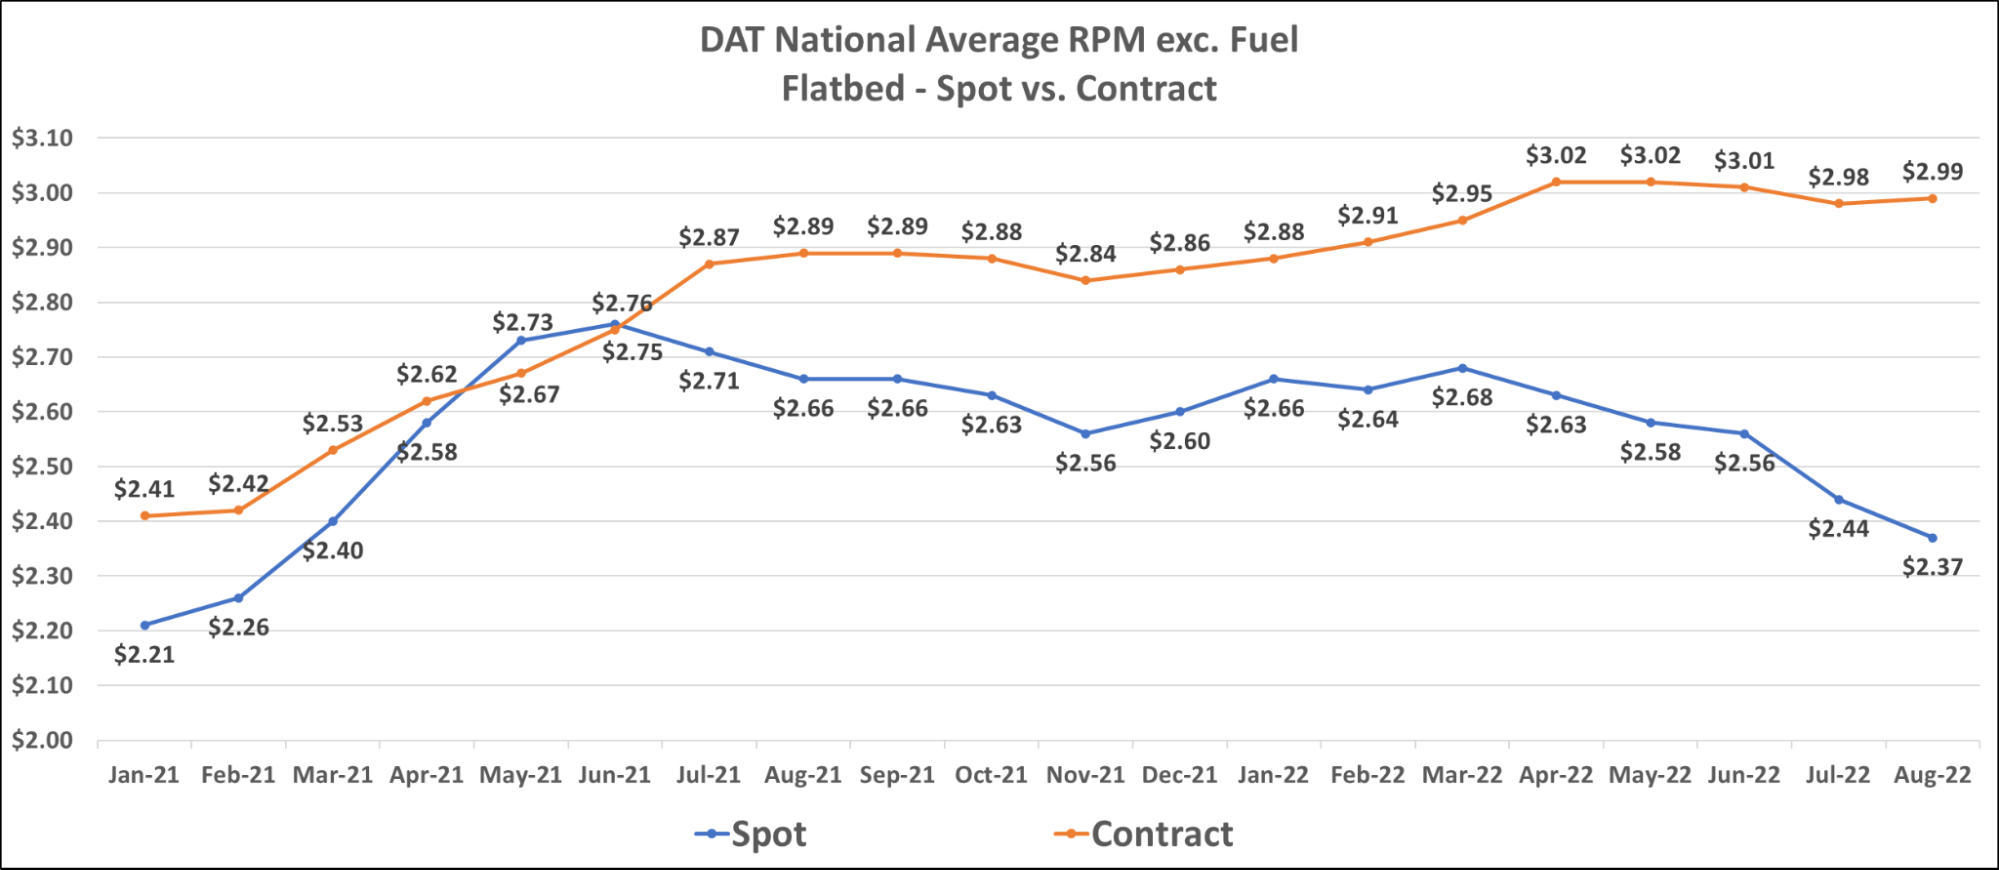
The flatbed market has seen relatively stable contract linehaul rates, considering how rapidly we have seen spot linehaul rates decline. The current flatbed contract rate is $2.99 per mile, excluding fuel. An increase of 3.5% from $2.89 per mile in August 2021. The current flatbed spot rate is $2.37 per mile, excluding fuel. A decrease of 10.9% from $2.66 per mile in August 2021.
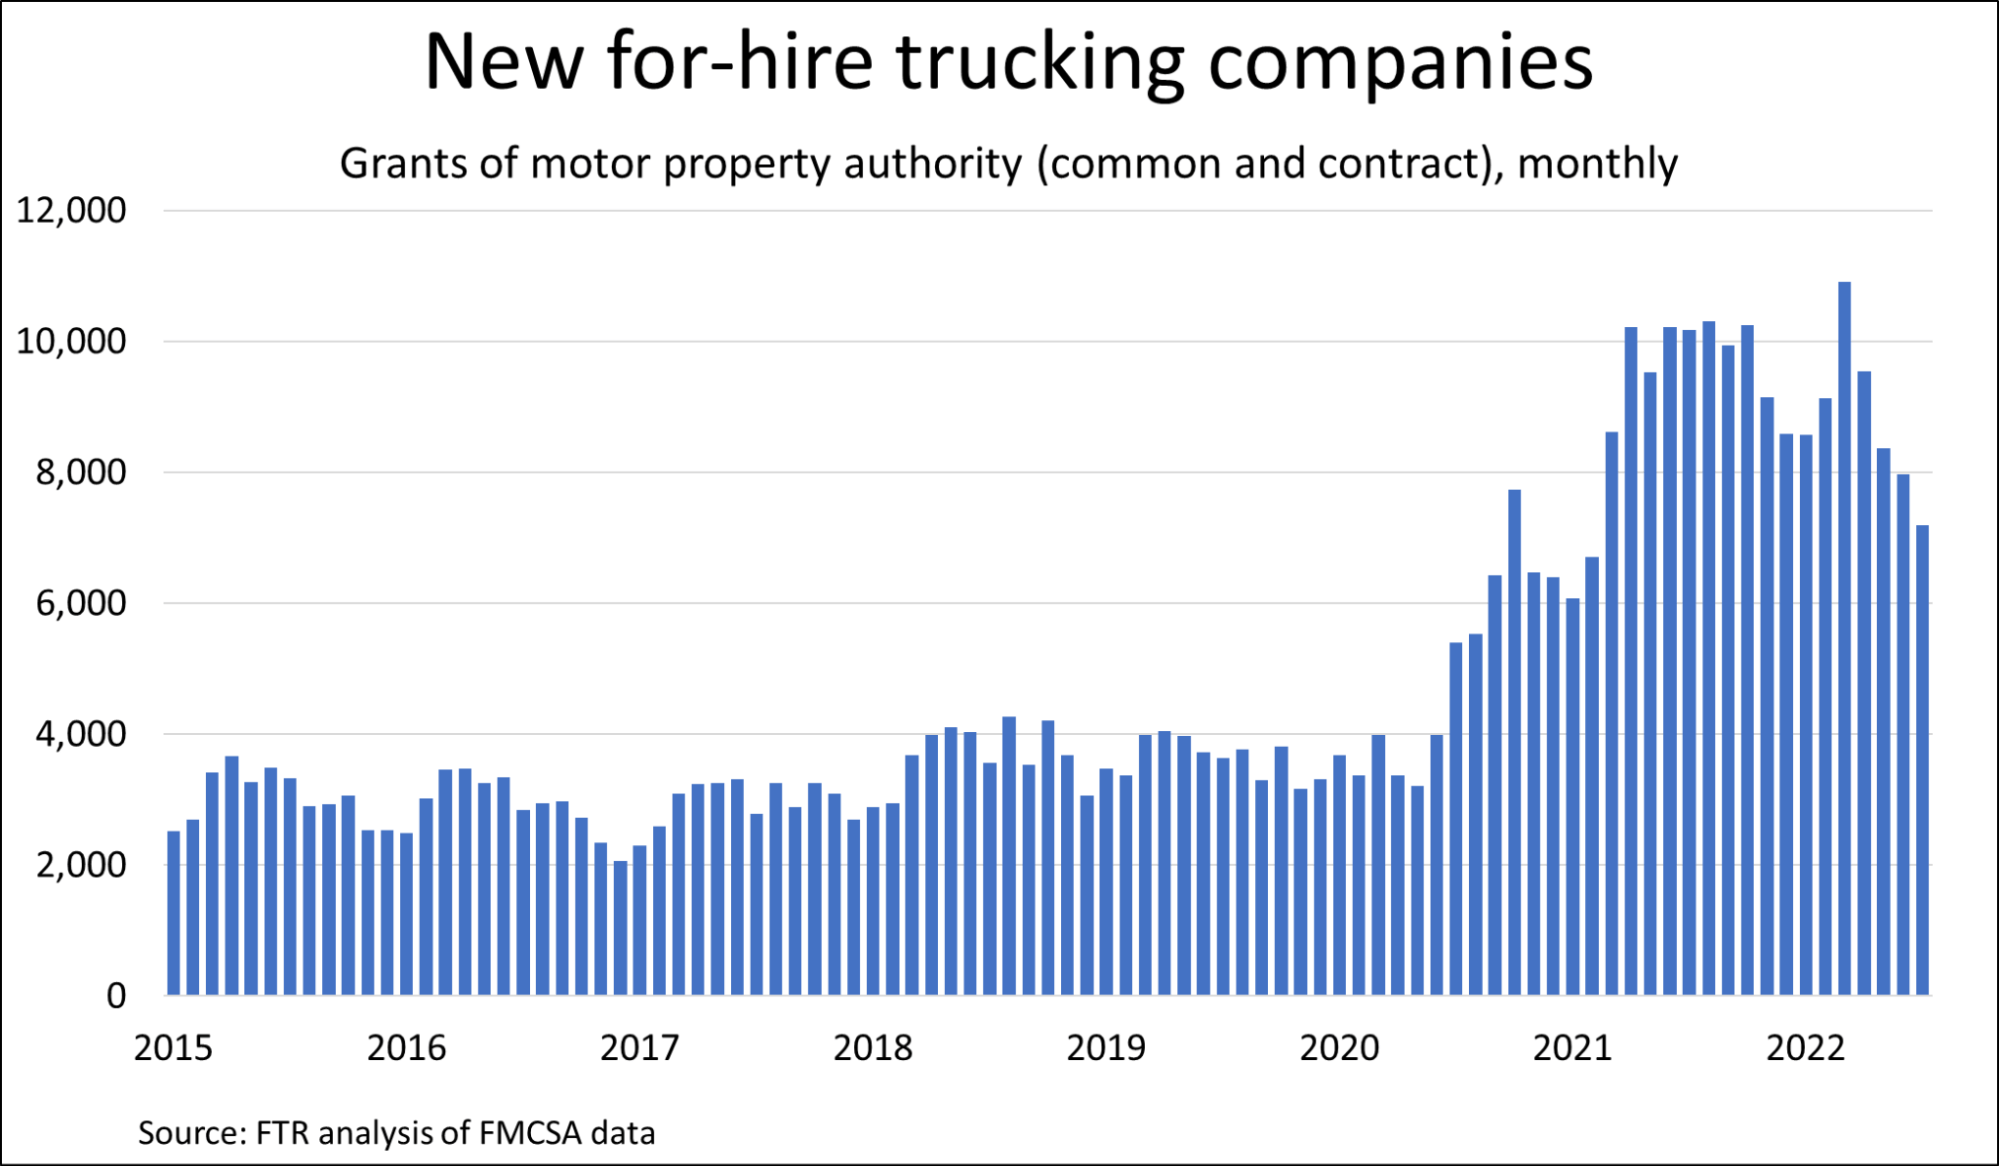
Even with a significant drop in diesel costs over the past month, the price per gallon remains nearly $0.30 above the previous high prior to this year. That increase in operating expense and declining rates in the spot market have created challenging conditions for carriers who lack access to fuel surcharge-protected contract freight. Those with high exposure to the spot market have seen the profitable opportunities they’ve grown used to over the past two years dry up. This is clearly illustrated by the decline in new for-hire trucking companies, which has now trended down for four straight months.
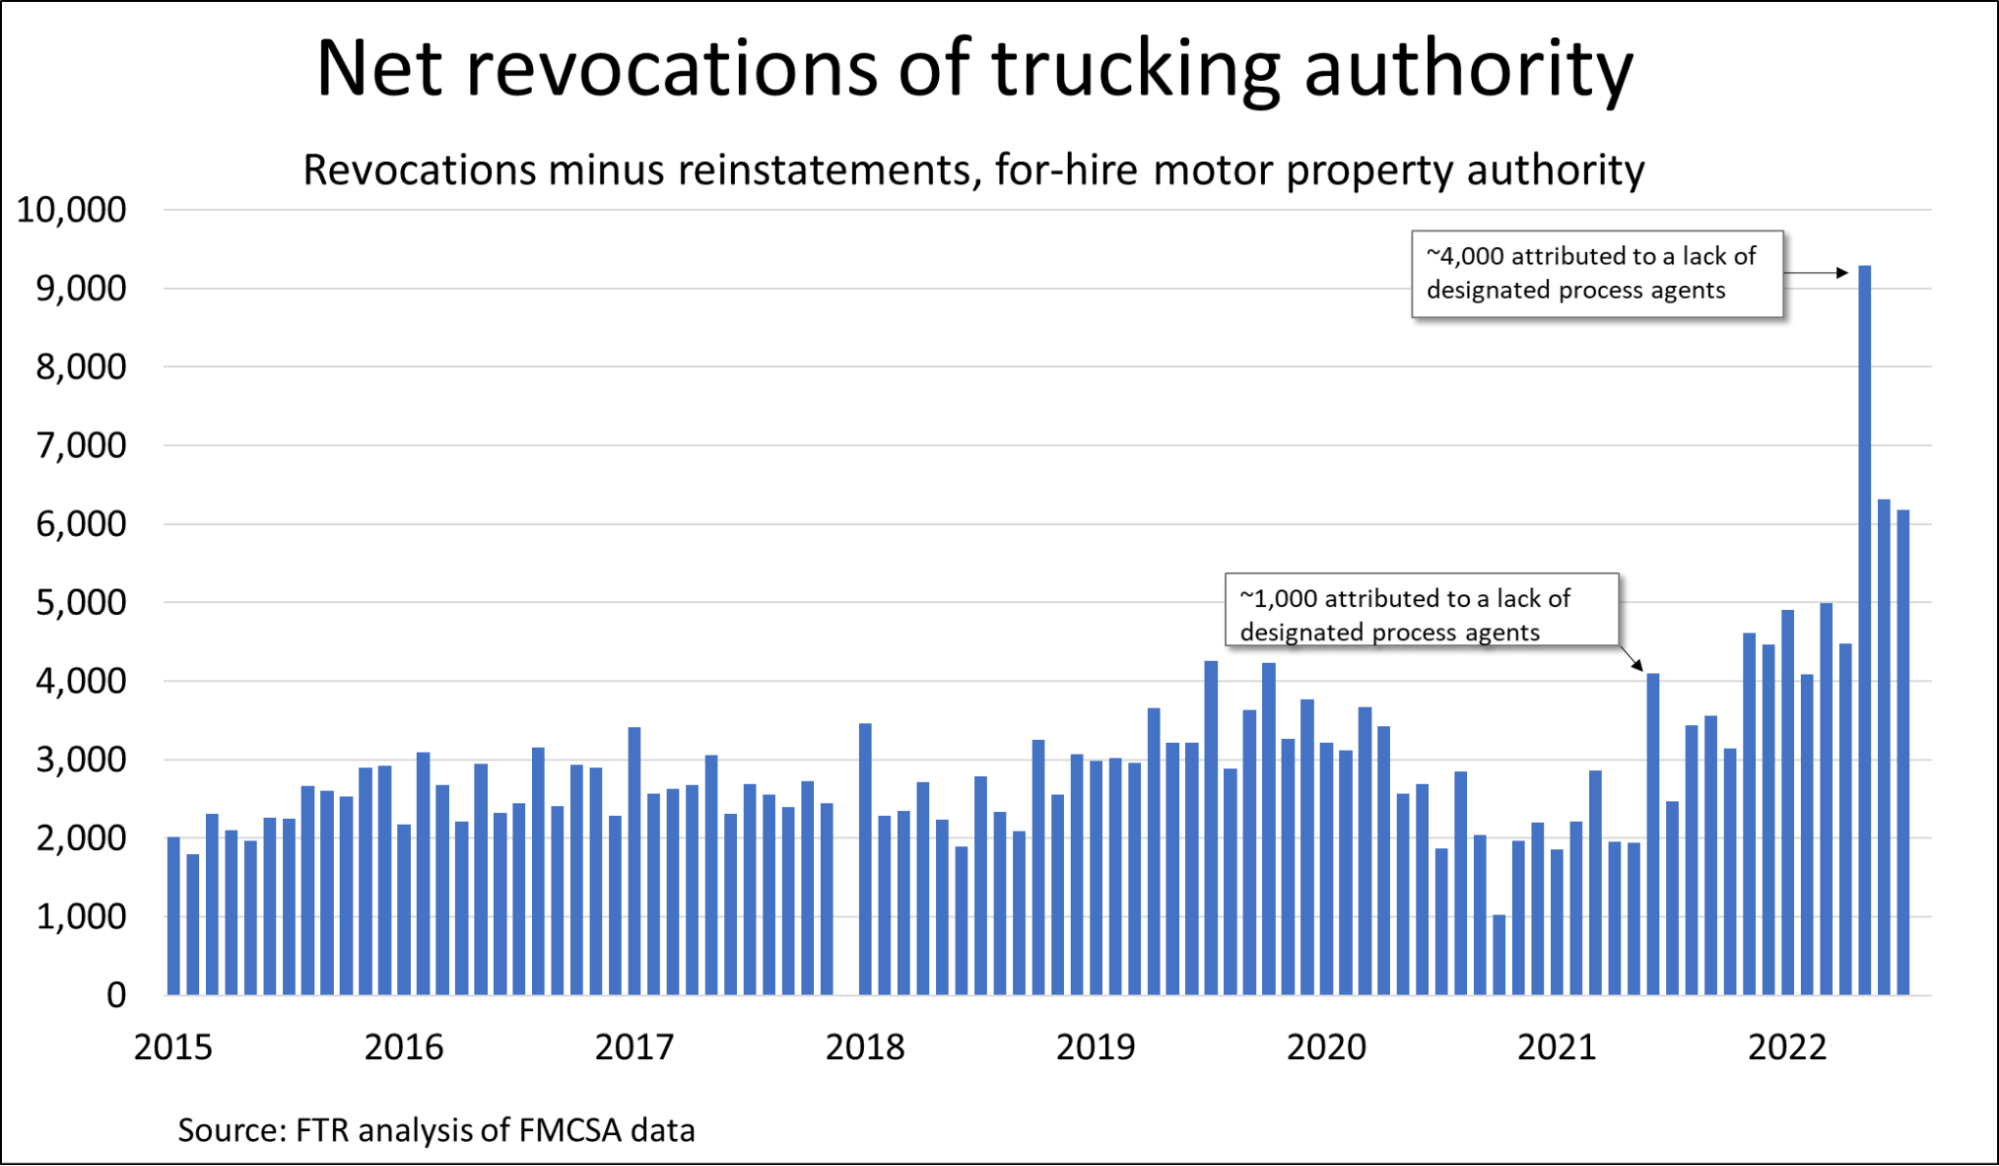
The carriers most impacted by the recent market shift are owner-operators and smaller fleets, many of whom just opened up shop during the past two years. As the spot market opportunities they counted on have disappeared, they have had to rethink their approach or close altogether. Net revocations of trucking authority, as calculated by the FTR, saw a slight pullback in July. Still, it was the third highest number ever, behind only May and June this year.
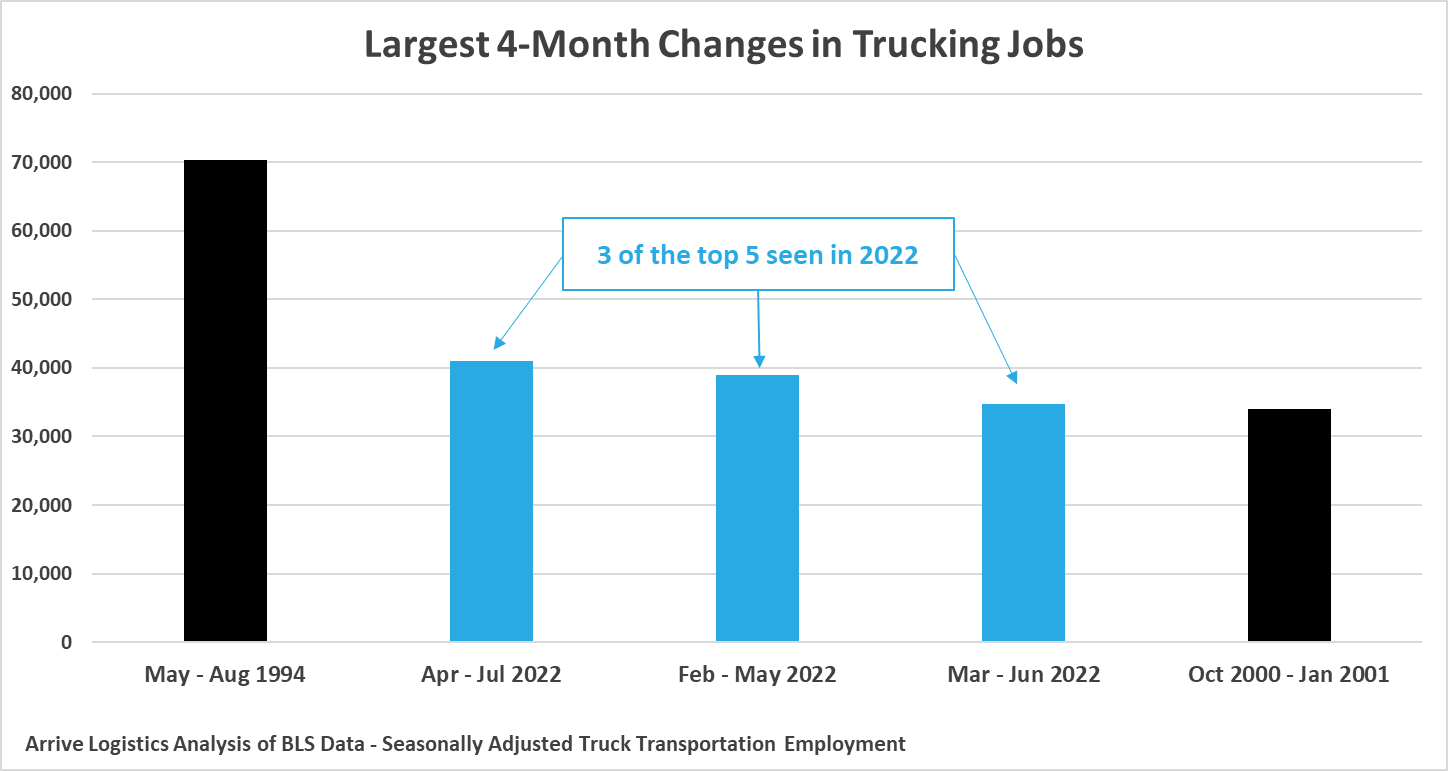
Despite the rise in trucking authority revocations, we have continued to see strong trucking job growth. Last month, we reported on an FTR analysis showing April and May job growth as the second highest total ever in the sector. We repeated that analysis through July and found three of the top five four-month growth periods occurred over the last six months. Not only is this a sign that many small carriers closing up shop are simply moving to company jobs, but it is also evidence that the market is still heavily constrained by supply-side shortages.
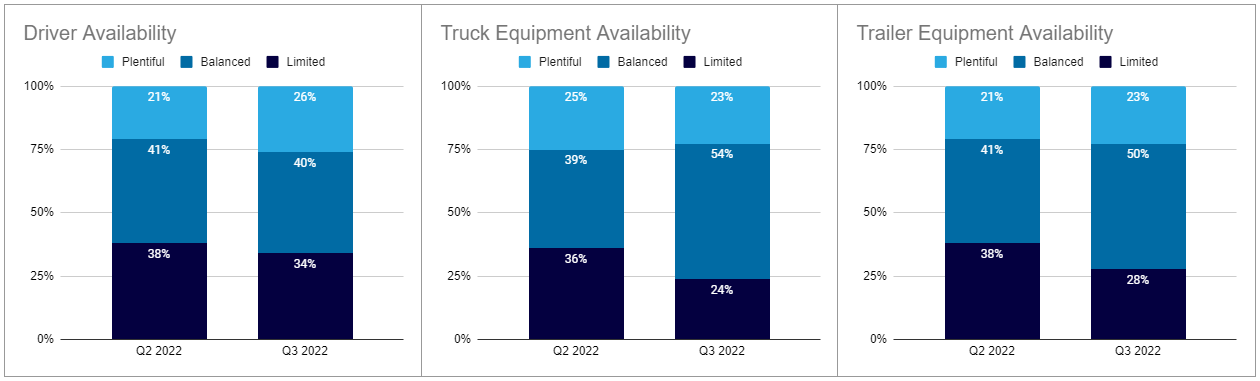
Arrive’s tracked metrics and early third quarter survey of core carriers indicate truck, trailer and driver availability issues are showing slight improvements from responses in our Q2 survey. A similar number of respondents indicated plentiful access to any of the three, indicating challenges remain. On a positive note, fewer respondents pointed to limited access across all three categories, indicating that equipment and driver conditions may be improving.
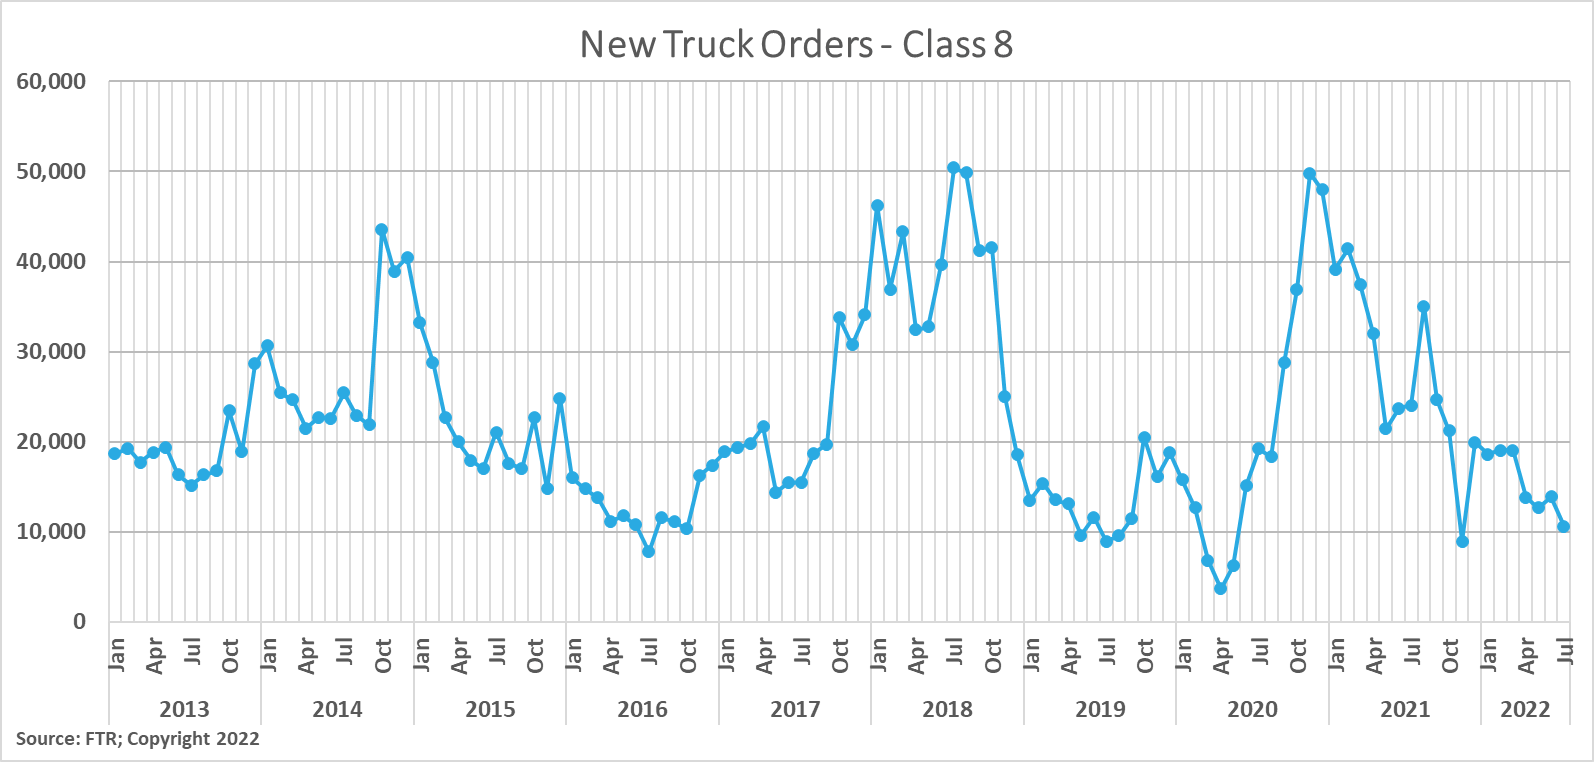
According to FTR, New Class 8 truck orders fell to 10,600 units in July, down 33% from June and 60% year-over-year in July. They added that equipment manufacturers (OEMs) have run out of build slots for the year and are not yet entering orders for 2023 as they work through backlogs. From this perspective, we do not consider new truck orders to be a strong indicator of carrier sentiment about future demand. The pullback in orders allowed the average time from order to delivery to decrease from 10.1 May to 7.8 months in June.
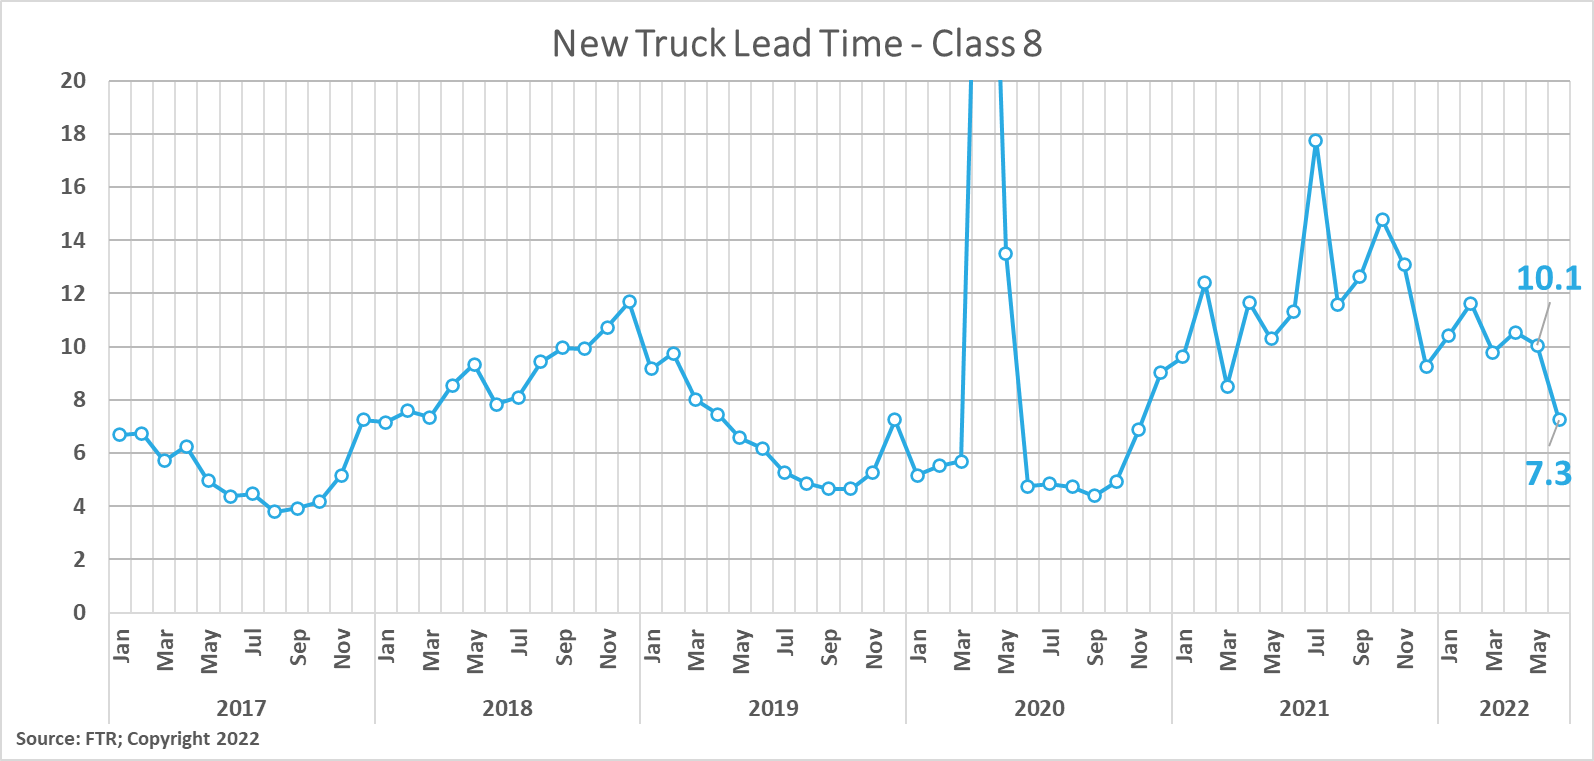
New truck lead time decreased slightly from 10.1 months in May to 7.3 months in June.
New trailer demand, however, is more robust. FTR reports that new trailer orders increased 32% month-over-month in June to 24,600 units. As warehouses fill up, many shippers have looked to trailers for storing excess inventory, fueling the continued demand for new trailer equipment.
Experts agree that freight demand is more likely to ease than increase in the short to mid-term. Several factors are influencing this outlook, but the primary drivers of downside risk continue to be the impact of inflation on consumers and a seemingly imminent recession. At this point, it appears volumes are unlikely to fall off a cliff — instead, they are more likely to decrease gradually.
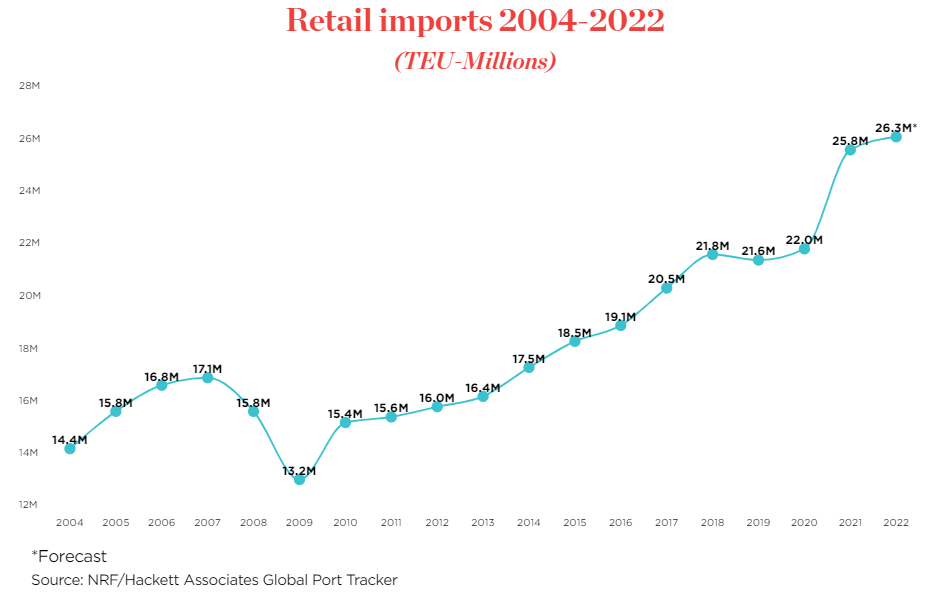
Major demand drivers in the back half of the year typically include fall fashion and peak retail season. Healthy import volumes lead us to believe both events will drive strong volume, meaning that despite the challenges around inflation and the economy, we are still expecting peak season demand surges to cause rate volatility on a regional and seasonal basis. The National Retail Federation reports that imports are up 5.5% over the first half of the year, and the full-year forecast shows imports will finish the year up 2% from 2021 volumes.
FreightWaves reports that a record 153 container ships were waiting offshore at North American ports as of July 19th, 2022. That’s up slightly from 150 in January and 66% from 92 in June. The start of Q3 last year was when port congestion heavily accelerated, and early indications point to the same trend happening this year. The question is: how much worse will it get?
The main reason for the buildup of ships waiting for berths and NA ports is downstream congestion at retail warehouses. With nowhere for excess freight to go, containers have built up at rail terminals inland, leaving ports and rail carriers struggling to clear them and make way for new freight. Assuming conditions will not improve by the start of retail peak season, we expect many of the same themes from a year ago to play out again this holiday season. Shippers should expect challenges at the ports to worsen before getting better. This year, however, we expect the East and Gulf coast ports to lead the way, as imports to those locations are up more than 40% from 2019 and accounted for more than 60% of the total ships waiting offshore.
We continue to note that markets close to ports or major rail yards will see the biggest challenges with capacity and poor equipment utilization due to congestion, forcing shippers to use over-the-road trucking as an alternative.
The outlook for manufacturing and industrial production, which has been a core component of the forecast for freight volumes to remain strong, is weakening. It is important to note that even though we have seen pullbacks in economic indicators related to freight, conditions are still improving relative to pre-pandemic levels. The weakening trend, however, is one of the main reasons we believe pullbacks in freight volumes to be the most likely scenario.
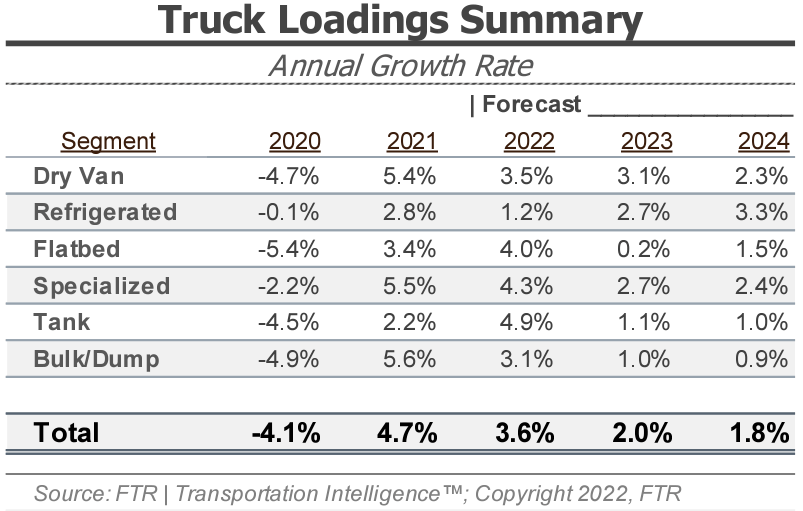
FTR’s latest truck loadings forecast of a 3.6% year-over-year increase in 2022 is unchanged from the prior forecast. The 2023 forecast shows growth but is down from a 2.4% year-over-year increase to 2.0%, based on weaker economic data.
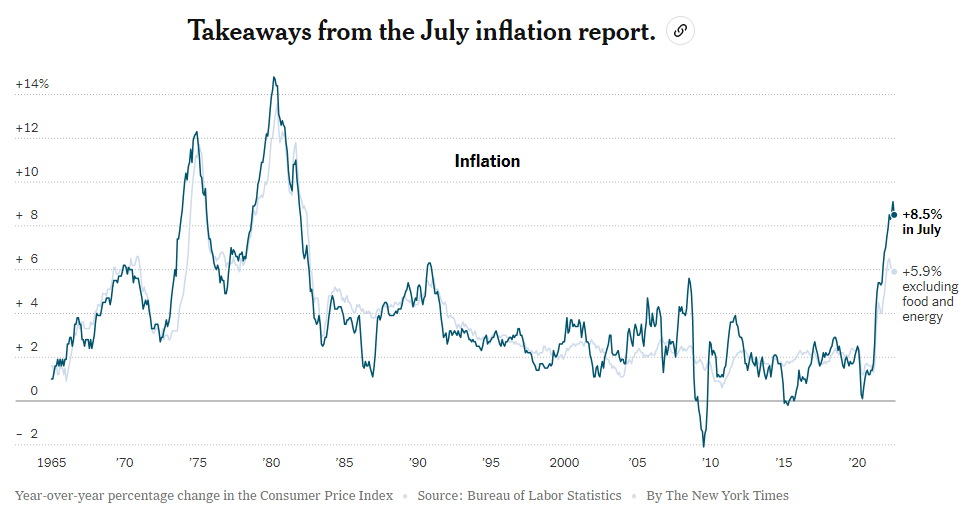
CPI data released in early August shows inflation experienced some relief in July, falling from 9.1% to 8.5% year-over-year growth (5.9% when excluding food and energy). The energy component fell by 4.6% month-over-month, but food inflation remained firm. Food price increases completely offset pullbacks in energy costs, enabling CPI to remain flat month-over-month, excluding food and energy.
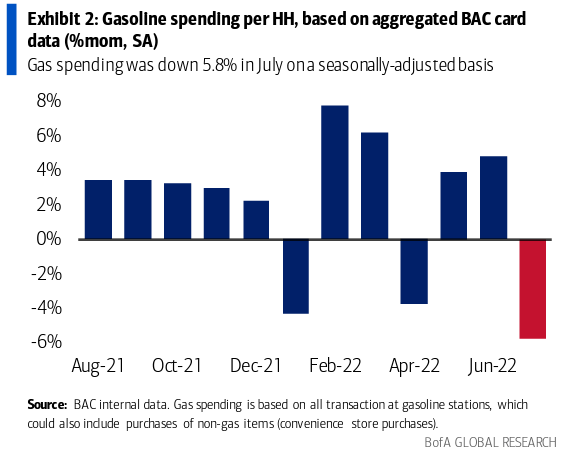
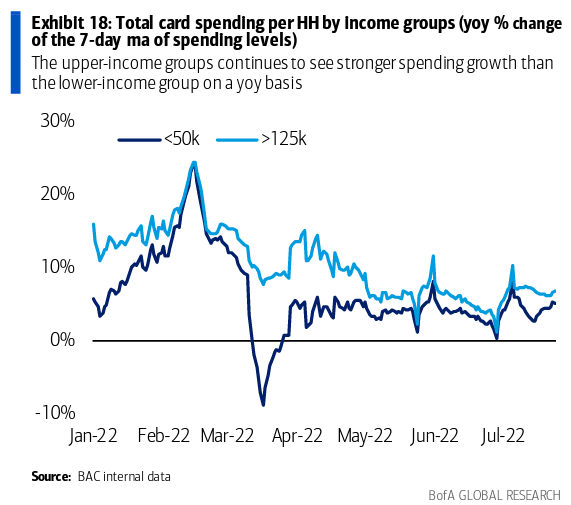
Consumer spending trends improved slightly as gas prices eased, supporting the position that consumer spending power remains strong. Bank of America reported a broad increase in year-over-year spending growth in the latter half of the month, but this was particularly true for lower-income households. This points to the possibility that if gas prices continue to fall, we could see discretionary spending accelerate as we approach the fourth quarter.