

"*" indicates required fields
"*" indicates required fields
"*" indicates required fields

December 2020
The Arrive Monthly Market Update, created by Arrive Insights, is a report that analyzes data from multiple sources including but not limited to FreightWaves SONAR, DAT, FTR Transportation Intelligence, Morgan Stanley Research, Bank of America Internal Data, Journal of Commerce, Stephens Research, National Retail Federation and FRED Economic Data from the past month as well as year-over-year.
We know that market data is vital to making real-time business decisions, and at Arrive Logistics, we are committed to giving you the data you need to better manage your freight.
Our research indicates there will be further disruptions to the transportation markets brought on by elevated volumes. E-commerce returns are going to play a significant role and capacity will be constrained through mid January. Much like 2020, there are significant unknowns that have the potential to majorly influence demand dynamics in 2021. Our forecasts show spot rates returning back down to flat year-over-year by late Q3 and down at least 10% by end of year. Contract rate correction will have a longer time horizon. We expect an annual average increase of 8%-10% year-over-year in 2021. Below are a few high-level takeaways from the report:
Tender Volumes are representative of nationwide contract volumes and act as an indicator of Truckload Demand
Tender Rejectionsindicate the rate at which carriers reject loads they are contractually required to take and acts as an indicator of the balance between Truckload Supply and Demand
New Truck Orders is an indicator of the trucking industry’s health and carrier sentiment, as carriers typically invest in new trucks when demand and optimism are high.
Industrial Production measures the output of the industrial sector, including mining, manufacturing and utilities.
US Customs Maritime Import Shipments, China to the United States measures the total number of import shipments being cleared for entry to the U.S. from China.
Rate Spread measures the difference between the national average contract rate per mile and the national average spot rate per mile and is closely inversely correlated to movements in tender rejections and spot market volumes.
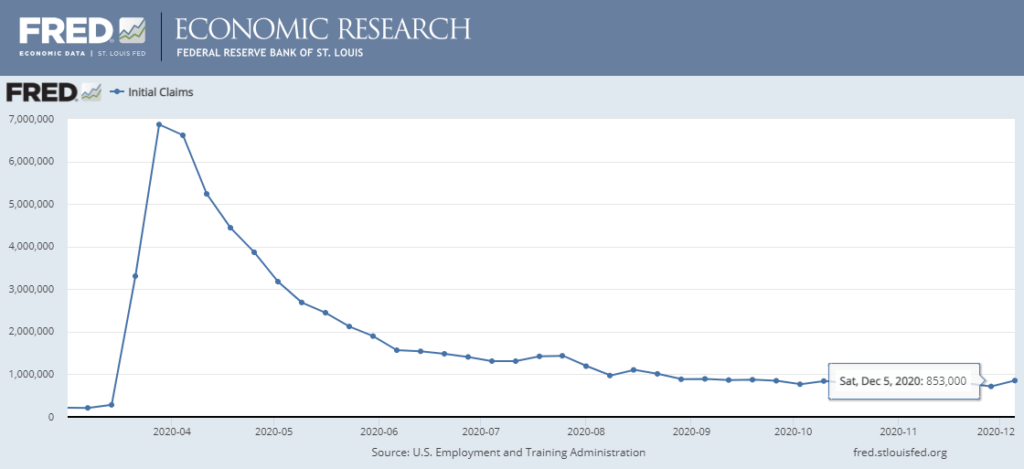
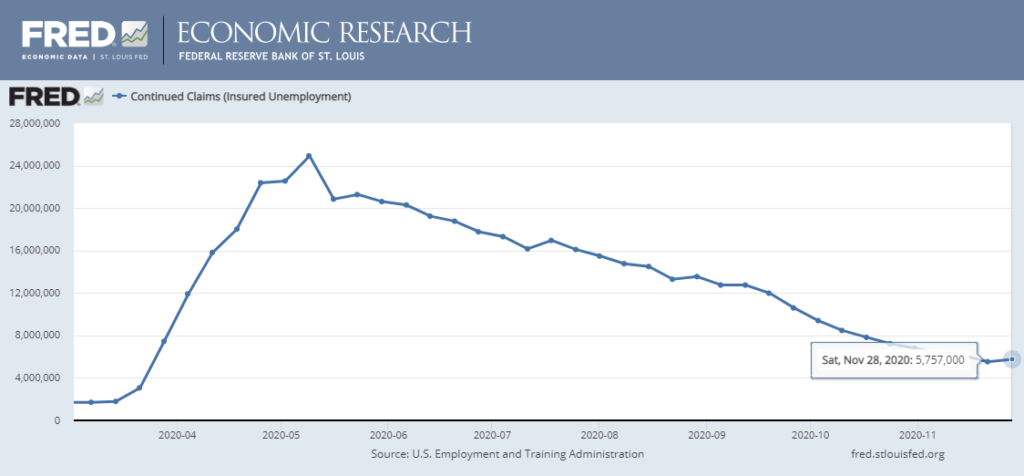
Weekly Jobless Claims are used as a barometer for the pace of layoffs in the general economy.
Unemployment Rate is the number of people who are unemployed that are actively seeking work.
"*" indicates required fields
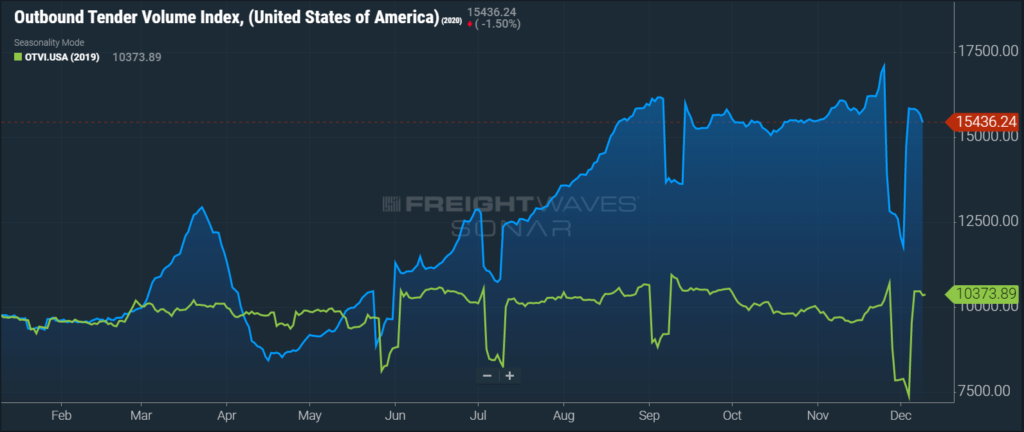
Truckload demand rose sharply in November, most noticeably in the week leading up to Thanksgiving. Following the holiday, conditions eased fairly quickly. This trend is one that is expected on an annual basis and indicates that we are seeing normal seasonal patterns more clearly in the fourth quarter than we did in the third quarter when demand was skyrocketing. The biggest difference seen this year was the continued demand growth throughout the month. Volumes typically ease in early November before the month end spike, but retailer strategies to elongate the holiday shopping season and ease the burden on an already tight capacity network were successful. Retail spending fell off sharply in the week following Thanksgiving, causing a rapid decline in truckload demand in the early stages of December.
FreightWaves SONAR Outbound Tender Volume Index (OTVI), which measures contract freight volumes across all modes, was up roughly 60% year-over-year as demand peaked before Thanksgiving, but has fallen to 50% year-over-year growth through the first week in December . It is important to note that OTVI includes both accepted and rejected load tenders, so we must discount the index by the corresponding Outbound Tender Rejection Index (OTRI) to uncover the true measure of accepted tender volumes. If we were to apply this method to the year-over-year OTVI values in early December, the increase in volume drops to roughly 28.8%. The Dry Van and Reefer Tender Volume Indices are up more than 53% and 44% year-over-year, which equated to 31.9% and 17.4% increases in actual volumes for the two modes, respectively.
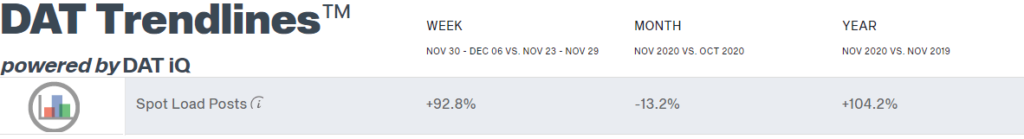
DAT reported that dry van load posts took a slight step back in November, falling 13.2% month-over-month and 104% year-over-year. This is the second straight month of dry van load posts dropping from an all-time high in September.
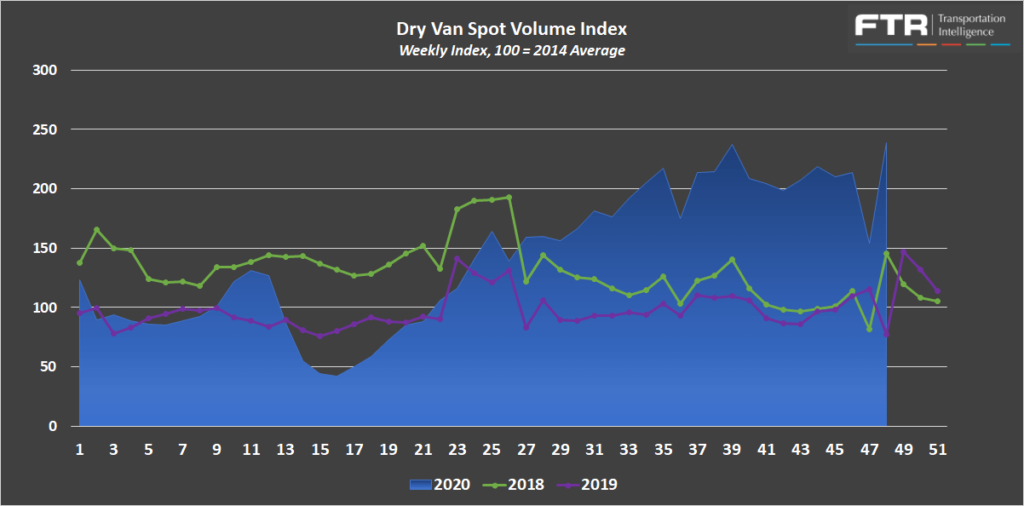
In the week following Thanksgiving, FTR and Truckstop’s Total All Mode Spot Volume Index was up by about 3% from the final week in October; up 70% year-over-year; and up 61% since 2018. These demand trends were driven by a 15% month-over-month increase and 63% year-over-year increase for the Dry Van Spot Volume Index. The Reefer Spot Volume Index increased by roughly 30% in November and nearly 50% year-over-year.
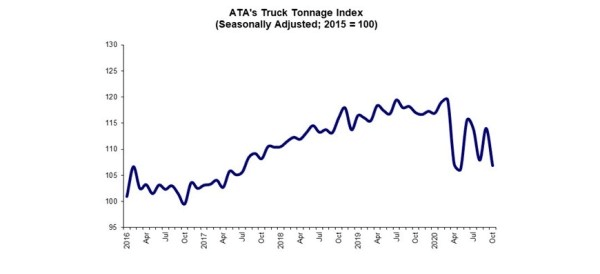
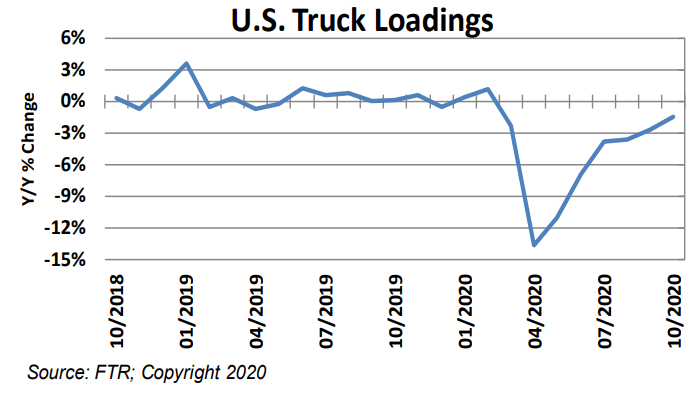
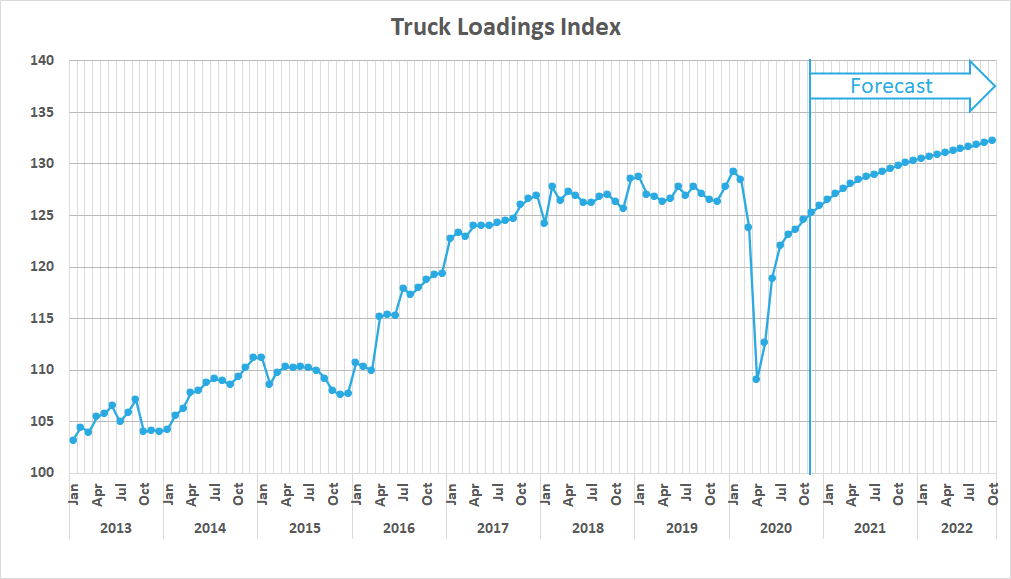
The remaining indices, ATA’s Truck Tonnage Index and FTR’s Truck Loadings Index, continue to indicate that the total trucking market is down on a year-over-year basis.
The Seasonally Adjusted ATA Truck Tonnage Index decreased 6.3% month-over-month in October and was the seventh straight year-over-year decline, falling to -8.7% year-over-year.
FTR’s Truck Loadings Index was down by just 1.5% year-over-year in October after rising by 0.8% month-over-month. In 2019, the Truck Loadings Index fell by 0.5% month-over-month in the same time period.
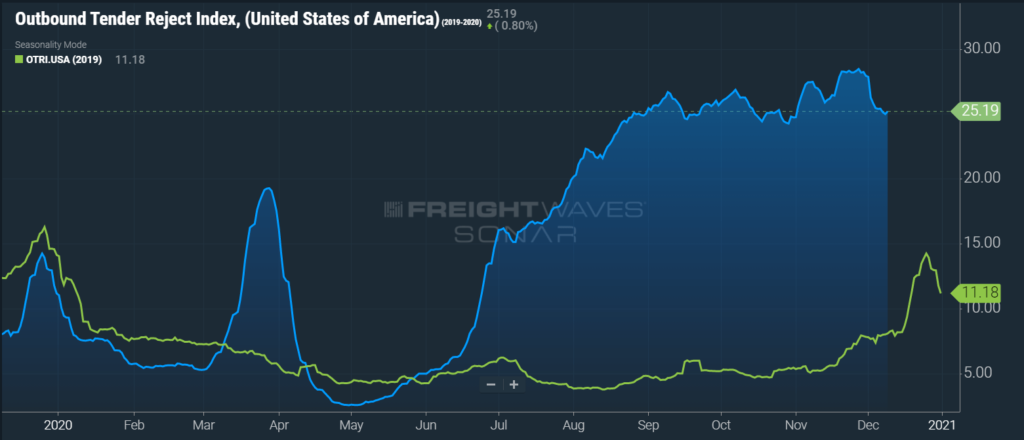
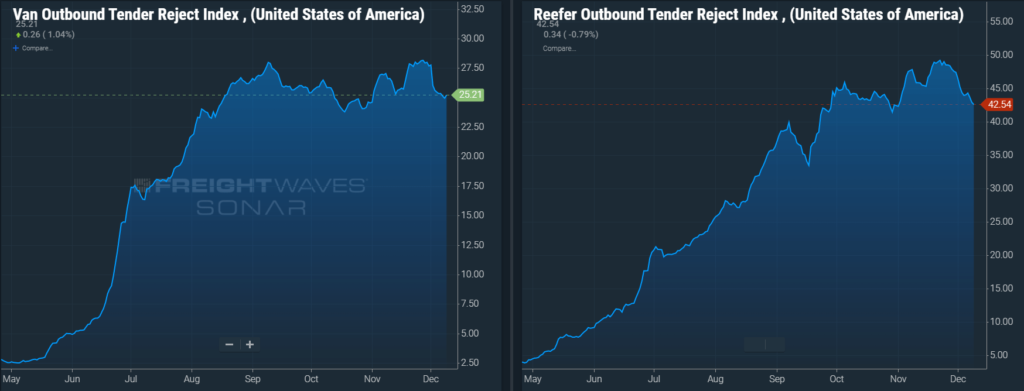
Sonar Outbound Tender Reject Index (OTRI) measures the rate at which carriers are rejecting the freight that they are contractually required to take. Tender rejections peaked at a record high of 28.46% in November before falling quickly and settling in near 25% in early December. The record high in November, which came in the days leading up to Thanksgiving, represented an increase of more than 250% year-over-year. The Dry Van Tender Reject Index peaked in November at 28.2%, also a new record high. Dry van tender rejections have moderated since but still remain elevated above 25%. The Reefer Tender Rejection Index of 49.2% in late November was also a new record high. Reefer tender rejections have fallen off into early December, but still remain at an astounding 42.5%.
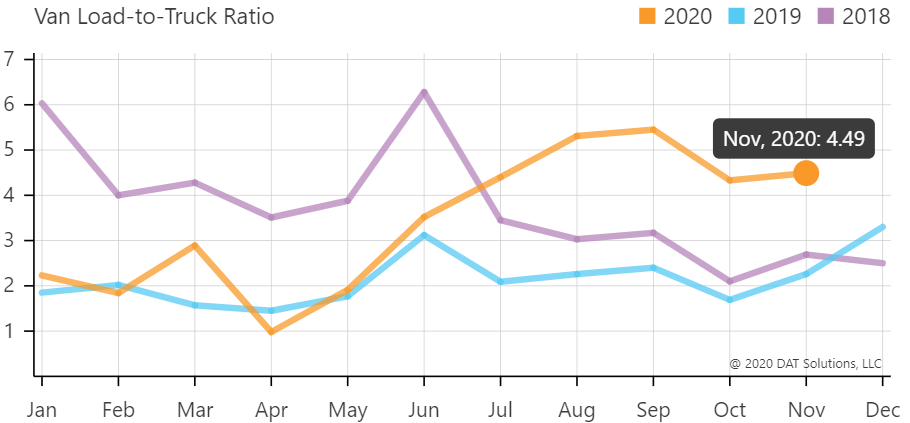
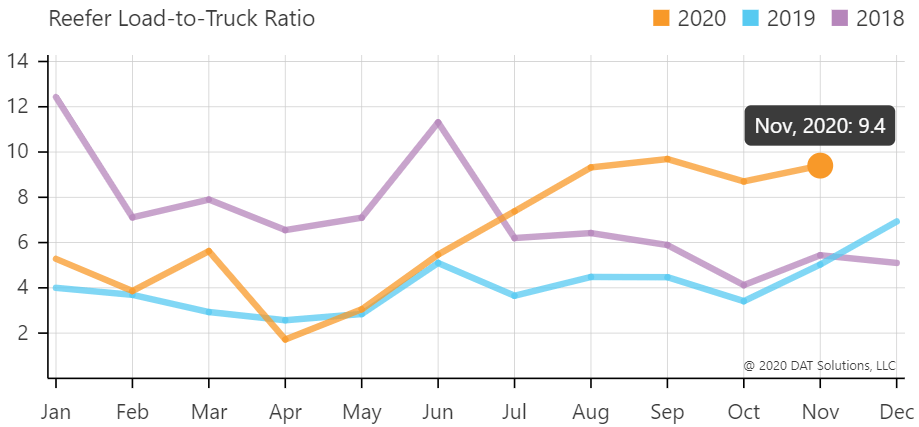
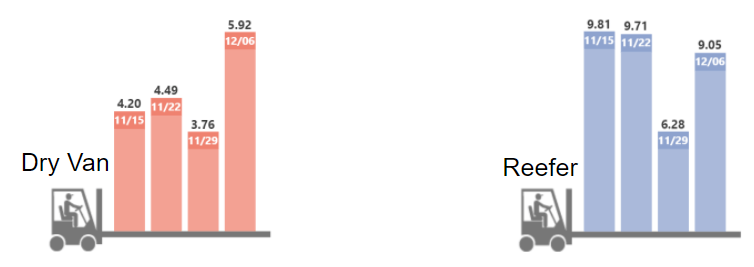
The DAT Load to Truck Ratio measures the total number of loads posted compared to the total number of trucks posted on their load board. In November, the Dry Van Load to Truck Ratio increased slightly to 4.49, an increase of 3.7% month-over-month and 99% year-over-year. The Reefer Load to Truck Ratio rose to 9.4 in November, an increase of 8.0% month-over-month, and 87% year-over-year. The ratios increasing in November are in line with expectation for this time of year.
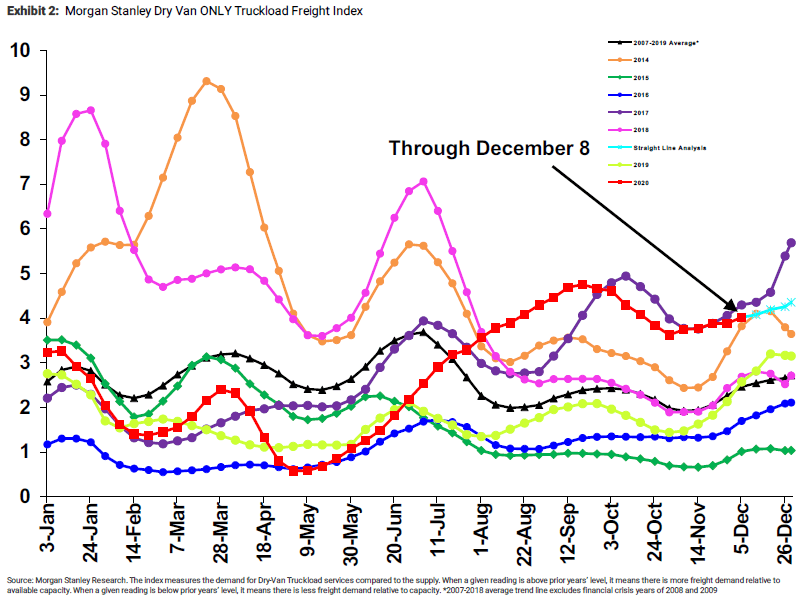
The Morgan Stanley Dry Van Freight Index is another measure of relative supply. The higher the index, the tighter the market conditions. The index is indicating that the conditions we have seen since early October are continuing to remain closely aligned to the conditions seen in 2017, and we should expect to see the rest of the year play out in a somewhat similar fashion, tightening from here on out.
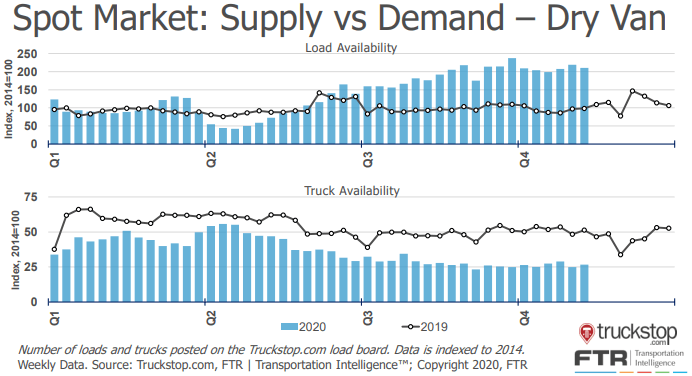
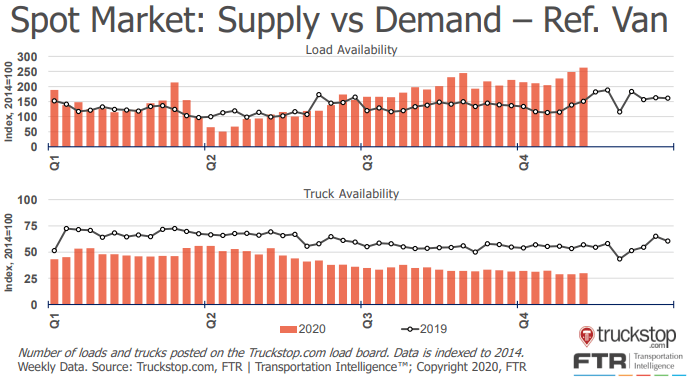
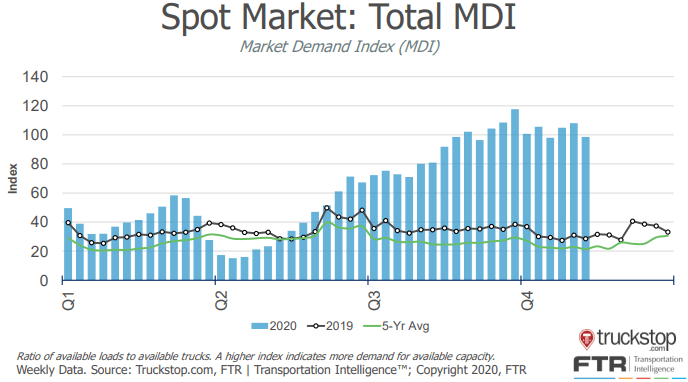
The Truckstop/FTR Market Demand Index measures the ratio of available loads to available trucks. In the first two sets of charts below, load and truck availability are plotted separately for both dry van and reefer freight. In both cases, load availability was up, and truck availability was down year-over-year. This is indicative of tighter market conditions as demand has remained elevated while supply has continued to decrease. The result of these trends is a flat but elevated Market Demand Index which has been trending at or near record highs since early in the third quarter.
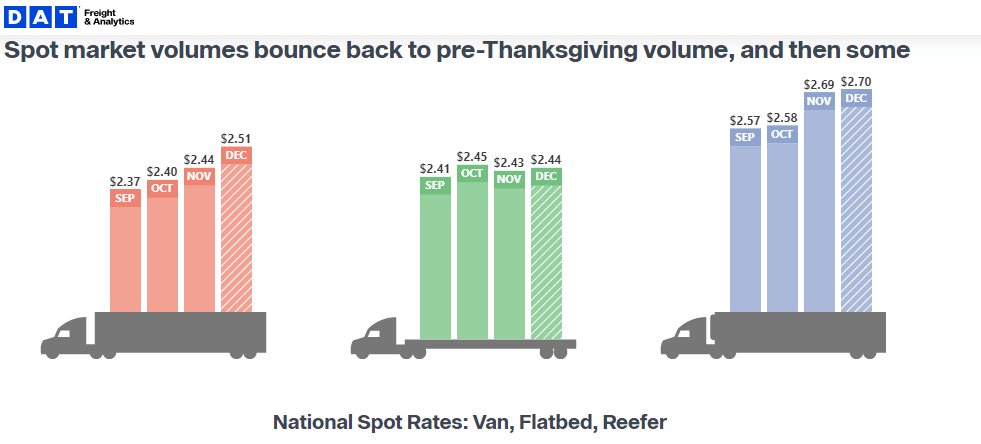
Van and Reefer spot rates continued their climb in November as tender rejections hit an all-time high. Flatbed rates fell slightly from a high in October. The DAT is reporting that dry van spot rates have now increased by 57% from $1.59 per mile in May to $2.51 in the first week in December.
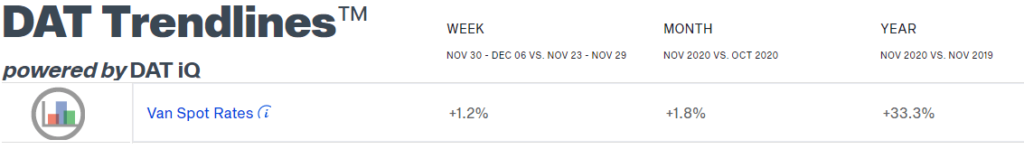
The dry van linehaul rate per mile of $2.44 for the month of November was an increase of 33.3% year-over-year and was the fourth straight month where rates hit a new record high. This is indicative of the strength of the carriers’ negotiating power as we move into December. Contract rates have increased by 19.3% from $1.97 to $2.35 over the same time period.
The Contract-Spot Van Rate Spread experienced a $0.56 swing during an eight month span, from $0.40 in April to -$0.16, an all-time low, month-to-date in December.
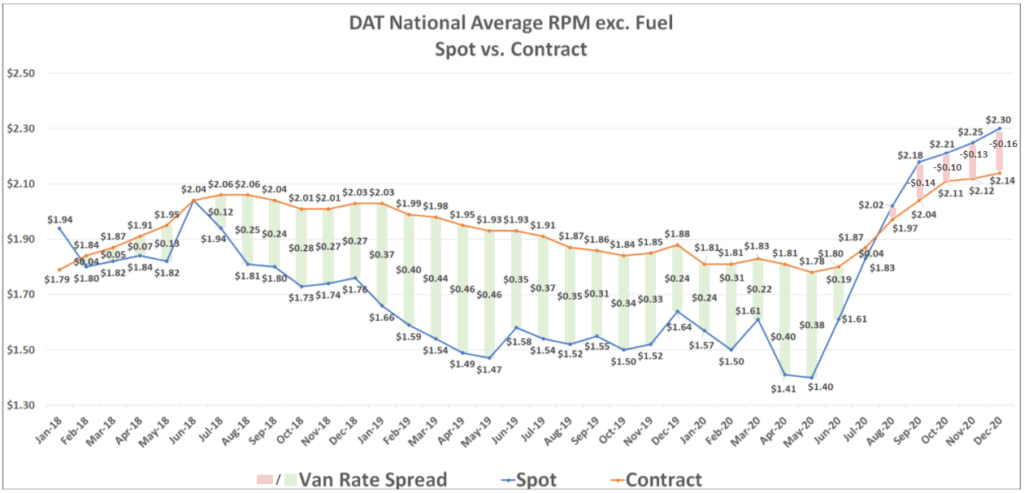
The record gap between spot and contract rates indicates that we are still in the middle of an inflationary cycle in the market. Although there has been a slight decline in demand and in tender rejections in early December, rates have not followed suit. This trend is likely to continue through at least the end of the year as capacity is expected to remain tight through Christmas. The rate spread has continued to increase month-over-month, putting an incredible amount of upward pressure on contract rates. This has resulted in seven straight months of contract rate increases. If trends follow a similar pattern to what was seen in 2018, contract rates are likely to settle well above pre-pandemic levels.
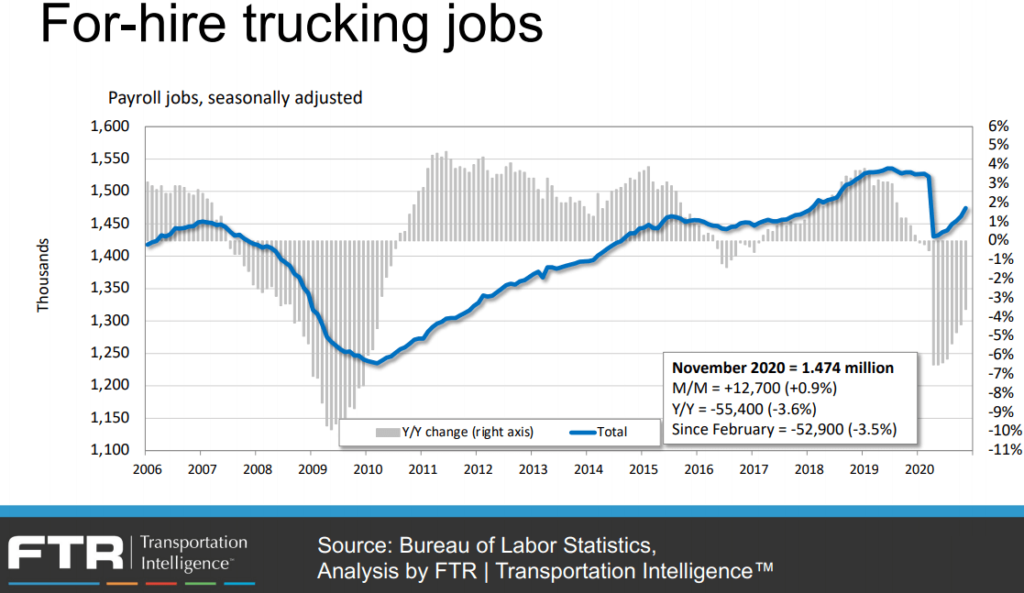
Constrained capacity is one of the prominent reasons for the tight market conditions since the onset of the pandemic and will be an ongoing issue affecting the transportation markets for the foreseeable future. The Bureau of Labor Statistics reported that although total driver employment increased by 0.9% month-over-month, it was down by 3.6% year-over-year in November. Several factors are leading to the shortage in drivers. An aging workforce more susceptible to the virus; increased unemployment benefits; the closing of or limited throughput of driver schools; the drug and alcohol clearinghouse regulations; and the continued migration of drivers from over-the-road trucking jobs to local delivery jobs have all led to significant declines in driver availability and active truck utilization.
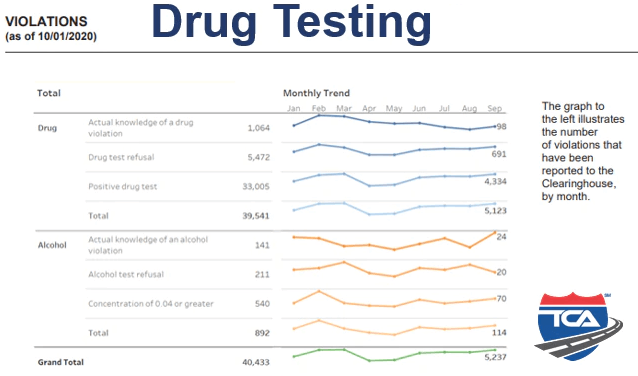
With the recent spike in virus cases, we expect that limited driving school throughput will continue to slow the entry of new drivers into the market. Additionally, we expect to see the drug and alcohol clearinghouse regulations continue to lead to the removal of an estimated 5,000 drivers per month.
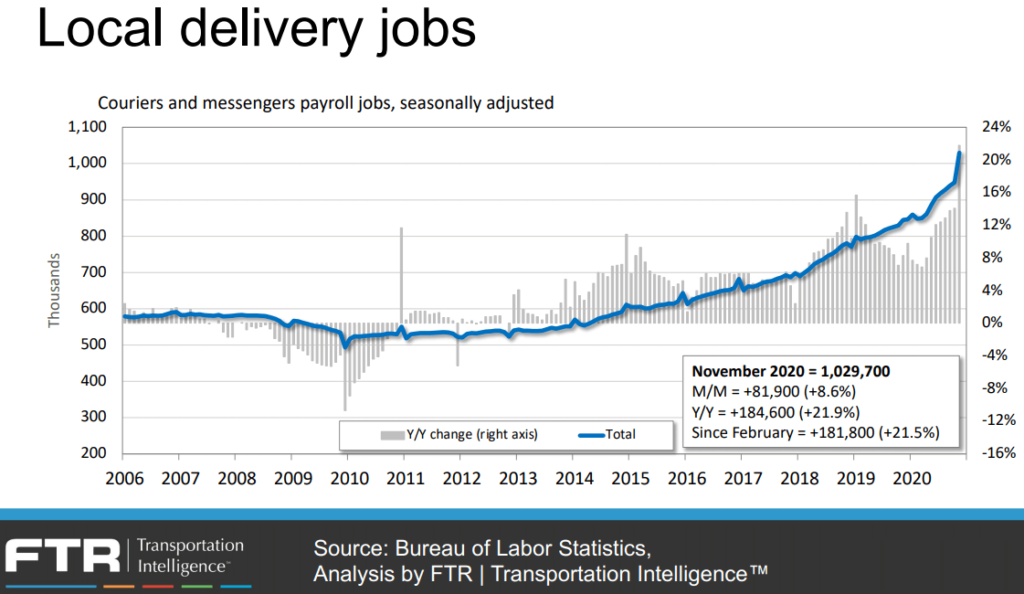
With the rise in e-commerce sales, local delivery jobs have grown by more than 180,000 since February, an increase of nearly 22%. We believe that this increase in local delivery jobs is also a major contributor to the slow recovery in long haul driver employment.
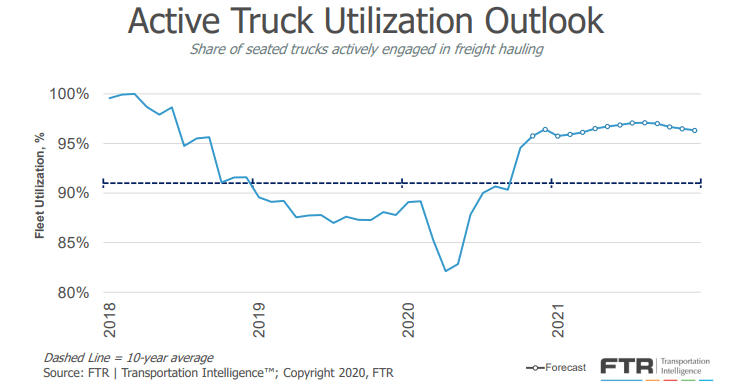
Active truck utilization, the share of seated trucks actively engaged in freight hauling, is now forecast to remain near 96% for the foreseeable future as limited driver availability prevents carriers from filling empty seats and allowing utilization to approach 100%.
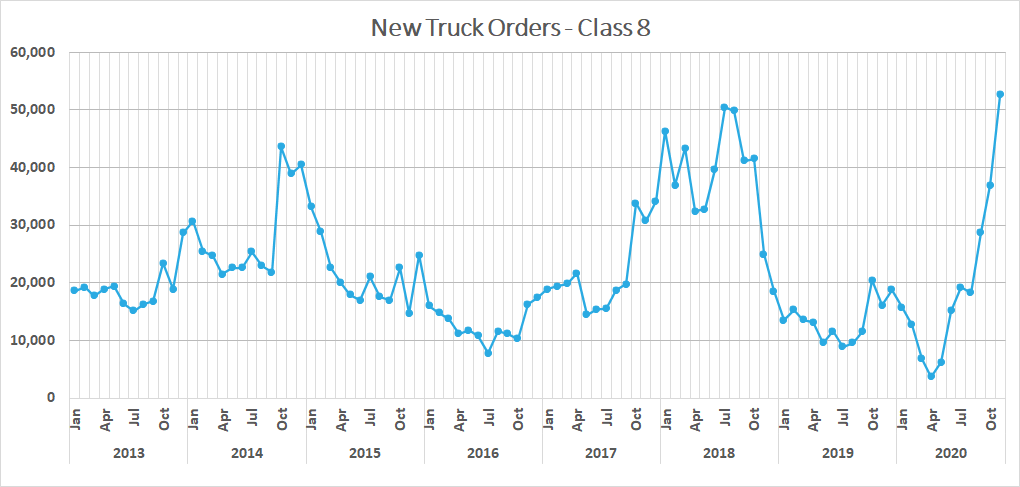
FTR is reporting that new truck orders increased significantly to more than 52,000 units in November. This is the highest single month total on record and well above the 20,000 units required to sustain current levels of capacity. It is a sign that carriers are investing in their fleets. In 2017/2018, thirteen straight months of new truck orders greater than 20,000 units were required to correct the capacity shortage. It is worth noting that at the time, active truck utilization was near 100%. We know the imbalance that exists today is more of a result of a driver shortage, so investments in new assets will not be as impactful unless drivers return to the market as well.
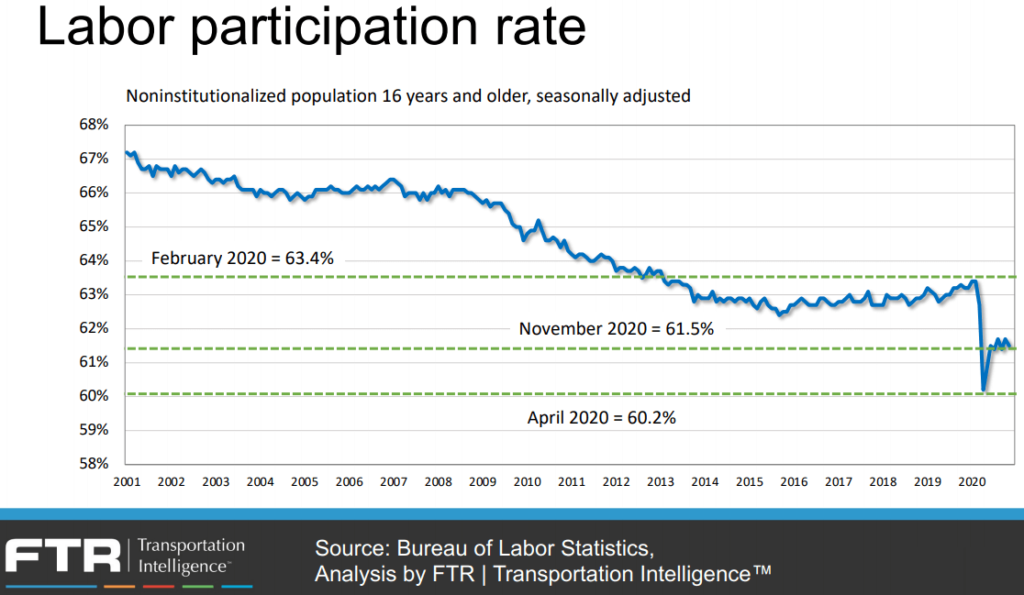
Industrial production is an important metric to watch due to its relationship to domestic shipment volumes. Industrial production data is now up to date through the end of October and shows a slight uptick of 1.1% month-over-month. The slow recovery can be partially attributed to a decline in the labor participation rate. Industrial production is a labor intensive industry and with many American’s choosing not to re-enter the workforce due to concerns over contracting the virus or due to receiving unemployment benefits, there has been a slowdown in the recovery of industrial production to pre-pandemic levels.
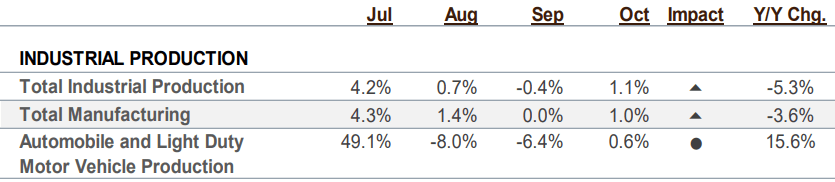
FTR’s Truck Loadings Index, which has a heavy concentration of industrial freight volumes, has declined by -3.9% year-over-year, on par with the -5.3% decline in industrial production forecasted for the full year 2020. Looking forward, FTR has only slightly increased their estimates for 2021. They are forecasting a 5.3% year-over-year increase in 2021, up from 5.2% last month. More specifically, they expect freight volumes to experience year-over-year inflationary levels by March and back to pre-pandemic levels by the end of next year.
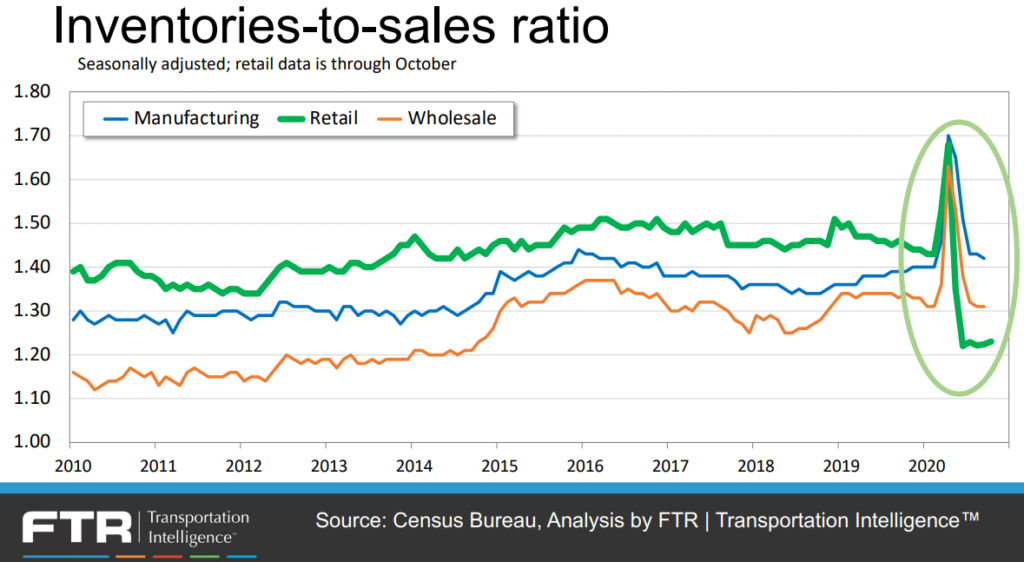
Increased consumer spending on retail goods has resulted in retail inventory to sales ratios falling to an all-time low. Inventory restocking, particularly in the retail sector, should continue to provide a boost to truckload demand well into 2021.
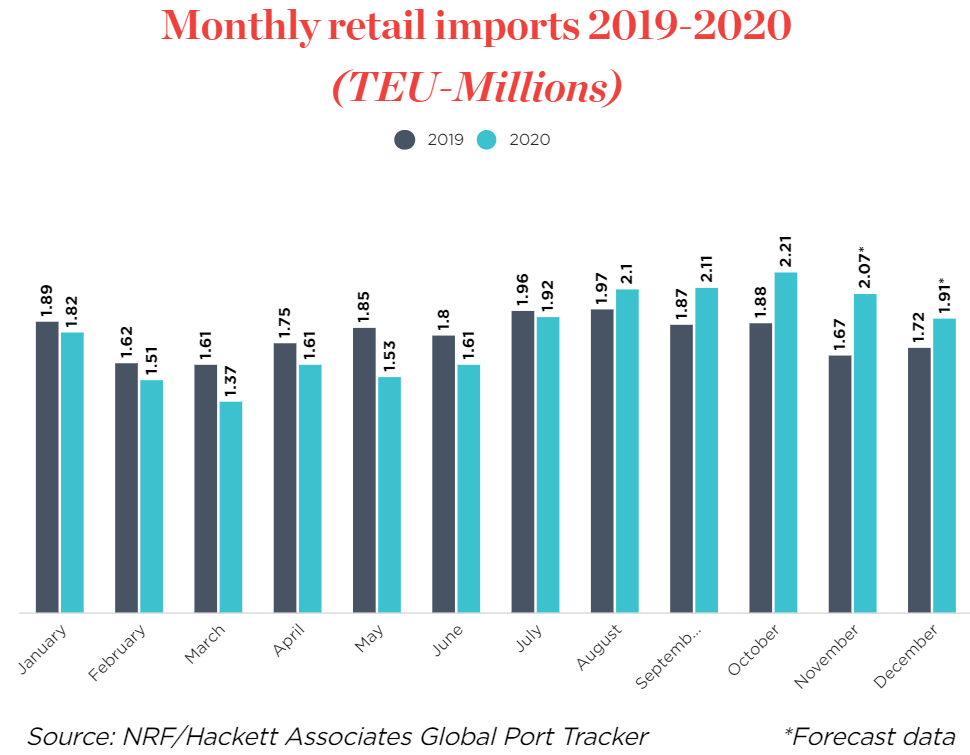
Retail import shipments set a new record for the second straight month in October, coming in at 2.21 Million TEU’s. Above average import shipments are expected to continue through at least the Chinese New Year in February to support restocking depleted inventories.
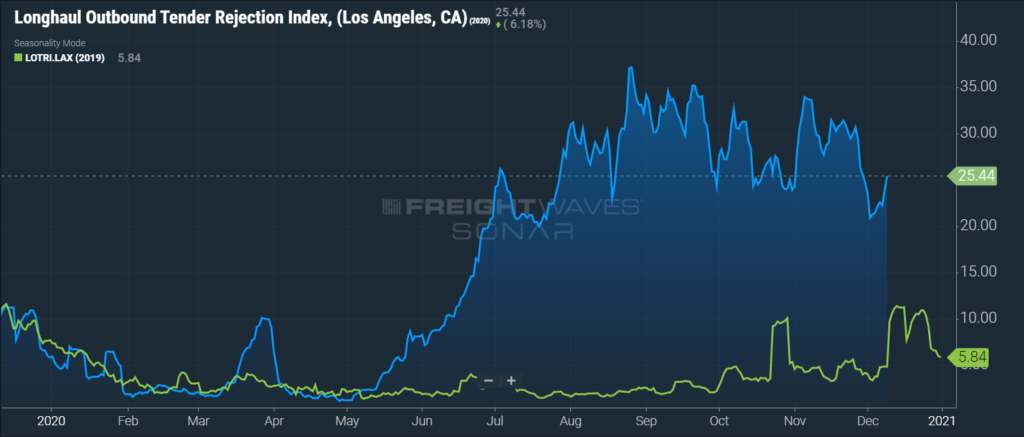
The sharp increase in tender rejections on longhaul freight outbound from Southern California in early December is in line with the sharp increase we experienced in 2019. Although rejections have come down from the highs before Thanksgiving, newly depleted inventories across the country need to be replenished. We expect Southern California to be even tighter and more expensive as we approach the peak retail shipping season later in the month.
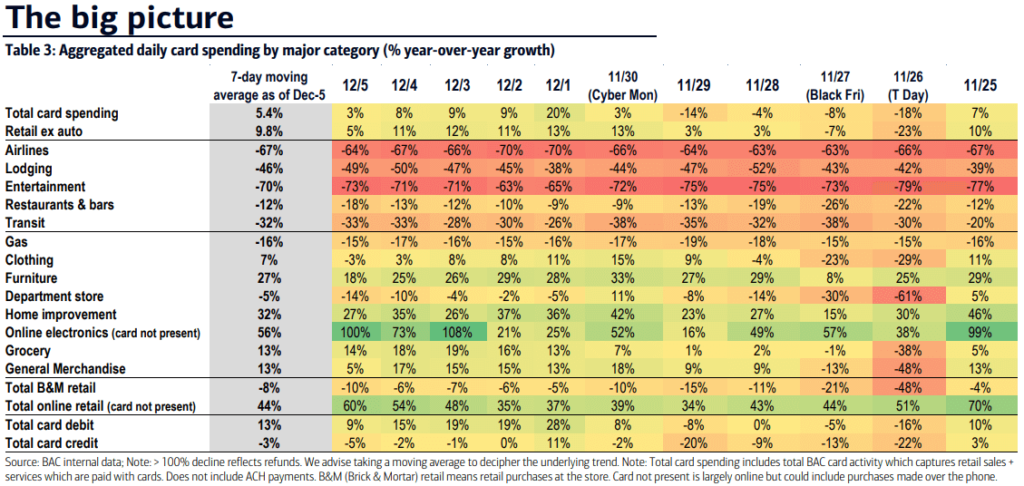
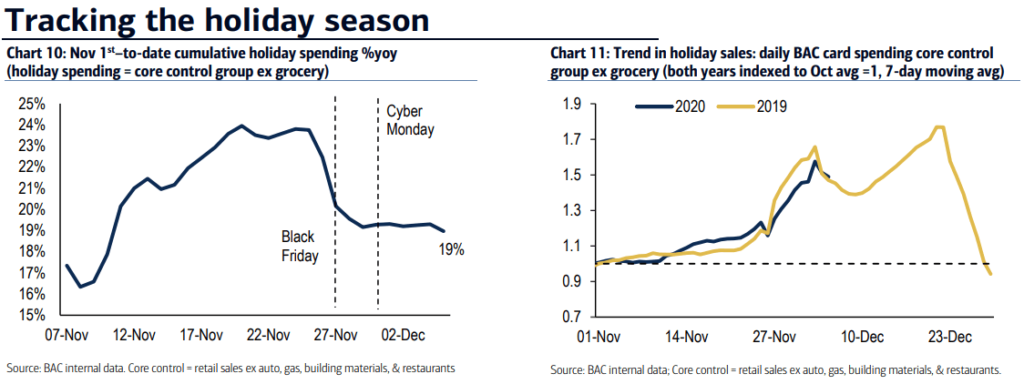
Second, the shift to e-commerce and online shopping transformed the holiday shopping season in 2020. Leading up to Thanksgiving, online retail spending was trending near 70% increases year-over-year, but following the holiday, that number has fallen to just 44%. This year, many retailers were closed on Thanksgiving night and Black Friday and instead, offered online Black Friday deals for days in advance of the annual shopping holiday.
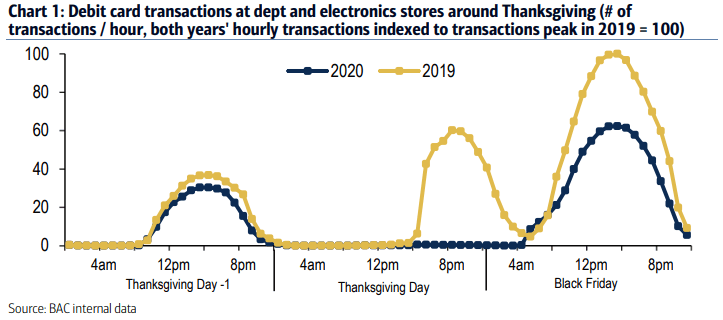
Although cumulative holiday spending remains up more than 19% year-over-year, spending on the Black Friday and Cyber Monday decreased. The data proves that retailers were successful with their strategy to elongate the holiday shopping season and drive more sales online, and further supports the need for more local delivery jobs to support fulfillment of the goods purchased.
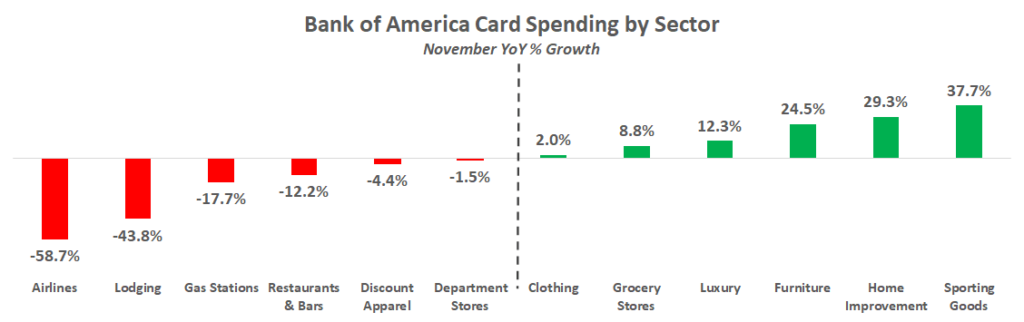
Lastly, spending on durable goods continues to trend at elevated levels while spending on entertainment, travel and lodging and other related services or activities remains low. People are traveling less and spending more on freight heavy things like furniture, electronics and home improvement, which helps explain the growth we have seen in spot freight volumes.
The unemployment trends continue to be concerning. Initial claims and continued claims are no longer improving week-over-week. Both metrics have begun to level off in November. Initial claims continue to trend above 850,000, and continued claims are still greater than 5.7 million on a weekly basis.
Carrier pricing power was on full display in March as contract rates climbed at an unprecedented rate throughout the month. The winter storms in mid February exposed just how insufficient supply is to support truckload demand, and carriers have responded by demanding a premium on their committed capacity.
Unfortunately for shippers, there does not appear to be much relief in sight. Our research indicates that there will continue to be greater upside risk to demand as we move into the second quarter. Spring produce season is just getting underway, the backlog at the port of Los Angeles and Long Beach should support healthy demand outbound from port cities on the East, Gulf and West Coast ports through at least the third quarter, and the third round of government stimulus is generating increased economic activity and consumer spending that will result in an additional boost to truckload demand.
On the supply side, there is no indication that carriers will be able to add capacity quickly enough to support the surge in demand in the near term. Both driver availability and delays in new truck delivery timelines remain the biggest challenges to carriers’ ability to do so. Driver availability should improve as the vaccine rollout enables driver schools to increase throughput, but the delays in new truck production will limit the rate that capacity is added.
As a result, our forecast for the remainder of the year remains consistent. Rates will likely remain at or near all-time highs through at least the second quarter, with the possibility of easing market conditions in the back half of the year as drivers and new equipment begin to enter the market.
"*" indicates required fields

Matt Pyatt is the Chief Executive Officer of Arrive Logistics. He co-founded Arrive with President Eric Dunigan in 2014 after building his career at Command Transportation. As CEO, he is responsible for overseeing the company’s financial health, strategic vision and culture, as well as building a scalable leadership team to support Arrive’s growth.
"*" indicates required fields
"*" indicates required fields
Please have the following info ready to complete registration
Fraud Prevention
Freight fraud continues to impact our industry. We encourage shippers and carriers to reach out to Arrive immediately if there is ever a shipment in question that may be subject to fraud (including fictitious actors and websites). Arrive will not ask you to pay upfront for any dedicated lane or committed capacity program. If the offer you are receiving sounds too good to be true or unrealistic, it may be fraud. Arrive Logistics recommends verifying all communications come from our registered email domain is @arrivelogistics.com and notes that access via VPN or Proxy is prohibited on Arrive systems. Our 24/7 phone number is 888-861-0650 and our leadership team can also be reached at feedback@arrivelogistics.
Use of Cookies
We use cookies to enhance your browsing experience, serve personalized ads or content, and analyze site traffic. By continuing to use this website, you acknowledge and consent to our use of cookies as detailed in our privacy policy.
If you’re not an Arrive customer, please join our network to access the portal.
"*" indicates required fields

Scott Sandager is the Chief Administrative Officer at Arrive Logistics. He joined Arrive in 2018, bringing over 14 years of logistics and brokerage experience, with expertise in project and change management, organizational design, talent development and customer satisfaction. Scott previously held many diverse roles of increasing responsibility with AFN, a Chicago-based freight brokerage.

Eric Dunigan is the President of Arrive Logistics. He began his career at Command Transportation before co-founding Arrive with Matt Pyatt in 2014. As president, he is responsible for driving revenue and growth, as well as leading the Strategic Partnerships team — a veteran group of supply chain experts who work with Arrive’s customers to reimagine their shipping strategy.
"*" indicates required fields

David Spencer is the Vice President of Market Intelligence at Arrive Logistics. David joined Arrive in 2017 after spending six years at AFN focused on business intelligence. His department provides critical market data and expert analysis to internal teams and publishes monthly market updates for shippers and carriers under the Arrive Insights banner.

Andrew Clarke is Board Chairman for Global Critical and DCLI, Inc., and a board member for Arrive Logistics and Element Fleet Management Corp. His 20 years of global transportation and logistics experience include time as CFO of C.H. Robinson, CEO of Panther Expedited Services, Inc. and SVP and CFO roles at Forward Air Corporation.

Dean Croke is a Market Analyst at DAT Solutions, where he focuses on freight market intelligence and data analytics. His 35 years of experience with data analytics, transportation, supply chain management, mining and insurance risk management include time as co-founder of FleetRisk Advisors and in a number of other high-level roles with FreightWaves, Spireon, Lancer Insurance, Omnitracs Analytics (formerly Qualcomm) and more.

Asanka Jayasuriya is the CTO at 8VC. He is an accomplished engineering and product leader with 20+ years of experience in the cloud. He has a strong background in enterprise SaaS, PLG products, infrastructure, and security. Notably, he served as CTO and SVP of Engineering at SailPoint, leading their successful transition to the cloud and successful exit event. He also held senior leadership roles at InVision, Atlassian, and Amazon, driving growth, operational excellence, and innovation. At 8VC, Asanka works with the entrepreneurs and leaders in our portfolio as a virtual CTO supporting their growth.

Chad Eichelberger is the President of Reliance Partners. Since 2015, he’s leveraged his extensive experience in risk management, compliance, best practices and contracts to lead the company’s logistics and truck insurance strategy and operations. Chad was previously the President of Access America Transport, where he led the company from $8M to over $600M in revenue.

Barry Conlon is the CEO and founder of Overhaul, the global leader in active supply chain risk management and intelligence. With a remarkable career spanning over 30 years in supply chain security, he is widely regarded as a trailblazer in modern-day supply chain security standards and best practices.

As VP and Senior Analyst at ACT Research, Tim analyzes commercial vehicle demand and alternative powertrain development (i.e. electrification), and authors the ACT Freight Forecast, U.S. Rate and Volume Outlook. He previously spent fifteen years in equity research focused primarily on the transportation, machinery, and automotive industries, and co-founded leading equity research firm Wolfe Research.
"*" indicates required fields
