
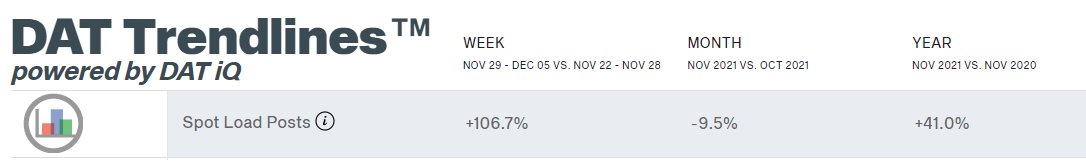
Incredible demand in the spot market continued to be the main story throughout November. Not only is overall tonnage up significantly, but so is the percentage of freight that is moving via the spot market. DAT noted that in normal times, spot volumes account for roughly 14% of the total freight on the road. Currently, that number is running at about 25%, with average spot volumes double what they were in a pre-pandemic year. Record import levels to support backfilling inventories as consumer spending saw its normal seasonal surge was the main driver behind this trend, and early December data indicates that we should expect very little to change through the remainder of the year.
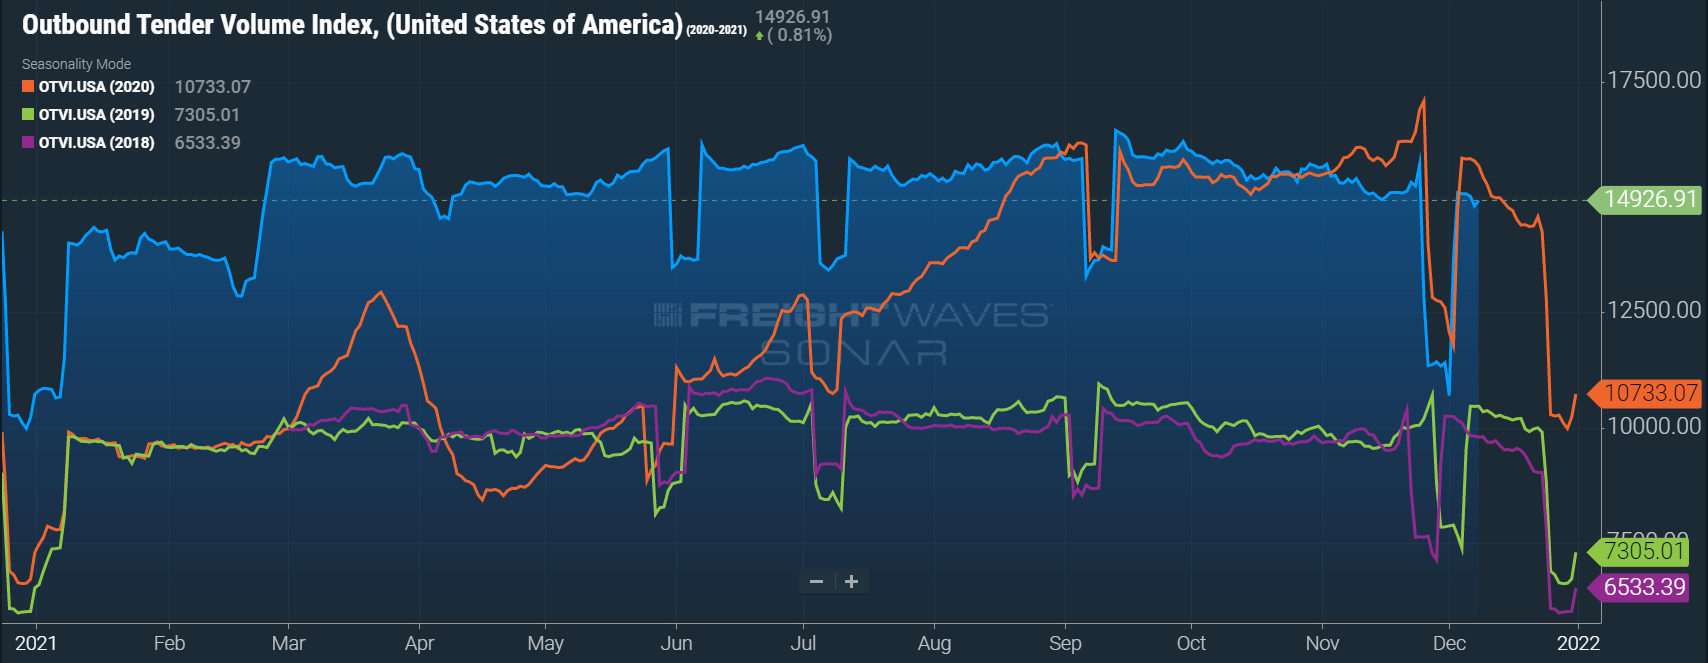
FreightWaves SONAR Outbound Tender Volume Index (OTVI), which measures contract freight volumes across all modes, was down 5% year-over-year at the start of December. It is important to note that OTVI includes both accepted and rejected load tenders, so we must discount the index by the corresponding Outbound Tender Rejection Index (OTRI) to uncover the true measure of accepted tender volumes. If we apply this method to the year-over-year OTVI values, the growth in volume increases to 3%. Tender rejections are now lower than a year ago by nearly 25%, contributing to the OTRI adjusted measure’s higher growth in actual freight volumes.
When drilling down to specific equipment types, the dry van tender volume index was down 6%, and the reefer tender volume index was down 9%, year-over-year. This equated to a 3% increase and a 4% increase in actual volumes for the two modes, respectively. Tender rejections were lower for both equipment types year-over-year, resulting in improved growth rates when considering actual volumes.
DAT data indicates that year-over-year spot volumes were up by 41% in November, up from 35% in October and 31.5% in September. Month-over-month spot posts were down 9.5% in November, but a portion of that is a result of the holiday and fewer business days in the month. The 106% week-over-week increase the week after Thanksgiving helps illustrate the impact of the holiday on volumes.
FTR and Truckstop’s Total All-Mode Spot Volume Index finished November up 1% from the last week in October. The all-mode index remains up 21% year-over-year. This metric has trended down gradually from 112% year-over-year at the end of June to 28% at the end of October. The month-over-month decline is indicative of the more difficult year-over-year comparisons we have seen as the year has progressed and is consistent with what we have seen in the monthly year-over-year DAT spot volume trends.
Capacity constraints around Thanksgiving are expected on an annual basis. Although these normal seasonal trends held true, the tightness around the holiday was muted in comparison to what we have seen in other years. We believe shippers were cognizant of the constraints typically seen around the holiday and did what they could to stretch out the demand over a longer period of time. That being said, conditions are still very tight, and it was not easy or cheap for shippers to move their freight, particularly in the week following Thanksgiving. Carriers continue to point to truck and trailer shortage challenges and driver availability issues, all contributing to their inability to keep up with demand.
Sonar Outbound Tender Reject Index (OTRI) measures the rate at which carriers are rejecting the freight they are contractually required to take. The index is currently at 19.35%, down from 20.04% at the end of October, but up slightly from the 19.06% low seen in the first week of December. 19.06% is the lowest tender rejection rate we have seen since July 2020. Despite all the talk of supply chain issues, the data signifies conditions are improving when it comes to contract tender acceptance. We did see rejection peak at 20.5% in the week leading up to Thanksgiving but believe that elevated contract rates, which have been on the rise over the past year, are contributing significantly to these improved tender acceptance rates. Elevated demand and continued capacity challenges are the only reason we still see rejection rates hovering around 20%. Had the driver and equipment shortages been less of a factor over the past six months, it is likely we would have seen rejection rates fall more closely in line with the declines seen in the back half of 2018.
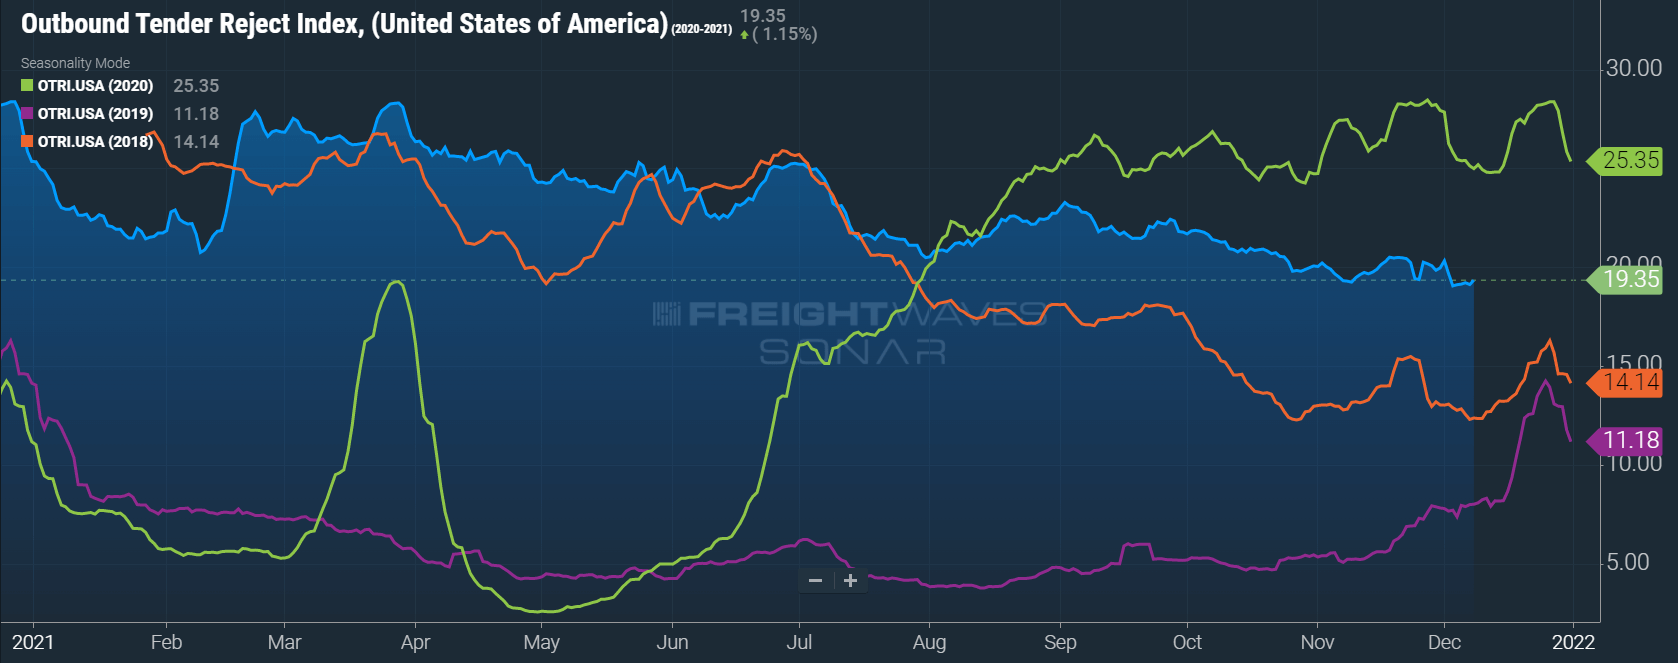 OTRI fell to the lowest levels since July 2020 in early December, indicating continued improvements in contract tender acceptance as a result of contract rate increases.
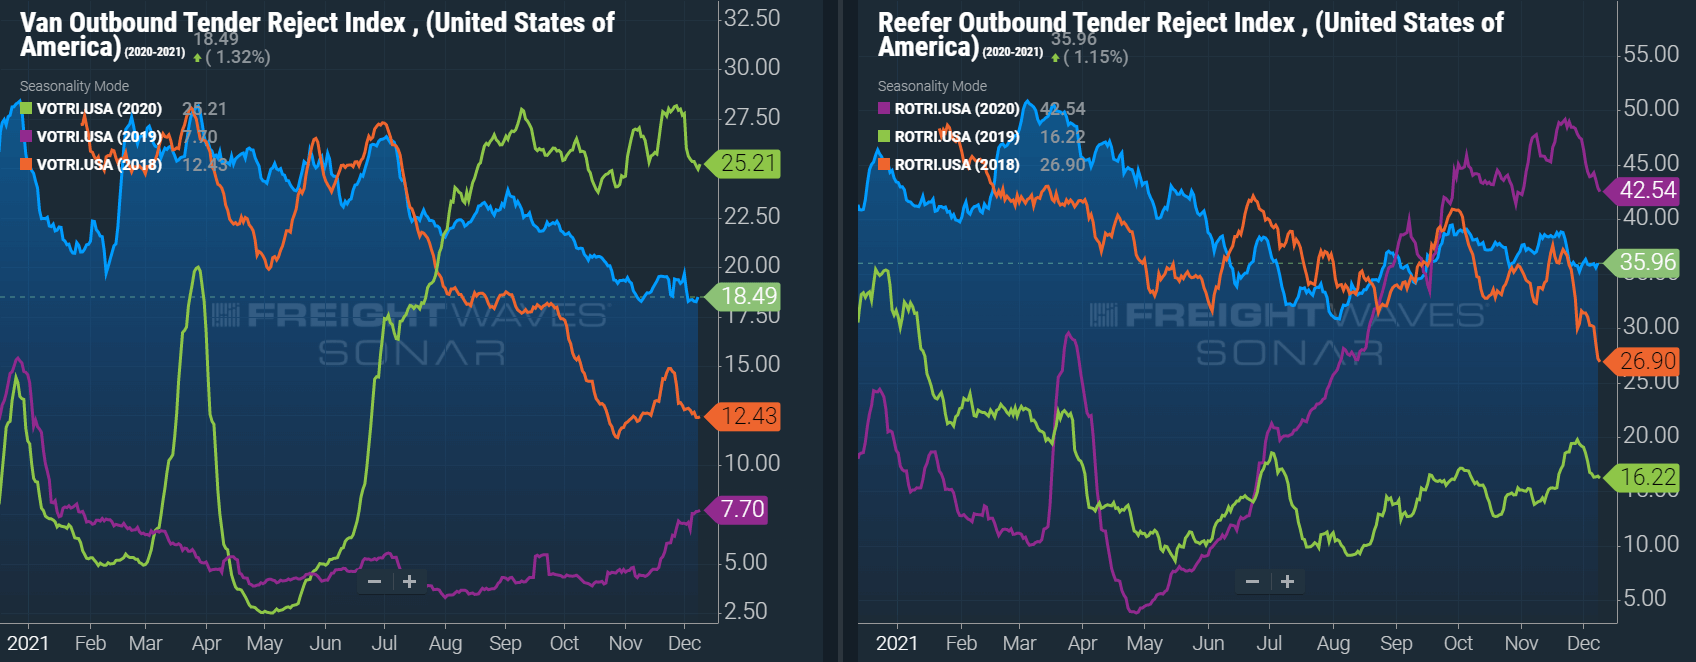 Dry van and Reefer tender rejections followed a similar trend to the all mode index, climbing the week leading up to Thanksgiving and settling in early December.
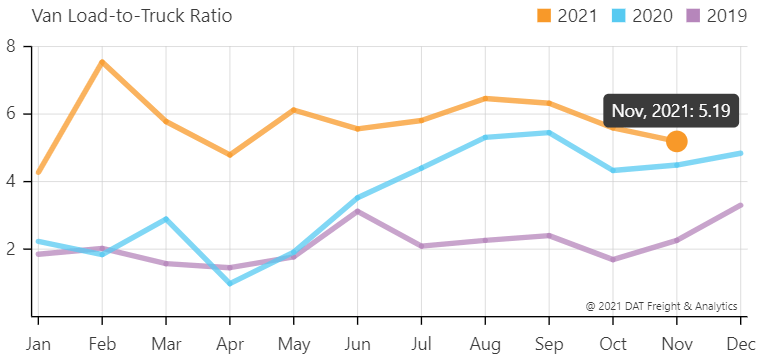
The DAT Load to Truck Ratio measures the total number of loads compared to the total number of trucks posted on their load board. In November, the Dry Van Load to Truck Ratio decreased to 5.19, down 7% month-over-month but up 15.6% year-over-year. The November decline was a deviation from historical norms, as we tend to see load to truck ratios increase in November as peak retail season activates the spot market.
The Reefer Load to Truck Ratio decreased to 11.92, down just 0.9% month-over-month, but up 27% year-over-year. Similar to the trends seen in Dry Van load to Truck Ratios, the reefer ratio saw softening at a time that it is used to seeing tightening conditions.
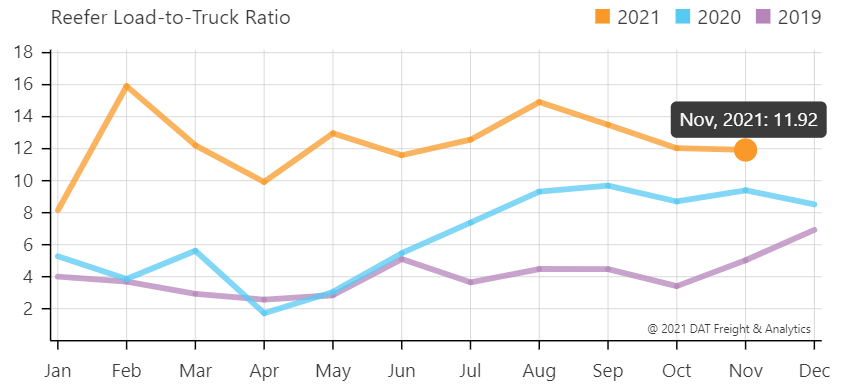
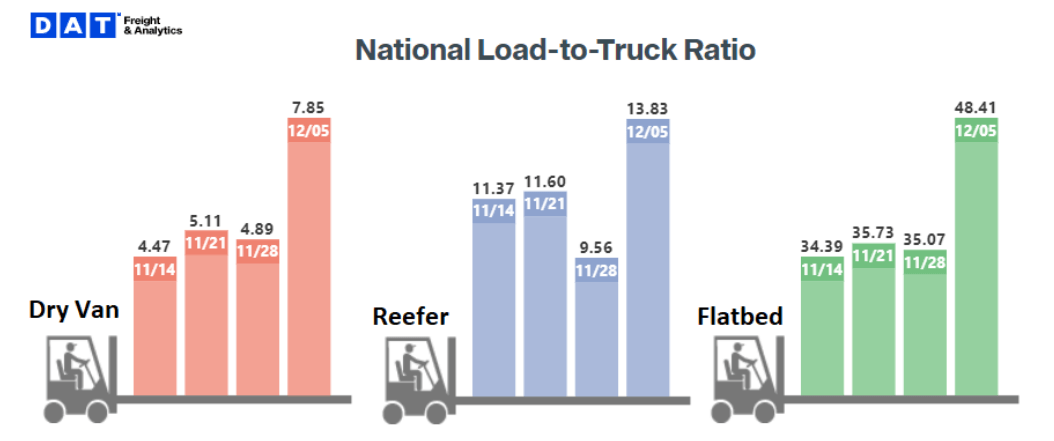
The weekly load to truck ratios show conditions tightened rapidly across all three equipment types in the week following Thanksgiving. With many shippers shutting down operations the week of Thanksgiving, volume growth of 106% in spot load posts the following week resulted in 60%, 45% and 38% increases in Dry Van, Reefer and Flatbed load to truck ratios week-over-week, respectively.
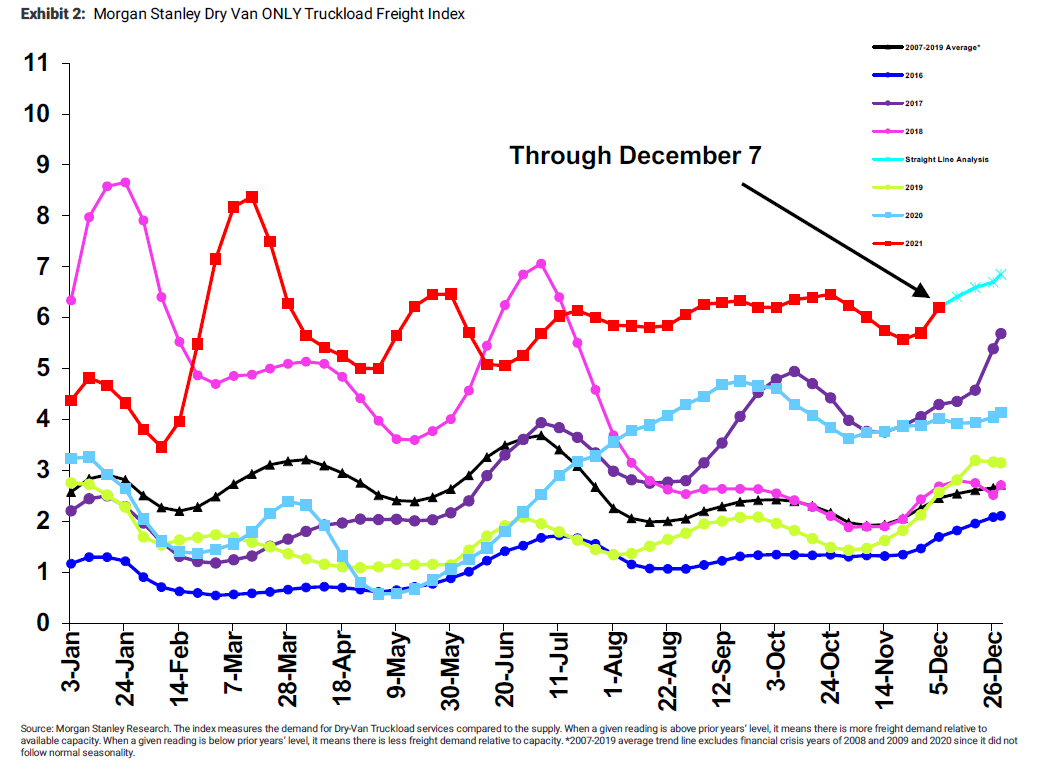
The Morgan Stanley Dry Van Freight Index is another measure of relative supply. The higher the index, the tighter the market conditions. According to the index, conditions underperformed relative to normal seasonality, falling throughout the month and surging less than expected in the runup to Thanksgiving. Looking forward, normal seasonality indicates increasing tightness through year-end, before seeing seasonal slowdowns early in the first quarter. Their straight-line forecast still indicates conditions will finish the year well above any other year on the chart, with conditions tighter than at any point this year except in the immediate aftermath of the February winter storms.
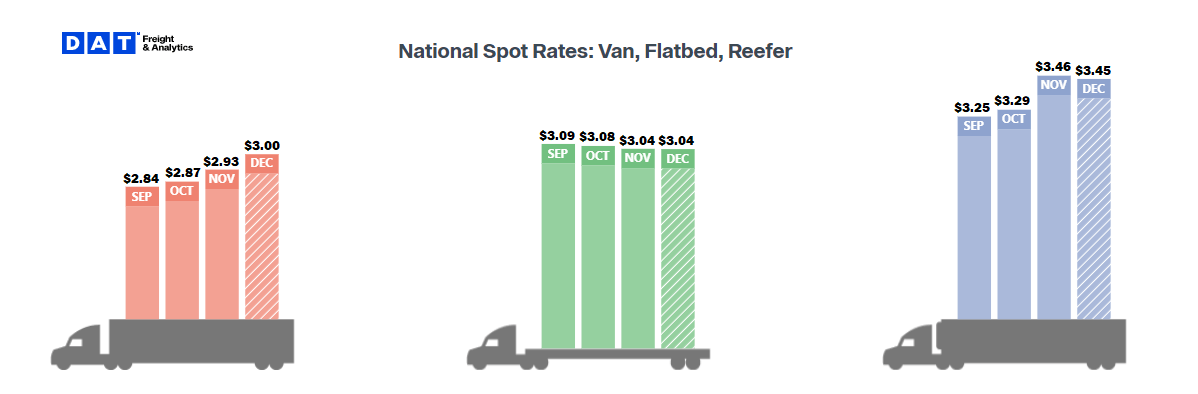
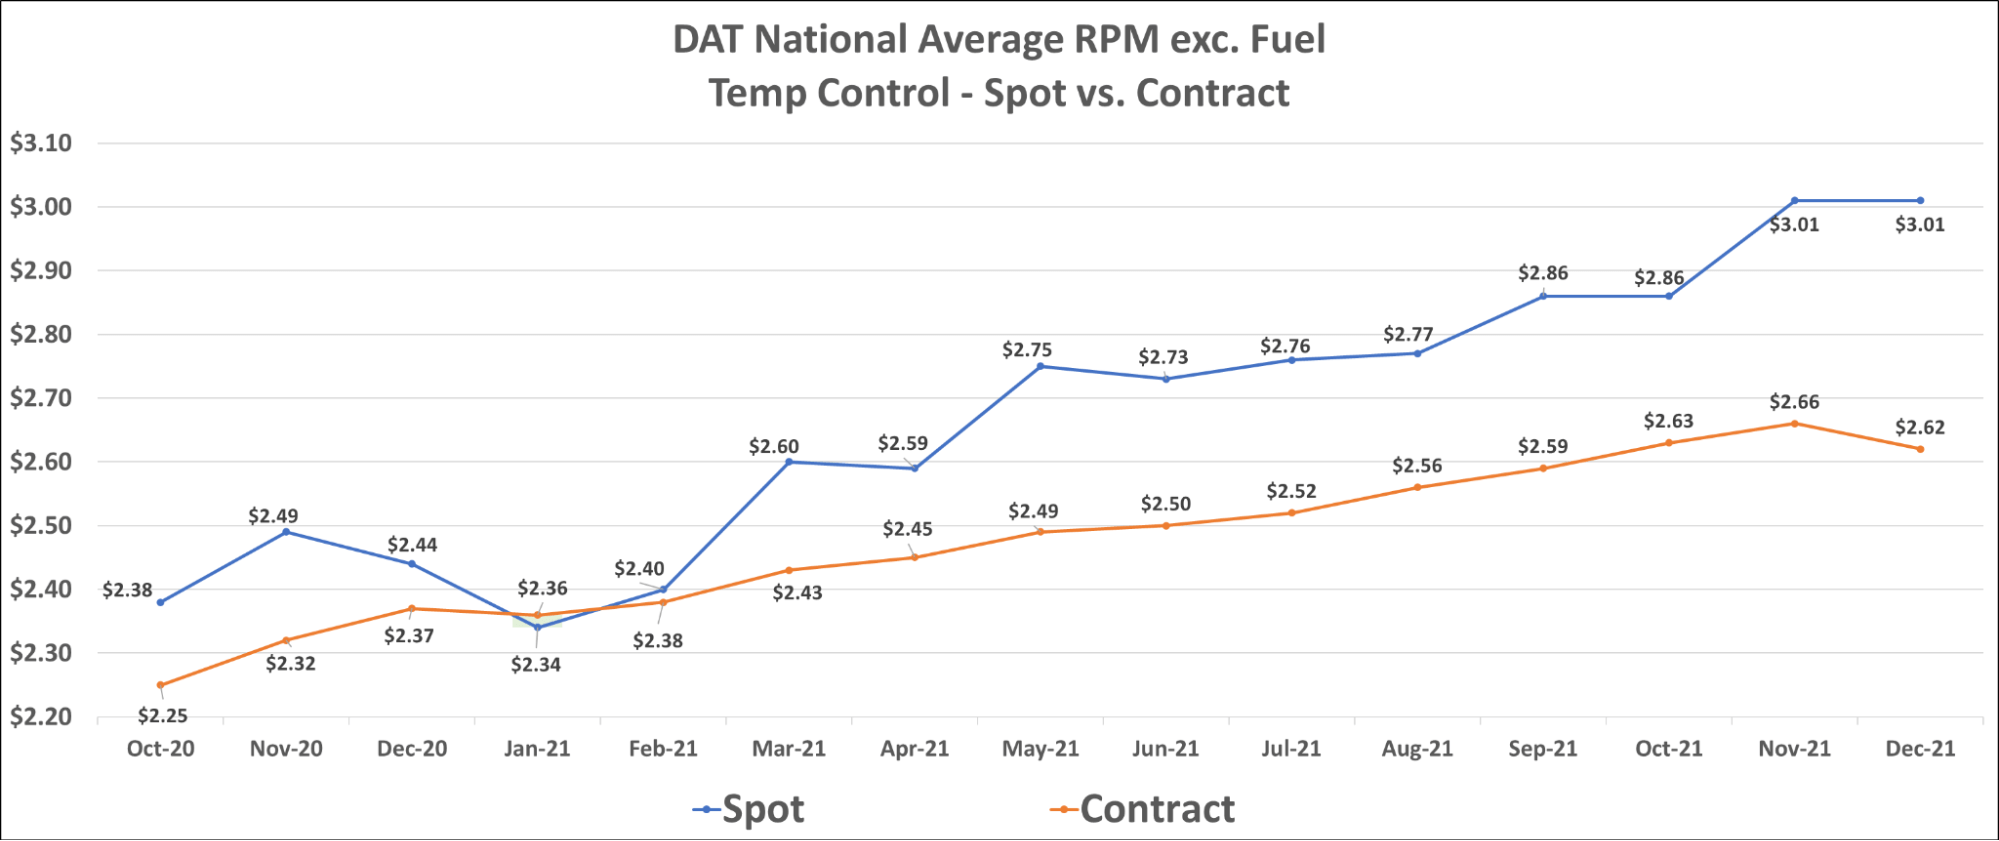
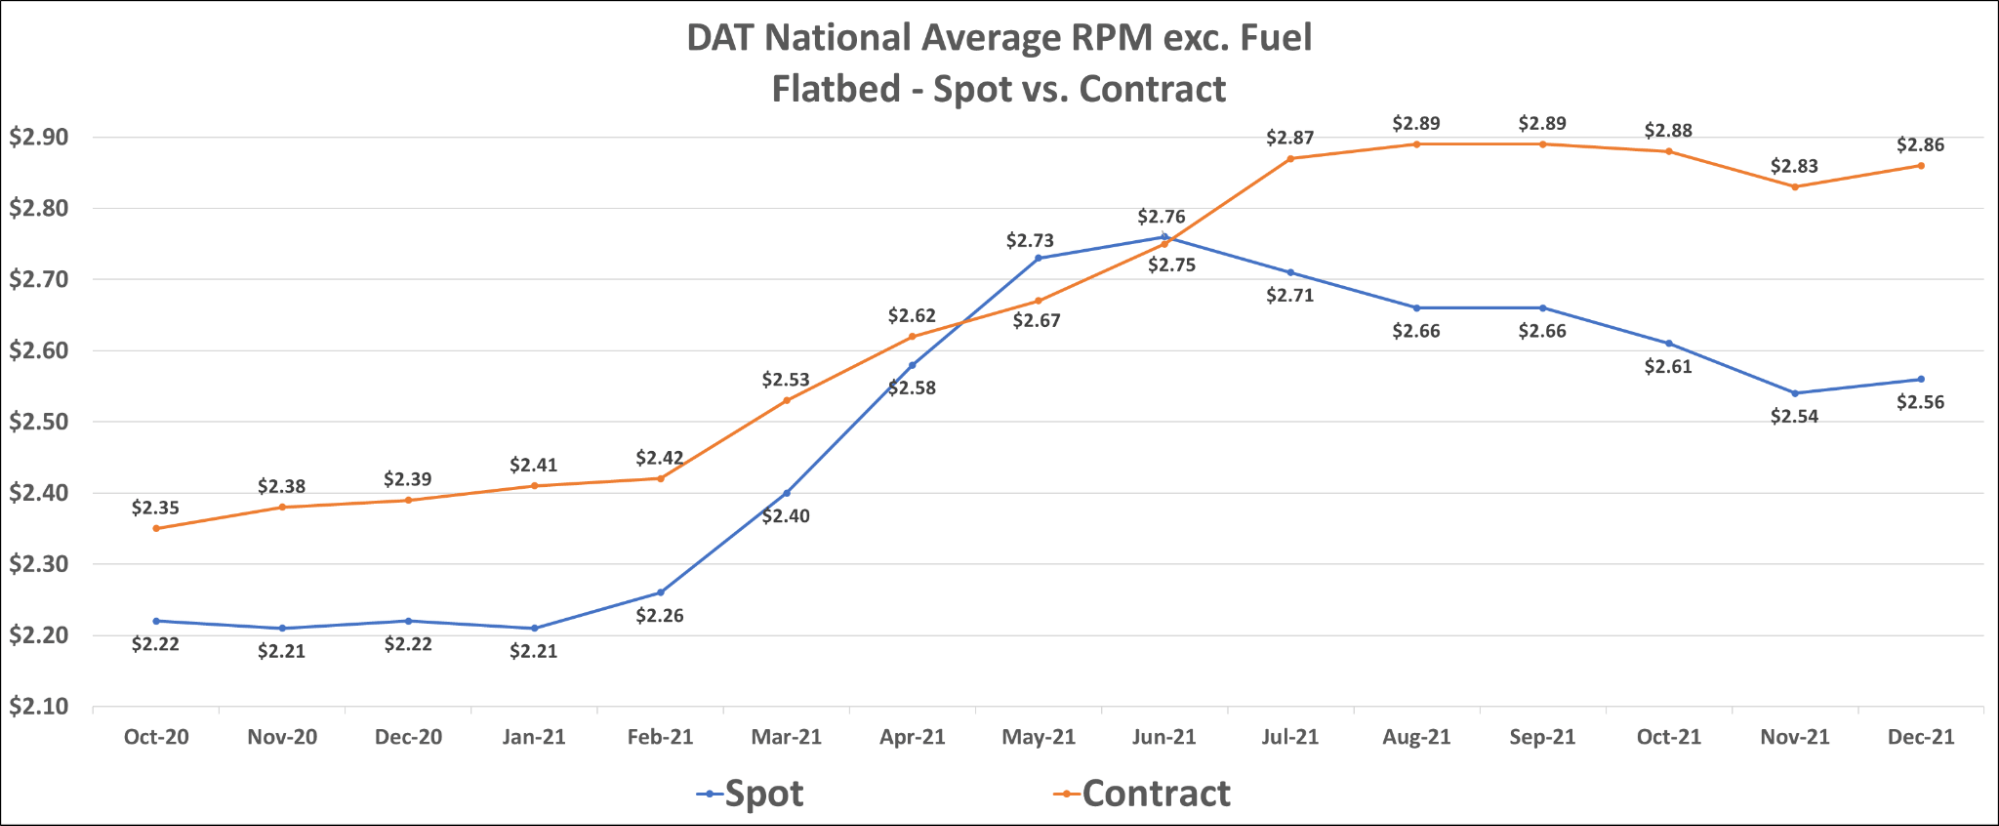
Dry van spot rates continued their climb, reaching a new all-time high of $2.93 per mile, including fuel, in November. Early December results show dry van spot rates have already trended up rather quickly and currently sit at $3.00 per mile for the first time ever. Reefer spot rates climbed $0.17 to $3.46 per mile in November, but have taken a step back, falling $0.01 to $3.45 per mile, in early December. Normal seasonality would indicate that we should expect to see spot rates remain elevated for Dry Van, but Reefer rates could begin to trend down as December progresses. Flatbed rates, including fuel, which has been relatively stable over the last few months, showed a $0.04 decline to $3.04 in November and have held flat in early December.
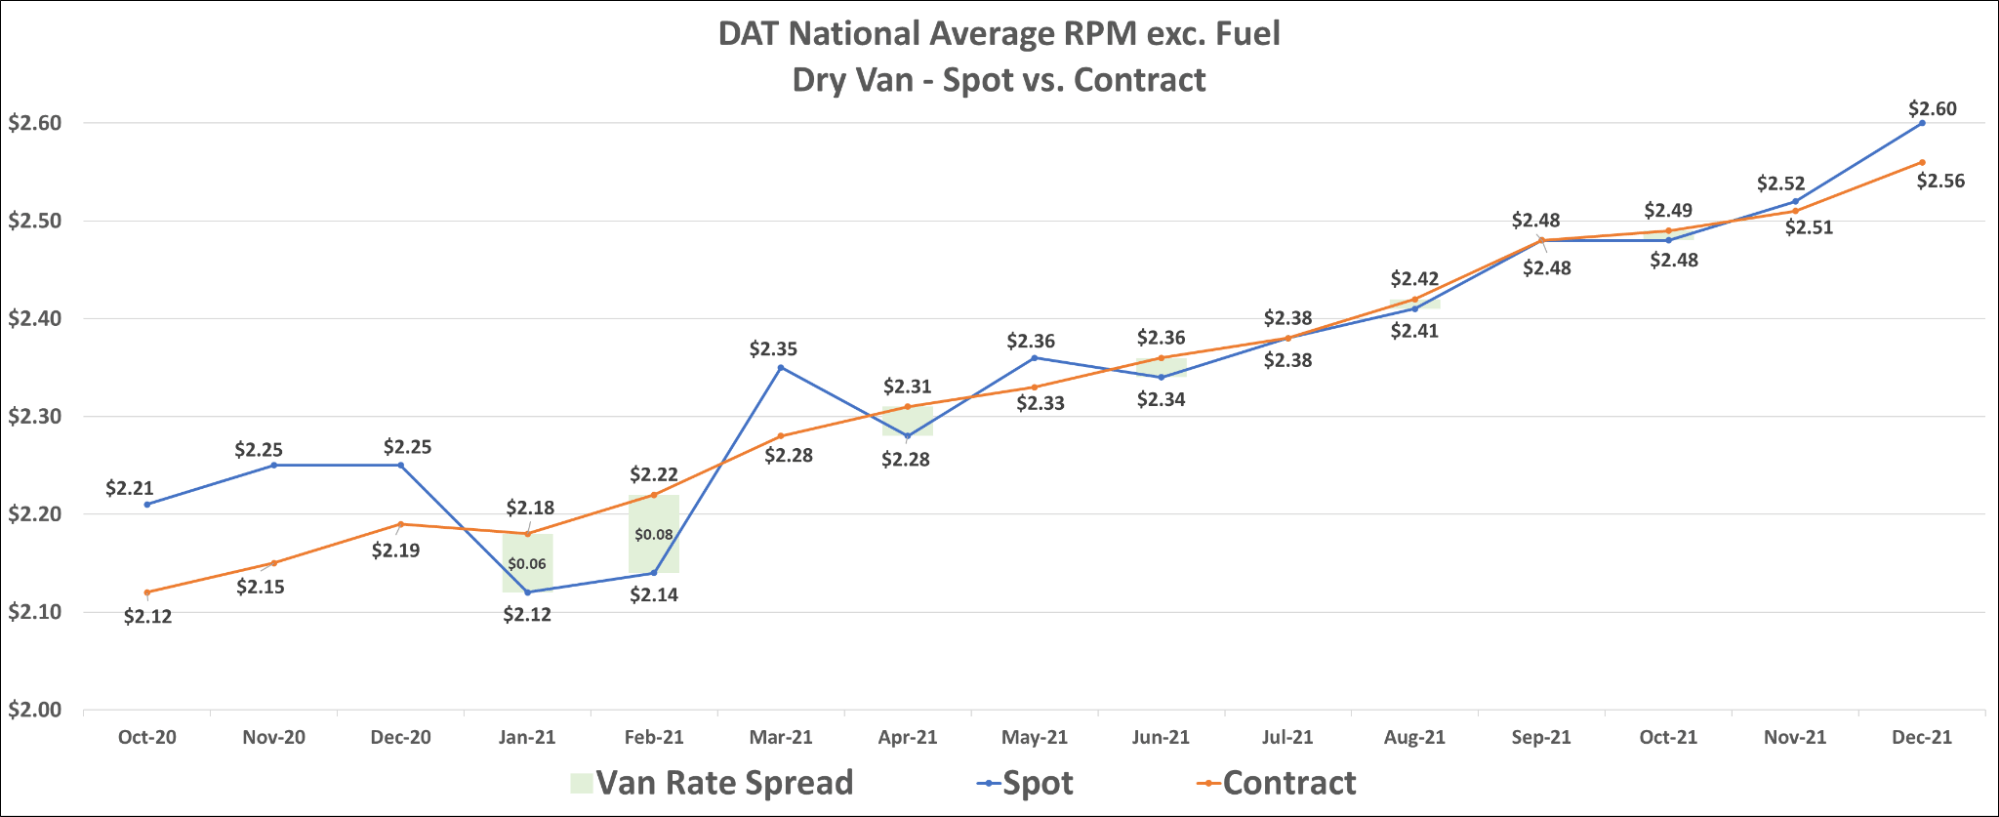 The Contract and Spot Van Rates continue to climb in unison to new records. Until we see rate stability, the fine line between spot and contract rate agreements will remain blurred.
Dry van contract rates, which have not declined month-over-month since May 2020, have reached a new all-time high in early December at $2.56 per mile, excluding fuel. Reefer contract rates, which have also seen consistent growth over the last 18 months, have taken an early turn downward, falling $0.04 to $2.62 per mile, excluding fuel. The flatbed market has seen a slight uptick in contract rates, rising $0.02 in early December to $2.56 per mile, excluding fuel.
Challenges with driver and equipment availability continue to cause headaches for carriers. Freight volumes have been consistent at “peak season” levels for months, spot and contract rates have hit all-time highs month after month, and we still see tender rejection rates hovering around 20%. The most likely path to equilibrium market conditions will depend on demand moderation, but improvements in capacity conditions would go a long way in easing rate pressures as well.
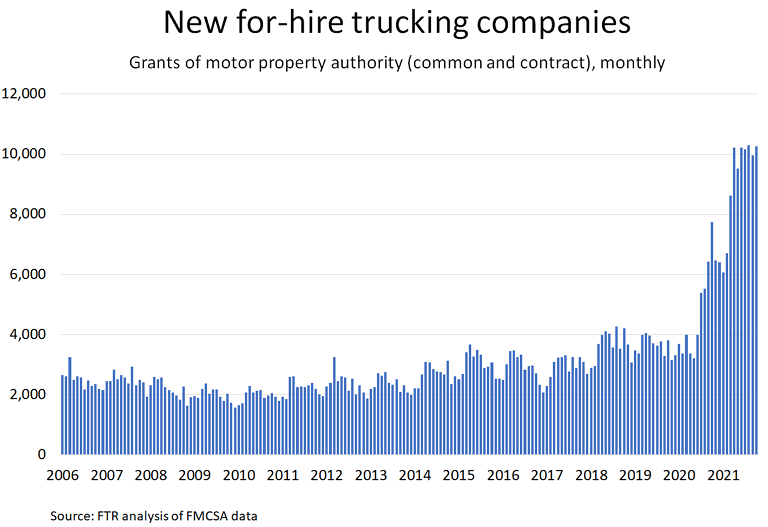
We continue to note the growth in capacity realized on smaller fleets. Since July of 2020, the Federal Motor Carrier Safety Administration (FMCSA) has authorized more than 113,000 new for-hire carriers, of which 102,000 still held authority as of October 2021. FTR has been able to substantiate that at least 68,000 of these carriers are operating at least one tractor and are not solely straight truck operations. These 68,000 carriers account for more than 104,000 drivers. That is an average of fewer than two drivers per carrier. Estimates indicate that at least 70% of these fleets are single drivers. Many, if not most, of these single truck operations, were previously leased on to larger fleets, but have decided to break free as a result of increased opportunity and elevated rates in the spot market. In October, the incredible pace of new for-hire trucking companies continued, as more than 9,100 new fleets were authorized. This is significantly more than any month seen prior to the pandemic and illustrates just how much movement there is of drivers away from the larger fleets. As long as spot rates remain elevated, these owner-operators are highly incentivized to remain on their own. Although this capacity does not add up to a majority of the capacity on the road, it is significant enough to cause difficulty for larger fleets in sourcing drivers.
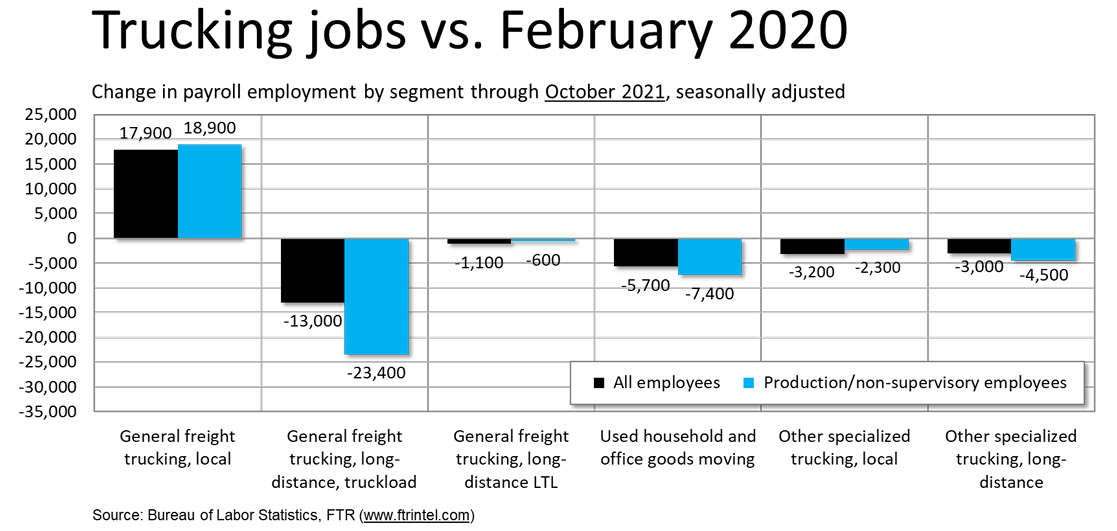
The shift in drivers from large fleets to smaller fleets is not the only reallocation of drivers actively taking place. Payroll employment broken down by segment illustrates that the general freight trucking local segment has seen a disproportionate gain in payroll employment compared to other segments in trucking. The rise of e-commerce has resulted in significant increases in parcel volumes. Many drivers see the benefit of being able to stay close to home and sleep in their bed every night. It is possible that after the holiday retail season we could see drivers shifting back to long-distance truckload jobs if demand for local delivery drivers moderates.
On a positive note for driver availability, the decision not to enforce the vaccine mandate in the new year was likely made to prevent what could have been a large reduction in the driver population seemingly overnight.
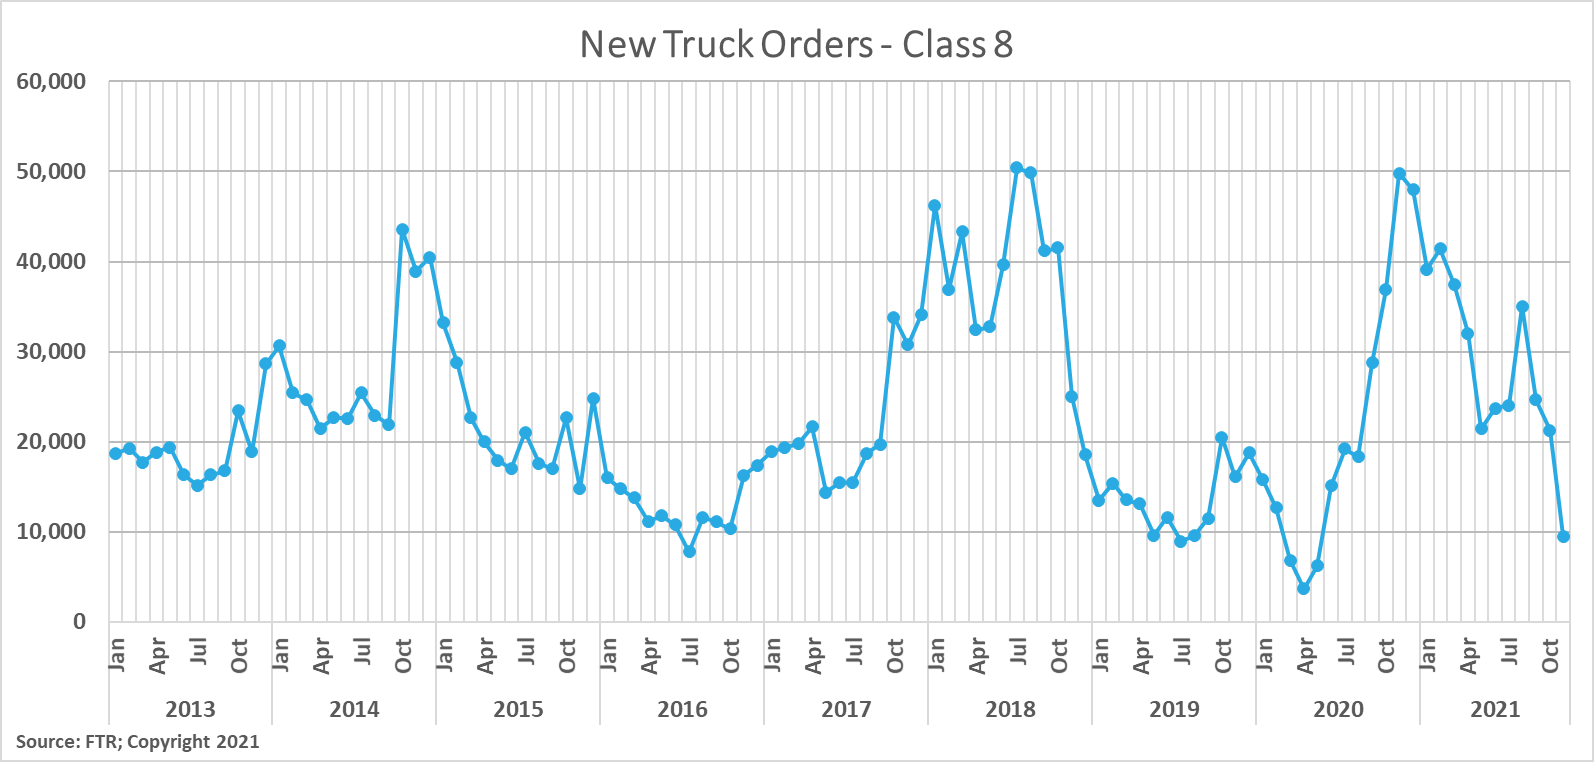
The equipment side of the equation saw no improvements month-over-month, as Class 8 truck production fell 14% in October as supplier deliveries continued to fluctuate. Part shortages continued to be the main constraints as OEMs continue to forecast limited production levels until semiconductor and other supply shortages are resolved. This decline in production levels led to an increase in the average time from order to delivery from 12.5 months in September to 14.6 months in October as the backlogs grew. Although there is no shortage of demand for new equipment, there was a sharp reduction in new truck orders in November. This is a direct result of OEM’s not taking orders due to large backlogs and signals that there is a lot of uncertainty about when production levels will return to normal.
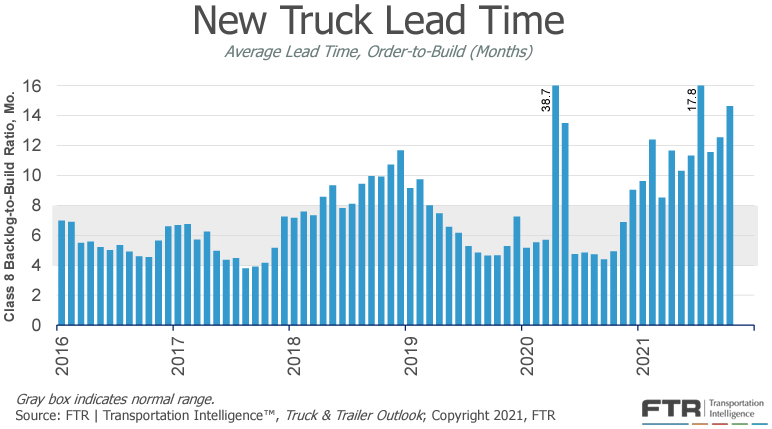 New truck lead time increased from 12.5 months in September to 14.6 months in October.
New trailer production levels increased slightly in October, as OEMs produced just 1% more units on a per-day basis. FTR continues to indicate that the industry is in a holding pattern until the supply chain issues impacting availability for truck parts and trailer production are resolved. In the meantime, it will be difficult for fleets to acquire new trucks or trailers.
In addition to limiting new truck and trailer production, carriers note that parts shortages are also contributing to longer delays for routine maintenance. Sourcing parts has become a real challenge and is having a significant impact on asset utilization. Additionally, labor shortages at shippers have resulted in increased dwell time and detention at pickups and deliveries. All of these challenges add up and act as real costs for carriers, and further complicate the path to equilibrium due to a recovery in capacity conditions.
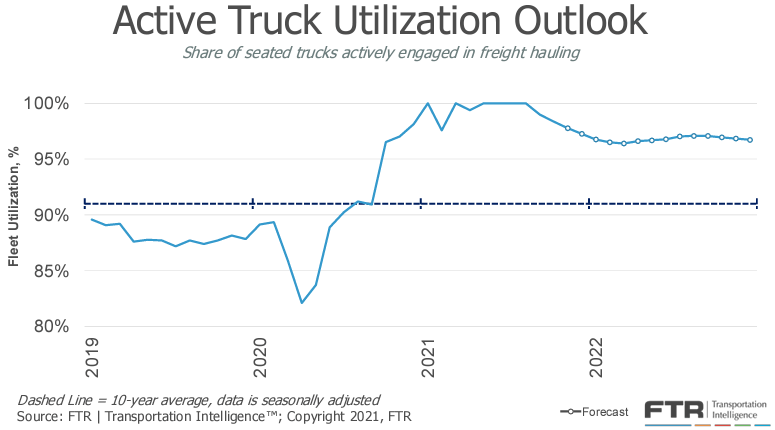
FTR’s forecast for truck utilization, the share of seated trucks actively engaged in freight hauling, is noticeably softer due to stronger driver capacity gains in recent months and a continued weakening of freight growth. This does not mean utilization will be low, as FTR expects it to remain above 96% through the entirety of 2022 and beyond.
In the short term, we expect very little to change throughout the remainder of the year as peak retail season plays itself out. The amount of volume that has moved through our ports and over the road and rail to store shelves this year is impressive. Even with record import and freight volumes, on-the-shelf availability is currently running at 90%, down just 1% from pre-pandemic levels. This is a sign that even with all the concerns around port congestion and supply chain constraints, retailers have been able to keep inventory levels high enough to fulfill consumer demand on par with normal times. In fact, retail inventories have grown 4% year-over-year. Port congestion is still a major concern and is a sign that we should continue to expect strong demand into the new year. High import volumes are expected to continue throughout 2022, supplying much-needed raw materials to support manufacturing and industrial production, as well as inventory restocking, particularly in the home improvement and retail sectors.
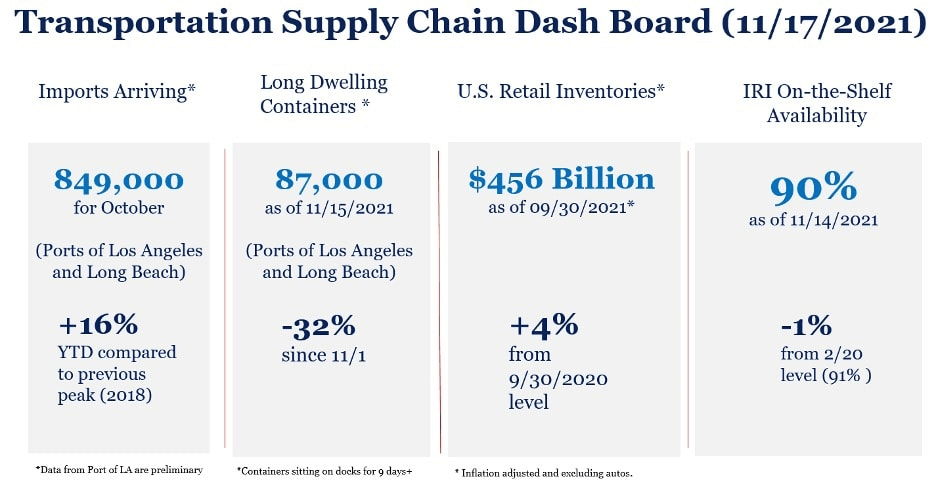 New White House dashboard illustrates the surging demand for imports, up 16% from the prior peak in 2018, and slightly lower on-the-shelf availability of products, down just 1% from pre-pandemic levels.
Manufacturing and industrial production continue to be bottlenecked severely by supply chain issues. The outlook for both sectors remains high due to low inventories and consistent demand. Supply chain issues are expected to remain a challenge throughout 2022, but easing conditions later in the year could lead to recovery in production levels which would be an additional boost for demand.
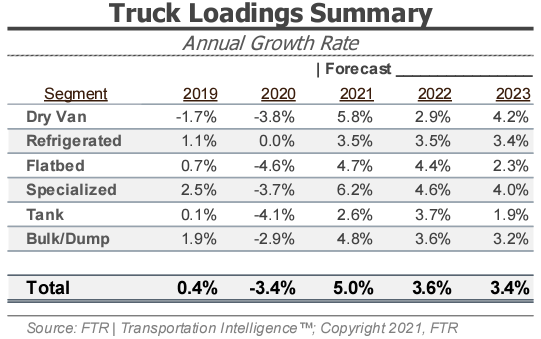
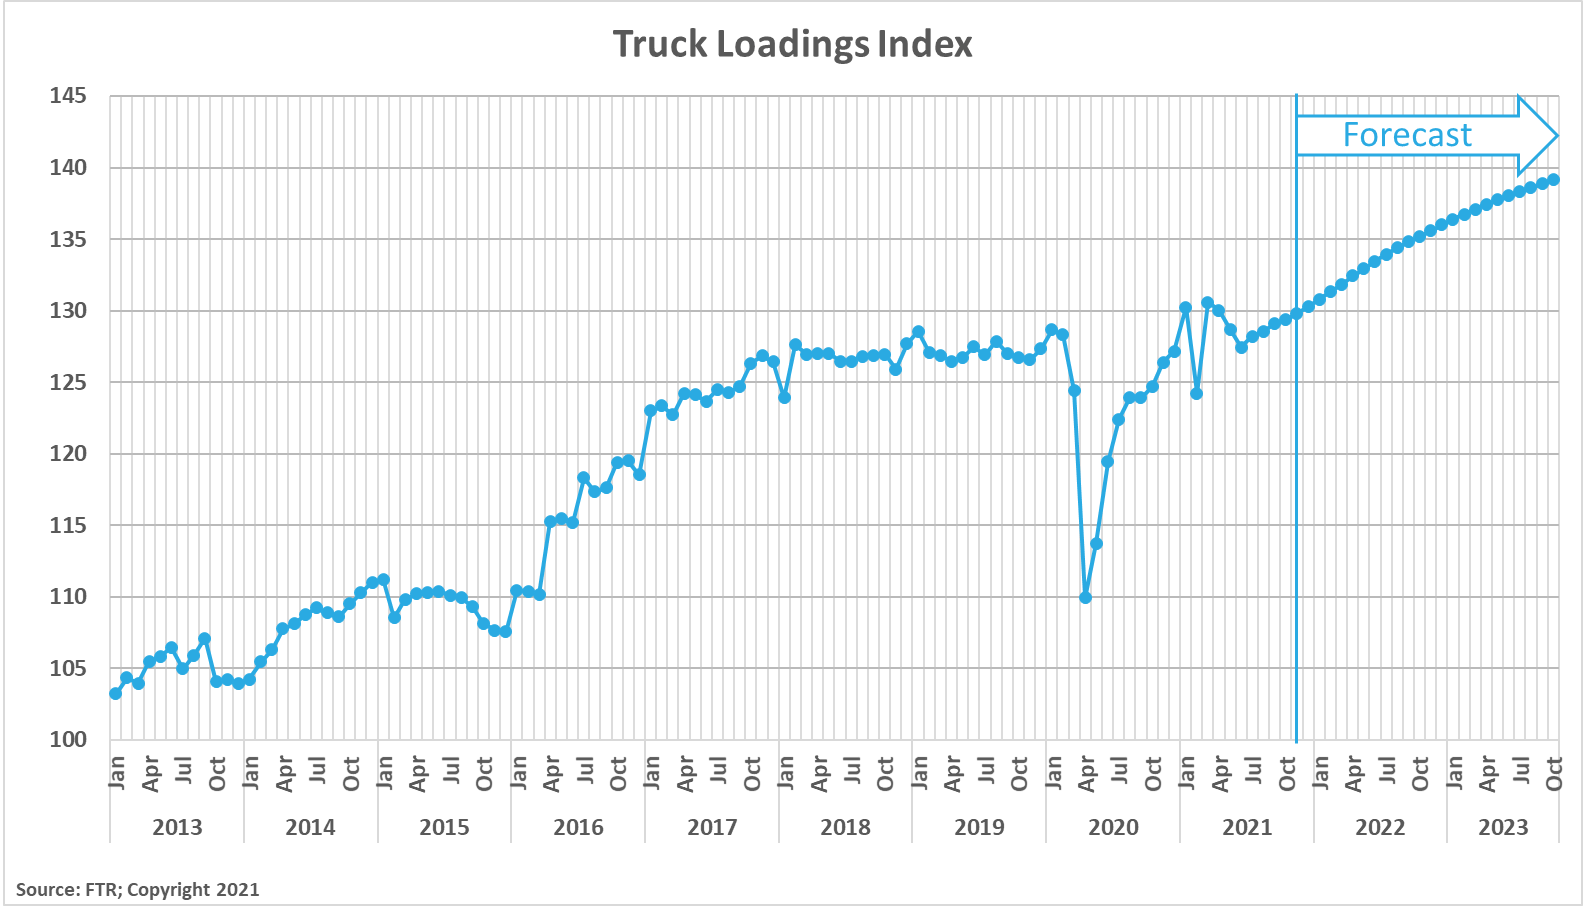
FTR’s latest truck loadings forecast shows a slightly weaker outlook for 2021 than last month’s forecast coming in at 5.0% for the full year, down from 5.4% last month. The 2022 forecast is also slightly weaker at an increase of 3.6% year-over-year, down from 3.8% a month ago.
Declines were seen month-over-month for Dry Van, Specialized and Tank equipment type loadings for the full year 2022 forecast, while increases were seen in Refrigerated, Flatbed and Bulk/Dump equipment types. Regardless of the slightly weaker outlook, volumes are expected to continue to grow into next year. This anticipated growth in demand will continue to stress carrier networks and will keep upward pressure on rates until capacity can be added to the road.
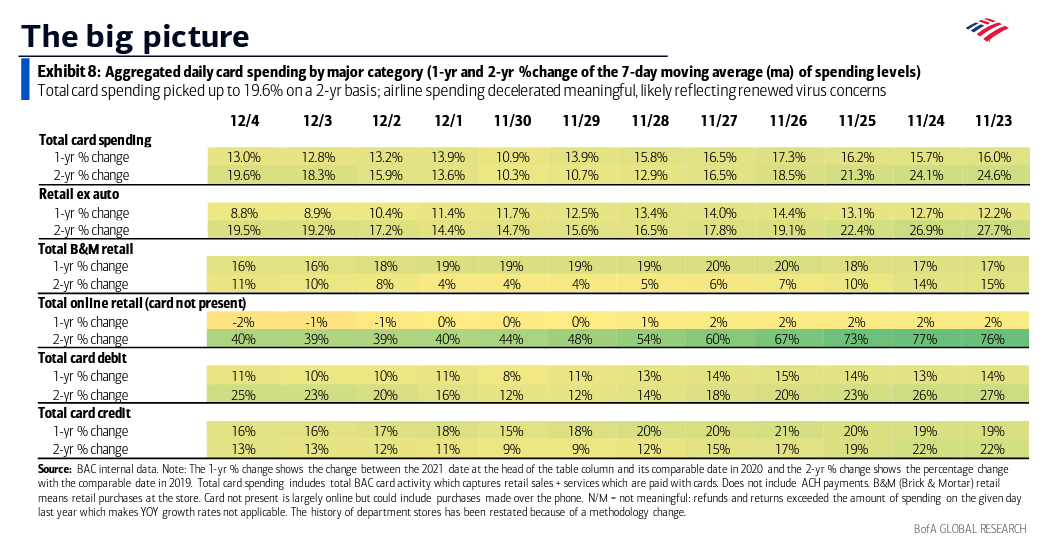
The Bank of America (BofA) consumer spending data provides visibility into changing consumer behaviors and spending patterns. Total card spending is up 13.0% year-over-year and 19.6% compared to 2019 for the 7-day period ending December 4th. These numbers indicate consumer spending is still significantly elevated as we move into December.
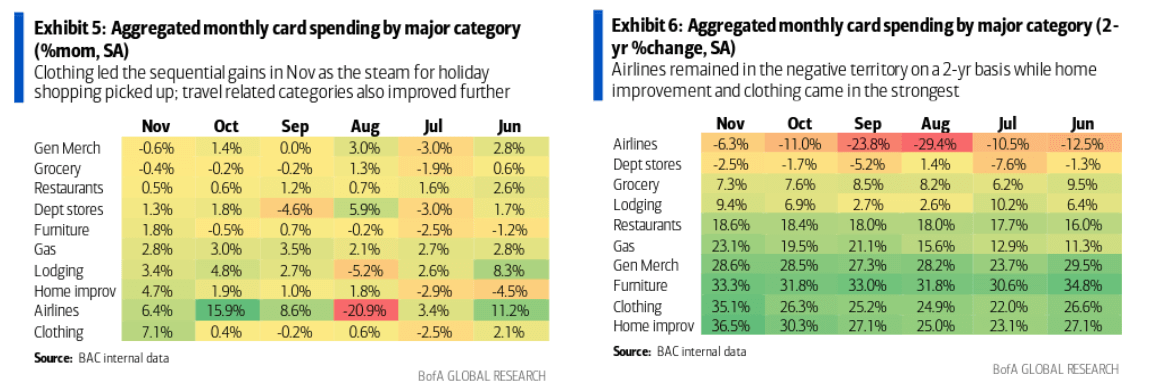
One of the biggest concerns around spending levels is that portions of the increases seen are tied to inflation and that eventually, inflation will lead to a slowing economy. Whether or not this will play out is yet to be determined, but we do not expect anything along these lines in the front half of the year. We continue to point to the importance of consumer demand in whether or not we see strong truckload demand persist throughout 2022. Elevated consumer activity levels are the main reason for the supply chain congestion and backlogs we face today. Changes in consumer behavior will likely be necessary to ease pressure and allow inventories to be replenished, slowing demand and enabling a return to equilibrium. Although we have seen improvements in categories such as airlines and lodging in recent months, there is continued strength in durable goods, as furniture, clothing and home improvement lead the way with spending at more than 33% above 2019 levels.
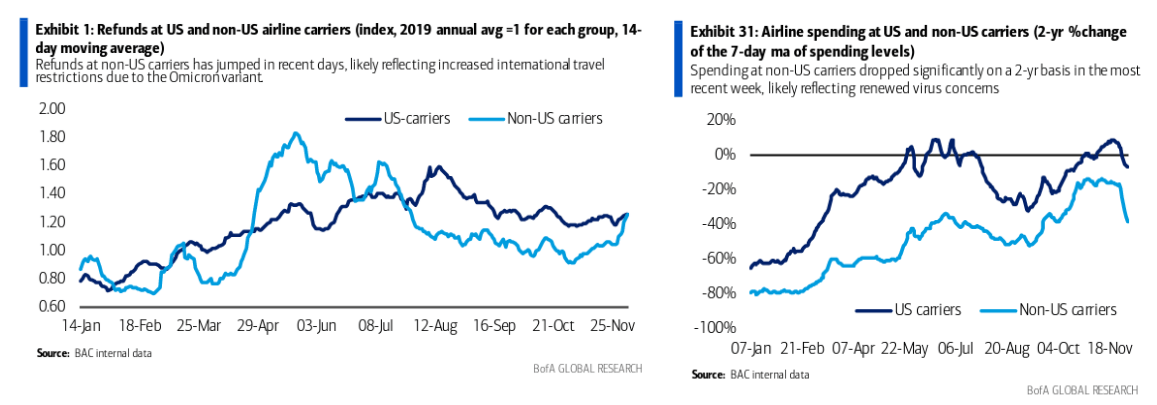
Additionally, we have seen fears over new COVID variants lead to pullbacks in the shift to travel and services. This is particularly true when it comes to international travel. The charts below illustrate the impact of fears tied to the emergence of the Delta and Omicron variants. On the left, the refund rate for the US and Non-US carriers saw increases when Delta hit in the third quarter and as of late, due to concerns of the new Omicron variant. On the right, spending took a clear dip for both domestic and international carriers. This is something to consider as we establish expectations around how gradual the shift in spending will be as we return to normal.
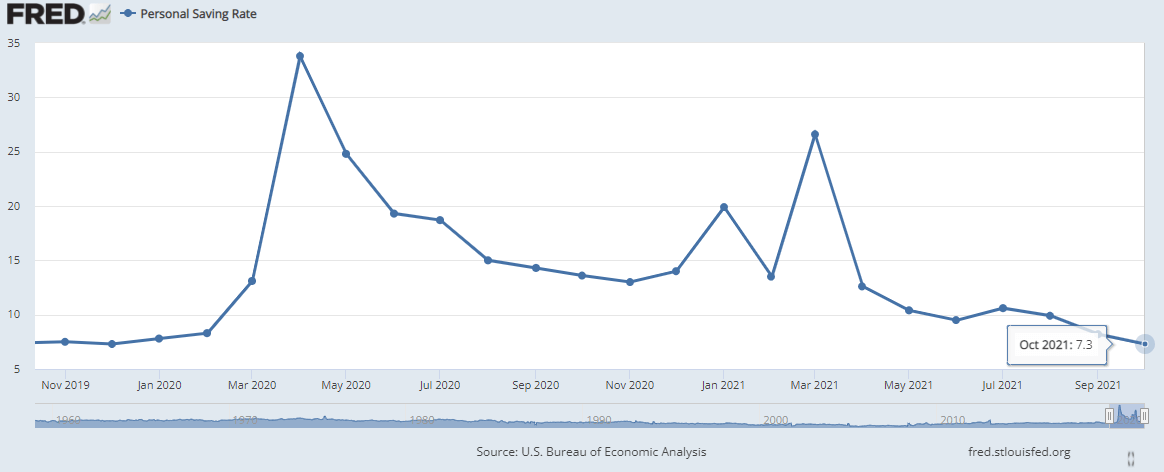
One of the key drivers of elevated consumer spending throughout the pandemic has been government stimulus. Large injections of cash into the US economy allowed consumers to realize personal savings rates well above normal levels. As we saw government stimulus play its course, we have seen the personal savings rate fall back to pre-pandemic levels. This is a sign that consumers are not saving as much as they were, and that current spending levels may not be sustainable forever. At some point, we will see the economy slow down and allow for a return to normal.
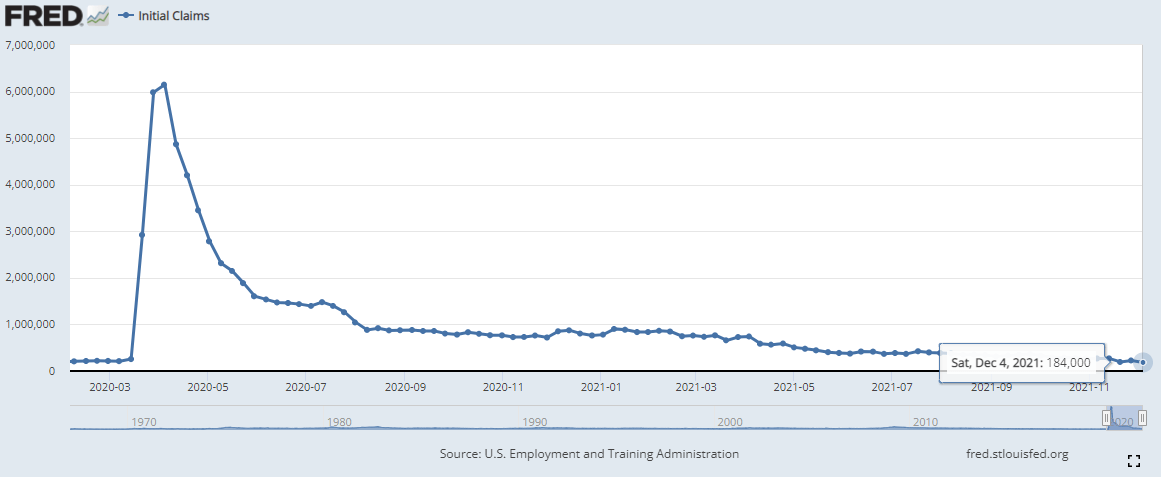
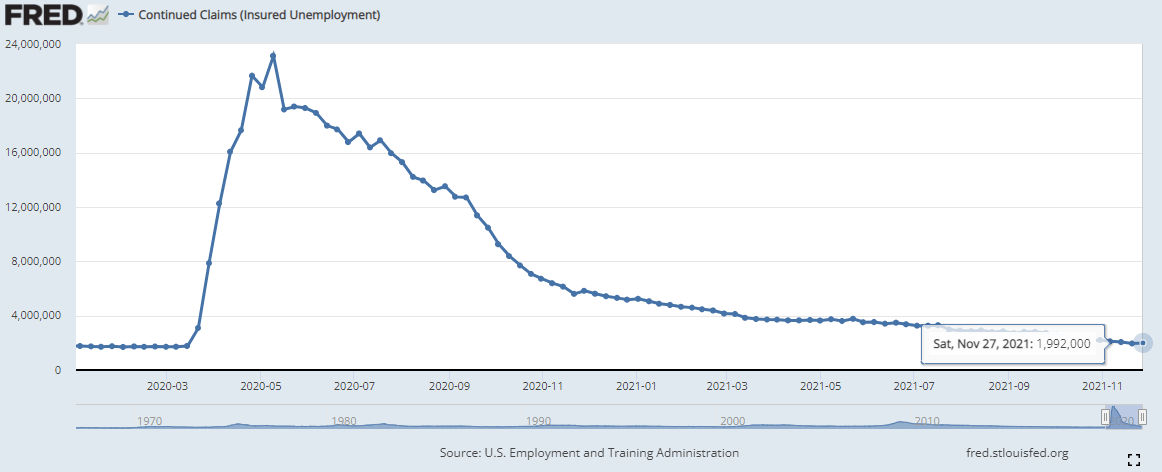
 The unemployment trends have improved slightly in November as initial claims in the most recent week came in at 184,000, down from 269,000 from last month, and are now at levels below where we were when the pandemic hit. Continued claims have declined further, again reaching their lowest levels since the start of the pandemic, down to 1.9 million from 2.1 million last month, on a weekly basis.