"*" indicates required fields
"*" indicates required fields
"*" indicates required fields

February 2021
The Arrive Monthly Market Update, created by Arrive Insights, is a report that analyzes data from multiple sources including but not limited to FreightWaves SONAR, DAT, FTR Transportation Intelligence, Morgan Stanley Research, Bank of America Internal Data, Journal of Commerce, Stephens Research, National Retail Federation and FRED Economic Data from the past month as well as year-over-year.
We know that market data is vital to making real-time business decisions, and at Arrive Logistics, we are committed to giving you the data you need to better manage your freight.
Our forecast for market conditions throughout the year remains unchanged. Although uncertainty surrounding stimulus and the efficiency of the vaccine distribution remain, our research indicates that the most likely scenario is a first half that plays out similarly to 2018 where constrained capacity kept rates elevated before giving way to softer market conditions in the back half of the year. This will lead to decreasing rates as capacity begins to enter the market, and consumer spending shifts away from durable goods. Our forecasts continue to show spot rates will return to flat year-over-year by late Q3 and down 10% by year end. Contract rate correction will have a longer time horizon. We expect an annual average increase of 8-10% year-over-year in 2021. Below are a few high-level takeaways from the report:
Tender Volumes are representative of nationwide contract volumes and act as an indicator of Truckload Demand
Tender Rejectionsindicate the rate at which carriers reject loads they are contractually required to take and acts as an indicator of the balance between Truckload Supply and Demand
New Truck Orders is an indicator of the trucking industry’s health and carrier sentiment, as carriers typically invest in new trucks when demand and optimism are high.
Industrial Production measures the output of the industrial sector, including mining, manufacturing and utilities.
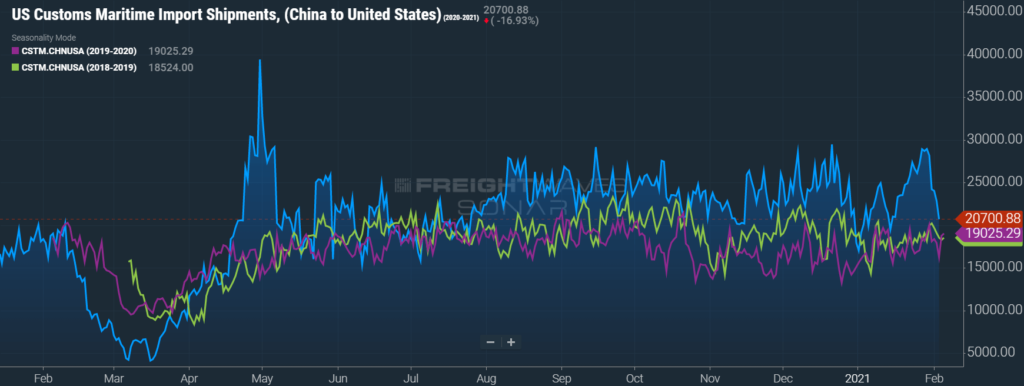
US Customs Maritime Import Shipments, China to the United States measures the total number of import shipments being cleared for entry to the U.S. from China.
Rate Spread measures the difference between the national average contract rate per mile and the national average spot rate per mile and is closely inversely correlated to movements in tender rejections and spot market volumes.
Weekly Jobless Claims are used as a barometer for the pace of layoffs in the general economy.
Unemployment Rate is the number of people who are unemployed that are actively seeking work.
"*" indicates required fields
The dynamics of truckload demand typically shift in January as the retail peak season comes to a close and new contracts go into effect. Contract business increases as a percentage of the total volume while overall spot activity subsides. The pandemic has resulted in a lot of abnormal market condition patterns, but January 2021 provided signs that the inflationary run is complete, and our forecasting will cautiously rely on more traditional seasonal patterns. Inclement weather has been a challenge in the back half of the month and could result in a temporary influx of spot activity throughout February in the most heavily impacted areas.
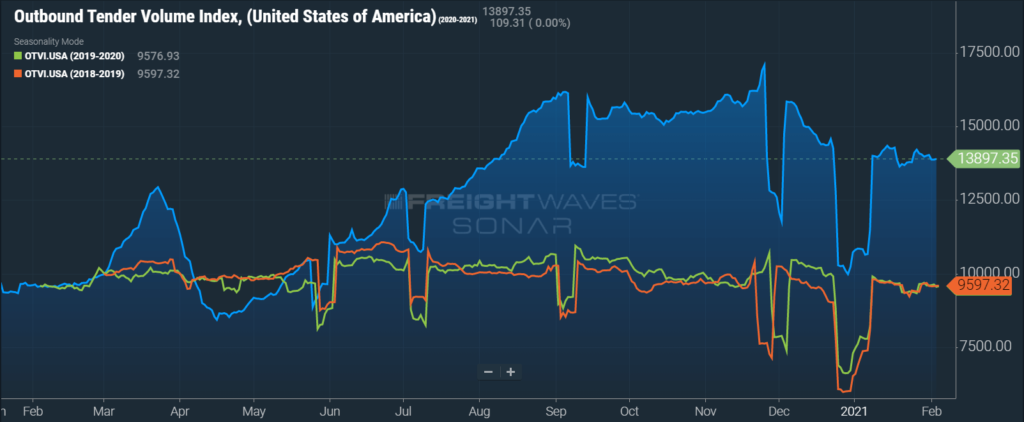
FreightWaves SONAR Outbound Tender Volume Index (OTVI), which measures contract freight volumes across all modes, is up by 45% year-over-year in February but moderated slightly in January, where volumes at the end of the month were roughly flat compared to the start of the month. It is important to note that OTVI includes both accepted and rejected load tenders, so we must discount the index by the corresponding Outbound Tender Rejection Index (OTRI) to uncover the true measure of accepted tender volumes. If we were to apply this method to the year-over-year OTVI values, the increase in volume drops to roughly 18.8%. The Dry Van and Reefer Tender Volume Indices were also up more than 47% and 62% year-over-year, which equated to 20.1% and 8.4% increases in actual volumes for the two modes, respectively. The Dry Van Index was flat in January, but the Reefer index continued to decline steadily and is down by about 4.6% month-over-month.
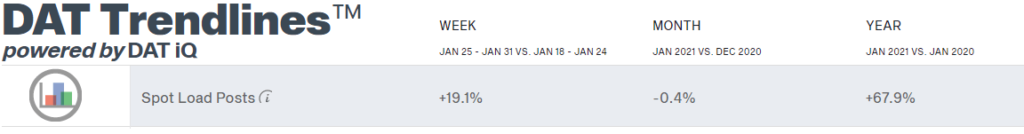
DAT reported that dry van spot load posts fell slightly in January, decreasing by just 0.4% month-over-month but remained up 67.9% year-over-year. The monthly decline would have been larger had it not been for a tighter end to the month. Spot load posts were up more than 19% in the final week of the month, a commonly seen shipper practice paired with and a slight uptick in tender rejections brought about by the major snowstorms affecting large portions of the country.
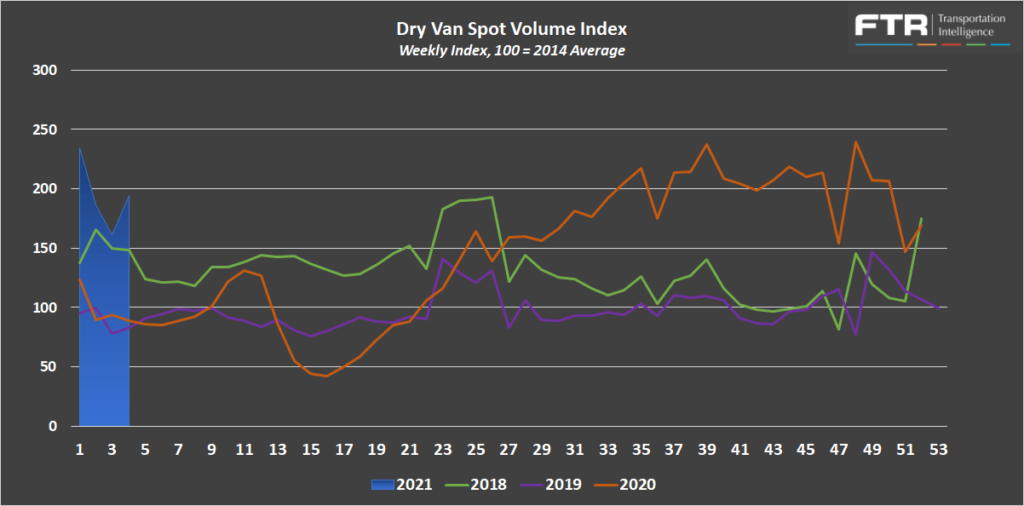
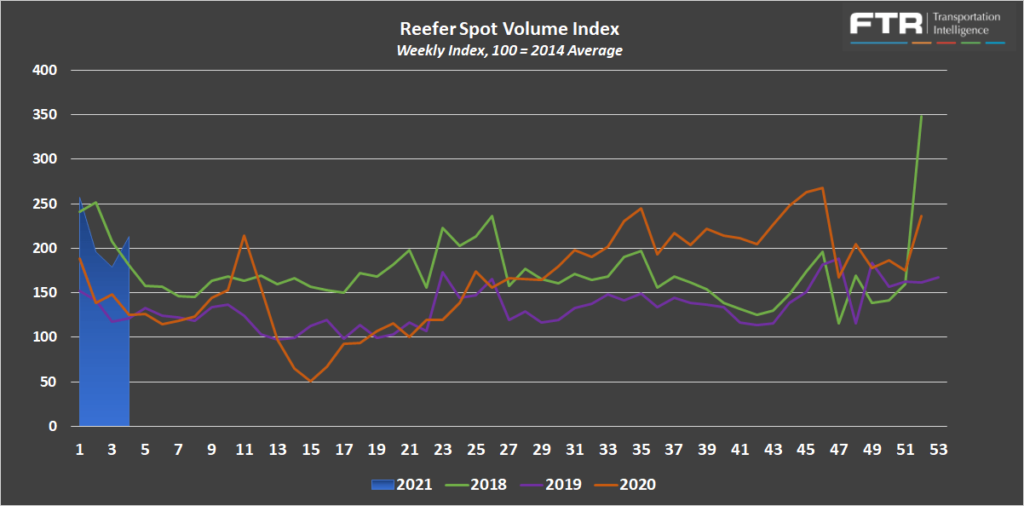
FTR and Truckstop’s Total All Mode Spot Volume Index is up 12.0% from the high in December and 113% year-over-year. The index declined by 11.7% from week one to week three, before increasing by 14.0% in week four. This pattern is consistent with the trends seen in DAT’s January spot data and provides further evidence of the impact seen in the last week of the month. The Dry Van Spot Volume Index is up 6.4% month-over-month and 96.3% year-over-year, and the Reefer Spot Volume Index is up 9.0% month-over-month and 40.8% year-over-year in January.
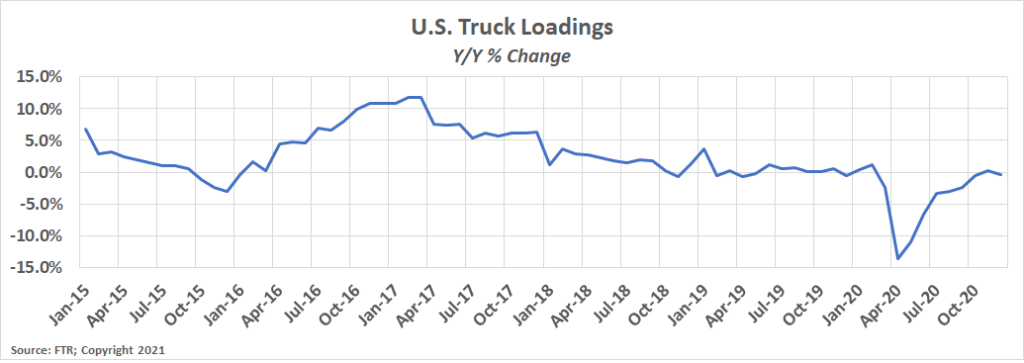
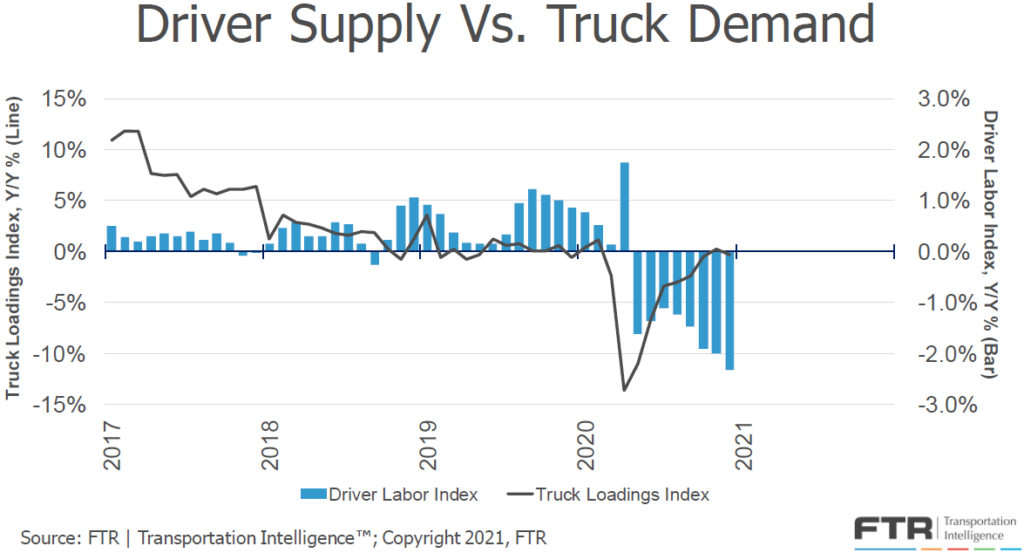
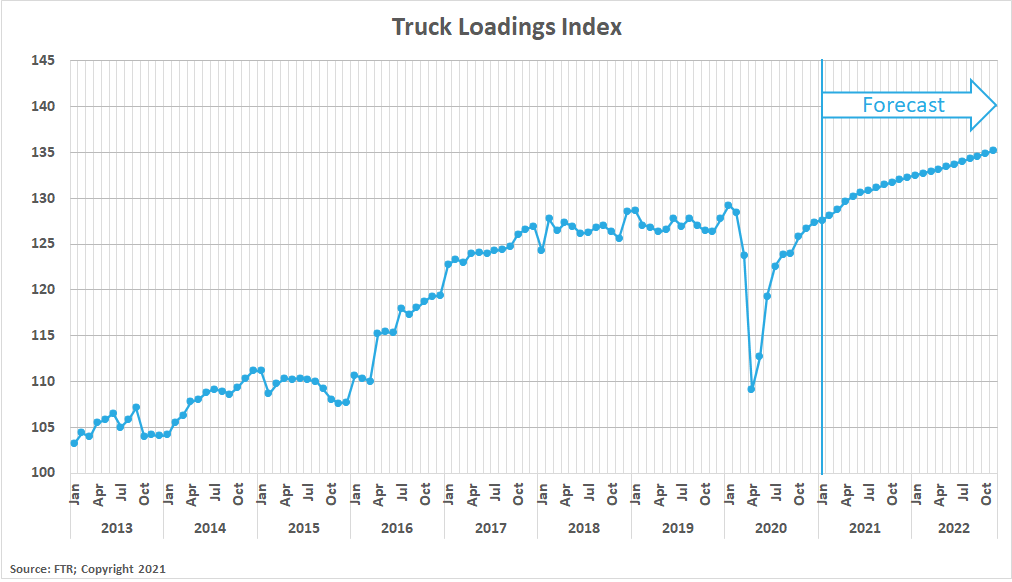
FTR’s Truck Loadings Index was down by just -0.3% year-over-year in December after rising by 0.5% month-over-month from November. In 2019, the Truck Loadings Index increased by 1.1% month-over-month in the same time period before increasing again by 1.1% in January.
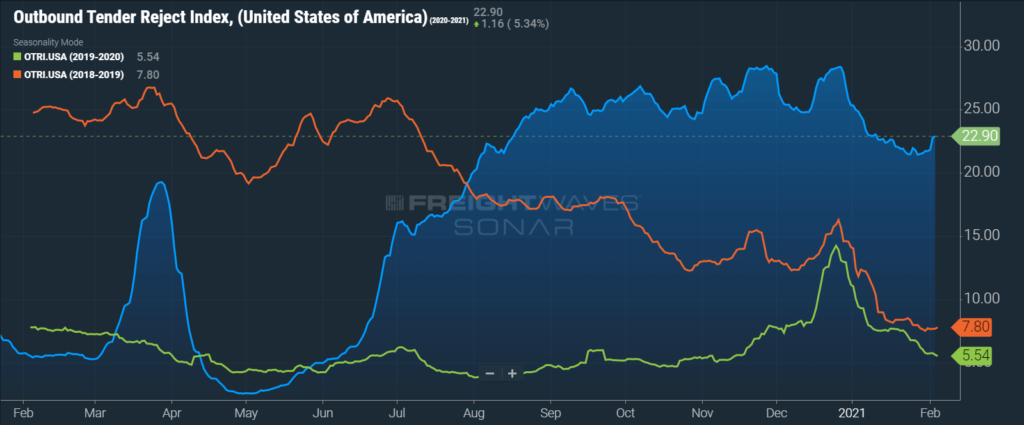
Sonar Outbound Tender Reject Index (OTRI) measures the rate at which carriers are rejecting the freight that they are contractually required to take. This index tends to follow the changes of spot freight activity — the higher the tender rejections, the higher the spot volumes. The trends seen in January are consistent with the fluctuations seen in spot volumes reported by the DAT and Truckstop, declining for the first three weeks, before spiking in the last week of the month. By this time last year, tender rejections had dropped by 61% from the high in late December. This year tender rejections have fallen by just 19% over the same time period, currently at 22.9%, but remain up by more than 300% year-over-year.
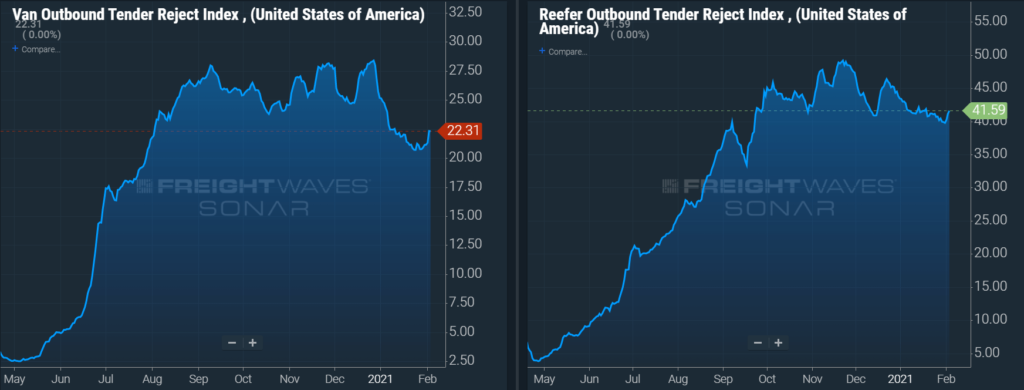
Dry van tender rejections currently sit at 22.31%, down about 11% from the beginning of the year and up about 330% year-over-year. Reefer tender rejections currently sit at 41.59%, down 4.2% from the beginning of the year and up 280% year-over-year.
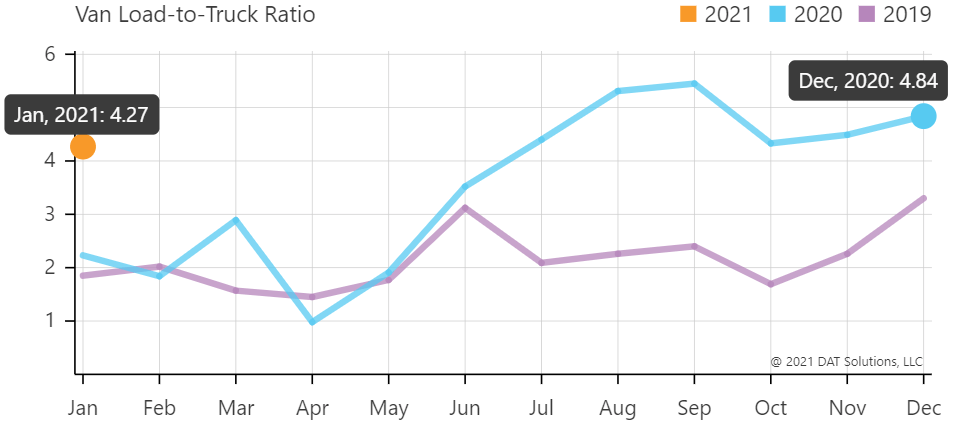
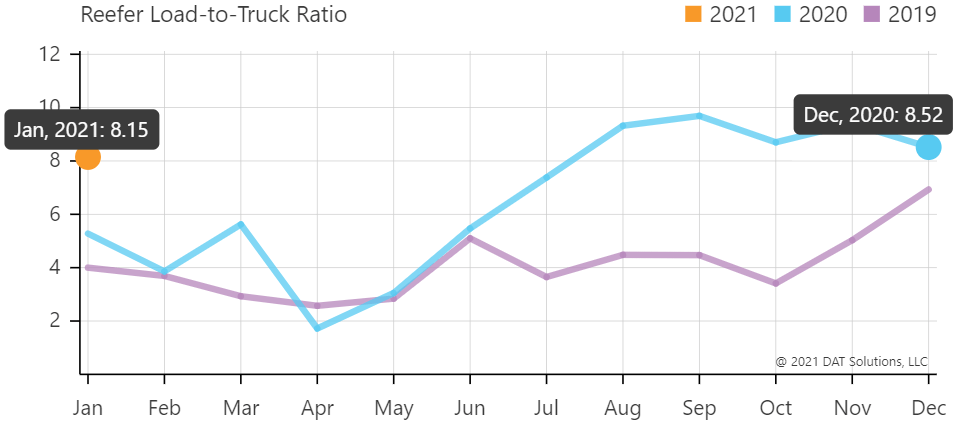
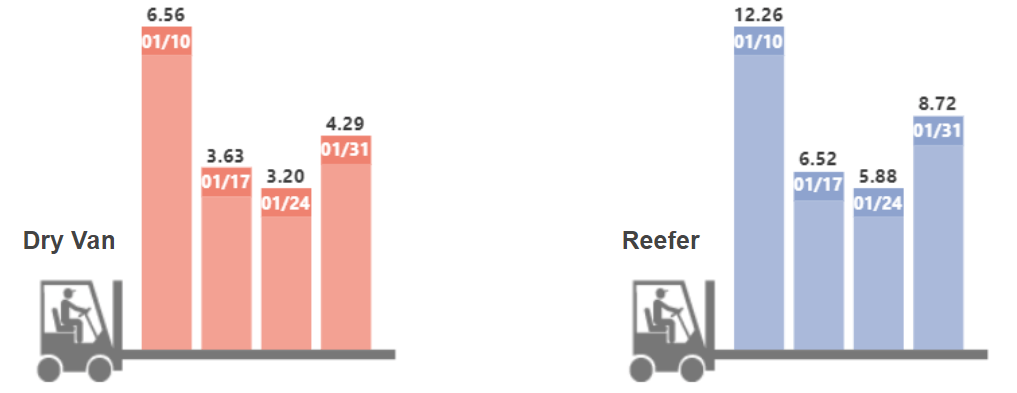
The DAT Load to Truck Ratio measures the total number of loads posted compared to the total number of trucks posted on their loadboard. In January, the Dry Van Load to Truck Ratio decreased slightly to 4.27, a decrease of 11.8% month-over-month, and an increase of 92.0% year-over-year. The Reefer Load to Truck Ratio fell to 8.15 in January, a decrease of 4.3% month-over-month, and an increase of 54.4% year-over-year. The weekly load to truck ratio trends followed the same pattern as tender rejections, providing further evidence of increased spot market tightness late in the month. We would normally expect both dry van and reefer ratios to be fairly flat from January to February as market conditions are usually similar. The biggest risk to this forecast continues to be weather related issues creating capacity constraints.
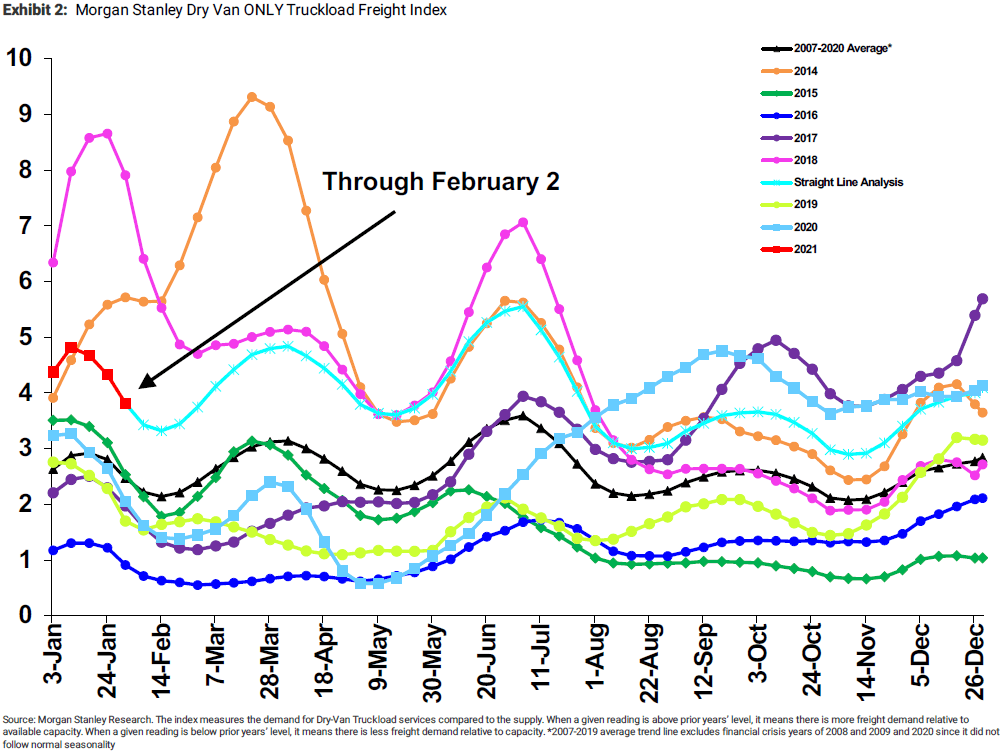
The Morgan Stanley Dry Van Freight Index is another measure of relative supply. The higher the index, the tighter the market conditions. The index indicates that the conditions are tighter at the start of the year than any year outside of 2018. Their forecast indicates that Q2 and Q3 will play out similar to 2018, before finishing the year off similar to 2020. This forecast is bullish and seems to indicate relatively flat growth between now and the end of the year.
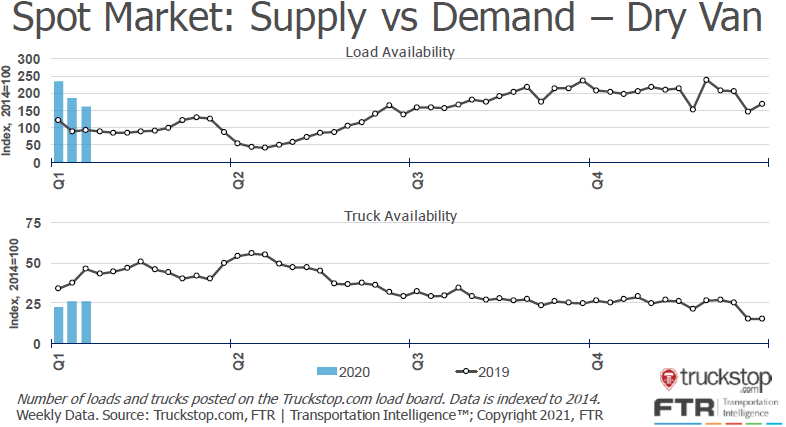
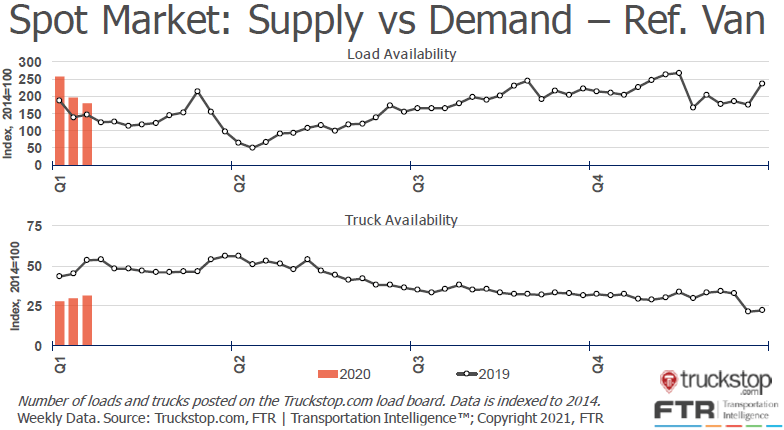
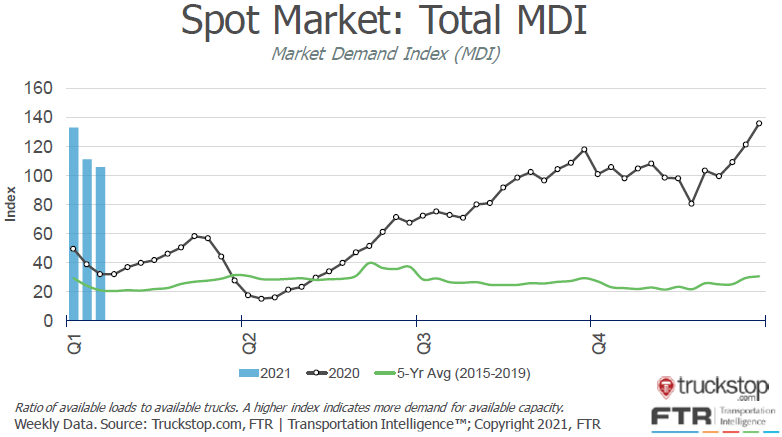
The Truckstop/FTR Market Demand Index measures the ratio of available loads to available trucks. In the first two sets of charts below, load and truck availability are plotted separately for both dry van and reefer freight. Load availability declined steadily but remained up year-over-year while truck availability increased slightly and remained down year-over-year for both equipment types. This imbalance is indicative of tighter market conditions as demand has remained elevated above supply. The result of these trends is a declining but elevated year-over-year.
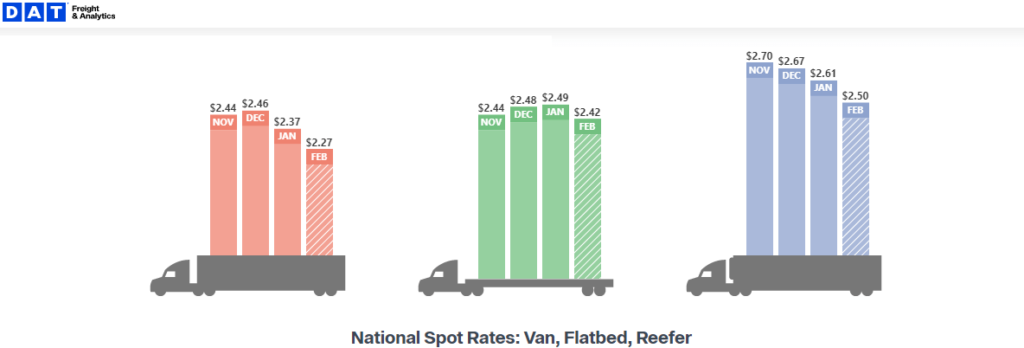
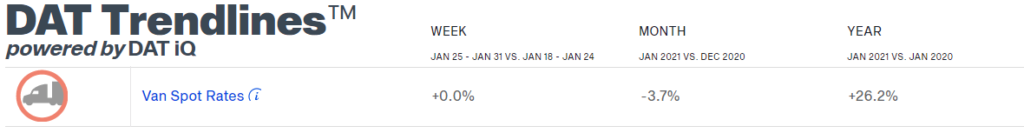
Van and reefer spot rates trended down in January as tender rejections and spot activity fell early in the month. Dry van spot rates decreased by 3.7% from $2.46 per mile in December to $2.37 in January. Contract rates have continued to climb, growing by another $0.03 per mile and bring the total increase to 20.3% from $1.97 to $2.37 since May 2020.
The dry van linehaul rate per mile of $2.37 for the month of January increased 26.2% year-over-year but represented the first all in spot rate decrease since May. This is a strong sign that the pandemic driven inflationary cycle may have finally run its course and that we may have seen an inflationary peak occur late in Q4-2020.
The Contract-Spot Van Rate Spread experienced a $0.54 swing during a seven month span, from $0.40 in April to -$0.14 in November. The Contract-Spot Van Rate Spread has declined for two straight months, resulting with spot and contract rates, excluding fuel, dead even in the month of January.
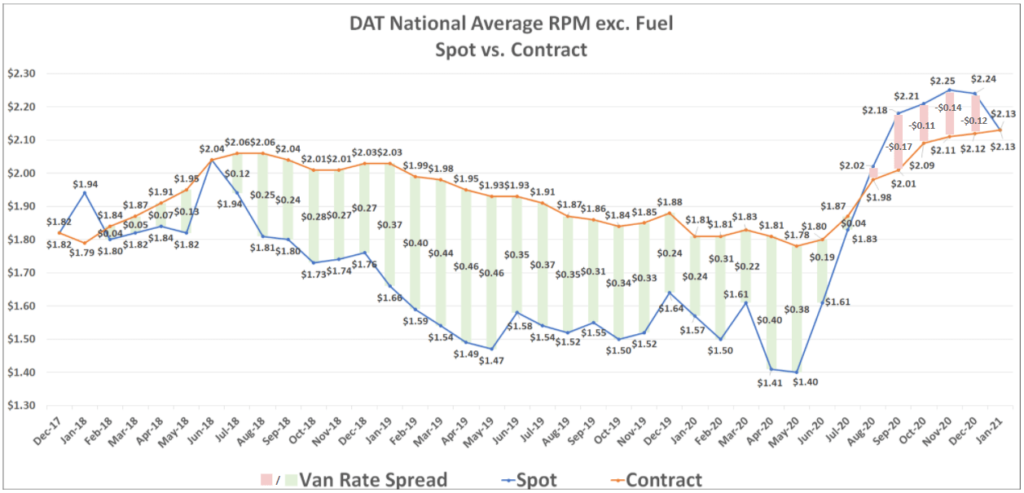
Spot and contract rates pulling even is a result of new contract rates starting to go live in the new year. Higher contract rates have led to greater levels of primary tender acceptance on new awards as carriers look to get off on the right foot servicing their customers while taking advantage of year-over-year rate increases. We are at a point with rates where carriers are comfortable sticking to their agreements. This led to less overall spot market activity and created advantageous conditions for shippers in the spot market. Suddenly, carriers had less options than they did throughout the second half of 2020, putting downward pressure on rates. Again, difficult weather conditions caused a slight reversal of this trend late in the month in January, but once these issues pass, rates should remain flat to down until demand picks up later in the second quarter.
Continued declines in spot rates throughout 2021 will depend largely on how quickly capacity can return to the market. In 2020, the market experienced increasing volumes paired with decreasing driver availability. One or both of these would need to trend in the opposite direction to drive a meaningful shift to softer market conditions.
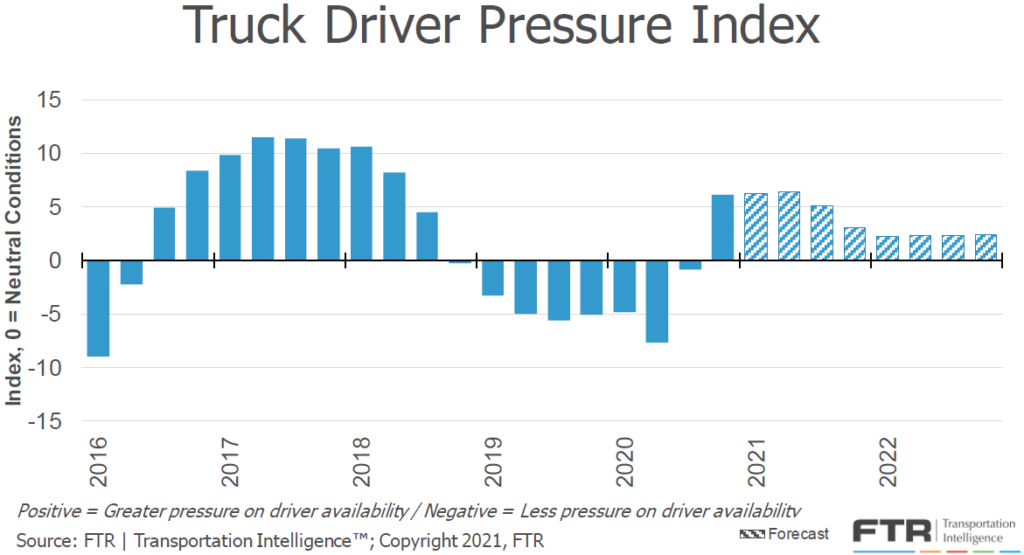
The growing disparity between driver supply and truckload demand resulted in increasing pressure on driver availability. The chart below shows FTR’s forecast for truck driver pressure peaking in Q2-2021 and remaining elevated through 2022. This supports the outlook that even though we may have seen the peak for spot rates, we could continue to see a lack of driver availability maintain upward pressure on rates through the first half of the year.
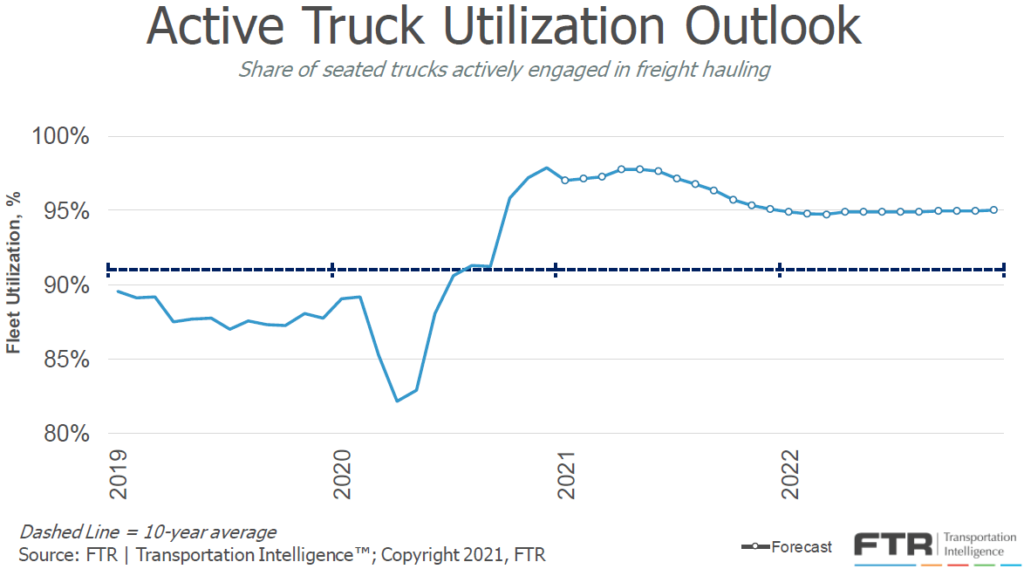
Active truck utilization, the share of seated trucks actively engaged in freight hauling, is now forecast to remain near 97% throughout the front half of 2021 before slightly easing late in the year. This forecast has strengthened based on an improved expectation for freight volumes to remain strong and driver supply to remain tight.
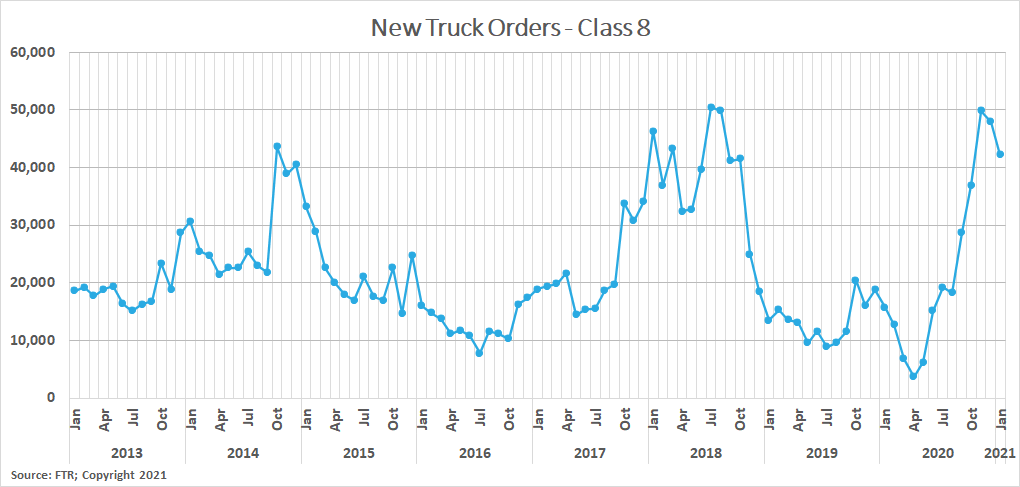
FTR is reporting that new truck orders were greater than 42,000 units in January, down 17% from December, but up 146% year-over-year. This would be the eighth highest single month total on record and well above the 20,000 units required to sustain current levels of capacity. The pullback is in line with the reduction in spot activity seen in January, but carriers continued to build the backlog of truck orders set for delivery in 2021. Driver availability will continue to be the biggest hurdle to overcome, but if carriers continue to add capacity at this rate, while maintaining utilization, we could see capacity conditions ease significantly.
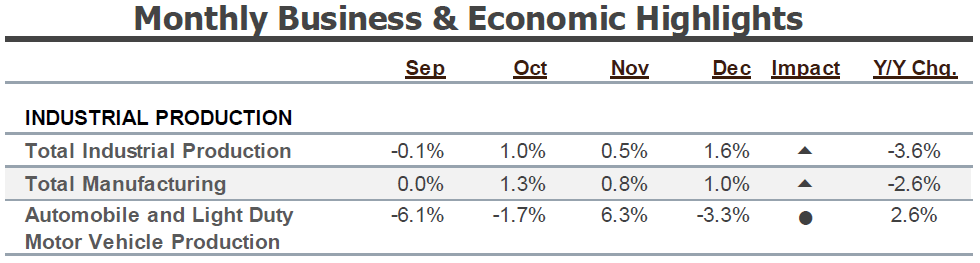
Industrial production remains an important metric to watch due to its relationship to domestic shipment volumes. Total industrial production is up 1.6% month-over-month in December but remains down by -3.6% year-over-year. The negative growth indicates that there is still room for growth as virus related lockdowns and labor shortages are relieved with the distribution of the vaccine in the first half of 2021.
FTR’s Truck Loadings Index for the full year 2020, finished the year down by -3.5% compared to 2019. Heavily weighted with industrials, this was on par with the -6.8% decline in industrial production for the full year 2020. Looking forward, FTR has only slightly increased their estimates for 2021. They are forecasting a 6.2% year-over-year increase in total truck loadings in 2021, up from 5.4% last month. More specifically, they expect freight volumes to experience sustained year-over-year inflationary levels by March and back to pre-pandemic levels by the third quarter.
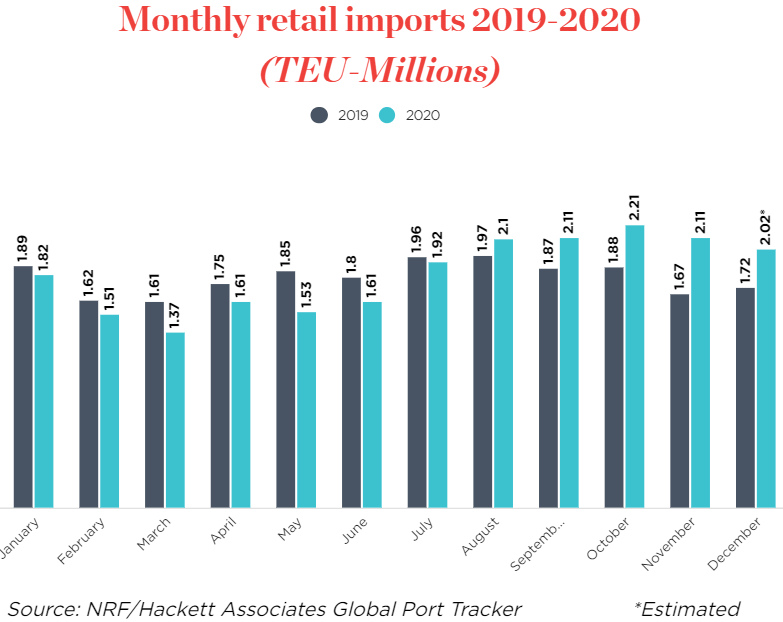
Inventory restocking is expected to be the other major driver of truckload demand in 2021. Final results are still being tallied, but 2020 is shaping up to have been a record year for imports and is expected to persist well into 2021.
Chinese New Year (CNY), which often results in a slowdown in freight demand, is set to begin on February 12th, eighteen days earlier than last year. Typically, holiday related production shutdowns in China result in a lull in imports a few weeks following the celebration. The annual slowdown associated with CNY is expected to be minimal in 2021, compared to years past, due to the backlog of container ships parked off the coast in Southern California. This backlog of more than 60 vessels should continue to provide a steady stream of freight, keeping truckload demand high in the region. The backlog has been driven by labor shortages due to a COVID outbreak among dock workers. If the COVID outbreak subsides and allows for port activity to return to normal levels, we could see a sudden increase in truckload demand, resulting in elevated rates outbound from the Los Angeles market area.
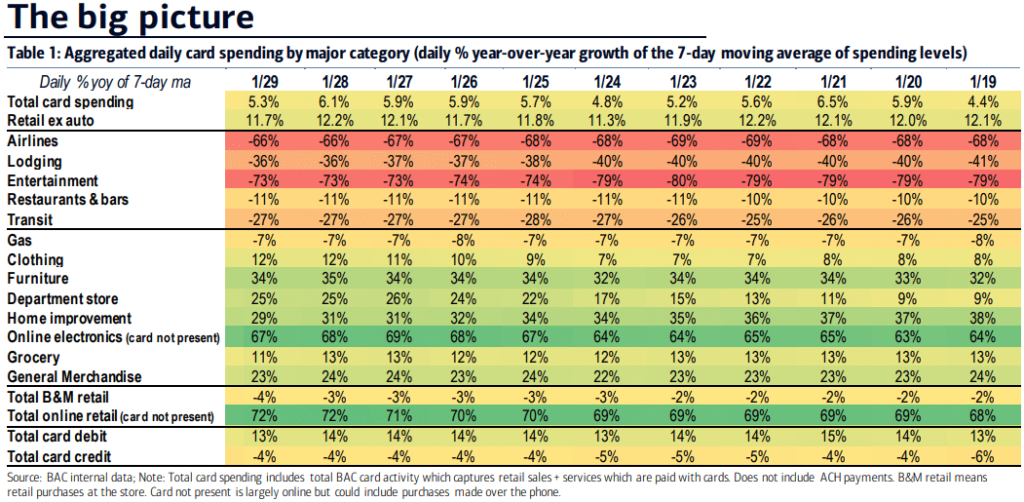
Over the past year, changes in consumer spending habits as a result of government stimulus and changes to everyday life, such as working from home, have had a pronounced impact on supply chains and truckload demand. The Bank of America (BofA) consumer spending data provides visibility into these changing consumer behaviors spending patterns.
When looking at aggregated daily card spending by major category, total card spending is up 5.3% year-over-year for the 7-day period ending January 29th. We continue to see strong year-over-year growth in spending on durable goods and online retail and reduced spending on services such as travel, entertainment and spending at brick and mortar stores.
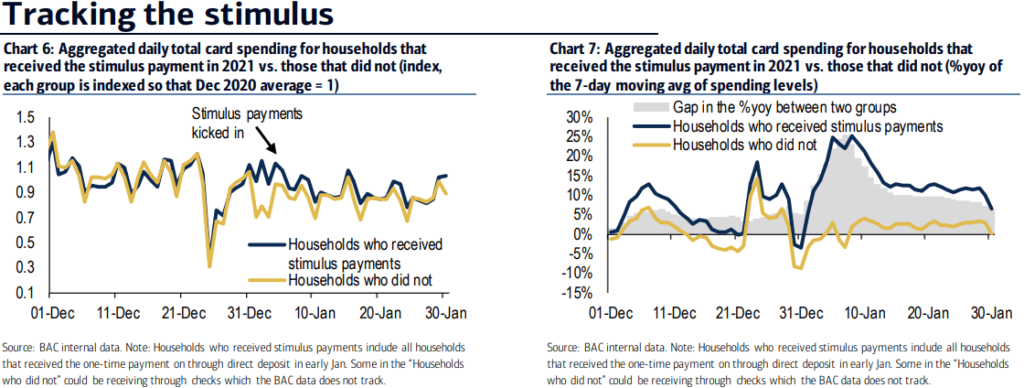
The impact from the stimulus distributed in the first week of January has already begun to fade. There was a noticeable increase in spending for those who received the payments, but the gap between the those who had and had not received the payments, has diminished greatly.
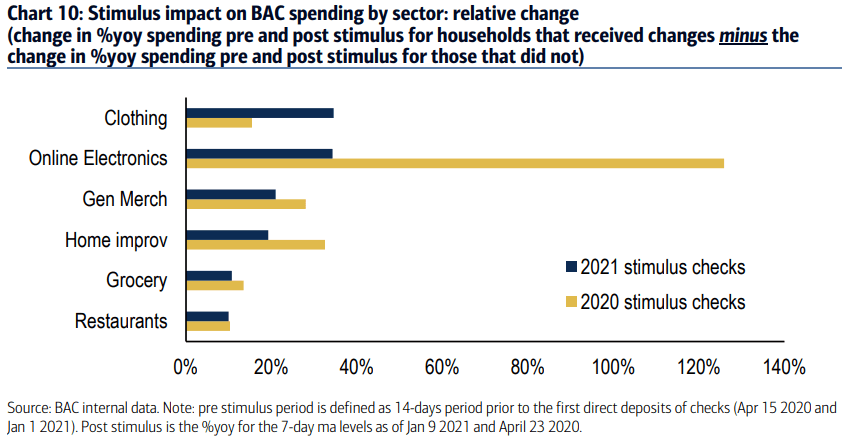
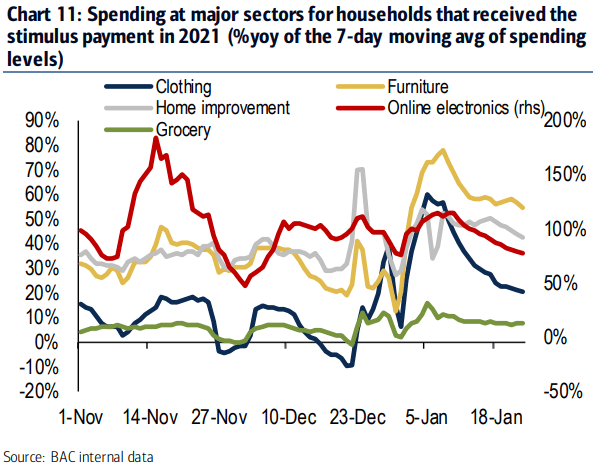
One of the main reasons the boost to spending faded so quickly is due to the speed at which those who received the payments spent the money. Charts 10 and 11 below illustrate the increased marginal propensity to consume from the stimulus payments in 2021, compared to the payments made in 2020. It’s estimated that 18.6% of the January stimulus payments were spent by January 30th, compared to just 13% over the first 30 days of the April 2020 stimulus.
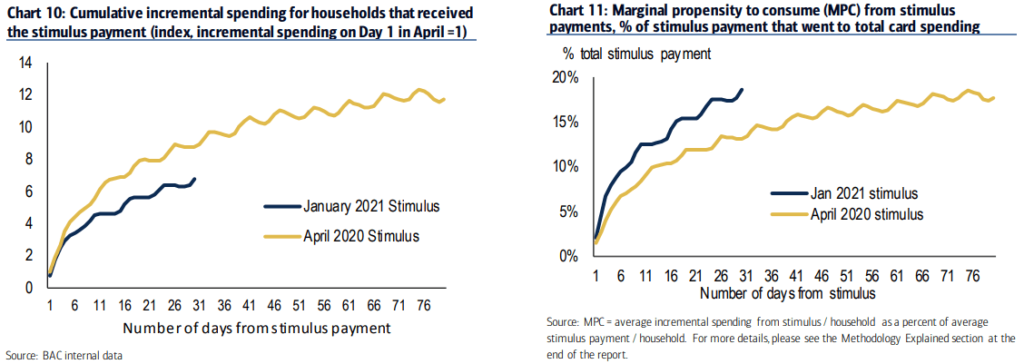
The makeup of what consumers spent the funds on was different as well, suggesting that some categorical saturation has occurred. The charts below illustrate that spending on online electronics saw a large decrease for the January stimulus compared to April stimulus. Similar to the decline seen in online electronics spending, it is uncertain whether a pull-forward in demand will be exposed in other categories as future stimulus payments are distributed. There are only so many couches and TV’s that people will buy. Although there is reason to believe people will spend stimulus money they receive, future stimulus payments may not drive as much freight activity as seen over the past year.
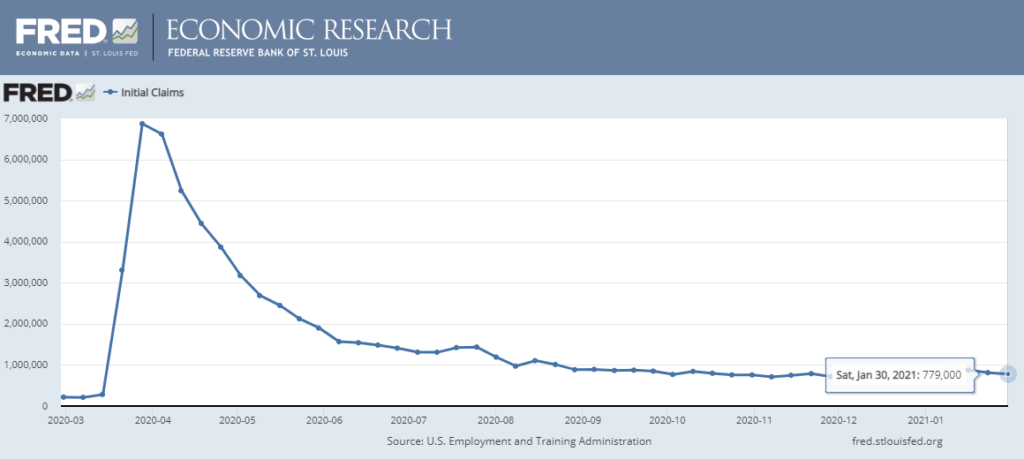
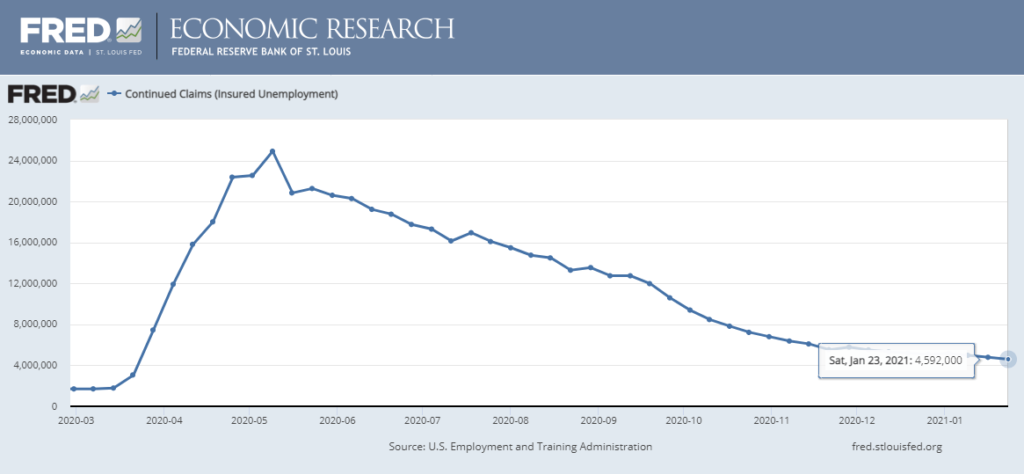
The unemployment trends continue to be concerning, improving only slightly throughout January and continuing on their flat trend over the past few months. Initial claims in the most recent week came in at 779,000, and continued claims are more than 4.5 million on a weekly basis.
Carrier pricing power was on full display in March as contract rates climbed at an unprecedented rate throughout the month. The winter storms in mid February exposed just how insufficient supply is to support truckload demand, and carriers have responded by demanding a premium on their committed capacity.
Unfortunately for shippers, there does not appear to be much relief in sight. Our research indicates that there will continue to be greater upside risk to demand as we move into the second quarter. Spring produce season is just getting underway, the backlog at the port of Los Angeles and Long Beach should support healthy demand outbound from port cities on the East, Gulf and West Coast ports through at least the third quarter, and the third round of government stimulus is generating increased economic activity and consumer spending that will result in an additional boost to truckload demand.
On the supply side, there is no indication that carriers will be able to add capacity quickly enough to support the surge in demand in the near term. Both driver availability and delays in new truck delivery timelines remain the biggest challenges to carriers’ ability to do so. Driver availability should improve as the vaccine rollout enables driver schools to increase throughput, but the delays in new truck production will limit the rate that capacity is added.
As a result, our forecast for the remainder of the year remains consistent. Rates will likely remain at or near all-time highs through at least the second quarter, with the possibility of easing market conditions in the back half of the year as drivers and new equipment begin to enter the market.