


Though trucking activity typically increases in March, all signs point to relatively stable demand month-over-month. A muted early produce season and single-family home construction slowdown are two likely culprits in driving accepted contractual tenders down 1.8% in early April from where they were a month ago.
The FreightWaves SONAR Outbound Tender Volume Index (OTVI), which measures contract tender volumes across all modes, was down 22% year-over-year, or 13% when measuring accepted volumes after the significant decline in tender rejection rates. The significant decline is still inconsistent with other sources. Though unconfirmed by FreightWaves, their data is likely skewed heavily toward retail freight, for which demand has slowed substantially since Q4 2021. If true, this would help explain the significant volume drop.
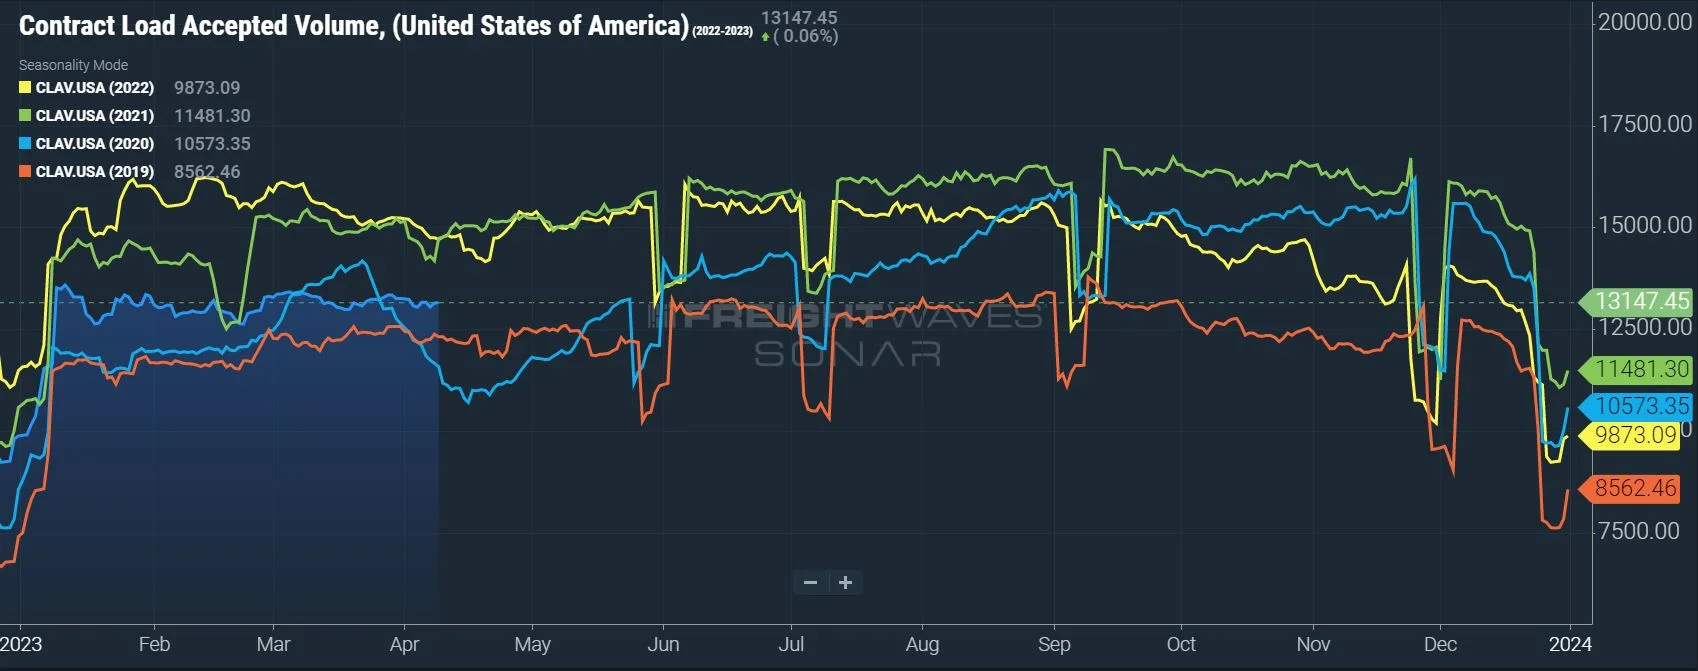 Figure 1: Contract Load Accepted Volume (SONAR): Accepted contract volumes were down 13% y/y in early March but remained above historical pre-pandemic levels.
The contract versus spot market story stayed mostly consistent in March. Shippers still heavily favored contractual freight, but there was a meaningful pickup in spot activity. Though DAT data showed spot volumes were down nearly 70% year-over-year, the 8.6% month-over-month growth in March aligns with typical seasonality heading into the final month of the first quarter.
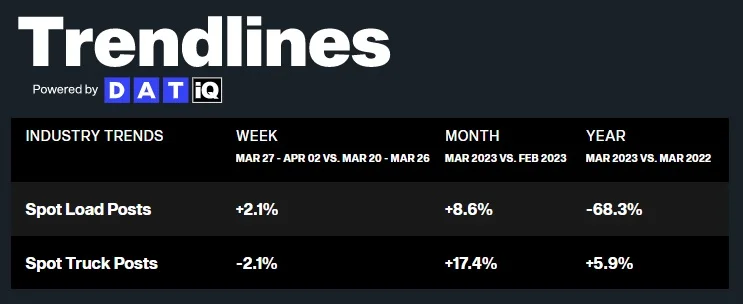 Figure 2: DAT Trendlines: Industry Trends, Spot Load Posts vs. Spot Truck Posts
Despite the spot activity uptick, March made clear that capacity is and will likely continue to be abundant in the market in the coming months. Tender acceptance improved from already historically high levels, indicating carriers continue to show a strong interest in and ability to support current contractual freight demand.
The Sonar Outbound Tender Reject Index (OTRI) measures the rate at which carriers reject the freight they are contractually required to take. The month-over-month rate remained relatively flat, decreasing from 3.5% in early March to 2.87% in early April, meaning good routing guide compliance on contractual freight continued for shippers. Meanwhile, reefer tender rejections aligned with van rejections, easing throughout the month.
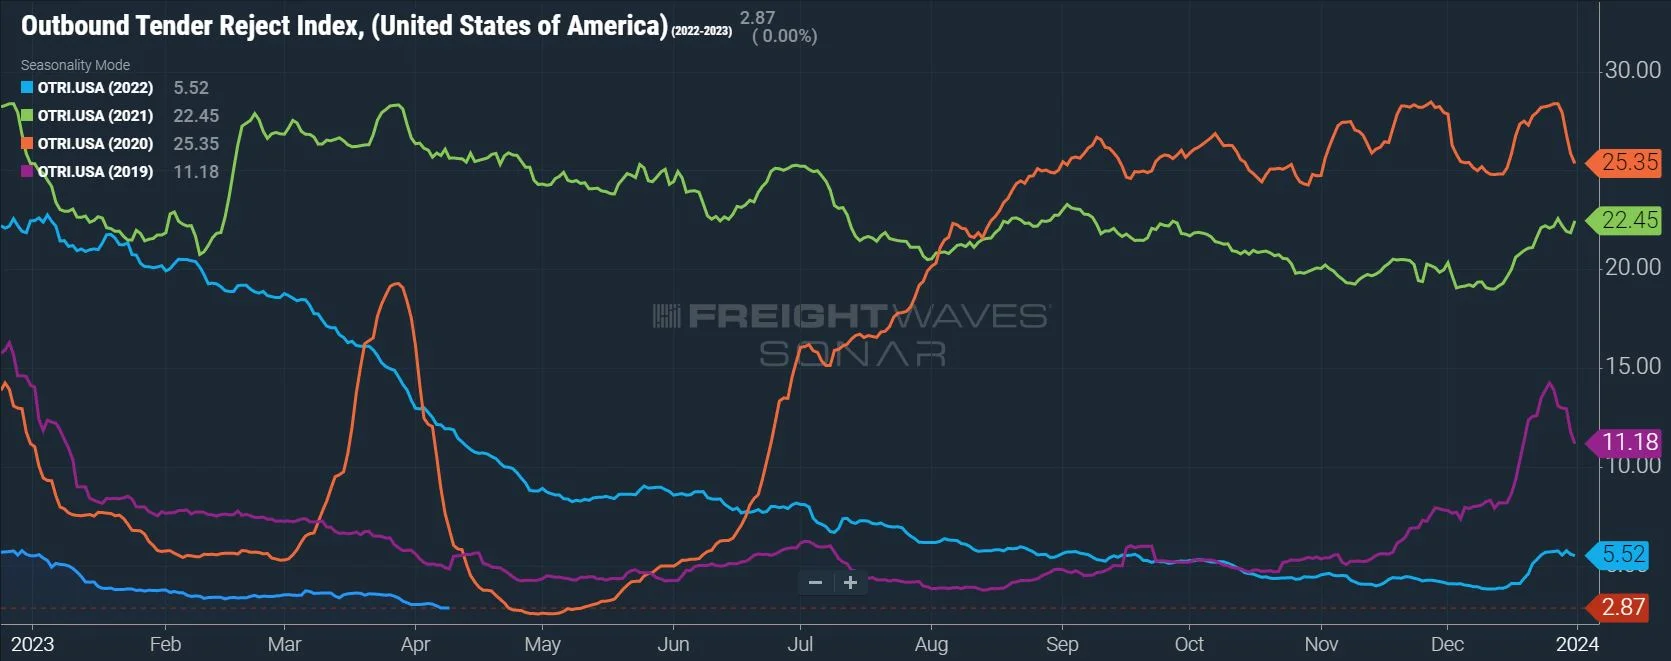 Figure 3: Outbound Tender Reject Index (SONAR): OTRI remains at an all-time low for this time of year and has fallen to below 3% for the second time, approaching the lows seen in the lockdowns in the early days of COVID — a sign capacity is sufficient to support demand and carriers are protecting their contract freight.
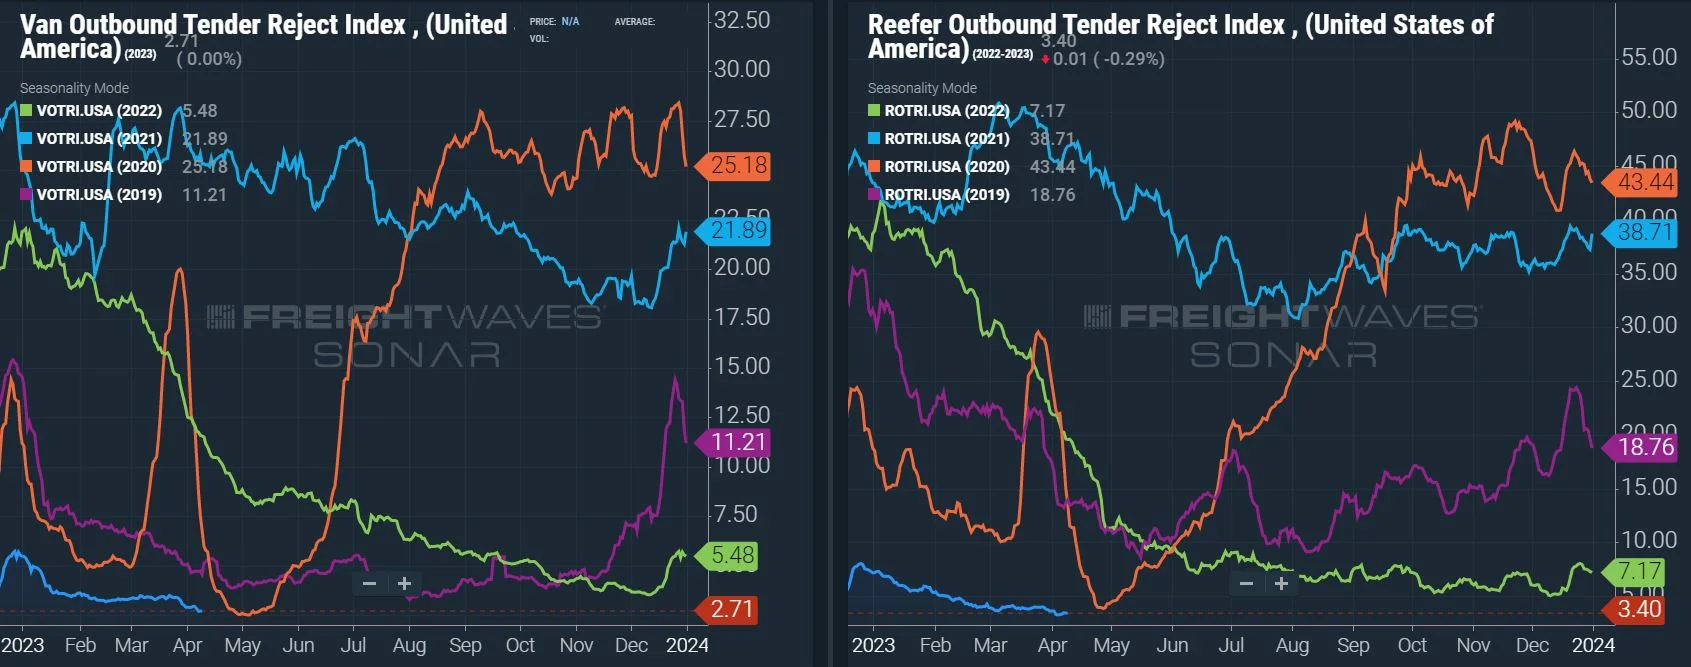 Figures 4 & 5: Van & Reefer Outbound Tender Reject Indices (SONAR): Dry van and reefer tender rejections are trending at all-time lows for this time of year, with dry van rejection rates at 2.71% and reefer rejections at 3.4%.
The DAT Load-to-Truck Ratio measures the total number of loads relative to the total number of trucks posted on their spot load board. March data was inconsistent with typical seasonal pressures: The Dry Van Load-to-Truck Ratio was down 18.8% month-over-month and 55% year-over-year, and the Reefer Load-to-Truck Ratio was down 21.1% month-over-month and 63.8% year-over-year.
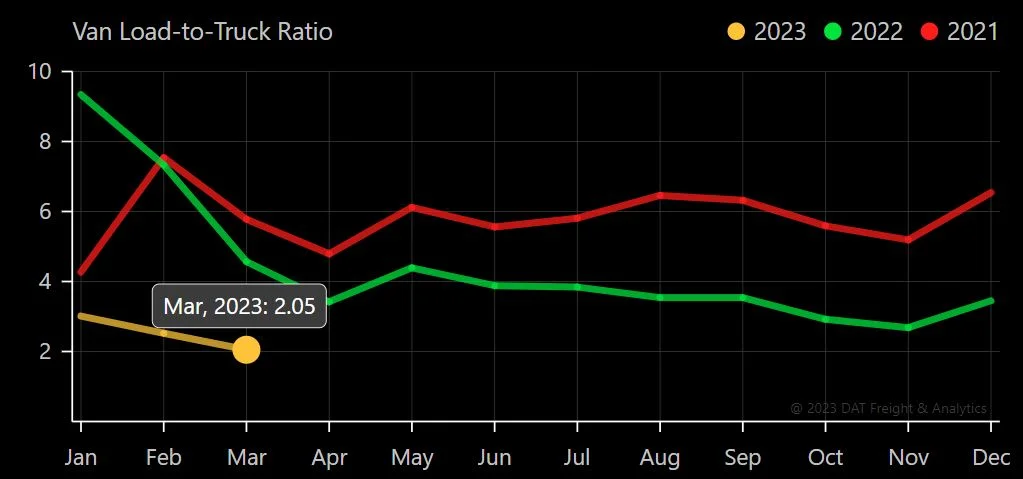 Figure 6: DAT Van Load-to-Truck Ratio
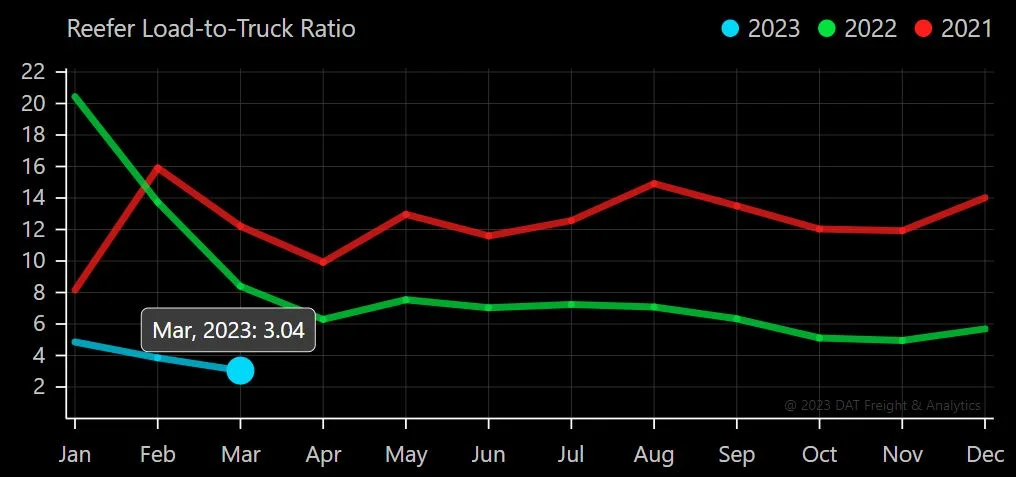 Figure 7: DAT Reefer Load-to-Truck Ratio
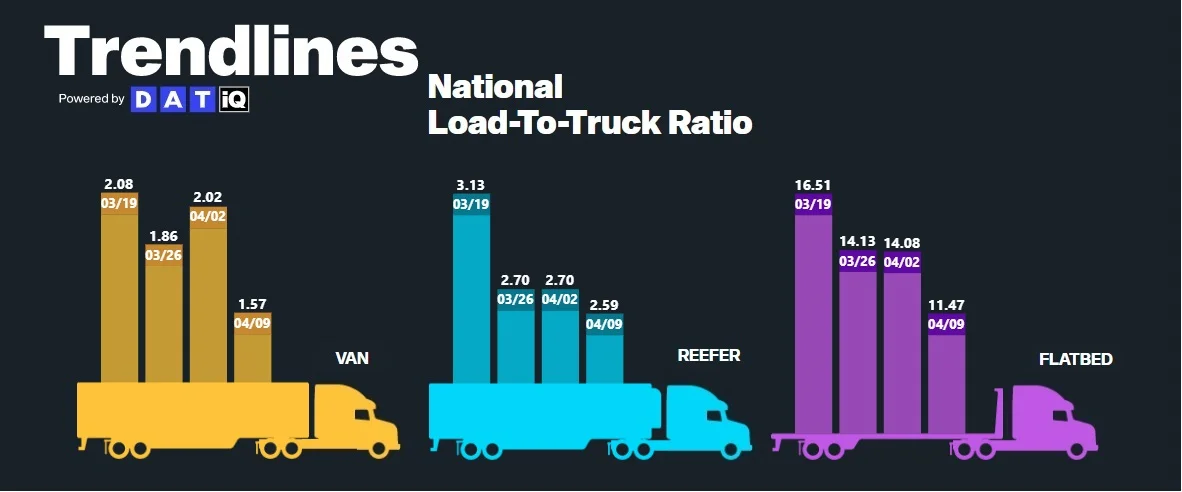 Figure 8: DAT Trendlines, National Load-to-Truck Ratio: Weekly Load to Truck Ratio trends across all modes showed easing conditions into the second week of April.
The Morgan Stanley Dry Van Freight Index is another measure of relative supply; the higher the index, the tighter the market conditions. The black line with triangle markers on the chart provides a great view of what directional trends would be in line with normal seasonality based on historical data dating back to 2007.
Similar to other truckload supply measures, normal seasonal trends typically indicate increasing tightness at this time. The data, however, illustrated flat to decreasing tightness as the month progressed; this mirrors tender rejection and load-to-truck data and provides further evidence that capacity is abundant relative to demand. Normal seasonality would lead us to believe that conditions could soften further in April before the summer peak season leads to some increased pressure in mid to late May.
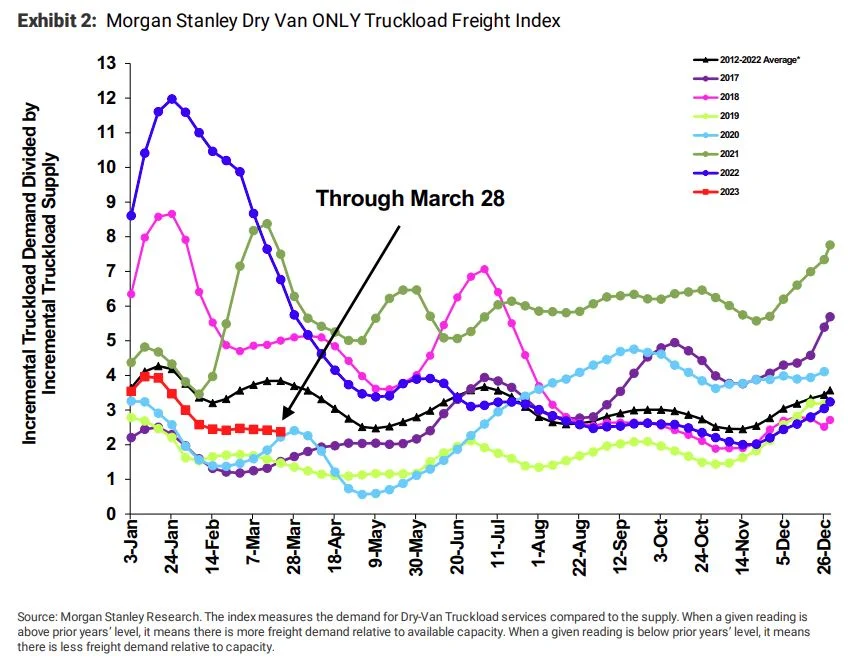 Figure 9: Morgan Stanley Dry Van Only Truckload Freight Index
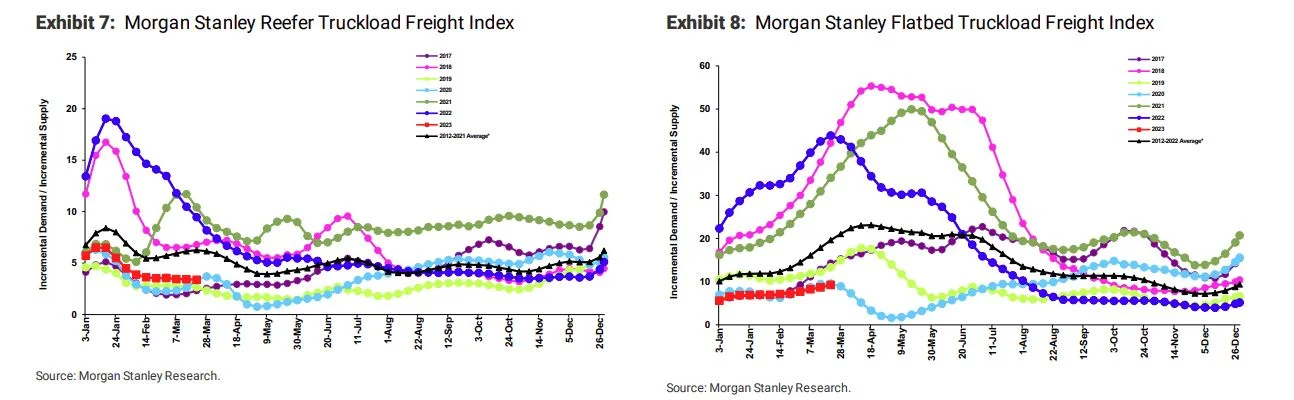 Figures 10 & 11: Morgan Stanley Reefer & Flatbed Truckload Freight Indices
Spot rates tend to move in line with load-to-truck ratios and other relative truckload supply measures, so it is no surprise to see downward trends for van and reefer spot rates throughout March. According to Truckstop and FTR, Weekly Dry Van Spot Rates have fallen for five straight and 10 of the last 13 weeks since the beginning of the year. With normal seasonality pointing to even softer conditions ahead in April, some room is likely left before spot rates bottom out. Shippers are still in a great position to lock in low contract rates as we approach the floor.
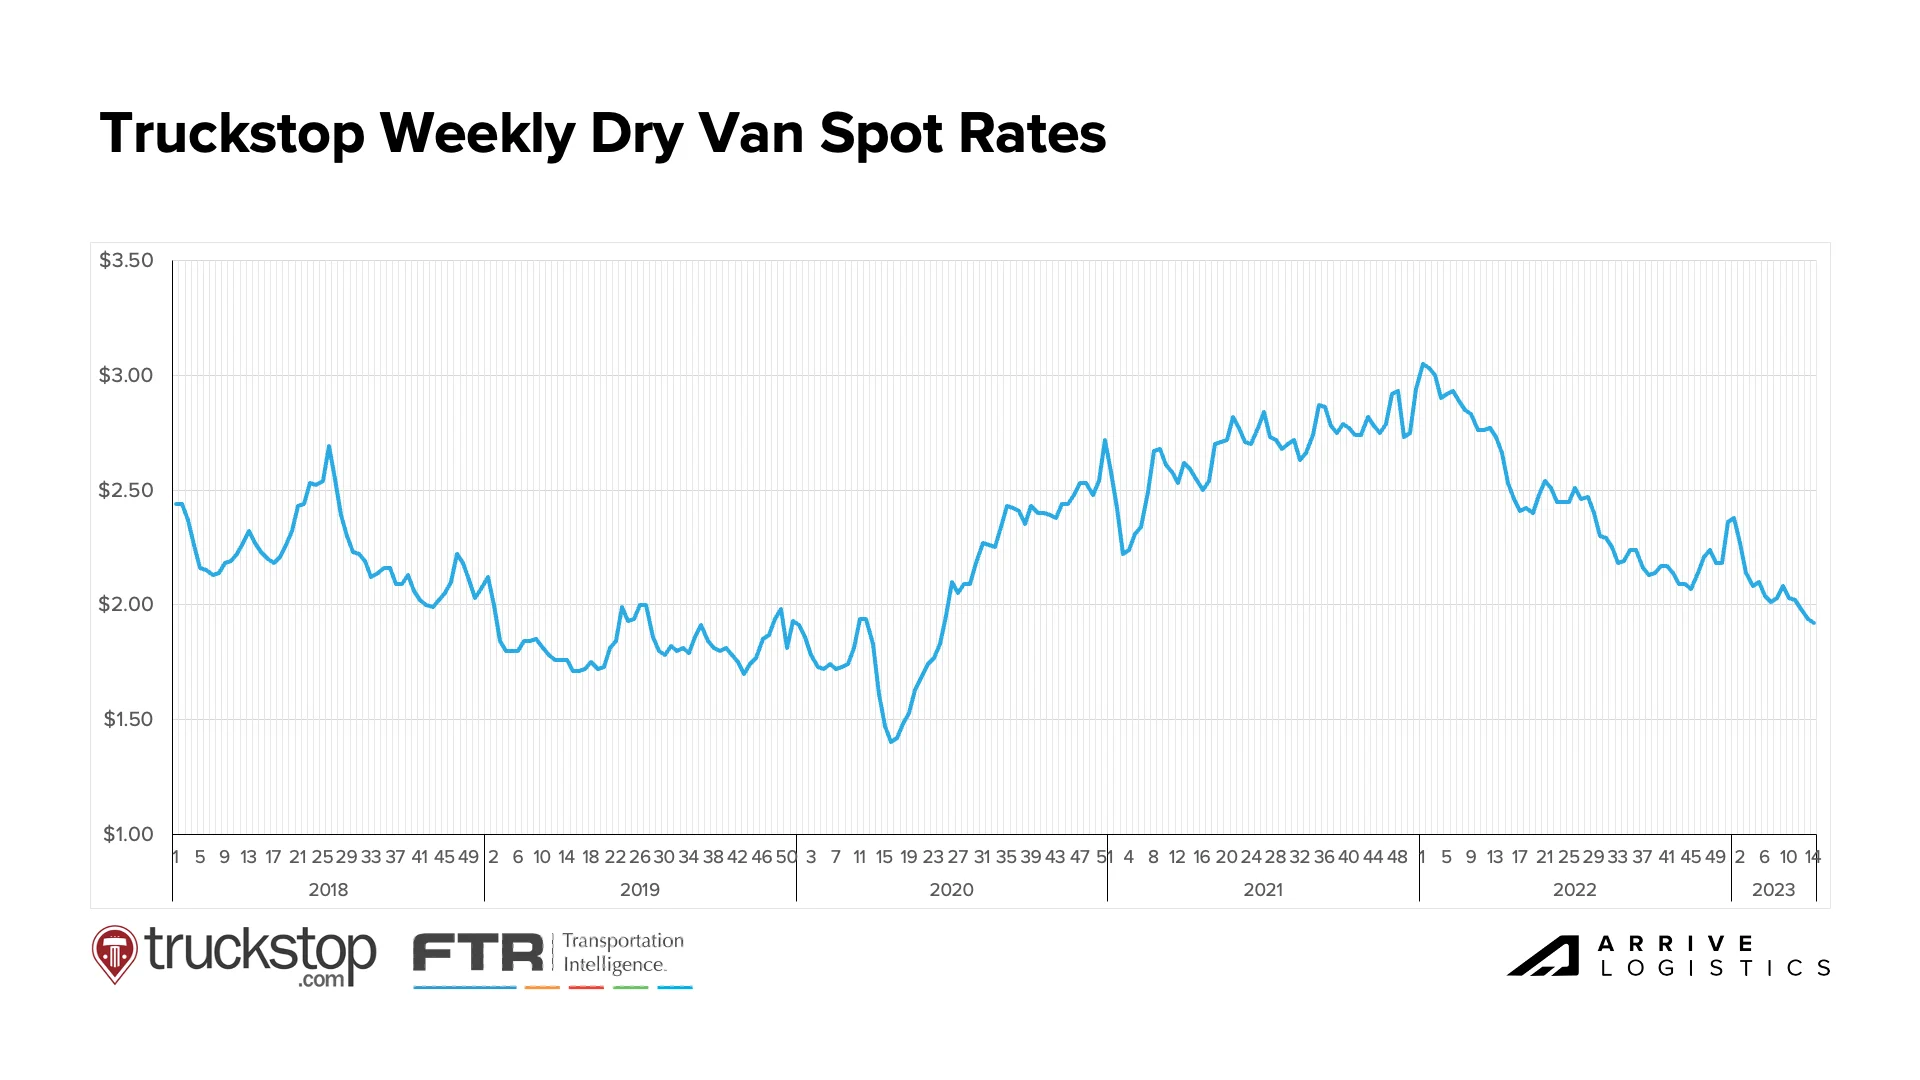 Figure 12: Truckstop & FTR: Weekly Dry Van Spot Rates
According to DAT, all-in spot rates, including linehaul and fuel costs, are down across all three equipment types. As of April 9th, van and reefer equipment rates have fallen by $0.05 from March, while flatbed rates are down just $0.01 per mile.
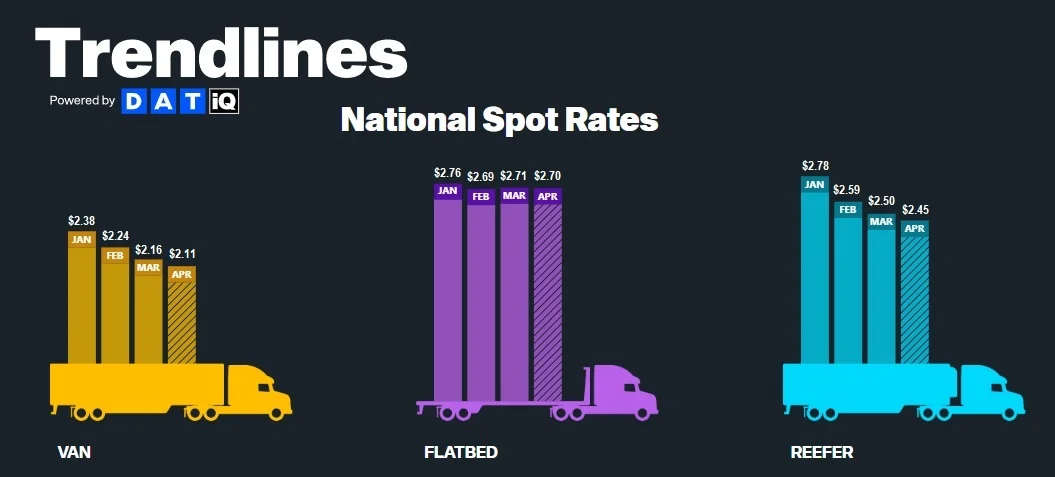 Figure 13: DAT Trendlines, National Spot Rates
Early April linehaul data shows van and reefer spot rates trending downward while flatbed spot rates are rising. Reefer contract rates are the only equipment type seeing increases so far month to date, as both van and flatbed contract rates show relatively flat growth on a month-over-month basis.
The van rate spread increased month-over-month to $0.63 between spot and contract. As a result, downward pressure on contract rates should continue for the foreseeable future, even if the market experiences some seasonal pressures in the back half of the second quarter.
All-in dry van spot rates are down 23.8% year-over-year, while linehaul spot rates are down 23.5%. All-in dry van contract rates are down 15.4% year-over-year, and linehaul contract rates are down 13.1%.
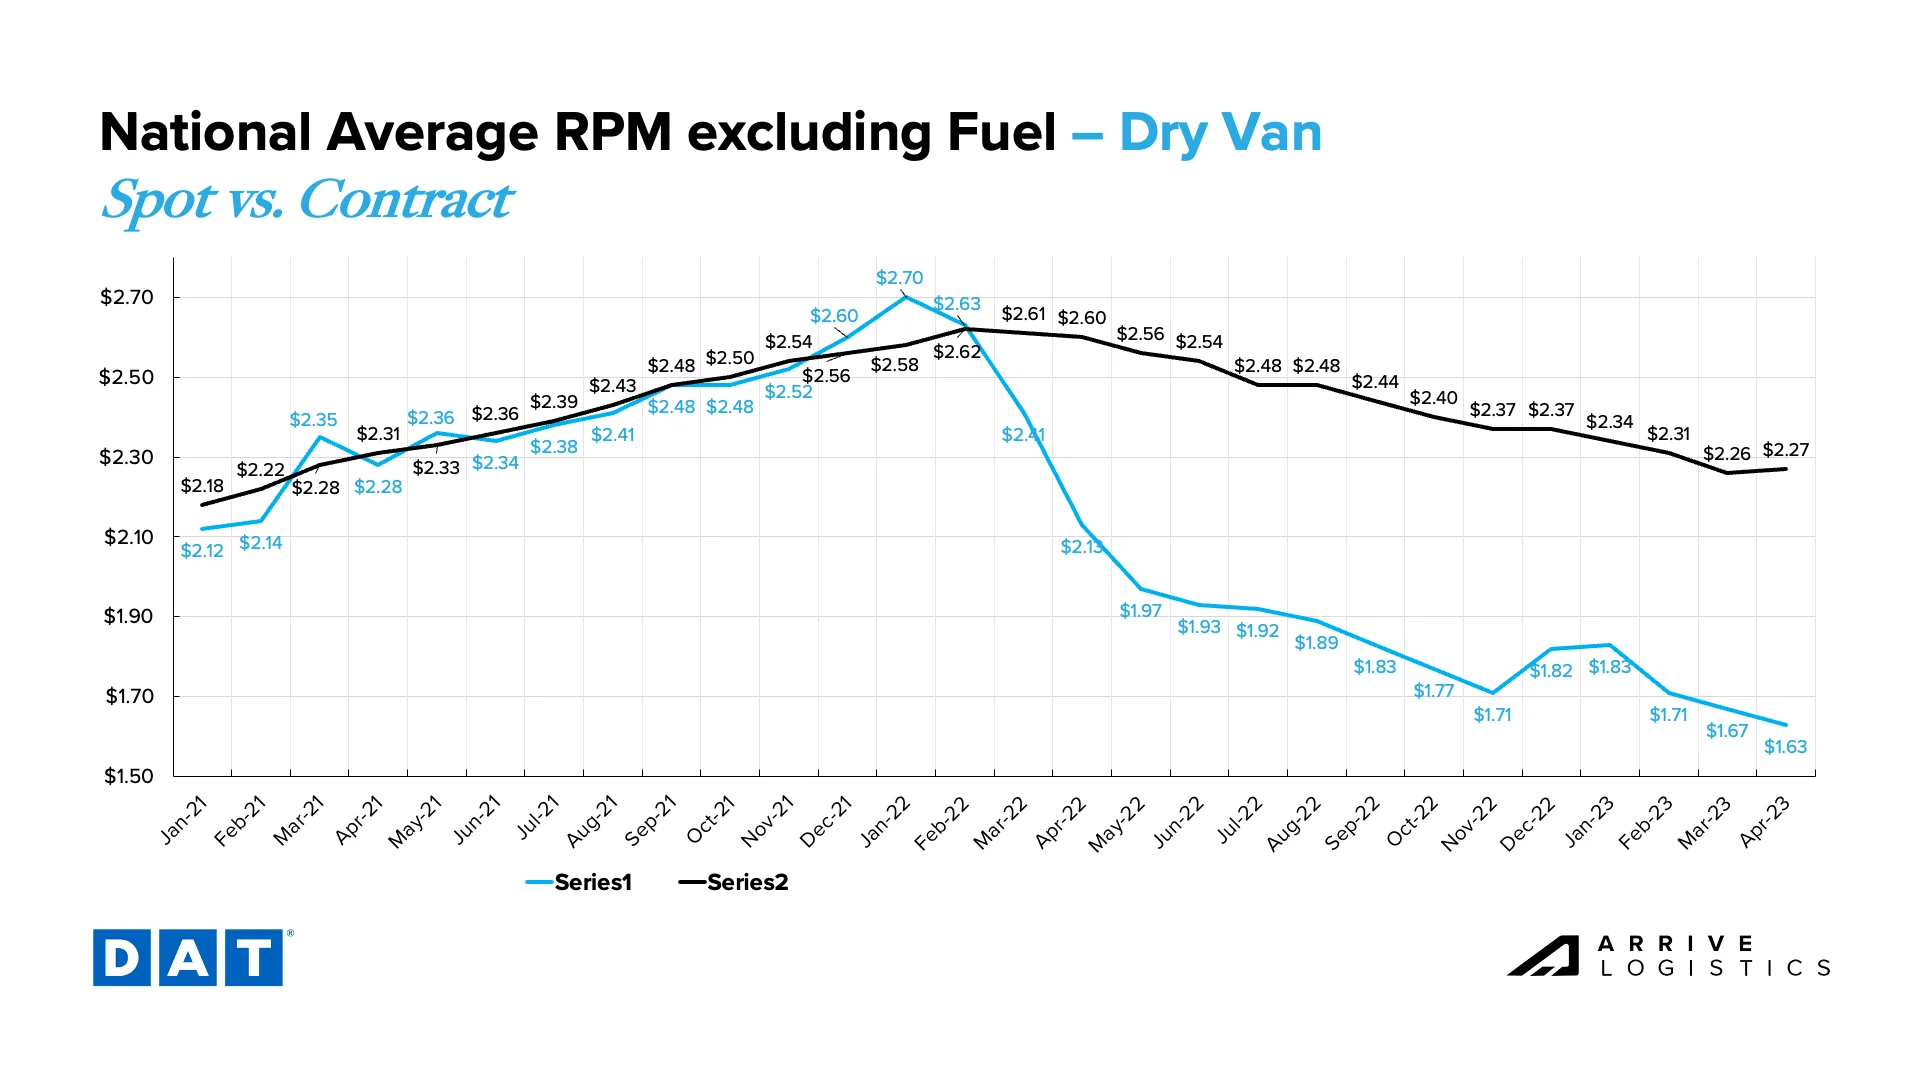 Figure 14: DAT National Average RPM, Dry Van, Spot vs. Contract: Van spot rates have continued trending downward in early April, indicating that the market remains oversupplied with capacity. Contract rates are stable early in the month.
Reefer spot linehaul rates are following the same pattern as van rates early in the month, while contract rates are showing their first potential increase in nearly a year. It will be a surprise if those contract increases are realized, as spot rates hitting their floor is typically a prerequisite to a shift in the directional trend of contract rates — especially with the reefer spot-to-contract rate spread of $0.60 per mile. We believe increased demand ahead of Easter is driving this trend, and by the end of the month, contract rates will show a decline from March.
Down 8.3% year-over-year, the current reefer contract rate is $2.53 per mile, excluding fuel, while the current reefer spot rate is down 20.6% year-over-year to $1.93 per mile, excluding fuel. This is a significant decline but slightly less dramatic than the 29% plummet in March, indicating we have likely passed peak year-over-year deflationary pressures.
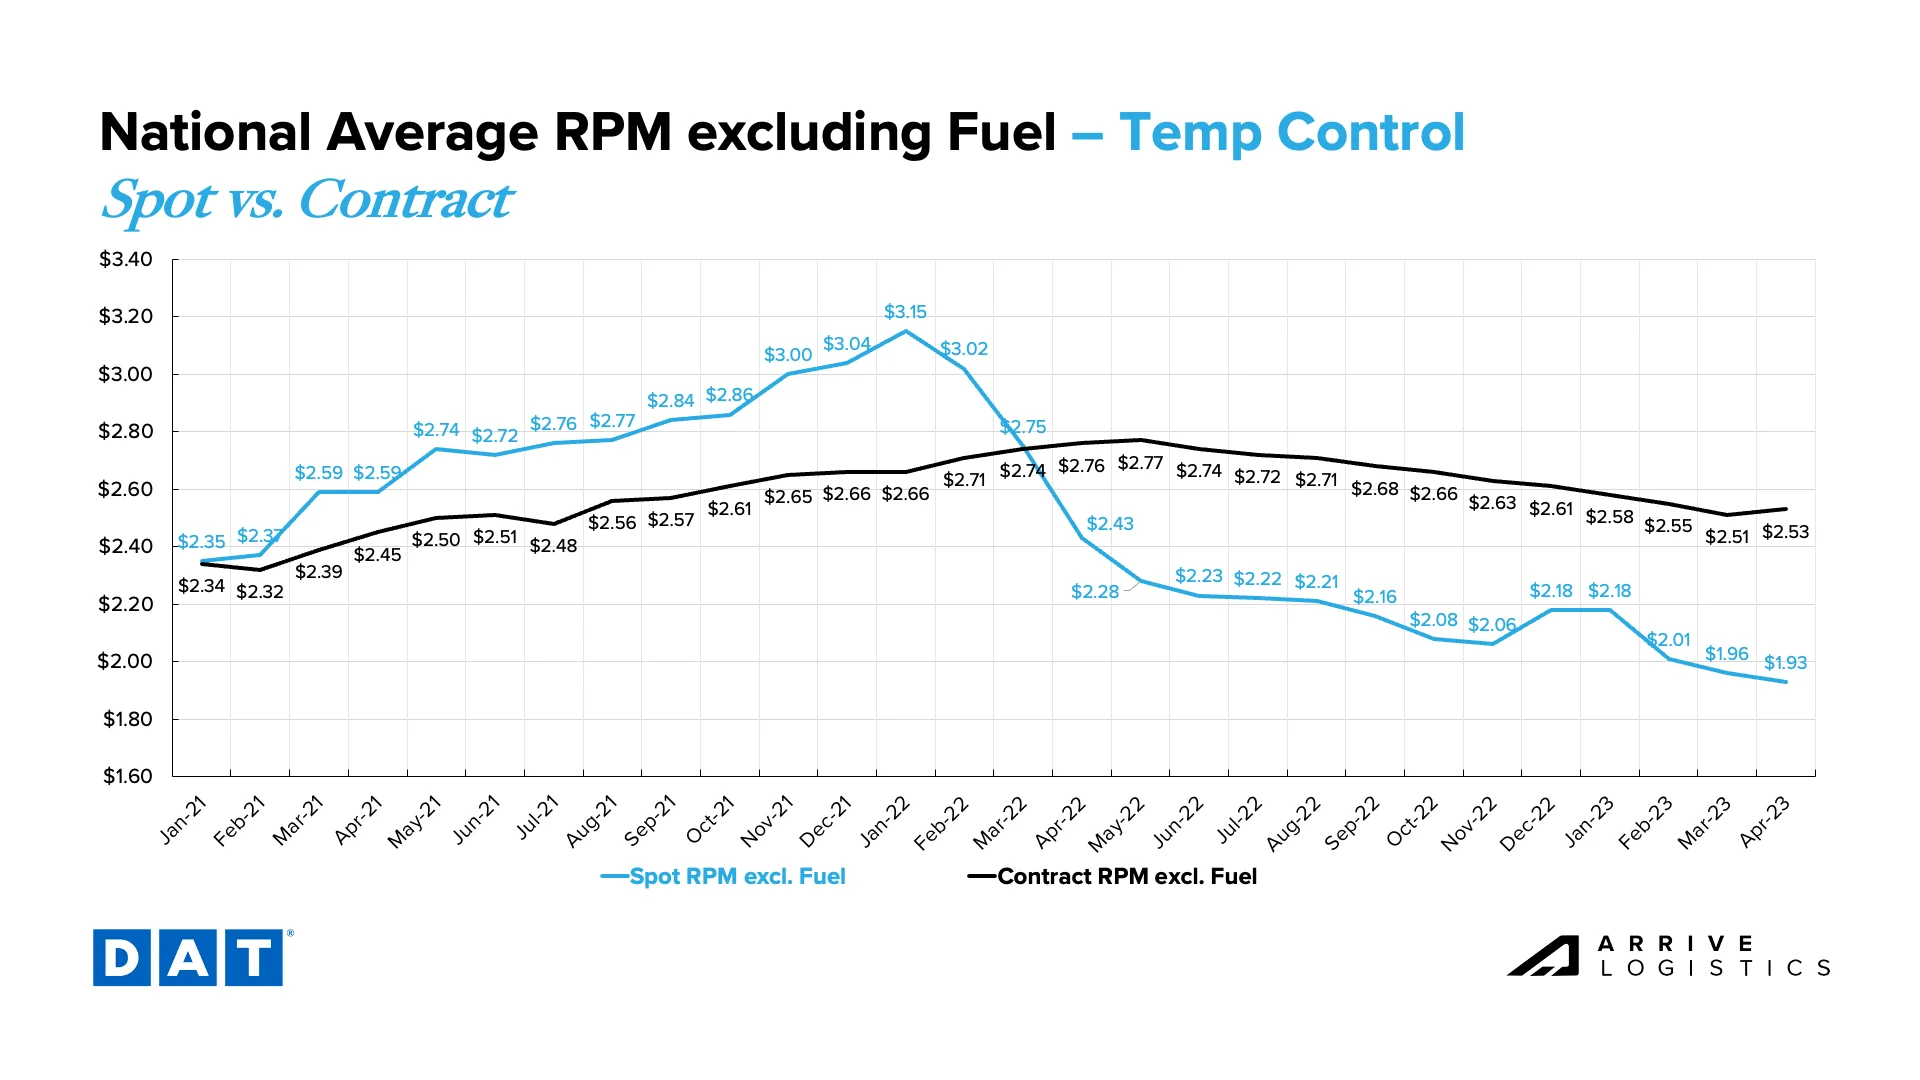 Figure 15: DAT National Average RPM, Temp Control, Spot vs. Contract
Thanks partly to the return of warm weather and the onset of construction season in the South, spot flatbed rates had another meaningful month-over-month increase, while contract rates took a step back from a slight pickup in March. Spot rates landed at $2.13 and contract at $2.77, excluding fuel.
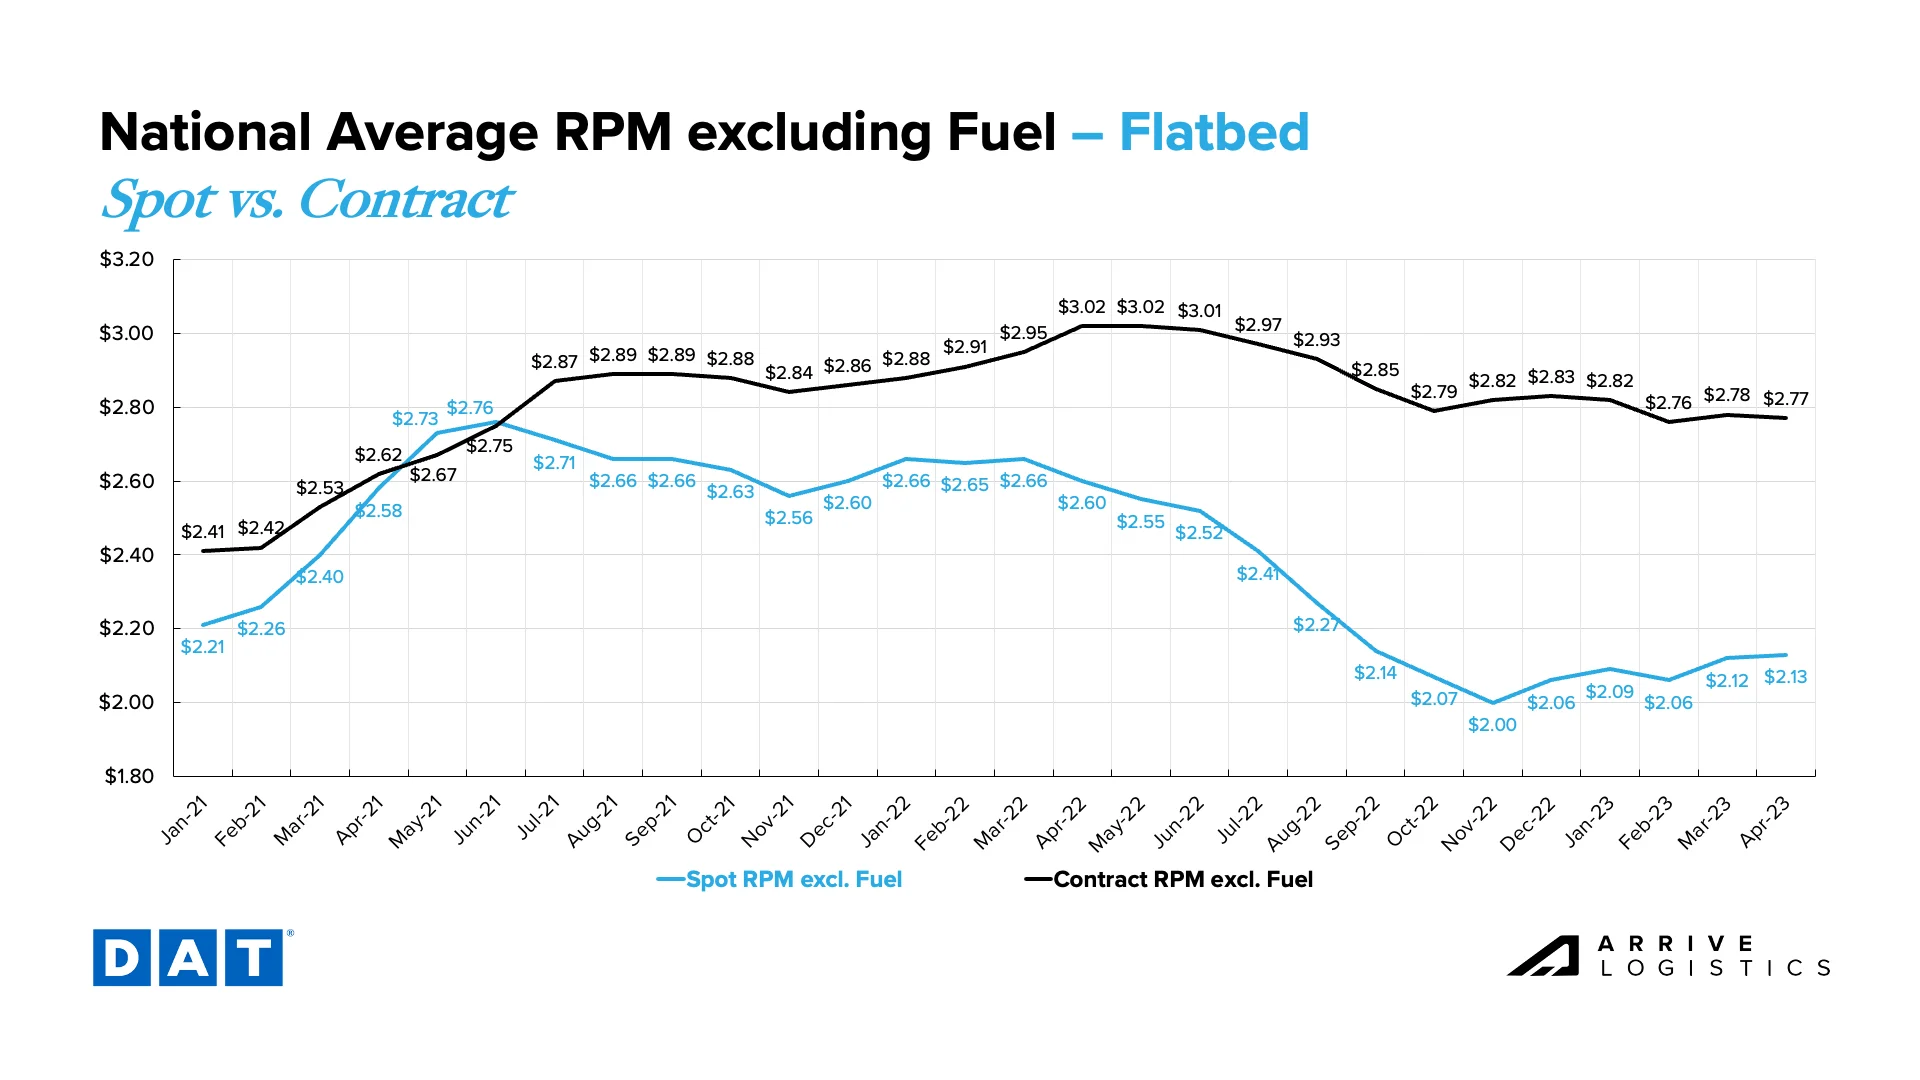 Figure 16: DAT National Average RPM, Flatbed, Spot vs. Contract
Easing demand will likely lead to a persistent oversupply of capacity in the market, resulting in ongoing capacity normalization. Carriers in the spot market are still facing poor conditions; FTR has yet to release data for March as of April 9th, but we anticipate revocations of trucking authority will remain at or near historically high levels. Some revocations may be owner-operators taking company jobs with larger asset carriers, while others are carriers opting out of the market altogether.
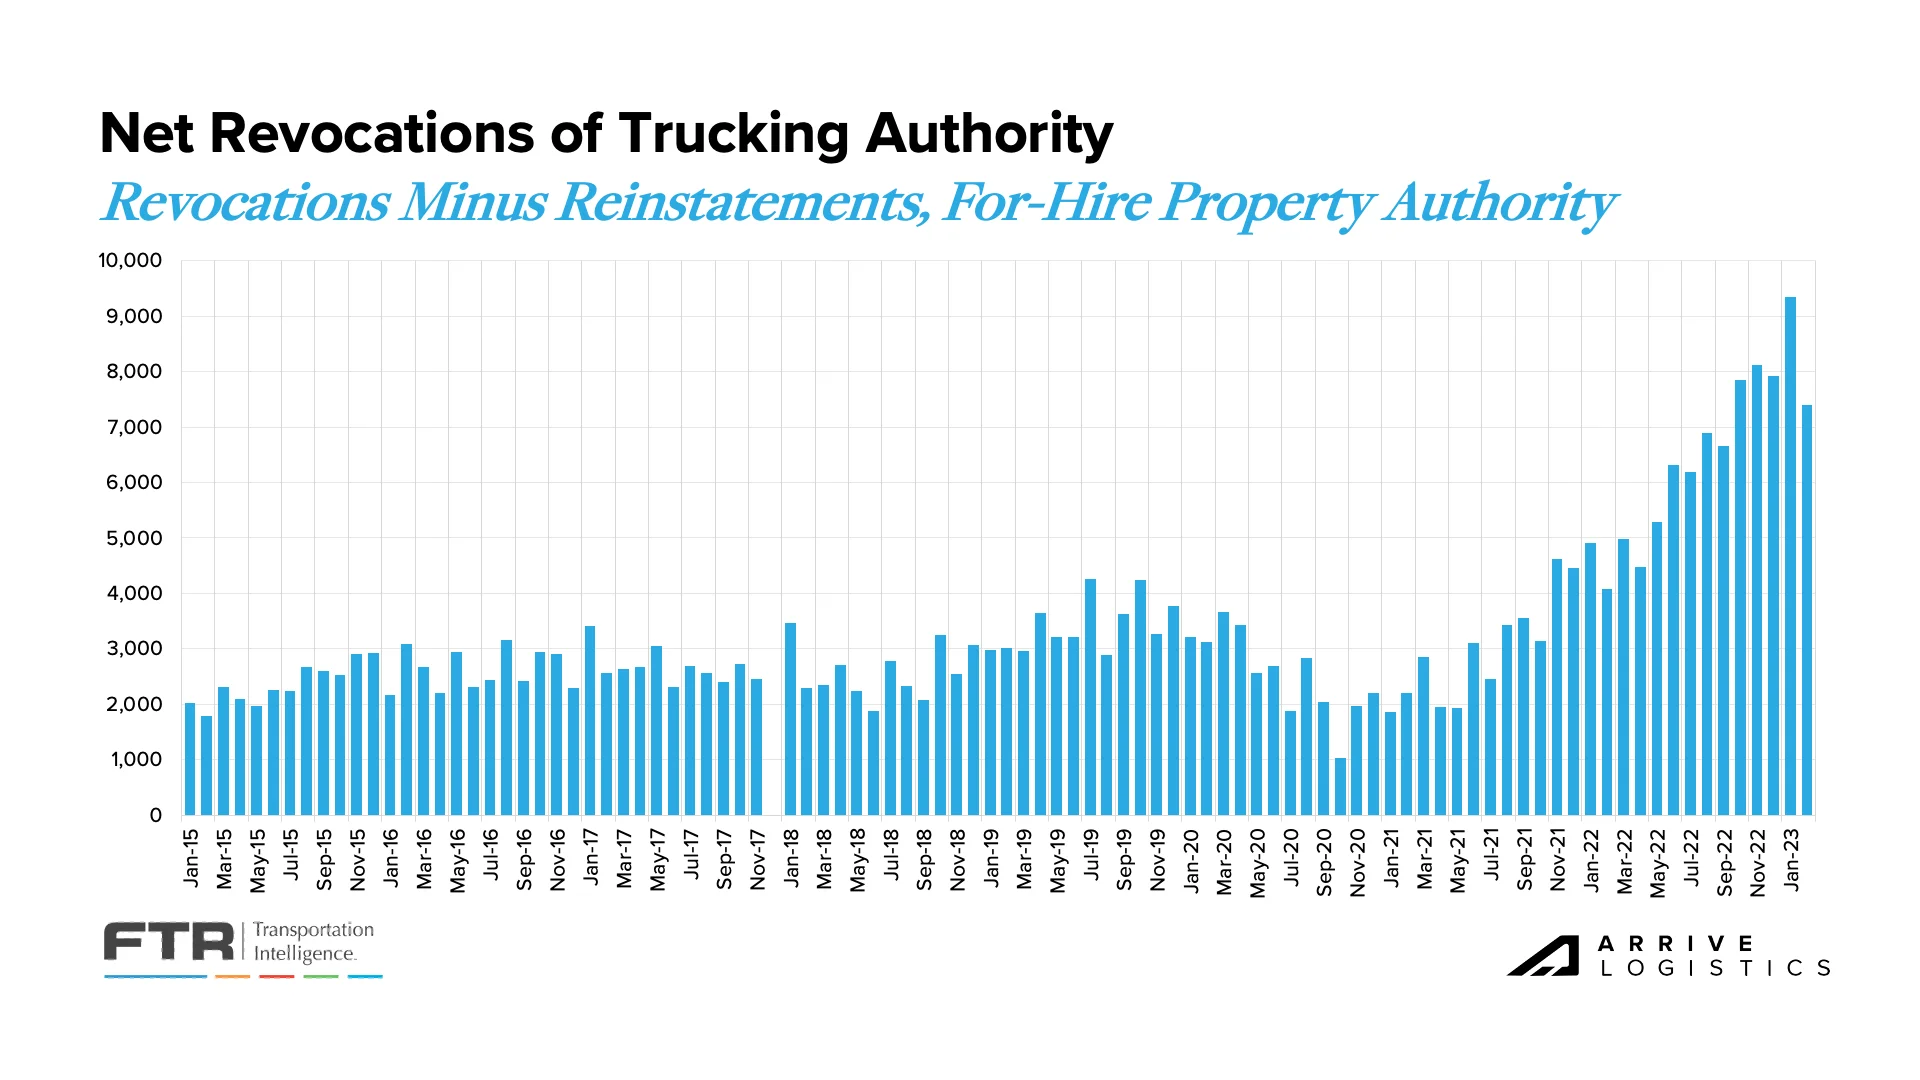 Figure 17: Net Revocations of Trucking Authority: FTR Analysis of FMCSA Data
In February, the trucking industry saw the largest employment drop since the pandemic lockdowns in May 2020. However, in March, a sudden hiring surge more than made up for the February losses — this was unexpected since many thought that job growth had peaked and the February results would lead to a capacity correction. During the past year, many of the new jobs created were taken by owner-operators moving to company jobs, but most of that movement is likely over. So, we hypothesize that the March hiring surge resulted from carriers anticipating reduced volumes but instead experiencing stable or increased volumes. These businesses may have cut staff earlier in the year to prepare for reduced demand or ramped up hiring to meet customer needs. The Cass Shipments Index, ATA Freight Tonnage Index, and several others suggest a more stable demand environment will materialize this year.
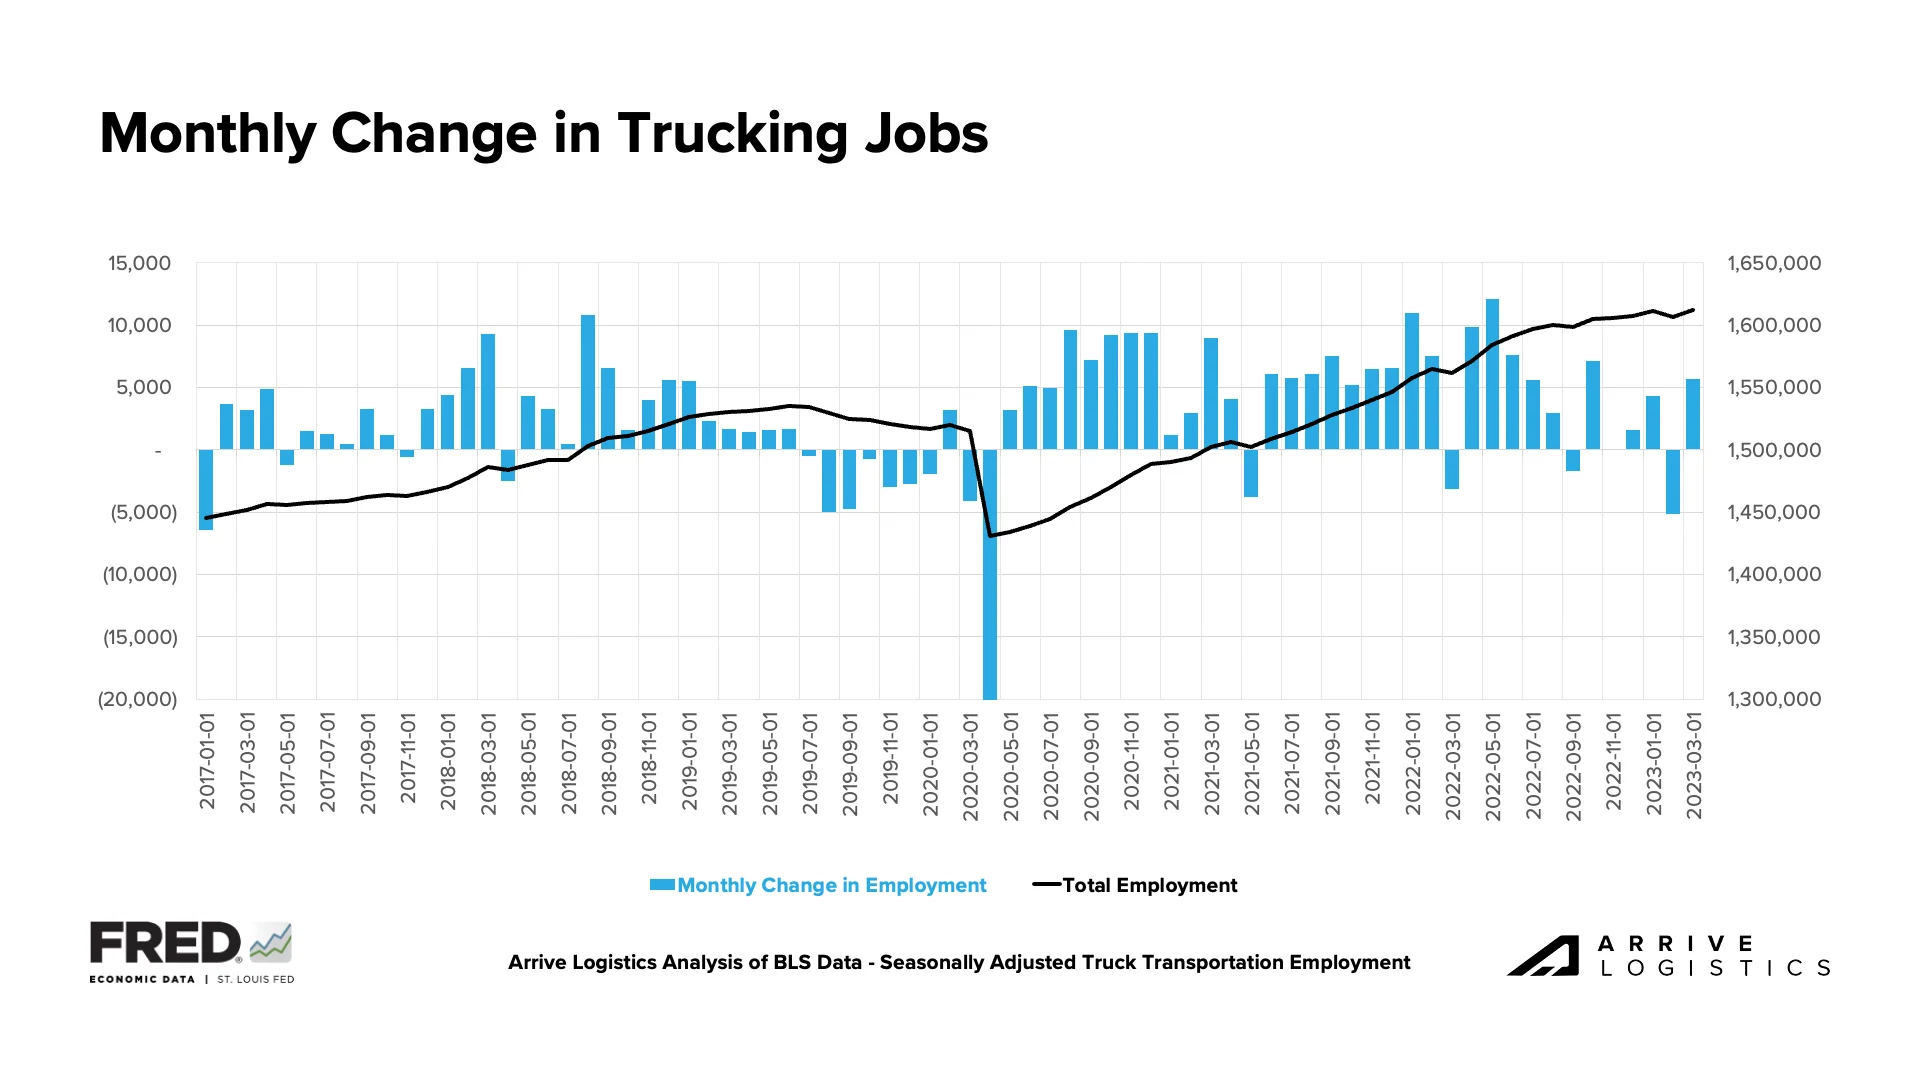 Figure 18: Monthly Change in Trucking Jobs
Another data set that is not yet available for March but remains critical to the narrative is the Net Change in Carrier Population. Over the past five months, revocations have outpaced the number of net new carriers entering the market, reducing the total number of carriers. As with revocation data, we expect to see the net change in carrier population remain negative, although the increase in jobs in March creates some uncertainty. Regardless of March results, the longer-term outlook is a further reduction in active carriers in the months ahead. Large carrier increases over the prior market cycle have contributed significantly to current conditions, and downward rate trends have historically resulted in capacity normalization.
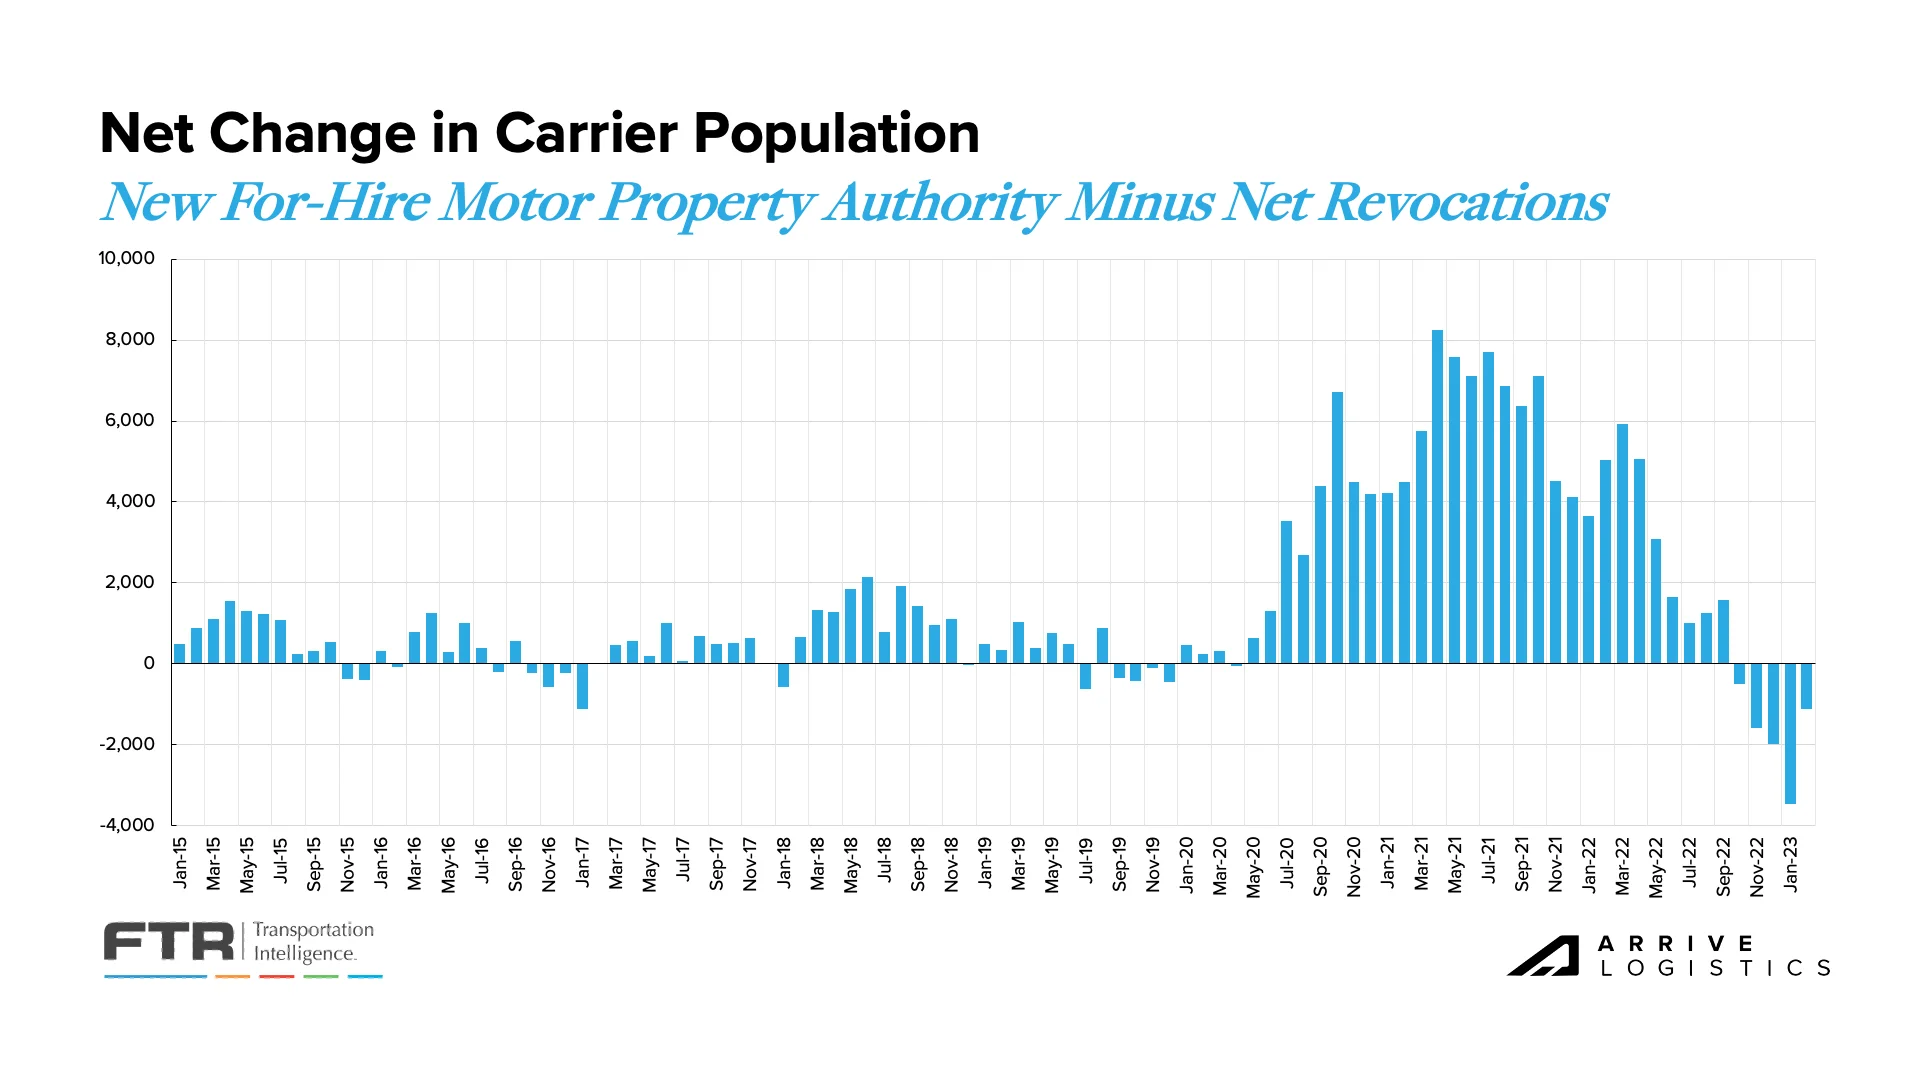 Figure 19: Net Change in Carrier Population: FTR Analysis of FMCSA Data
In March, FTR reported that new Class 8 truck orders fell for the fifth time in the last six months to 19,000 units. New orders have remained below but near build levels for the past few months, indicating that backlogs will likely decline but remain high. With production slots mostly filled through the remainder of the year, long lead times for new equipment will likely continue. FTR noted that given the economic uncertainty ahead, solid equipment order trends are a sign that demand has not collapsed and fleets still have access to capital.
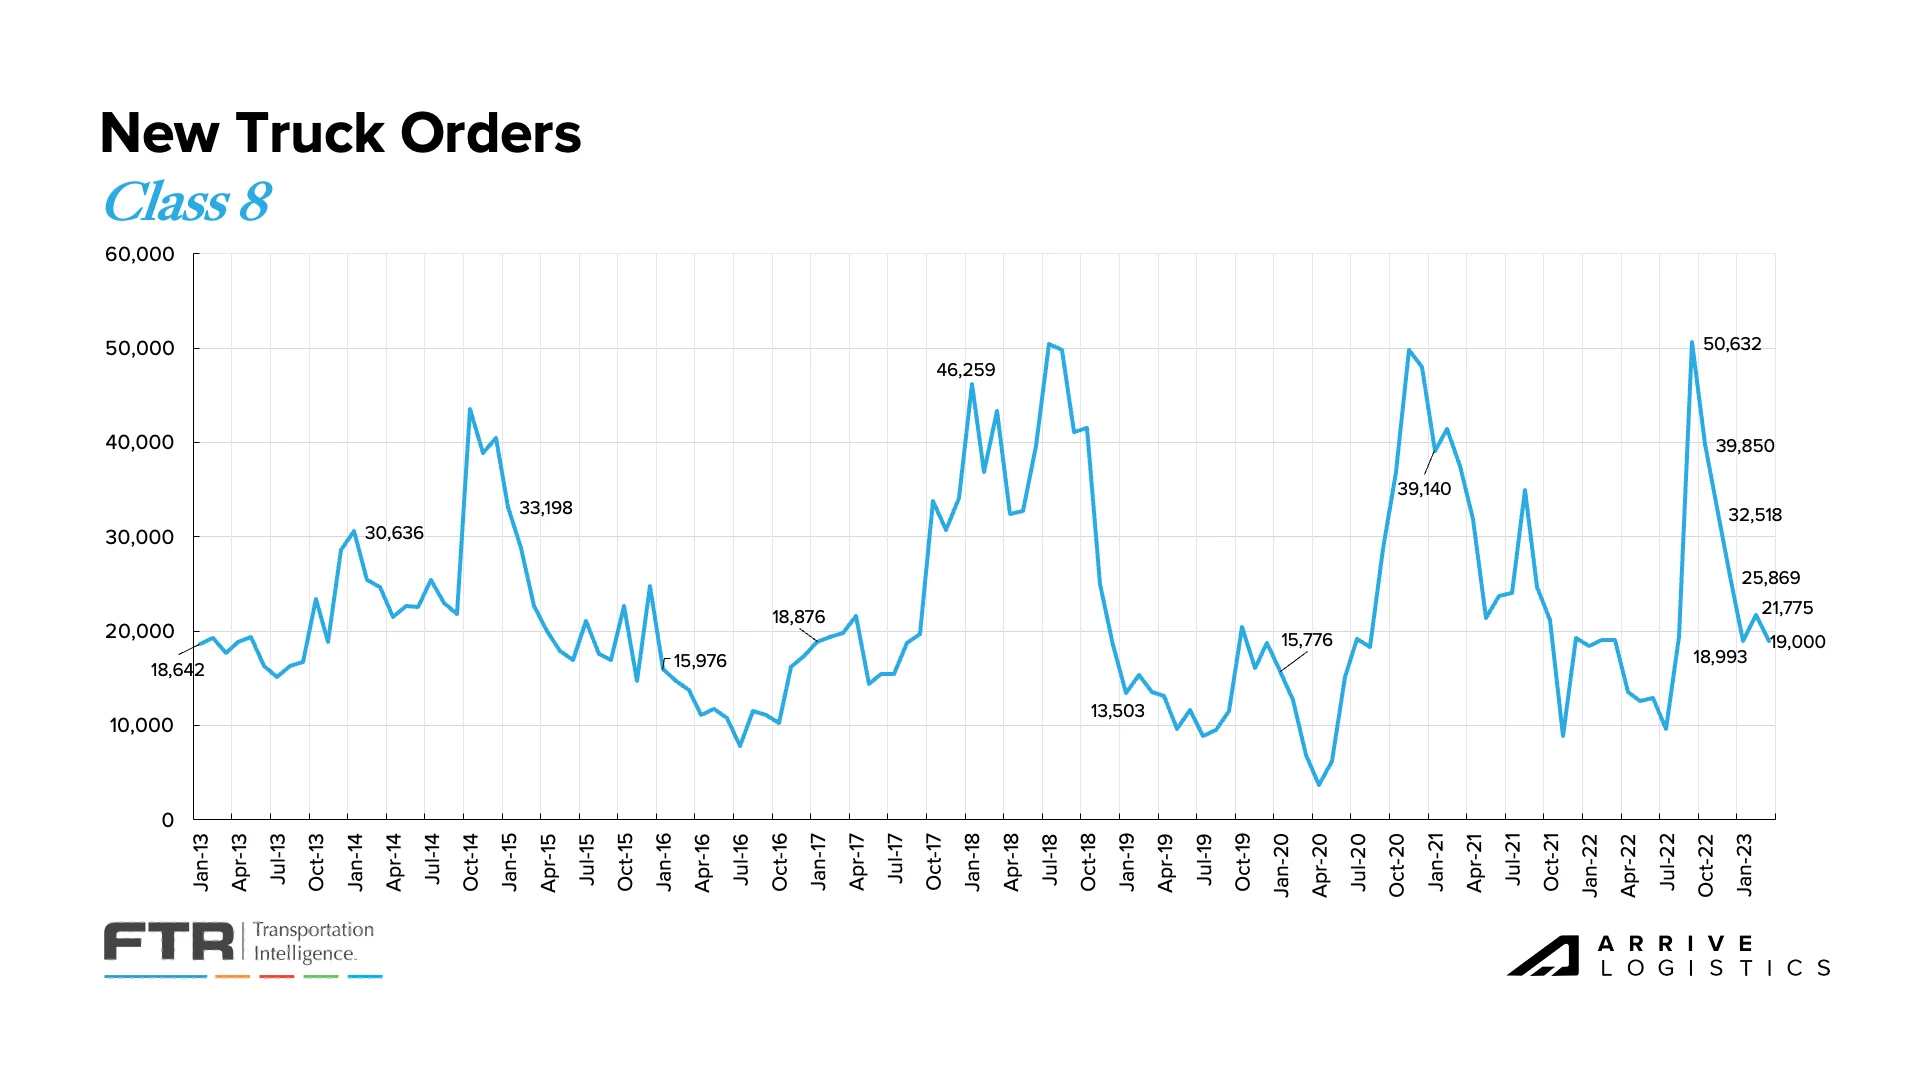 Figure 20: New Truck Orders: Source: FTR
We continue to note retail imports and manufacturing trends due to their meaningful share of domestic freight demand. Recent data continues to signal a faltering outlook for both sectors. The manufacturing sector posted its fifth consecutive month of contraction, and imports have fallen well off the record-setting levels seen a year ago. Although they are expected to climb through the summer, they will remain more in line with pre-pandemic norms. According to the National Retail Federation (NRF), the main priority at the moment is resolving labor negotiations at the West Coast ports and avoiding any more self-inflicted supply chain challenges than we’ve in the past three years. Although a strike is not considered imminent, the risk for one appears to be growing.
![]()
Figure 21: Monthly Retail Imports 2022-2023
The ISM manufacturing report indicated more easing backlogs as new orders contracted for the seventh consecutive month amid slowing production. The new orders index contracted at a faster rate, falling to 44.3%, raising even more uncertainty about future backlogs and, therefore, truckload demand. Manufacturing was expected to be one of the main volume drivers in 2023, and if contraction persists, demand will likely fall further than previously forecasted. However, there is still significant pent-up demand in the sector that should enable healthy volumes in the near term.
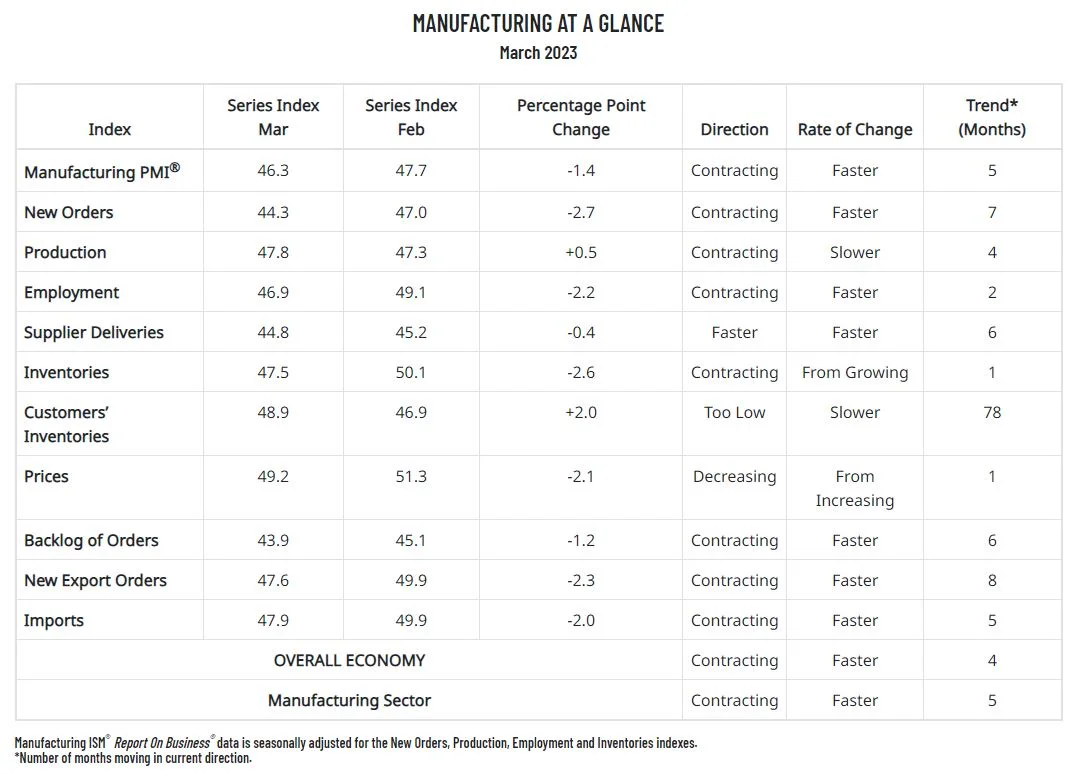 Figure 22: Manufacturing PMI Report on Business
One sector illustrating relative strength is the construction industry. The Wall Street Journal is reporting that a building boom in industrial plants, infrastructure and other nonresidential projects is offsetting home construction in the U.S. Spending on these areas is nearly 17% higher than last year.
Contrary to manufacturing, the backlog for nonresidential projects in the U.S. under contract but not yet started in February was more than a month longer than the same month last year. There is some caution that these trends could shift as economic concerns and labor and material shortages pose risks to contractors taking on new projects. However, these trends are likely key drivers preventing a truckload demand crash in the short term, particularly for flatbed equipment.
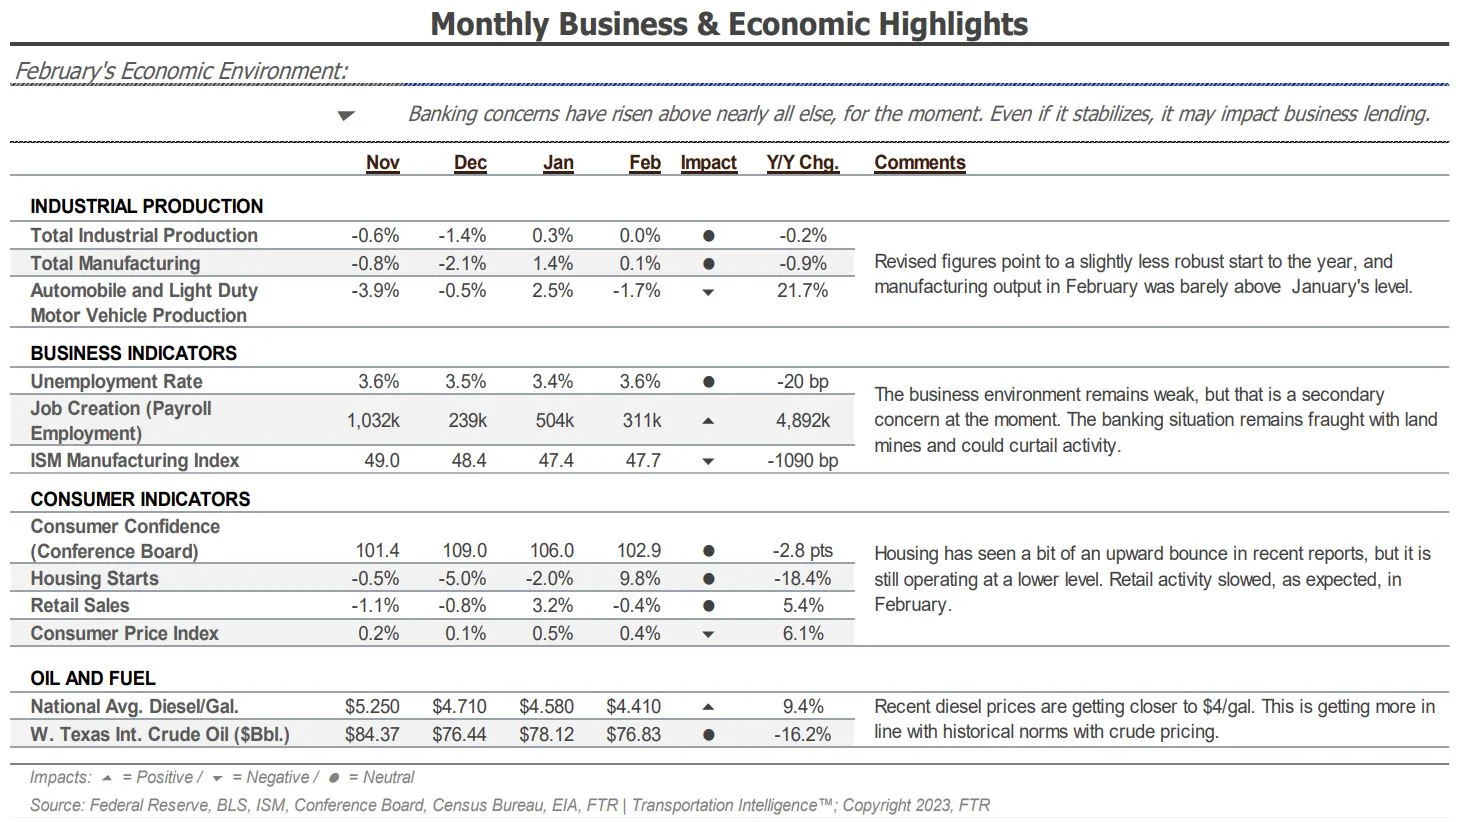 Figure 23: FTR Monthly Business & Economic Highlights
FTR’s latest truck loadings showed a 1.5% year-over-year increase for 2022, down from 1.7% last month after more revisions to previously reported loading data. The 2023 forecast has also been revised downward, showing a 1.6% decline versus the 1.4% decline reported in the last update. However, the dry van loadings forecast for 2023 improved based on stronger automotive loadings and a smaller decline in food loadings. FTR also noted that a more positive outlook for construction and industrial commodities loadings significantly improved the flatbed loadings forecast. However, it remains negative at 2.9% below where it was in 2022.
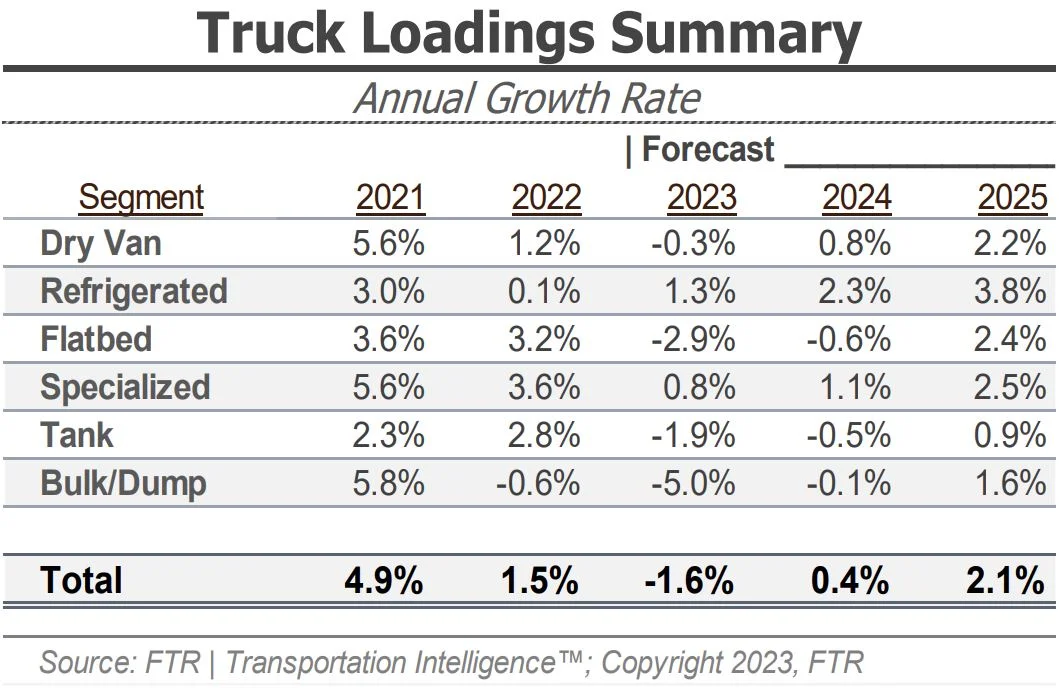 Figure 24: FTR Truck Loading Summary
April CPI data showed inflation slowed in March, falling from 6.0% to 5.0% year-over-year growth (5.6% when excluding food and energy). While the top-line inflation decline seems meaningful, the core inflation index is up from 5.5% in February — the first increase since September. Rising shelter costs continue to be a key driver of inflation data, accounting for about a third of the CPI index. When excluding housing and looking at core services, prices are up 3.4% from a year ago. The Fed is targeting 2% inflation and is therefore likely to continue taking action with its next opportunity to raise rates. Speculators are indicating another rate hike of 25 basis points is the most likely scenario.
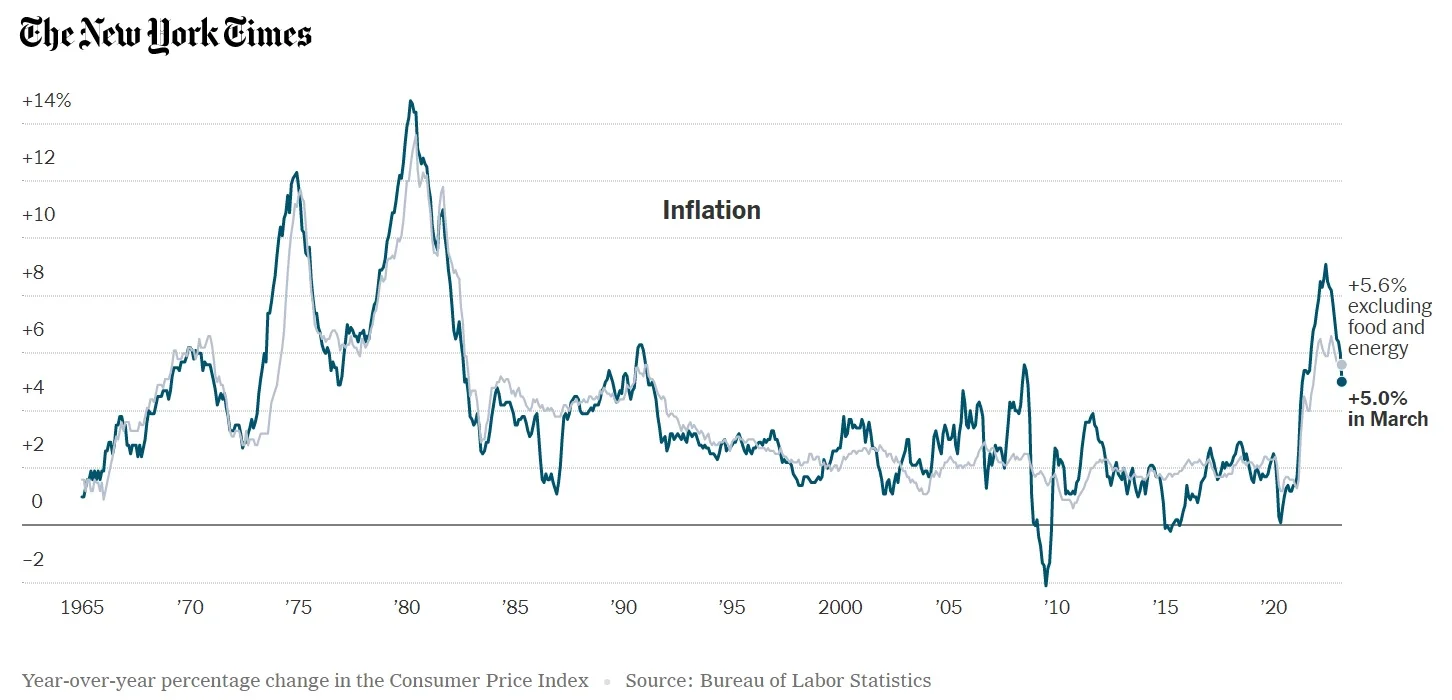
Figure 25: NYT’s Inflation in March
Bank of America’s card data revealed consumer spending per household increased by just 0.1% year-over-year in March, down from 2.7% in February and 5.1% year-over-year growth in January. The 1.5% month-over-month decline in March on a seasonally adjusted basis was driven by particularly weak spending on gas, furniture, home improvement and department stores. However, airline spending continued to grow significantly.
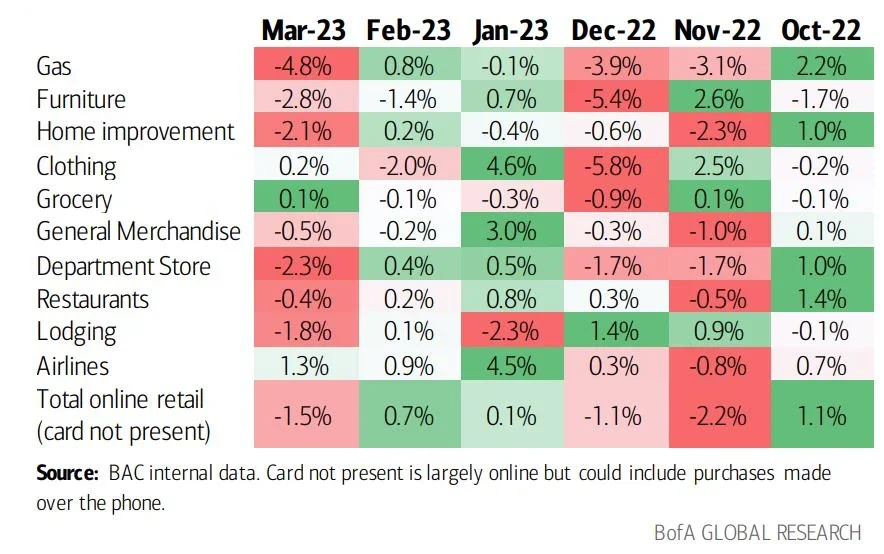
Figure 26: Bank of America Monthly Card Spending
Services spending held strong overall compared to durable goods, which experienced a significant decrease in March as leisure services spending remained relatively flat. Because durable goods tend to move on trucks, spending declines have a larger impact on truckload demand.
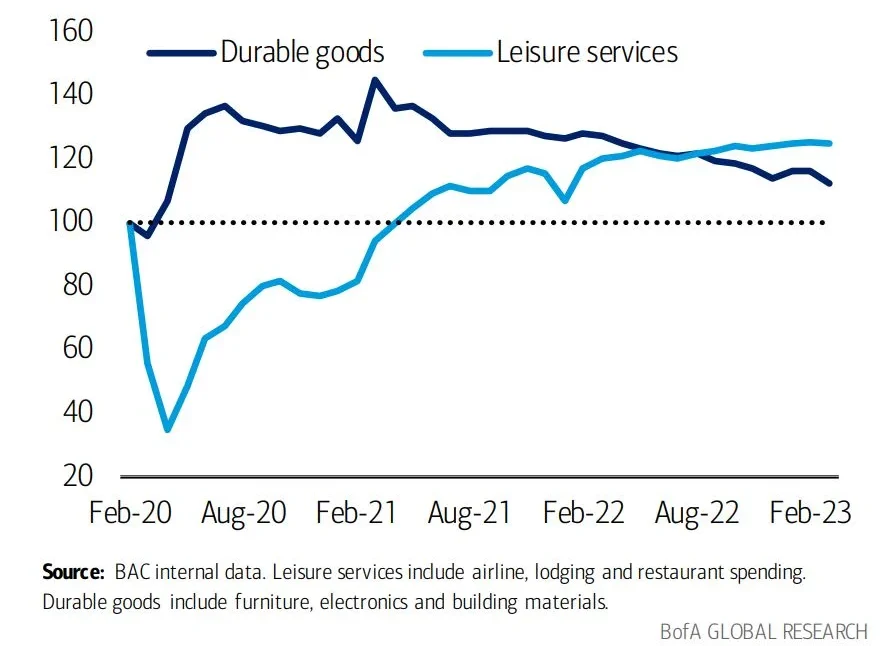
Figure 27: Bank of America Monthly Card Spending on Durable Goods vs. Leisure Services
Initial jobless claims have increased slightly in recent months, but current levels remain close to last year and even pre-pandemic levels. The unemployment rate remains dead even with February 2020 and is down significantly from a year ago, a sign that the labor market is strong despite recent reports of layoffs. This robust labor market signals confidence in consumers’ ability to sustain current spending levels and avoid a sudden drop in truckload demand.
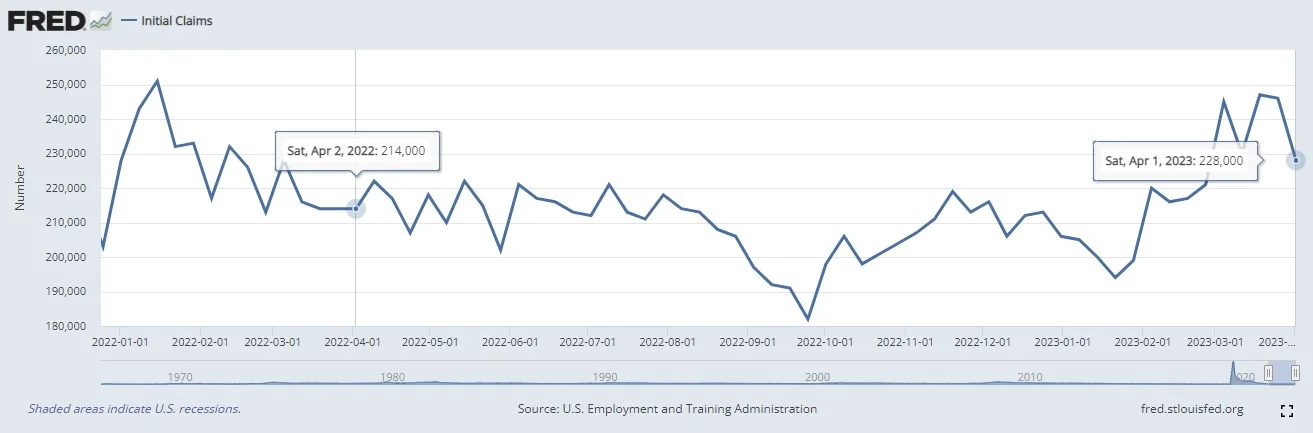 Figure 28: FRED Initial Jobless Claims
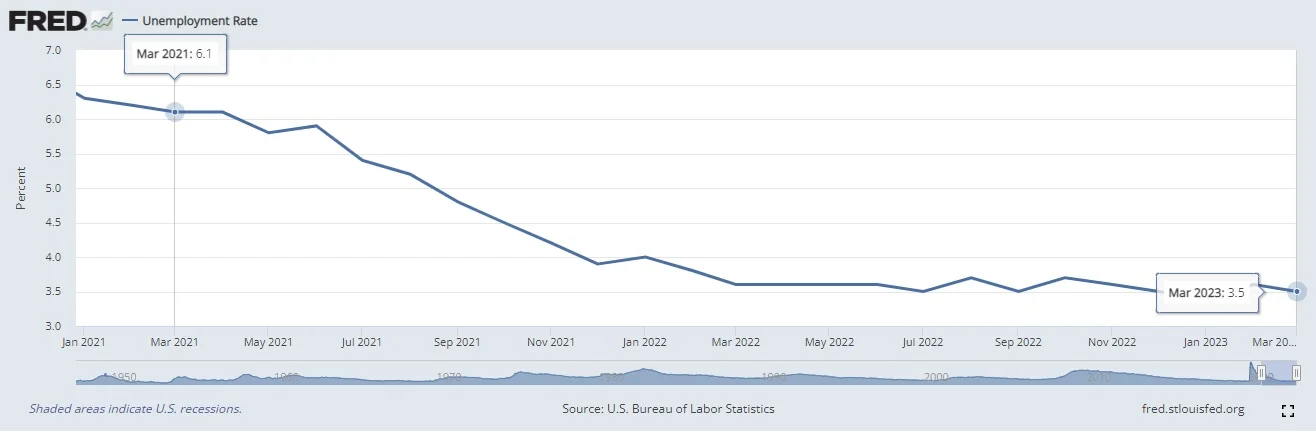 Figure 29: FRED Unemployment Rate


