
November truckload demand reports varied from source to source, mainly because spot-focused index trends continued to show significant declines in activity while contract indices displayed more stability. Our takeaway from these opposing trends is consistent with last month’s report: Overall, demand remains healthy but continues to see large allocations moving via primary contract carriers.
The FreightWaves SONAR Outbound Tender Volume Index (OTVI), which measures contract tender volumes across all modes, was down 26% year-over-year (1% month-over-month), or 12.8% when measuring accepted volumes after the significant decline in tender rejection rates.
This year-over-year contract volume decline is inconsistent with other sources, however. As we reported last month, some experts believe that the SONAR tender data has a higher proportion of retail freight than the overall market. This is unconfirmed by FreightWaves, but given retail demand has slowed substantially since Q4 2021, it would help explain the significant drop in tender volumes in recent months.
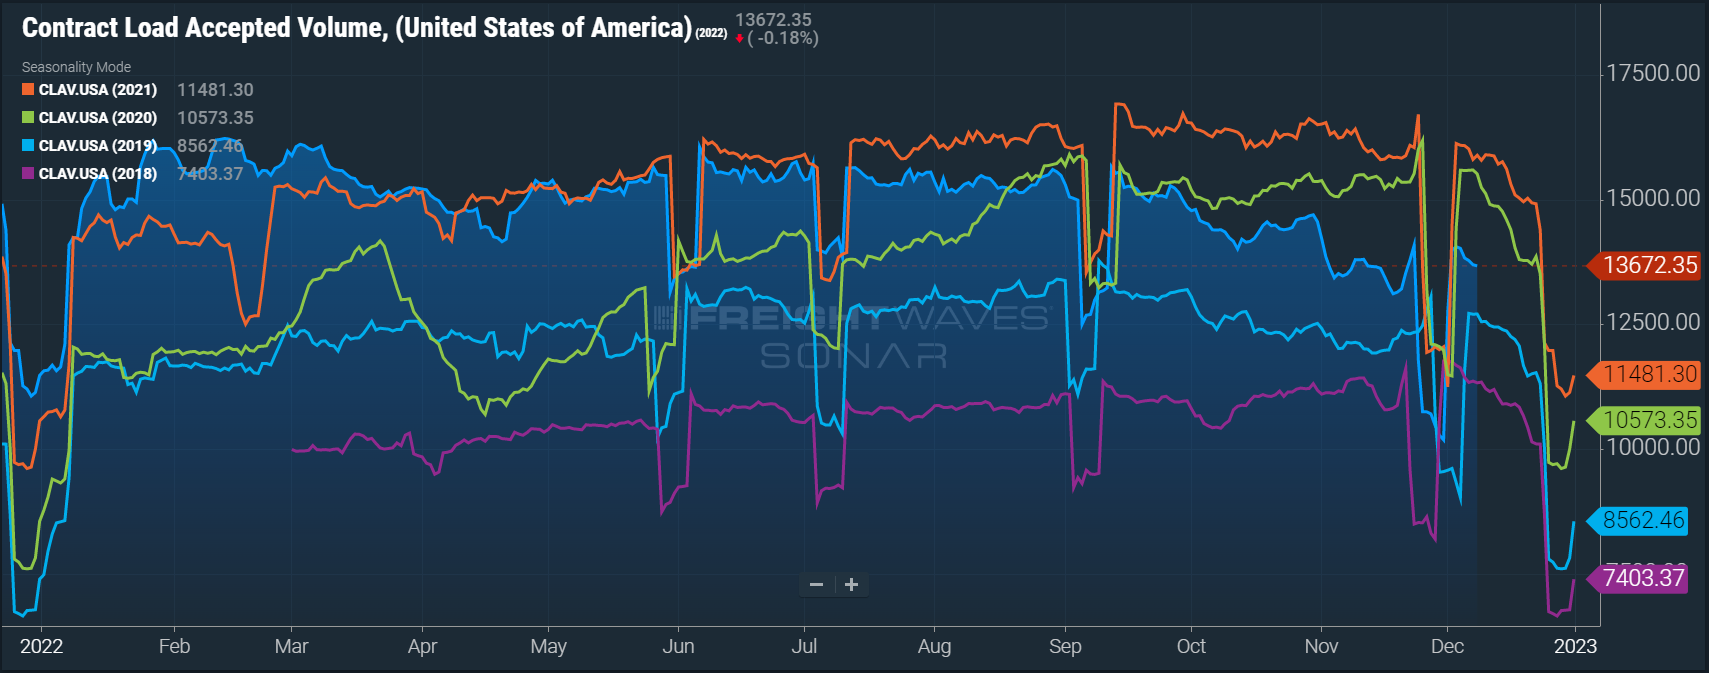 Accepted contract volumes are down 13.9% y/y in early November but remain above historical pre-pandemic levels.
With retail down, industrials and manufacturing are most likely responsible for driving volumes. The ATA report indicated year-over-year volumes were down 2.3% in October after rising 5.5% year-over-year in September, and the Cass report showed volumes were up 2.9% year-over-year in October.
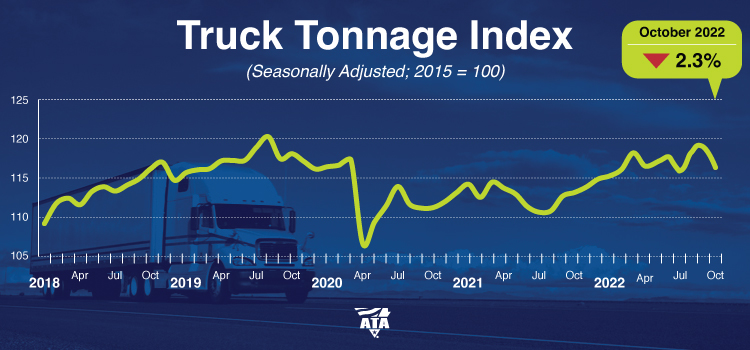 The ATA reported that truck tonnage was up by 5.5% compared to September 2021, the thirteenth straight year-over-year gain and the third highest level on record.
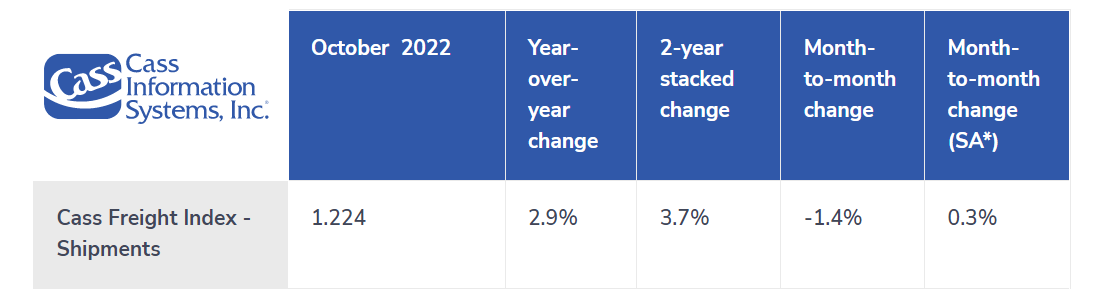 The Cass Freight Index indicated year-over-year volumes were up 4.8% in September, but growth is expected to slow in coming months due to tougher comps in Q4.
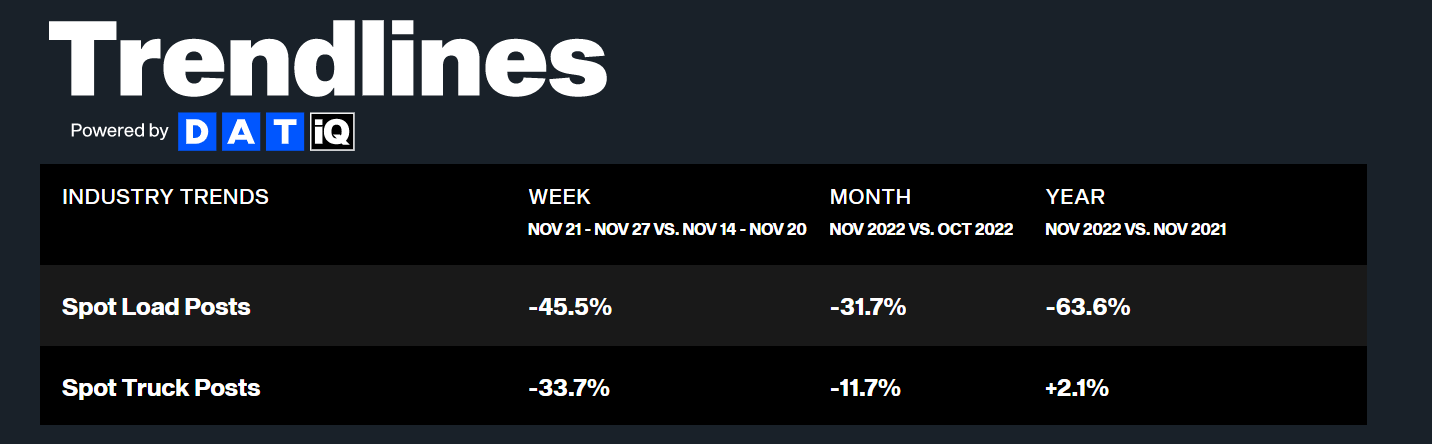
Contract is still leading the way as spot volumes continue to suffer as shippers experience ongoing strong routing guide compliance. DAT data shows year-over-year spot volumes declined 64% in November, indicating particularly slow retail peak season demand compared to what we typically see in the back half of the month.
Despite the Thanksgiving surge and the holiday season being in full swing, supply conditions remained stable in November. Because Thanksgiving trends are typically a good indicator of how things will unfold as we approach Christmas and New Year’s Eve, shippers should see strong routing guide performance hold steady through year-end.
The Sonar Outbound Tender Reject Index (OTRI) measures the rate at which carriers reject the freight they are contractually required to take. The rate remained relatively stable this month, dropping from 4.19% in early November to 3.95% in early December, further indicating that shippers are still seeing good routing guide compliance on contractual freight.
Reefer tender rejections moved more than van tender rejections around Thanksgiving. Though we did see some of the usual food-related demand surge patterns, they were minimal compared to years past. This leads us to believe that even if spot activity and volatility increase before year-end, rejections will remain low as carriers continue delivering high service levels to protect volume heading into next year.
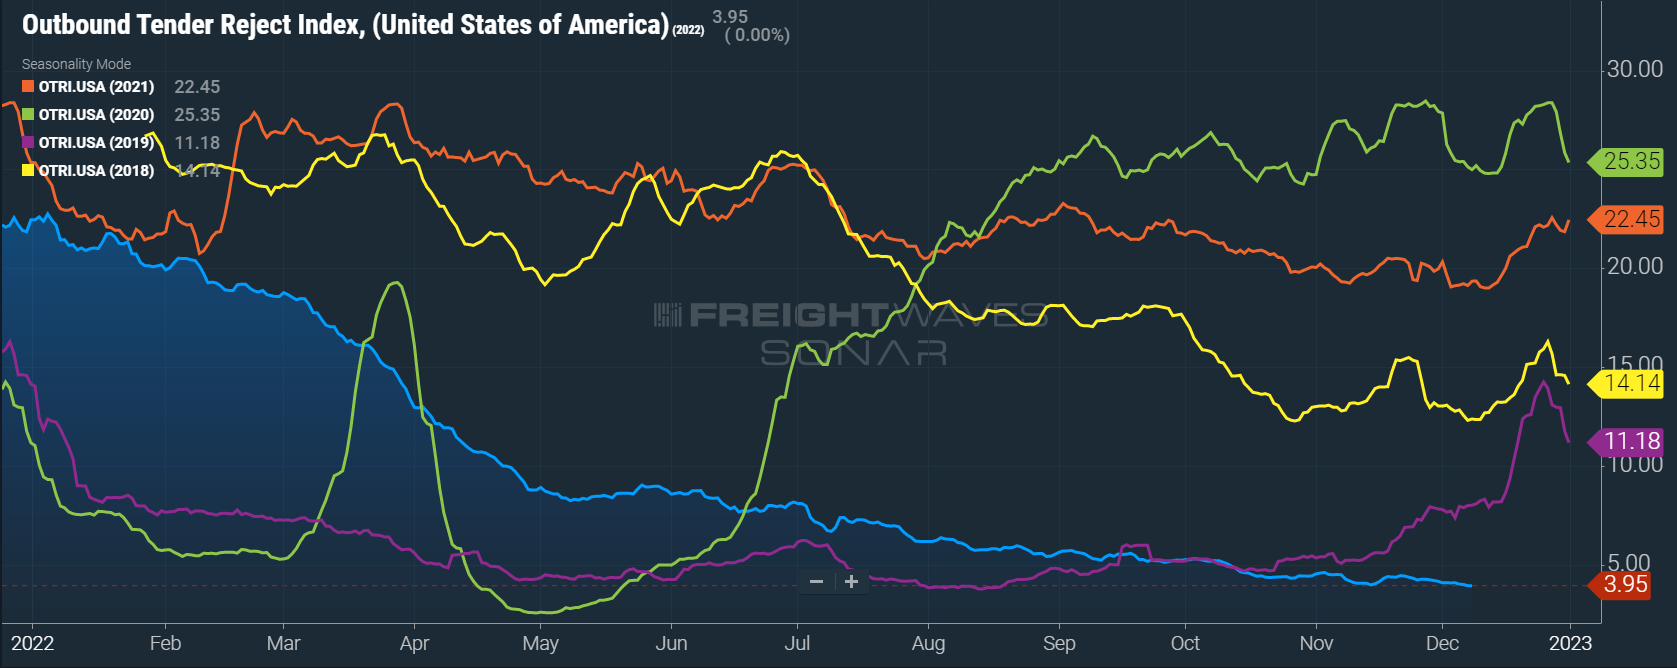 OTRI continued its gradual decline to equilibrium levels throughout November and early December, falling to 3.95%, the lowest level seen this year.
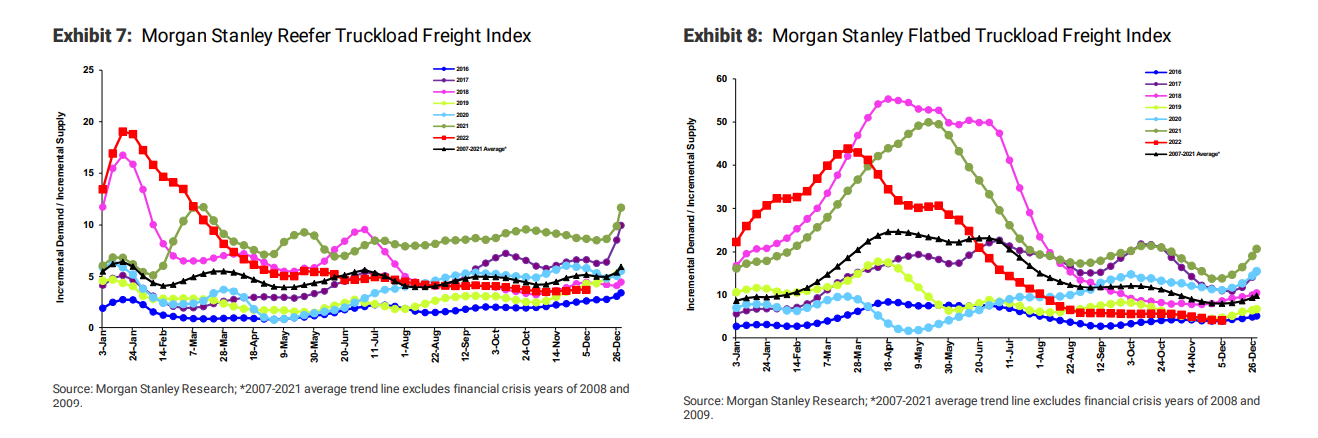
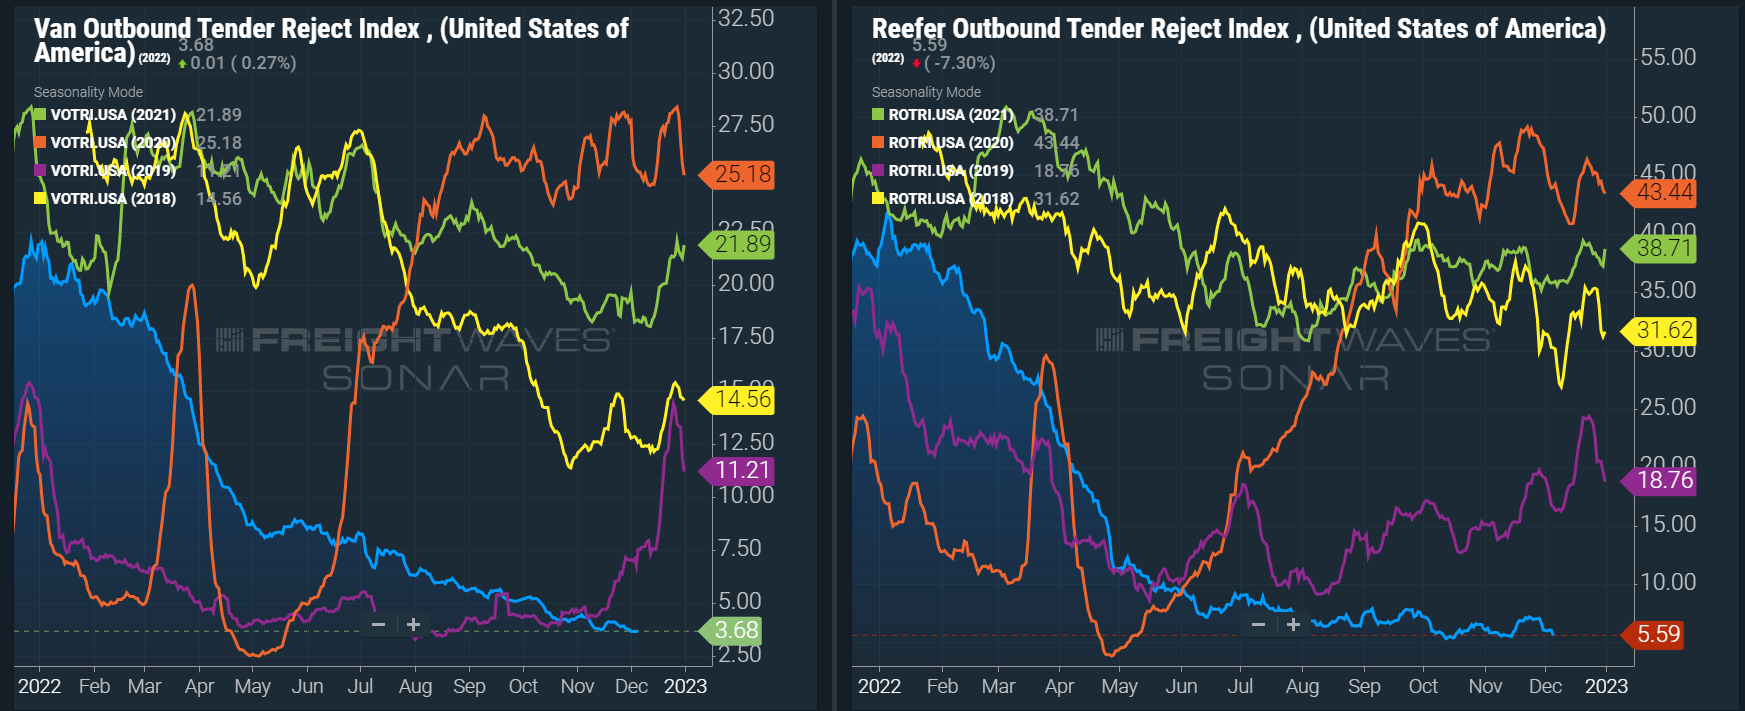 Dry van and reefer tender rejections are both trending at all-time lows for this time of year, with dry van rejection rates coming in below 4%, and reefer rejections currently at 5.59%.
The DAT Load to Truck Ratio measures the total number of loads compared to the total number of trucks posted on their spot load board. In November, the Dry Van Load to Truck Ratio was down 21.6% month-over-month and 56% year-over-year, ranges that are typical of equilibrium market conditions. Likewise, the November Reefer Load to Truck Ratio was down 11.5% month-over-month and 62% year-over-year.
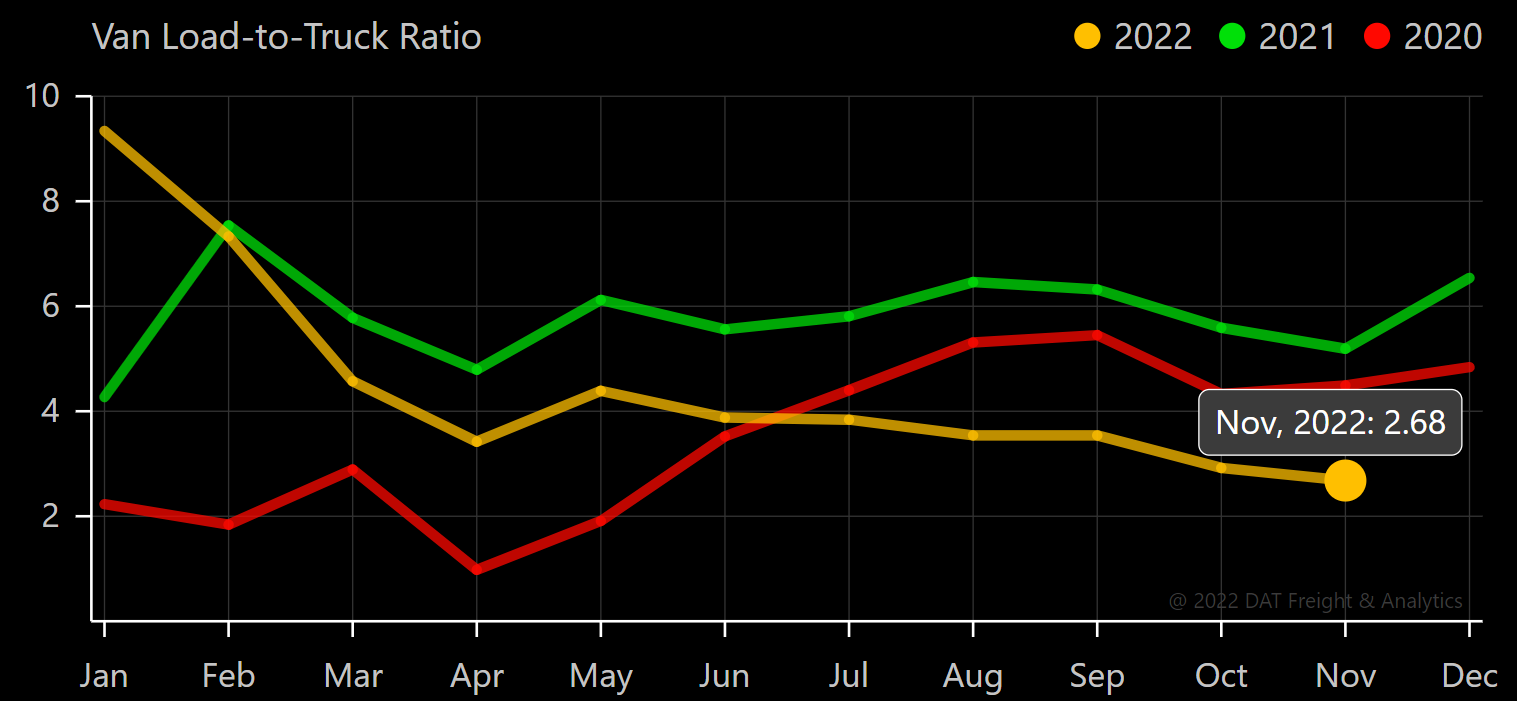
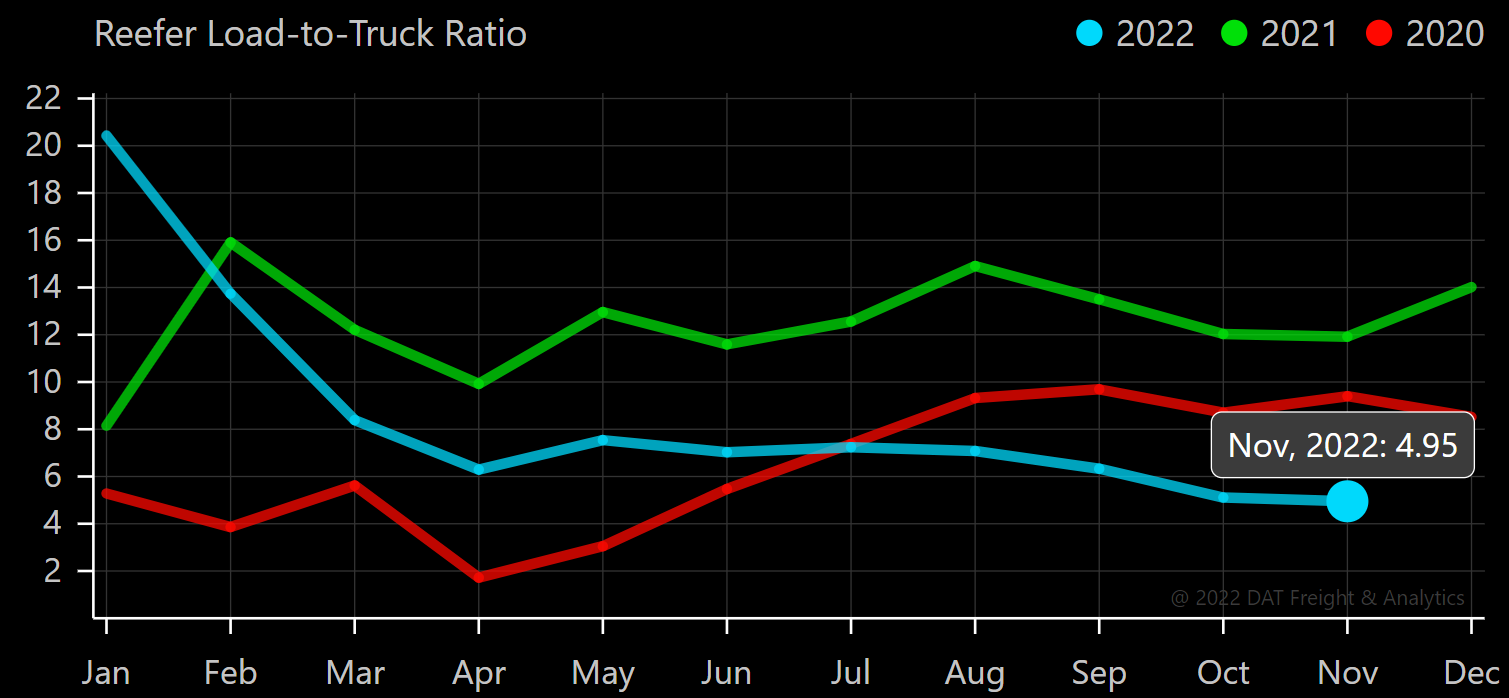
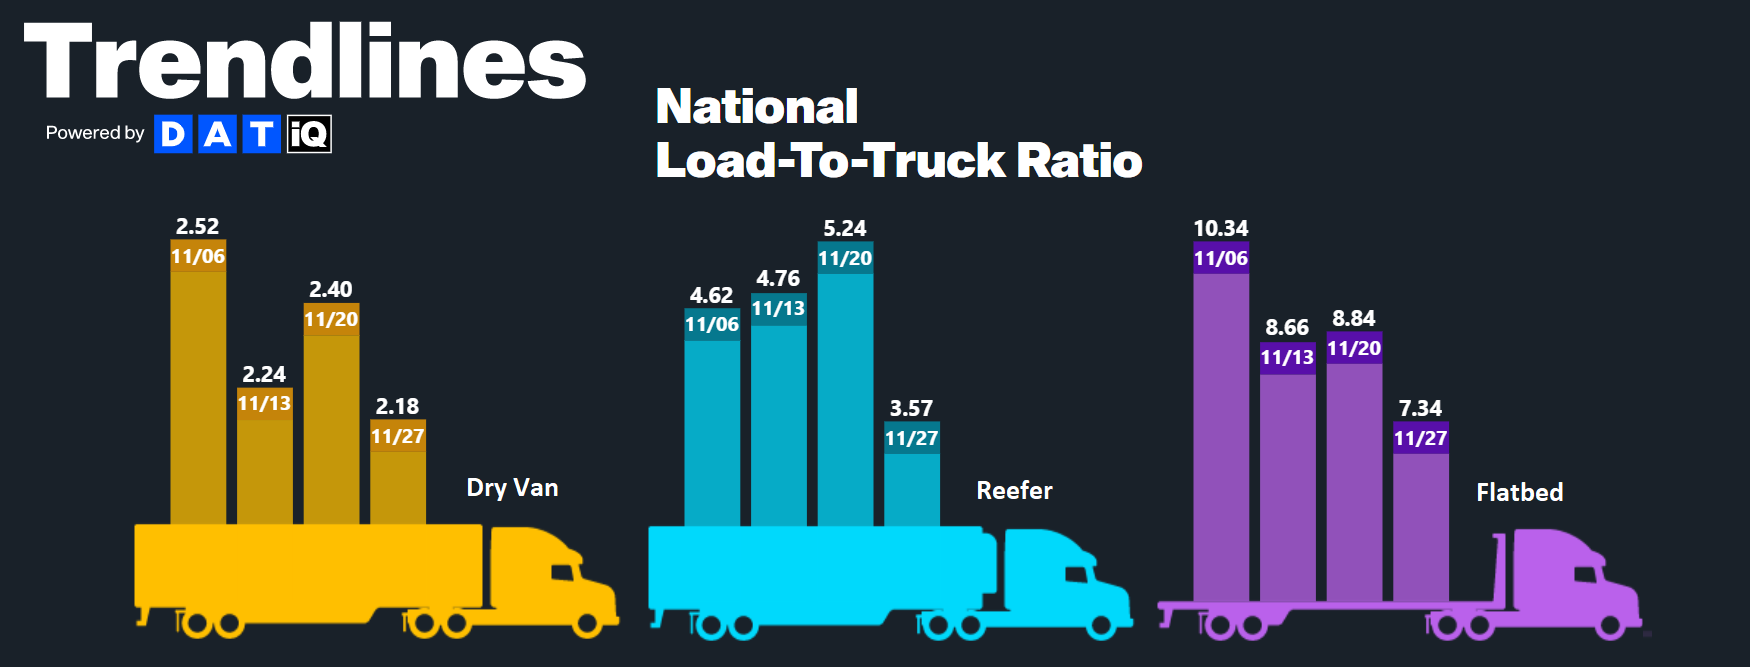
Weekly Load to Truck Ratio trends showed a slight increase in spot tightness during the week of Thanksgiving, but soft conditions returned across all modes the following week.
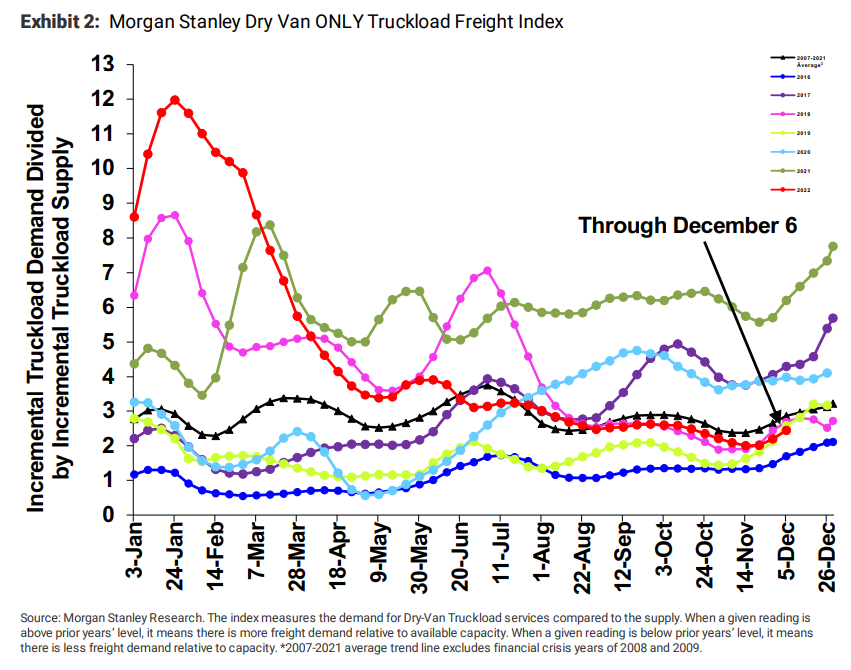
The Morgan Stanley Dry Van Freight Index is another measure of relative supply; the higher the index, the tighter the market conditions. The black line with triangle markers on the chart provides a great view of what directional trends would be in line with normal seasonality based on historical data dating back to 2007. Because all prior years saw increased tightness from mid-November through the end of the year, we would typically expect to see a similar trend now.
However, recent data helps illustrate that oversupplied conditions are driving declining market rate trends. While we have seen an uptick in line with normal seasonality following the holiday, we believe it may have been sparked primarily by shippers preparing for the potential rail strike. Therefore, it is unlikely that trend will continue through the month as it has in past years. So, given current conditions, we anticipate only minimal tightening due to increased urgency from shippers and carriers taking time off for the holidays.
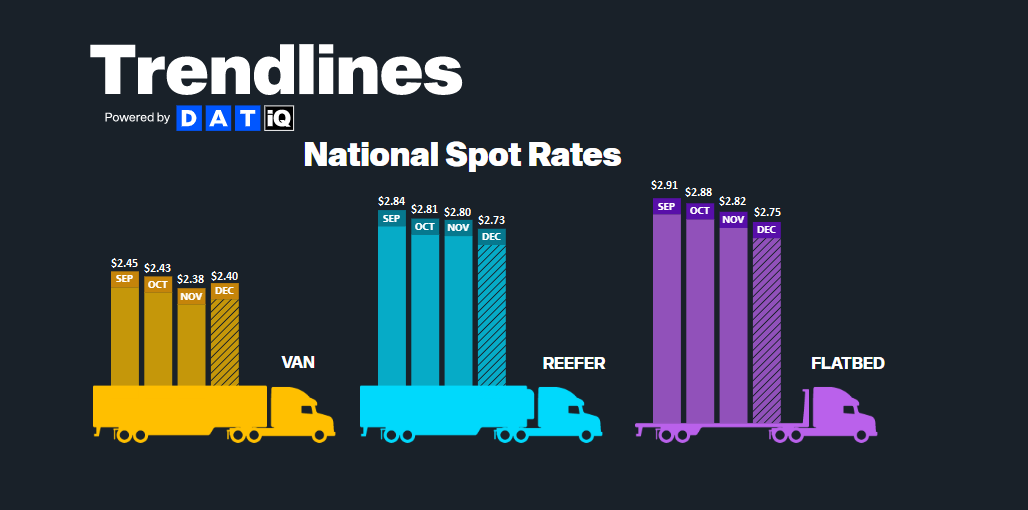
All-in spot rates, including linehaul and fuel costs, firmed up for dry van equipment in early December but continue to show sequential month-over-month declines for reefer and flatbed equipment. With the monthly average fuel surcharge, according to the DAT, down $0.05 per mile from November, the $0.02 increase in dry van rates is being driven by a $0.07 per mile increase in the linehaul component of the rate.
Though somewhat unexpected, three factors can help explain the sudden rise in linehaul rates: Typical seasonal tightness, the short-term demand surge caused by the threat of a rail strike in early December and the inflationary effect of declining fuel prices on spot linehaul rates. However, the fact that reefer and flatbed rates have continued to trend down rapidly leads us to believe that the inflationary effect of falling fuel prices is minimal.
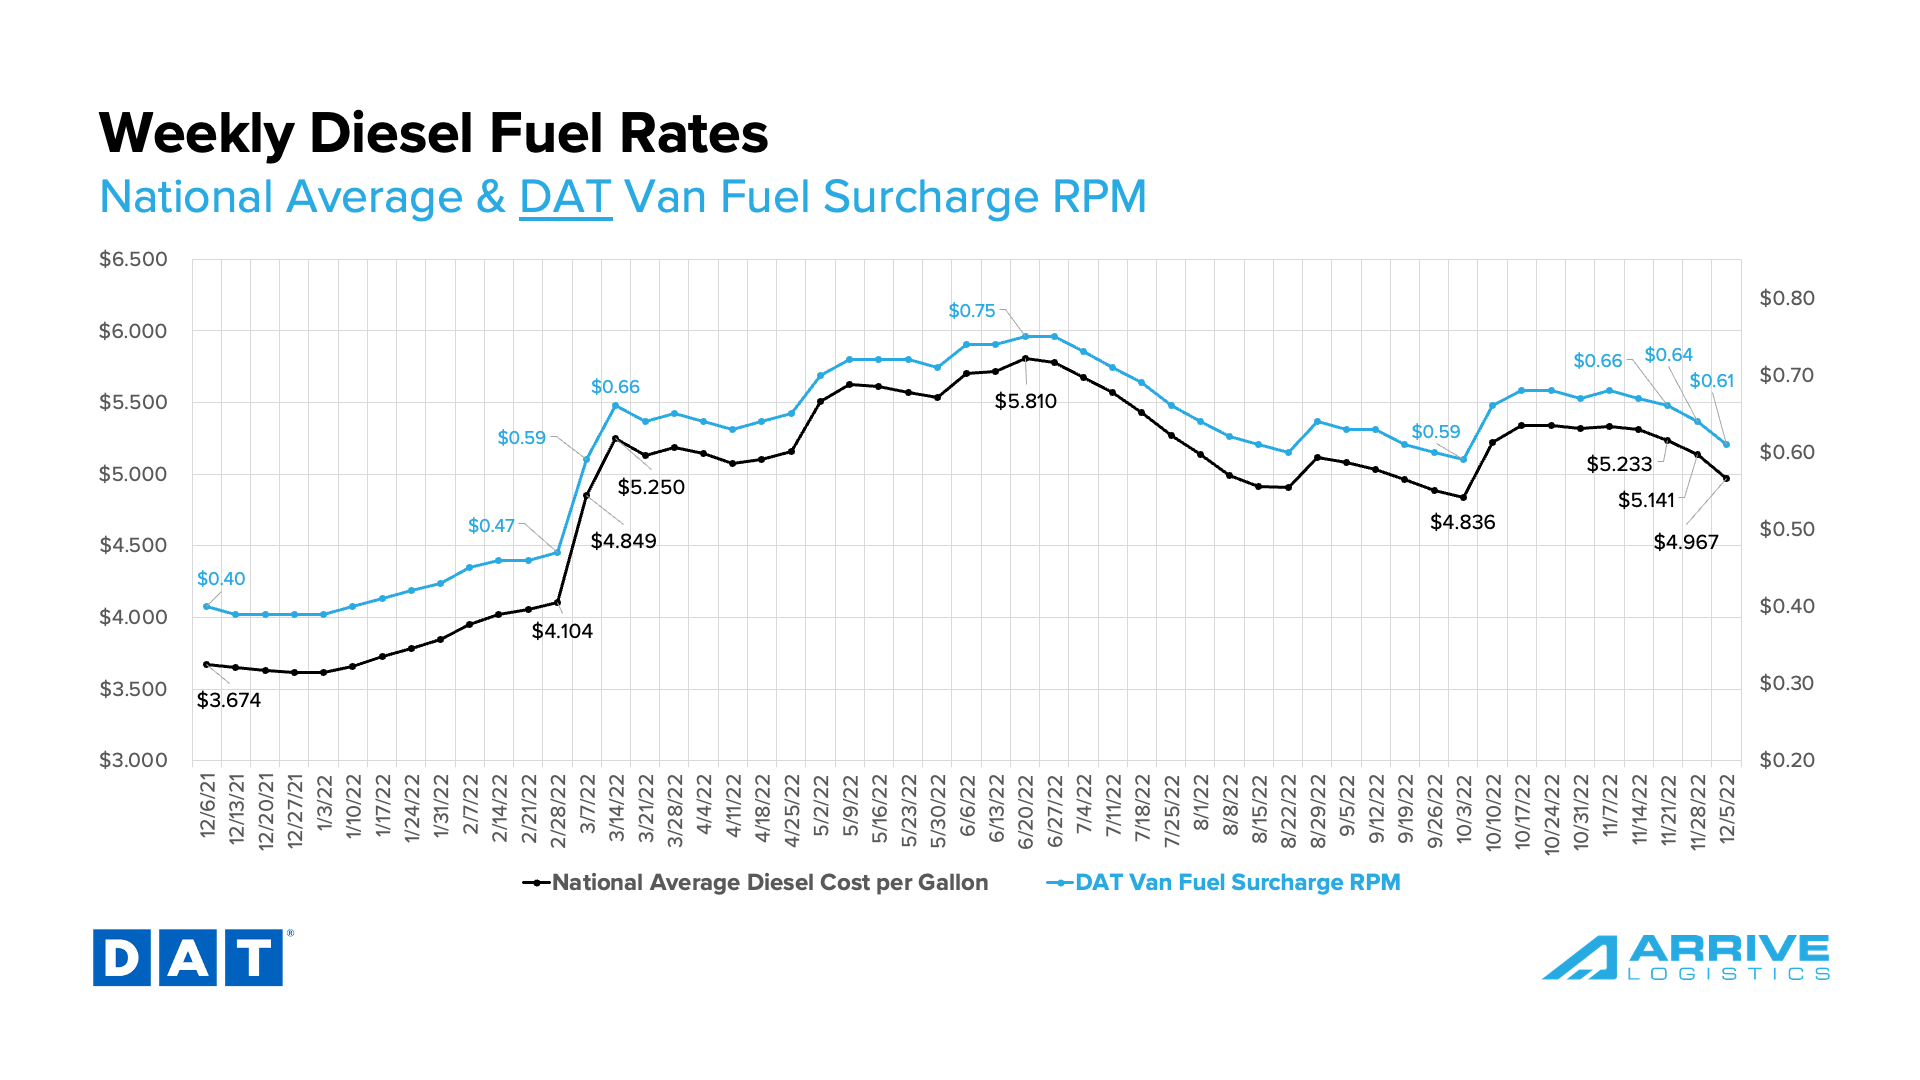 The national average decreased by more than $0.366 over the past month, translating to a decrease in the weekly fuel surcharge from $0.68 to $0.61 per mile, according to the DAT.
Early December linehaul rates show the spot market has responded to recent seasonal and other market trends, but contract rates continue to move relative to longer-term expectations. As a result, we have seen the gap between the two close by $0.11 per mile; this is significant, but a large disparity remains and should continue to drive downward pressure on contract rates for the foreseeable future.
The recent rise in spot rates does not change our 2023 forecast. We expect further spot declines in the first quarter and contract to continue to fall in the coming months as more shippers lock in lower pricing and as new business goes live.
The current dry van contract rate is $2.35 per mile, excluding fuel — a decrease of 8.2% from $2.56 per mile in December 2021. Although linehaul rates are down year-over-year, all-in contract rates are flat due to increased fuel costs. We did see a 10.3% decline from the peak of contract rates, excluding fuel, in February of 2022, with no signs of reaching a floor in the months that followed.
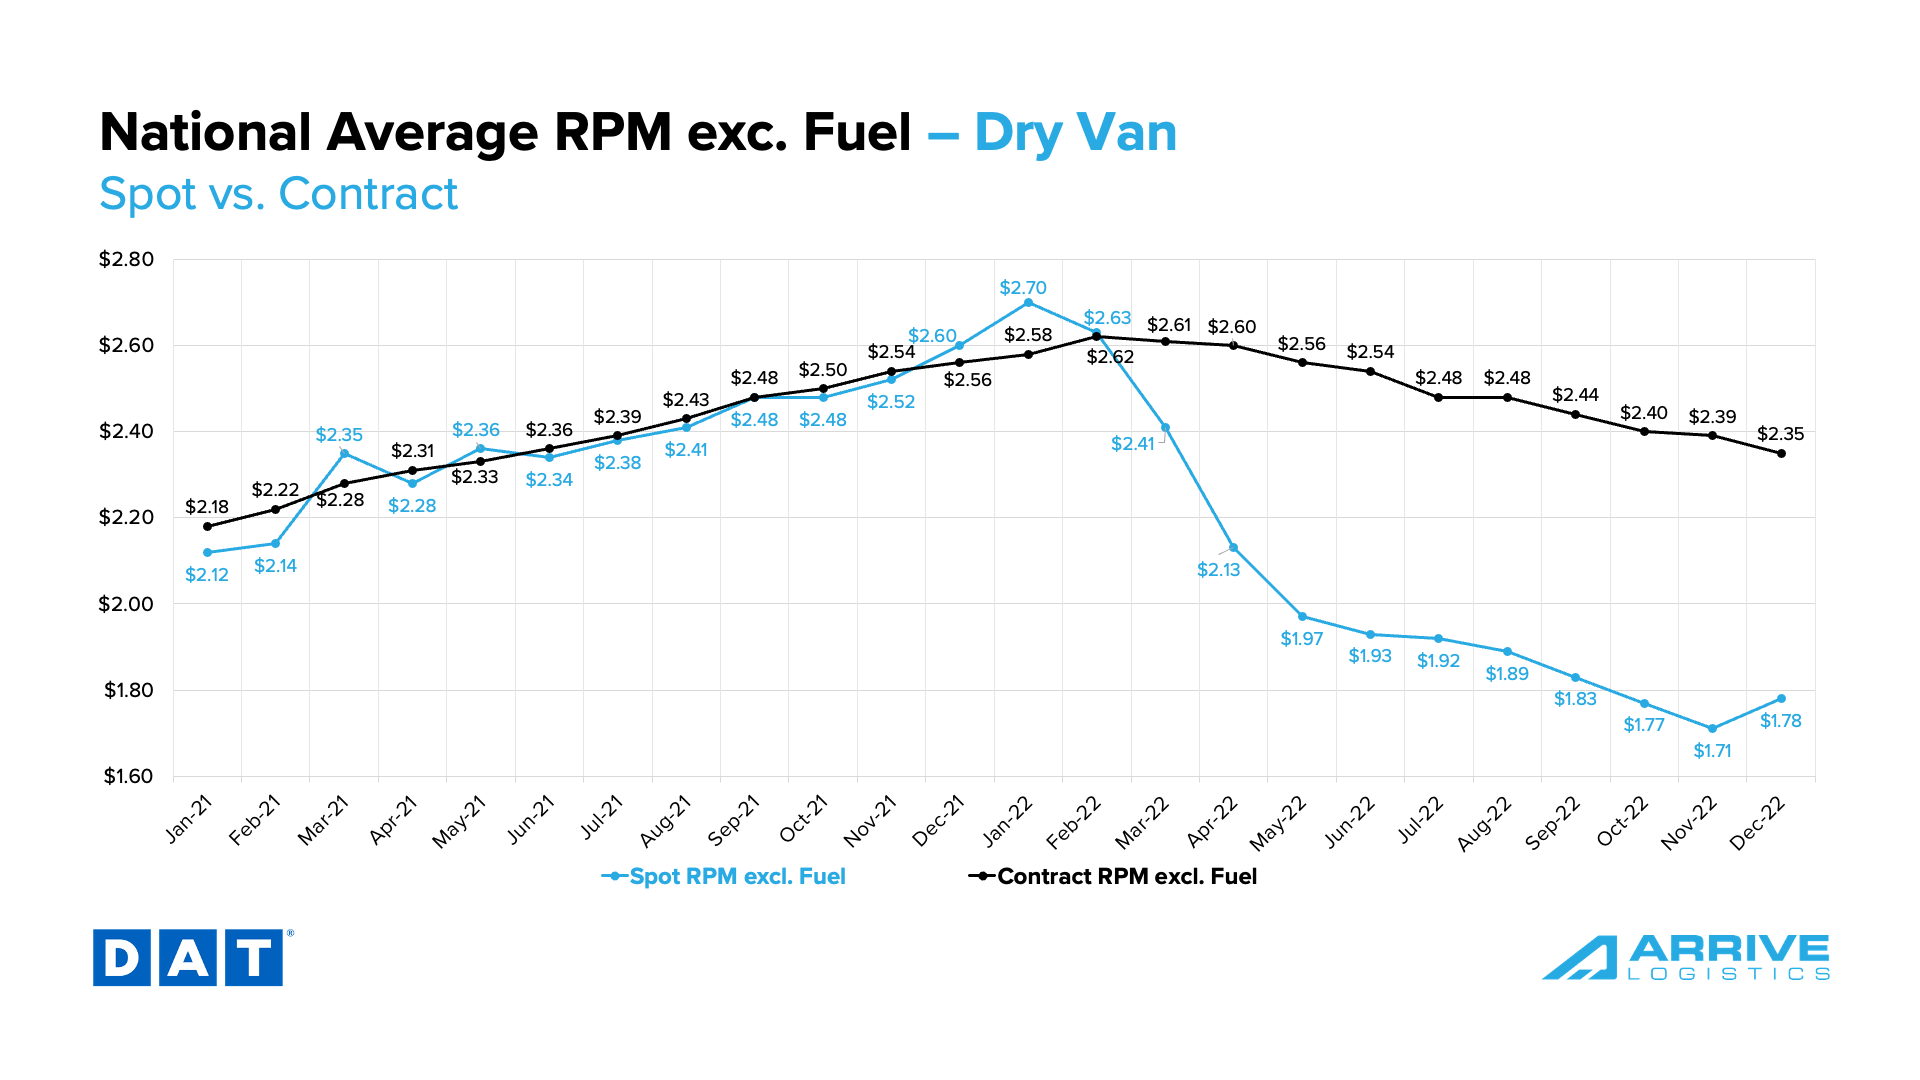 Van spot rates surged in early December while contract rates fell abruptly, a sign declining contract rate trends will continue into 2023 no matter what peak season means for spot rates.
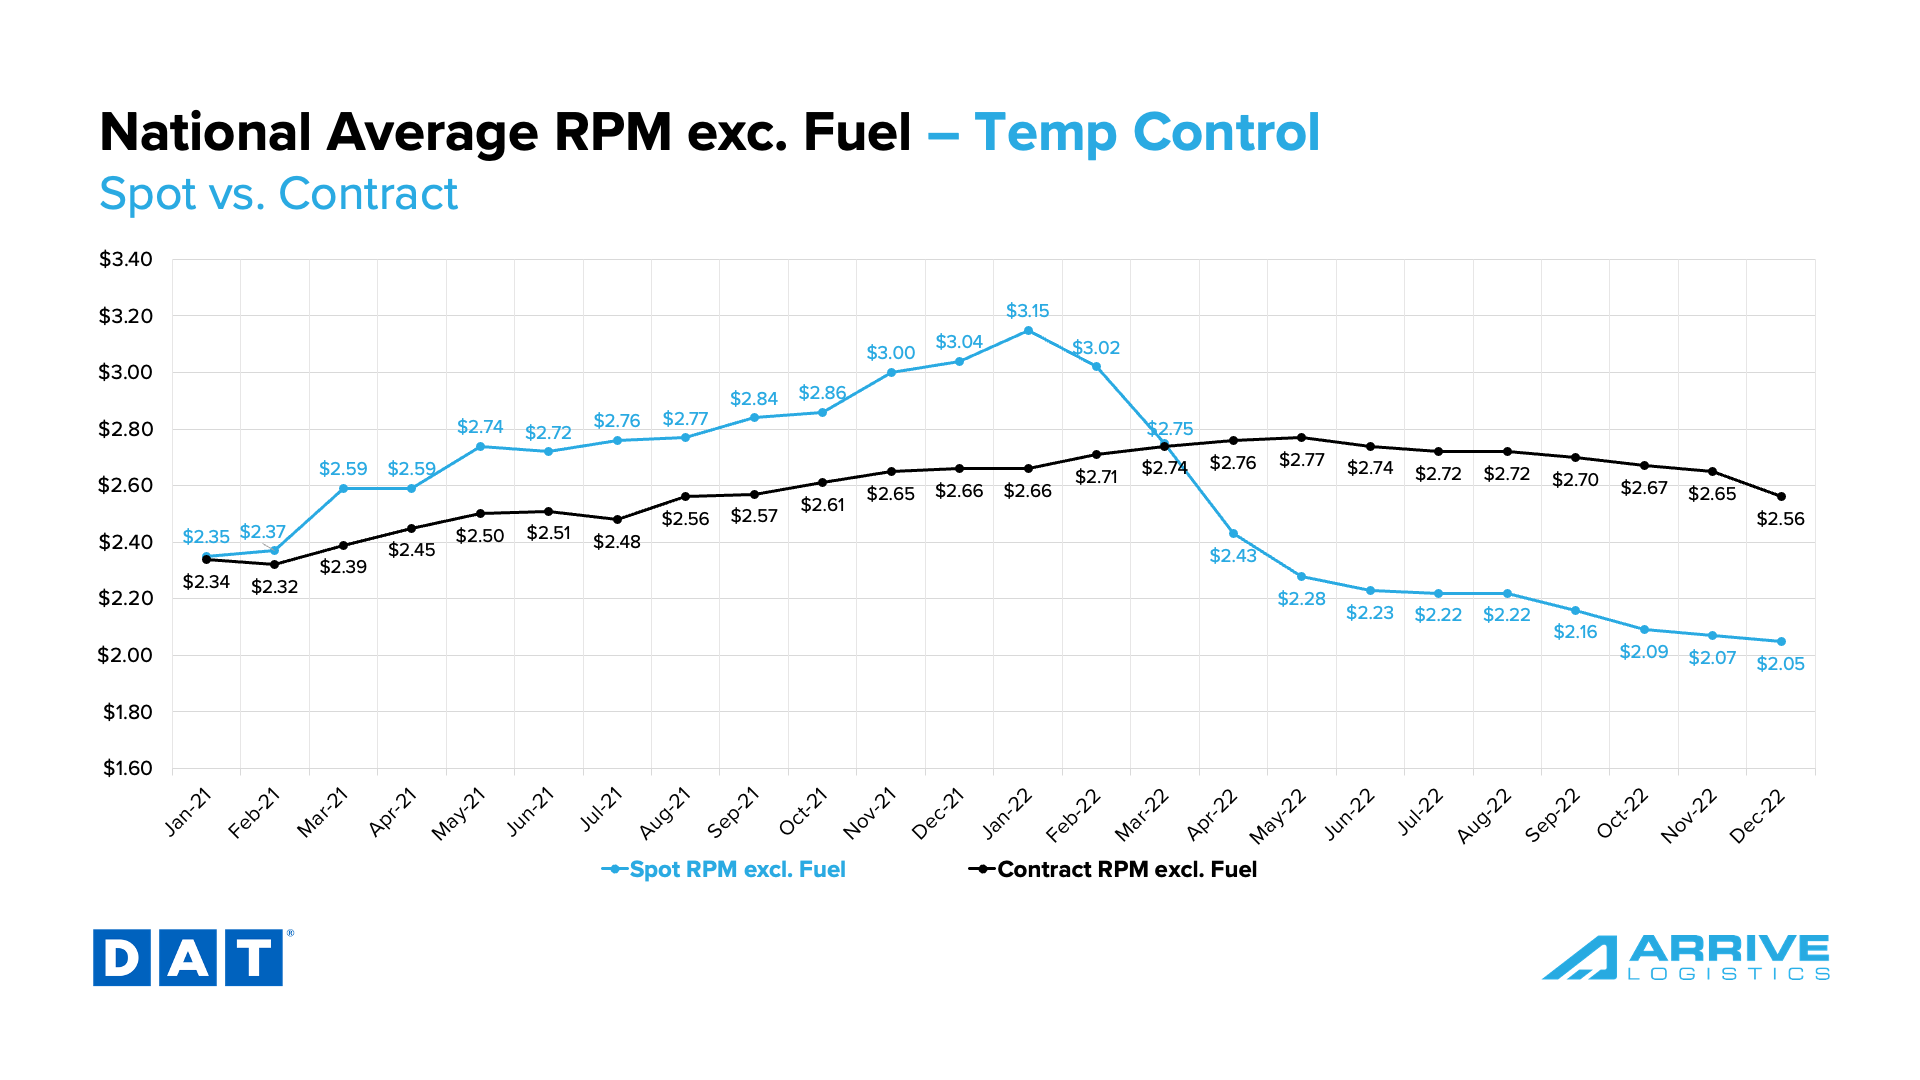
Following a similar pattern to van rates, reefer contract rates trended down early in the month, but reefer spot rates have yet to see the same upward movement. The current reefer contract rate is $2.56 per mile, excluding fuel, making for the seventh straight monthly decline. The current reefer spot rate is $2.05 per mile, excluding fuel — a 33% decrease from $3.04 per mile in December 2021. Contract rates are now down by $0.10 per mile, excluding fuel, over the same period.
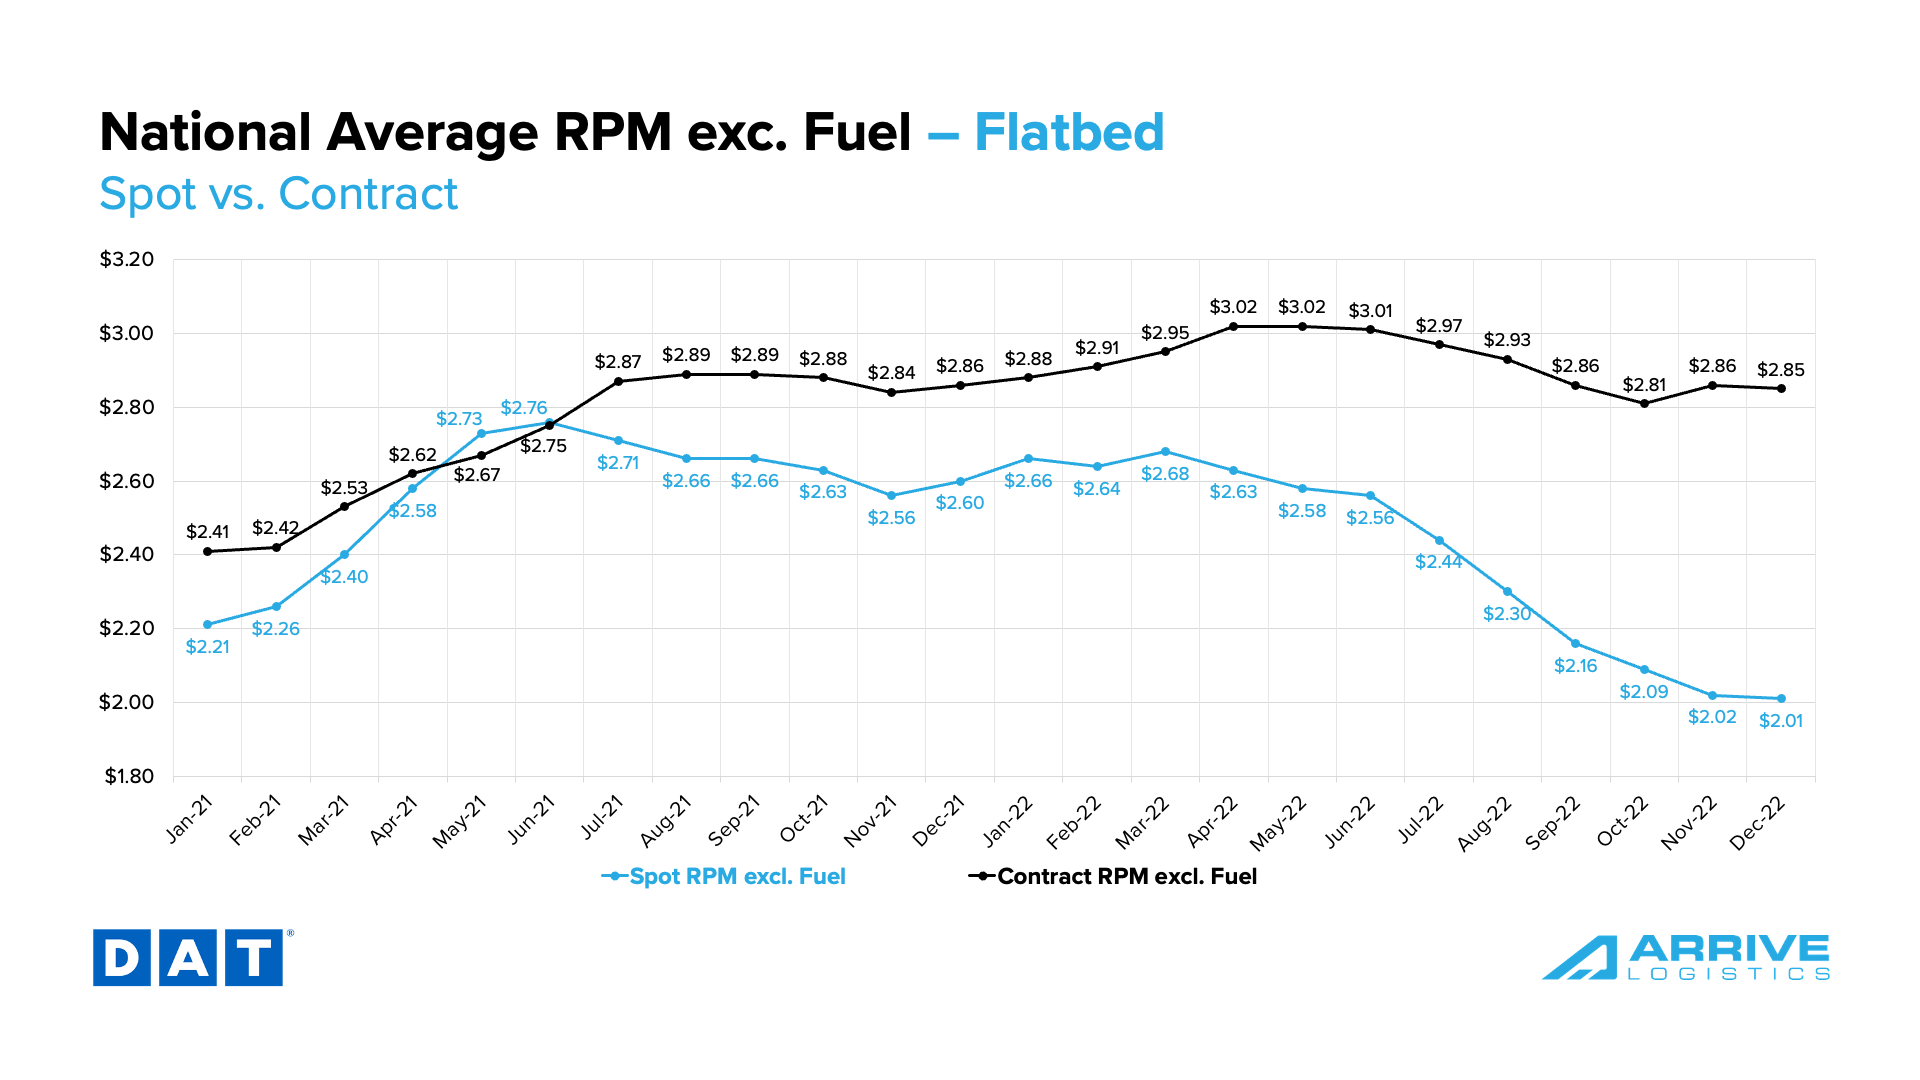
The flatbed market continues to experience spot rate declines, with the current rate at $2.01 per mile, excluding fuel — a 23% decrease from $2.60 per mile in December 2021. Flatbed contract rates remained level in early December, with the current rate at $2.85 per mile, excluding fuel. Flatbed contract rates are now down by just $0.01 from $2.86 per mile, excluding fuel, in December 2021.
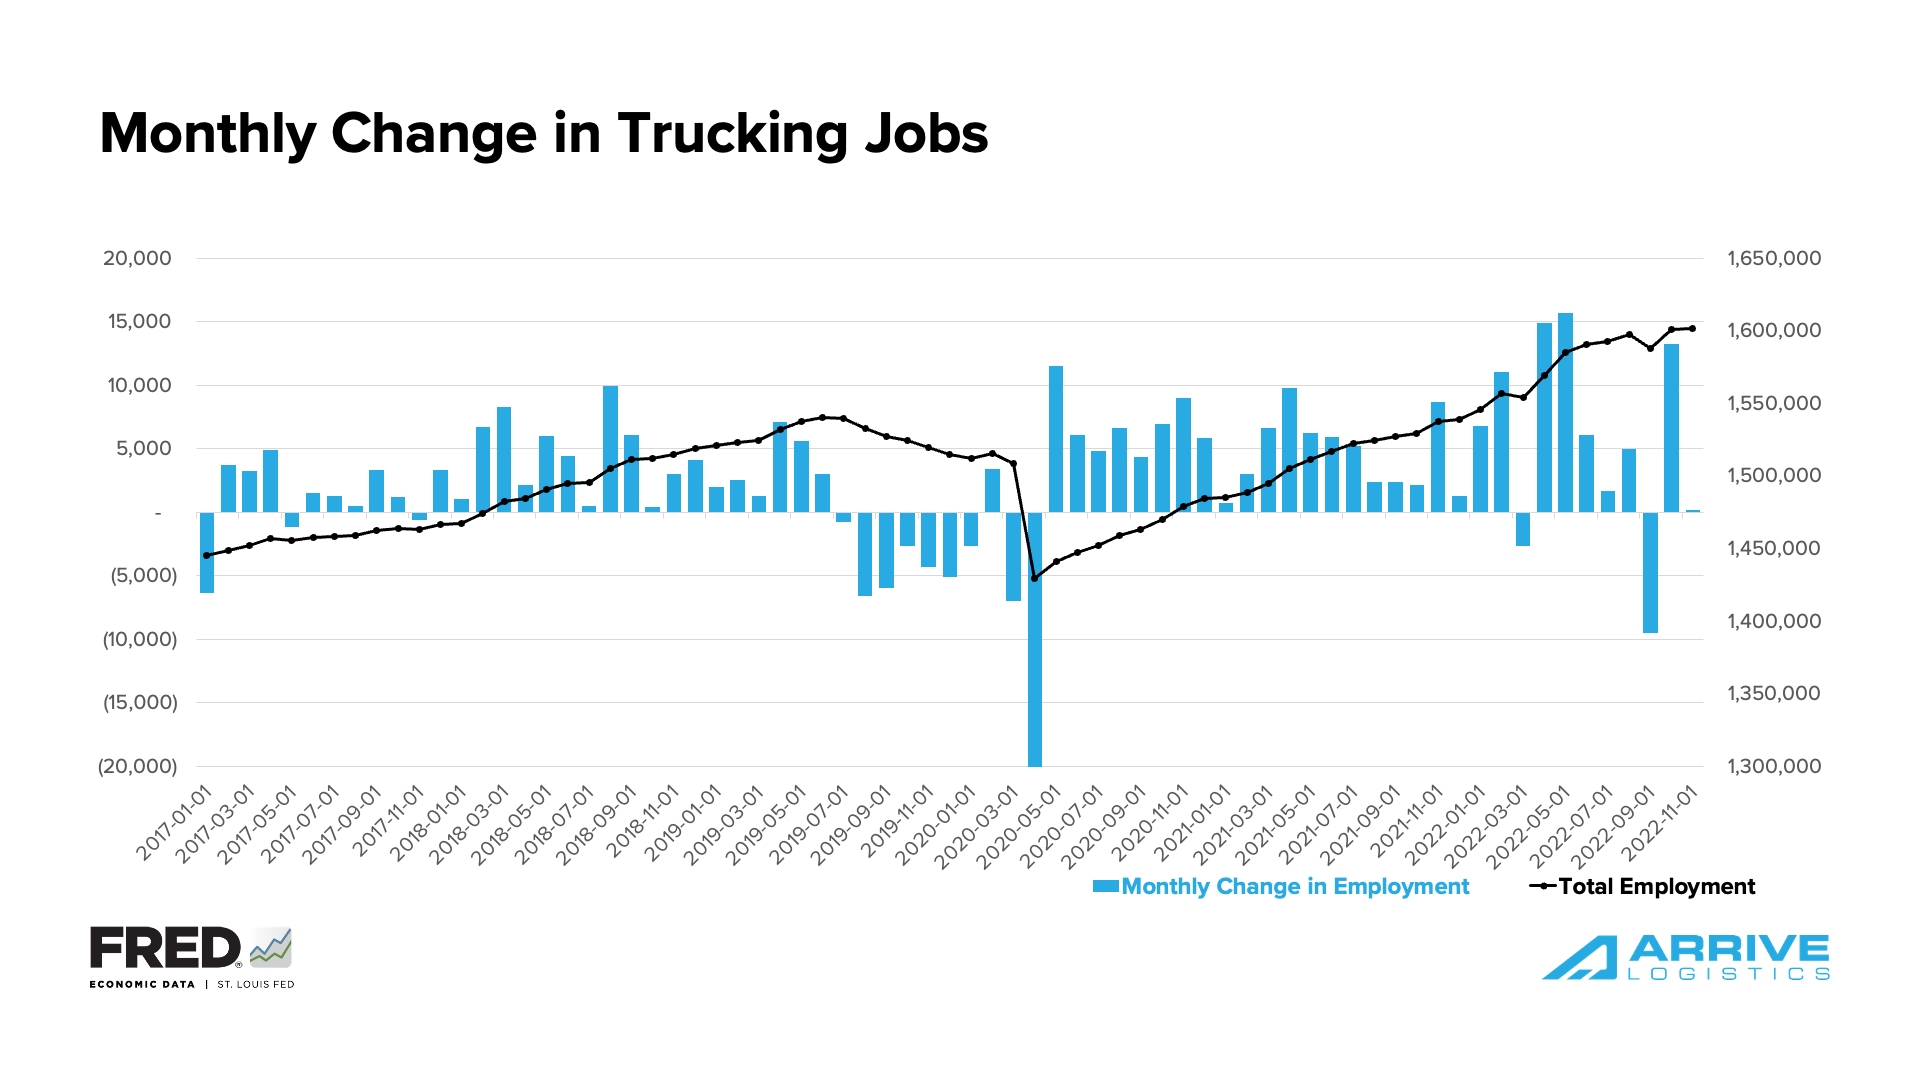
Revocations of trucking authority, as calculated by FTR, remain at historically high levels due to declining rates and the rising cost of operations. Up to this point, we believe this trend supports the theory that carriers are taking company jobs with larger assets instead of trying to survive independently as owner-operators. It proves that turnover is high in the carrier space but not high enough to say with certainty that capacity is leaving the market. In fact, total jobs in trucking reached a new all-time high in November.
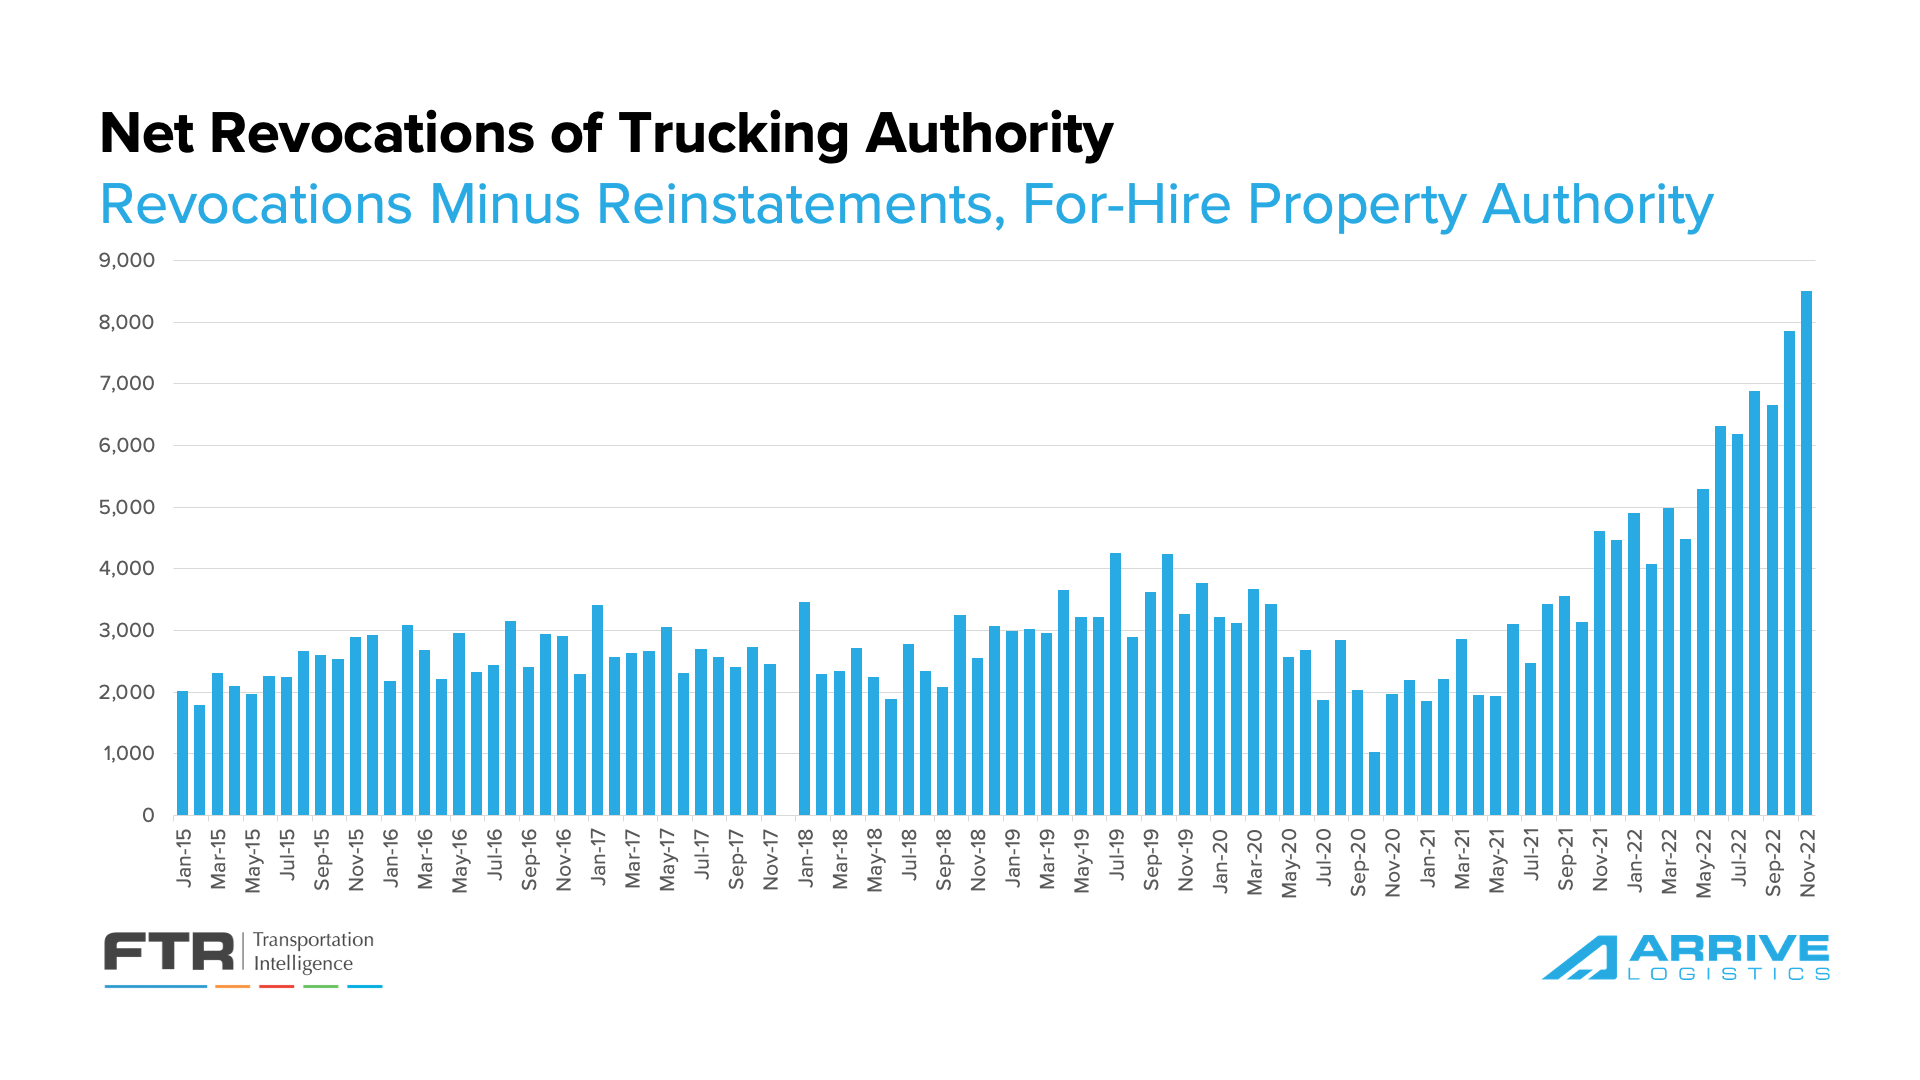
The job growth during the pandemic appears to be flattening in recent months, indicating that the number of drivers leaving the market is beginning to surpass the total number of owner-operators taking company jobs. These individuals are now represented in the trucking employment numbers as they sign on to the larger asset carriers since the owner-operator headcount is not included in employment data.
If demand falls in the new year, larger carriers will begin to see less need to add drivers. In that case, we would expect to see trucking employment trend in the opposite direction, leaving a depleted workforce vulnerable to future surges in demand.
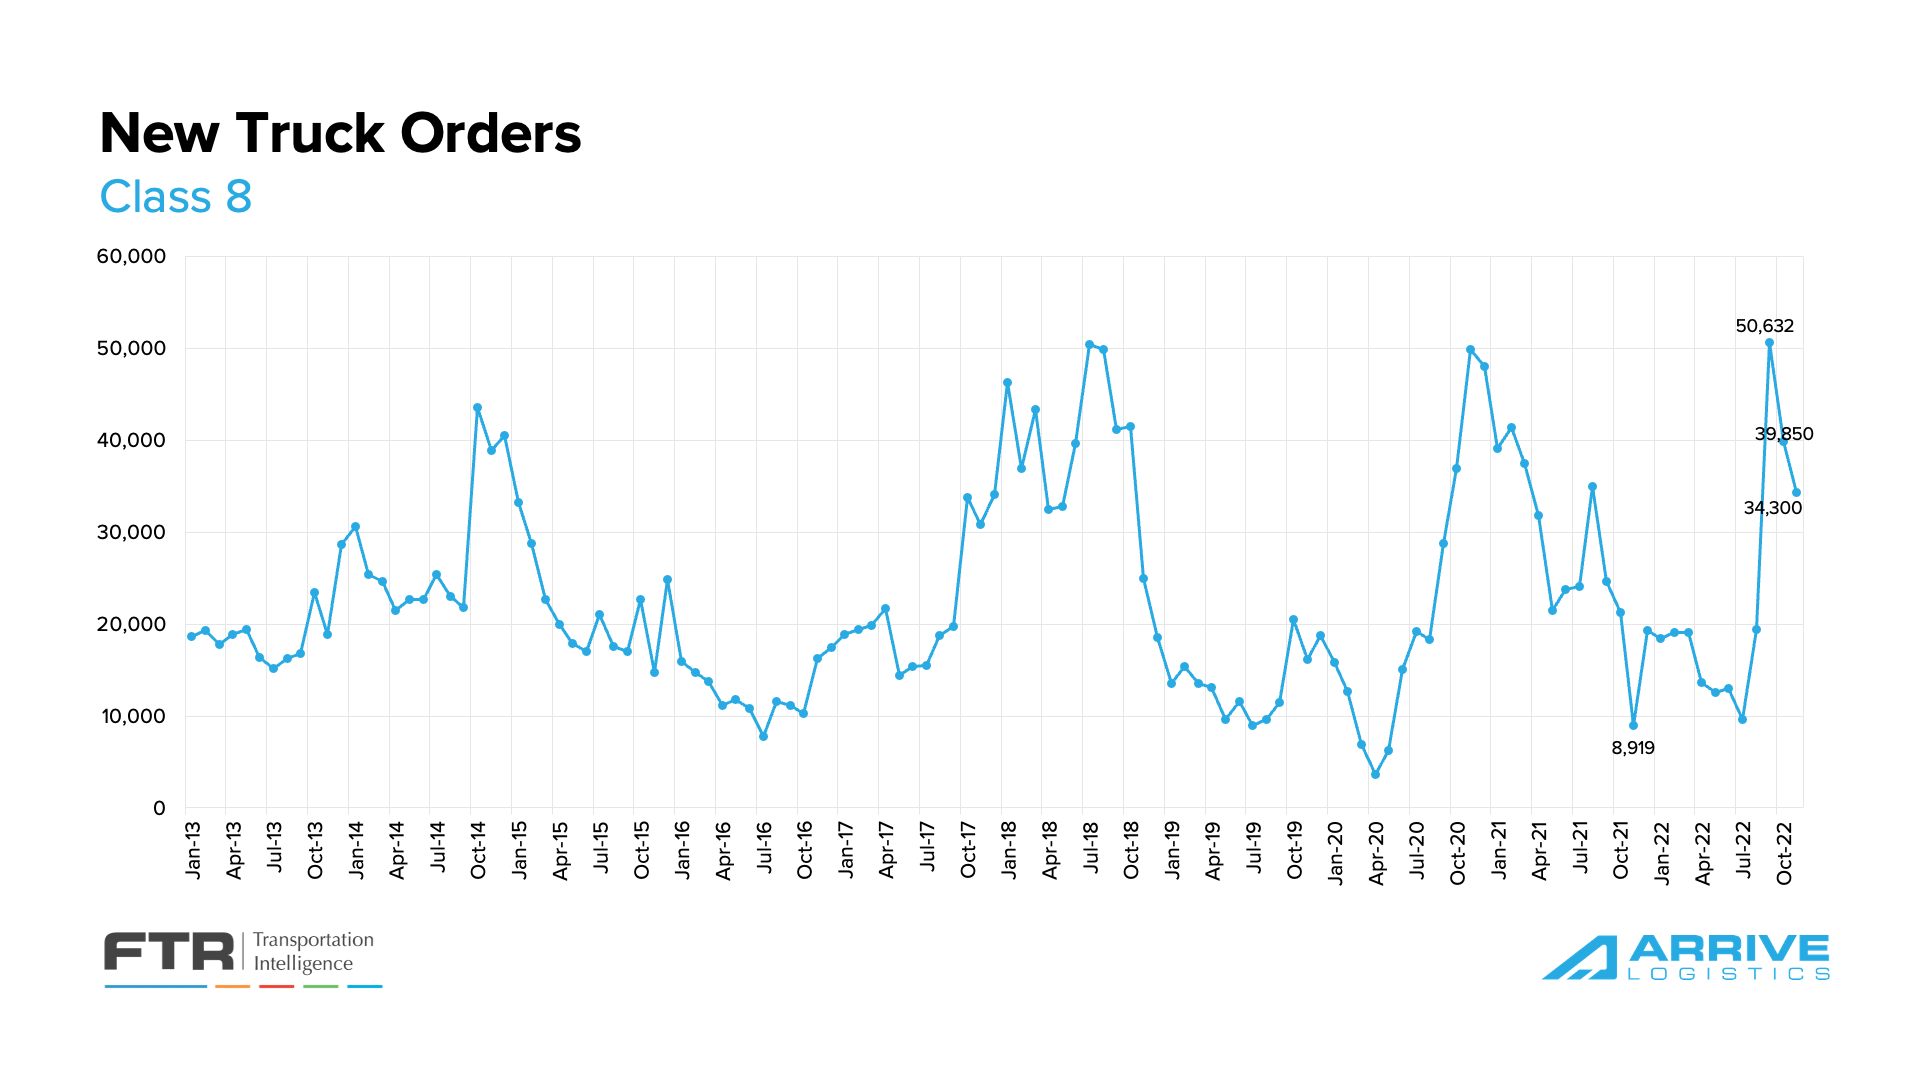
According to FTR, New Class 8 truck orders fell to 34,300 in November. Demand for new equipment remains relatively strong, driven by pent-up replacement demand due to several years of limited production that prevented many fleets from replacing aged equipment.
However, FTR indicated that most OEM build slots for 2023 are full, and these production limitations likely mean new orders will fall in the coming months. From this perspective, we do not consider new truck orders a good indicator of carrier sentiment about future demand. Healthy order numbers are required to replace aging equipment, and OEM’s are metering the actual number of orders based on their production capabilities. Despite declining orders, growing backlogs have resulted in an increase in the average time from order to delivery from 7.5 to 8.1 months.
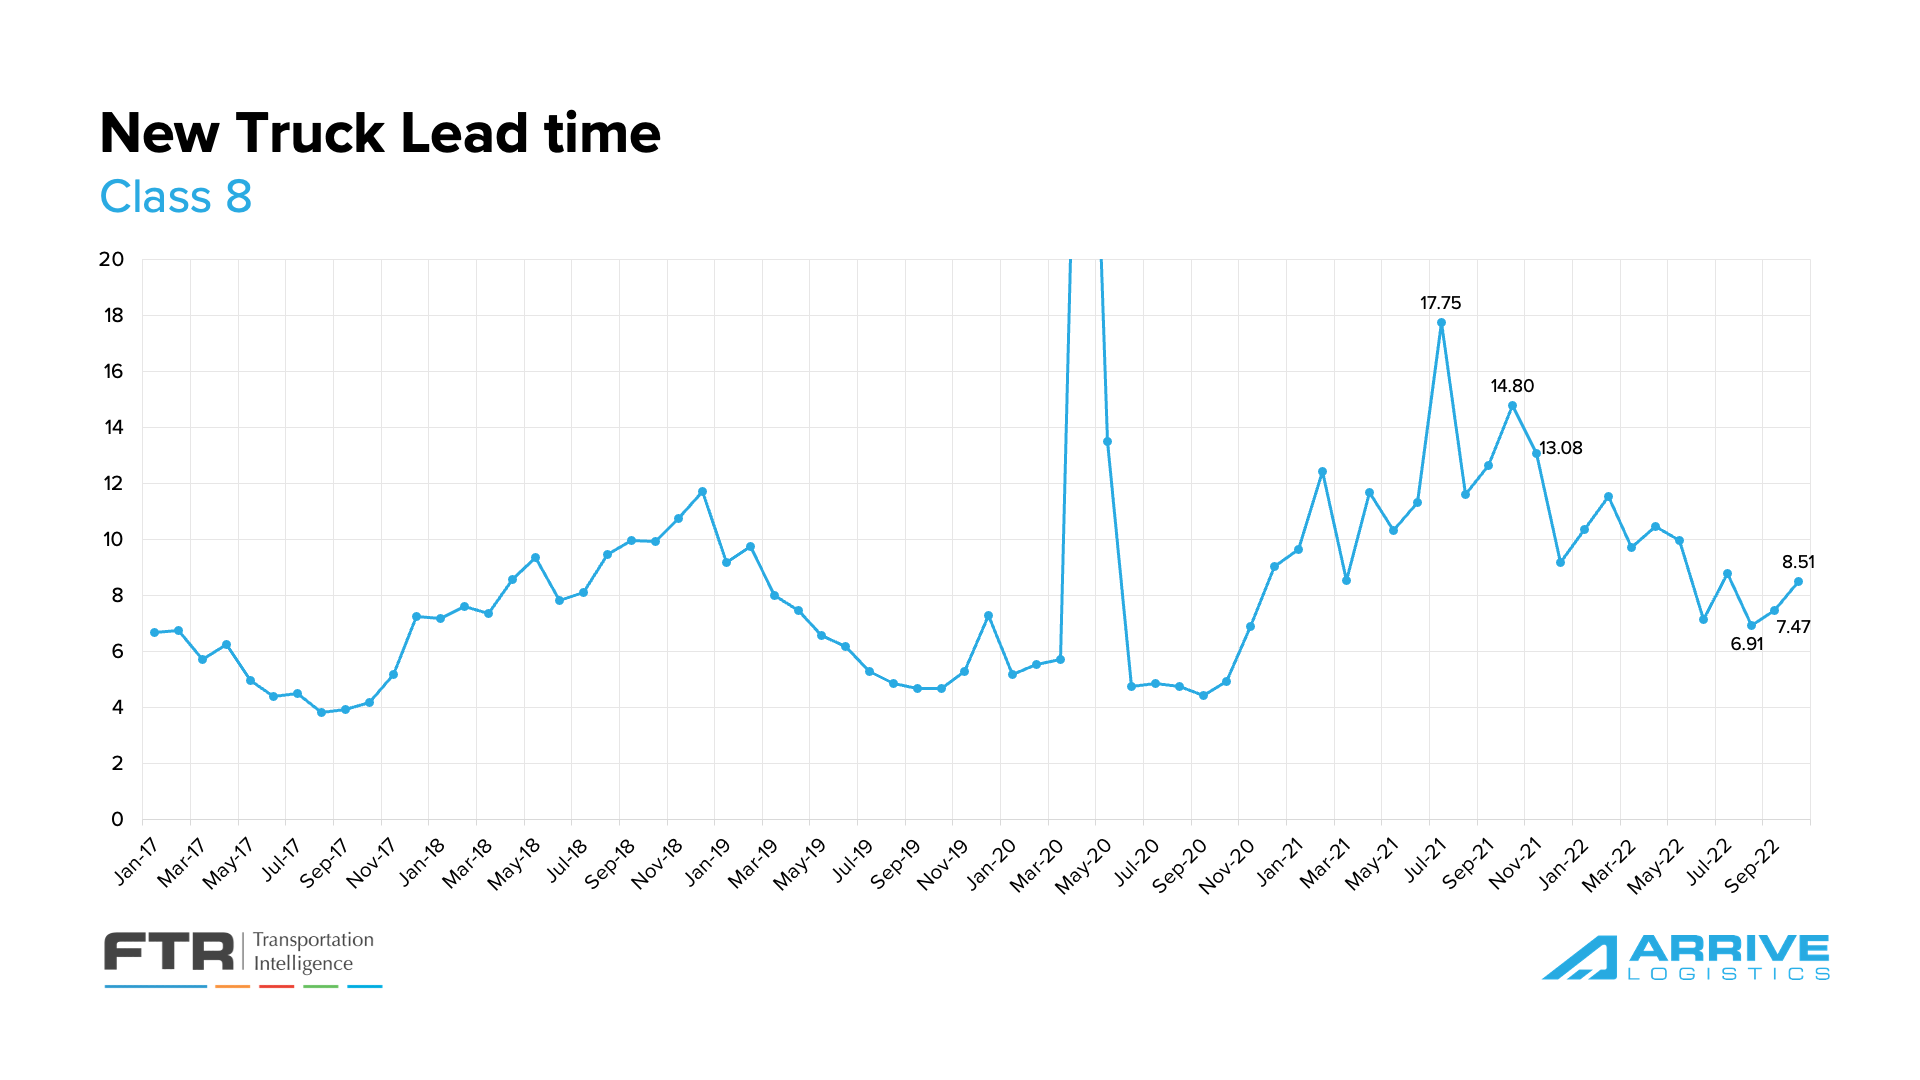 New truck lead time increased from 7.47 months in September to 8.5 months in October. Source: FTR
Shippers in Arrive’s network continue to note the value of drop trailers in creating warehouse efficiencies amid labor challenges and overstocked inventories. The ability to plan has limited unnecessary dwell times and detention payments to carriers. Drop trailers also benefits carriers, who are getting increased asset utilization on tractors by spending less time waiting for loads to be loaded or unloaded. As a result, trailer orders jumped 91% month-over-month, maxing out filling build slots through the first quarter of 2023. Net orders are now up 161% year-over-year.
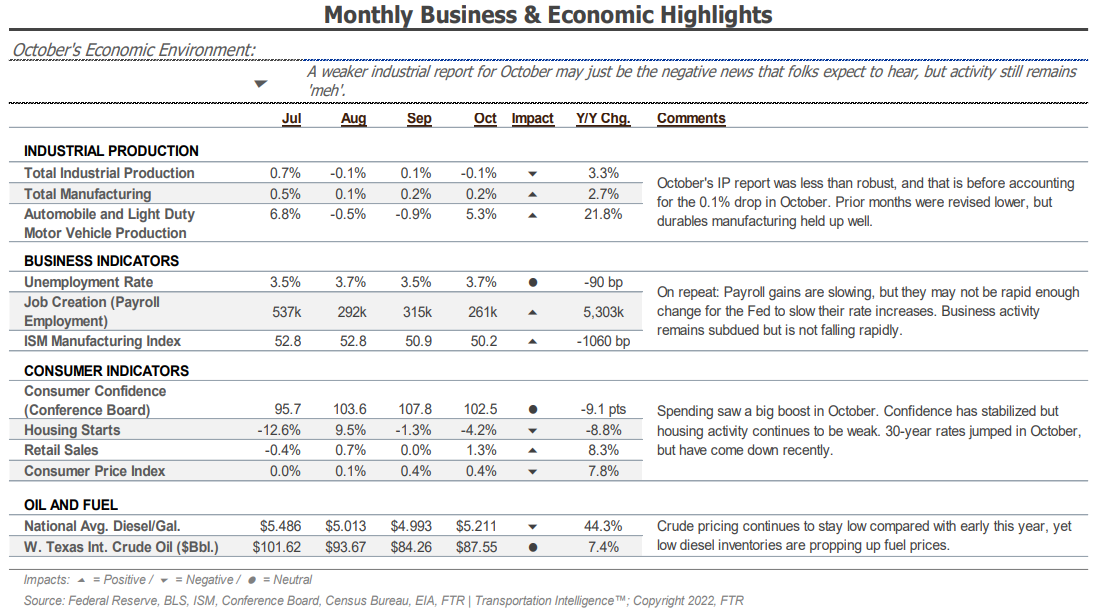
Future demand indicators are slightly less optimistic than a month ago due to persistently high inflation and the FED increasing interest rates, which will eventually lead to declining volumes. Additionally, imports are forecasted to trend as low double-digit negative growth in early 2023, and the manufacturing sector, as measured by ISM, is slipping into contraction for the first time since the start of the pandemic.
On a positive note, consumer spending remains strong enough to hold demand above historical levels despite dipping below 2021 highs; this is in line with our view that volumes will continue to ease in 2023 but do so gradually.
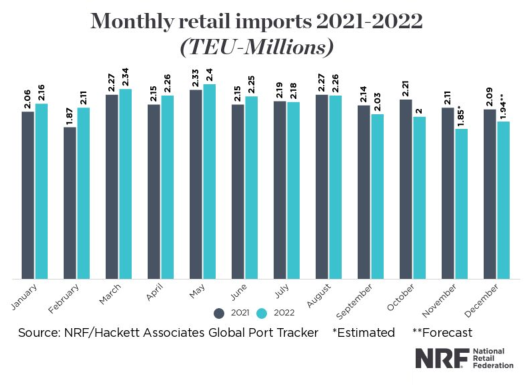
Import levels, a key contributor to overall truckload demand, are projected to fall 7.5% month-over-month and 12.3% year-over-year to 1.85 million TEUs in November. The decline is partially due to elevated inventories in the retail sector, where surpluses and full warehouses have forced pullbacks in new shipments from overseas; this is supported by strong retail spending. However, the National Retail Federation is forecasting more pullbacks in early 2023, with an annual decrease greater than 20% expected in February.
The ISM manufacturing report indicated easing backlogs as production increased and new orders slowed. The sector contracted for the first time after 29 straight months of expansion. Manufacturing was forecasted to be one of the main drivers behind continued volume strength in the new year; if contraction persists, it becomes more likely demand will fall further than previously forecasted.
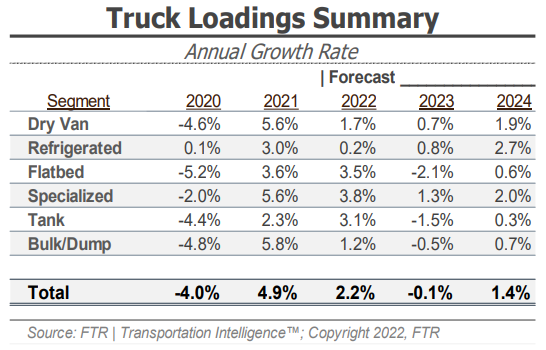
According to the previous report, FTR’s latest truck loadings forecast of a 2.2% year-over-year increase in 2022 is down from 2.5% last month. The 2023 forecast continues to show an increased risk to the downside and has been revised to -0.1% growth from 0.9% as of the last update and 2.0% before that. A widely weaker forecast explains the decline for most major commodity groups.
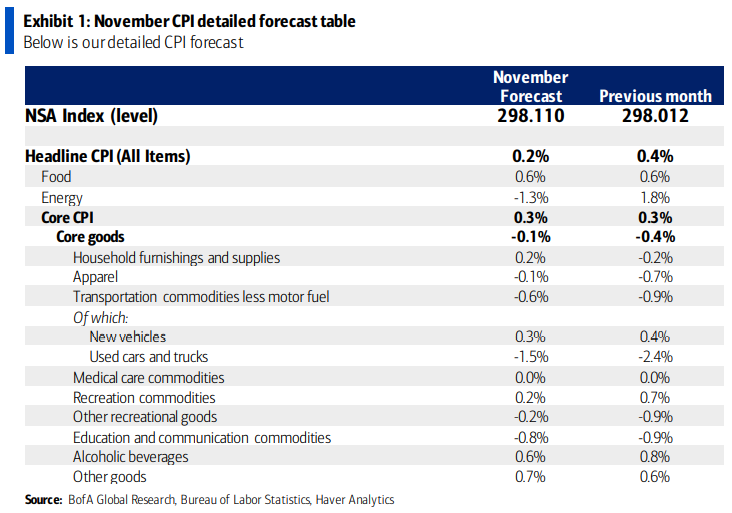
Although November CPI data has yet to be released at the time of this report, BofA is estimating that headline CPI increased by 0.2% month-over-month in November, and as a result, year-over-year growth would decline from 7.7% to 7.3%. Year-over-year core CPI growth is also expected to fall from 6.3% to 6.1%; BofA noted that improvements in energy prices were a factor but that food price inflation would remain “sticky-high” at 0.6%.
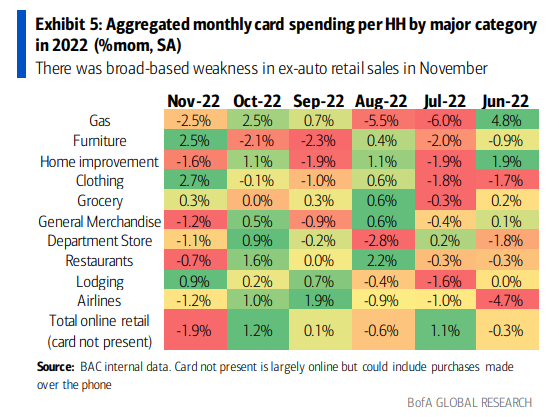
According to Bank of America card spending data, year-over-year consumer spending grew by 1.7% in November. That’s down from 3.1% year-over-year growth in October after rising just 0.1% month-over-month on a seasonally adjusted basis. BofA notes sizable decreases in many retail categories, including gas, online retail and home improvement, as factors for the change.
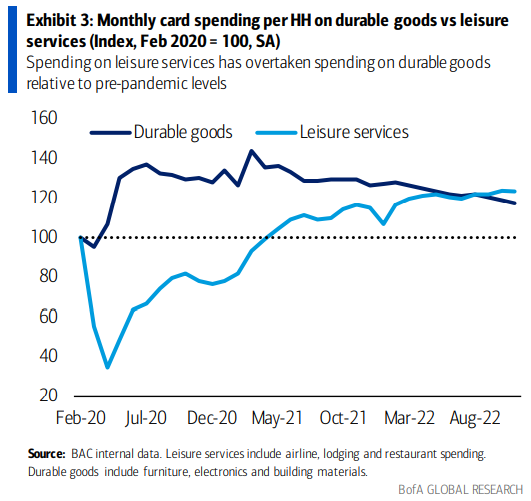
Consumer spending on durable goods remains elevated but is being outpaced by leisure services spending relative to pre-pandemic levels. Airline travel, in particular, is a category that has seen significant growth and is a sign consumers are traveling more.
BofA concluded its analysis with the view that spending is gradually softening and the expectation that consumers will remain relatively resilient as long as the labor market stays tight.
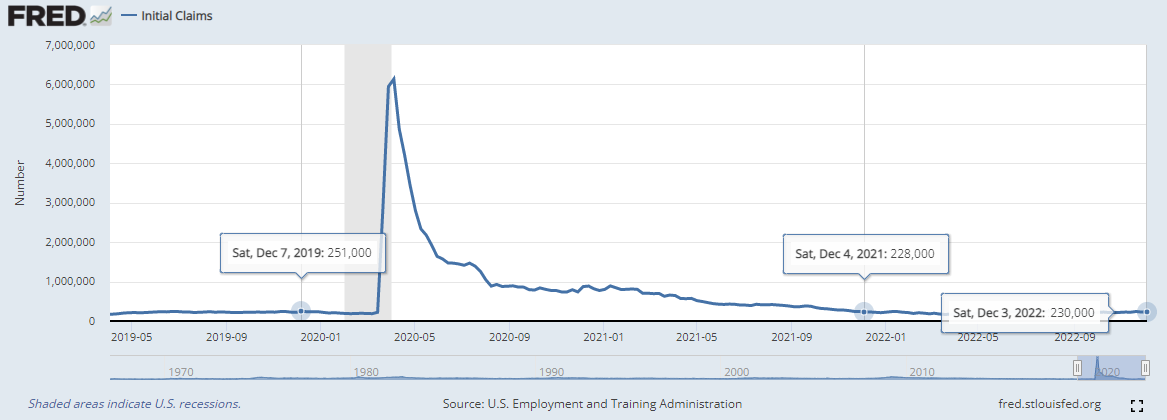
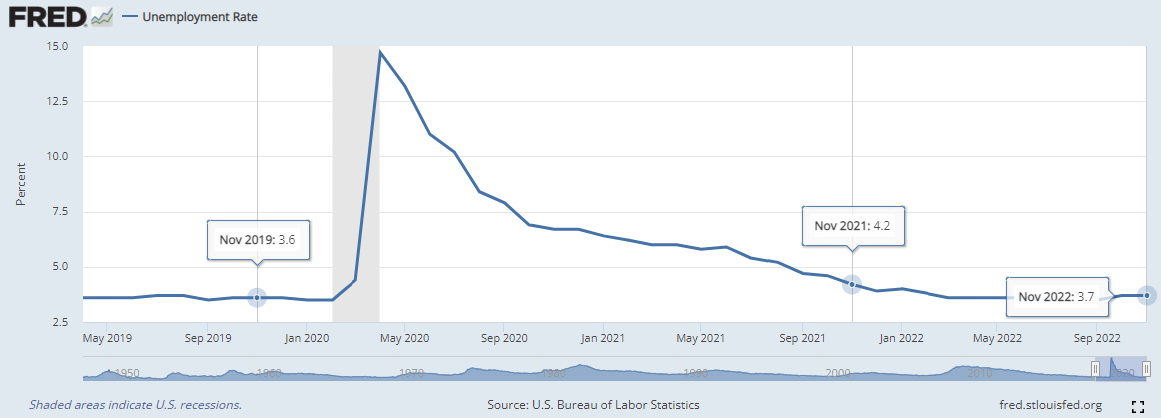
Initial jobless claims rose slightly in the first week of December; however, they were almost exactly the same as a year ago and actually down from pre-pandemic levels. The unemployment rate was also nearly flat compared to November 2019 and down from November 2021, a sign that the labor market remains tight despite recent reports of layoffs.
The strong labor market signals confidence in consumers’ ability to maintain current spending levels and prevent any crash that could suddenly lead truckload demand off a cliff.