
December truckload demand remained relatively consistent with expectations, as spot-focused index trends continued to show significant declines in year-over-year activity while contract indices remained more stable. Our takeaway from these opposing trends is in line with recent reports: Overall, demand remains healthy but continues to see large allocations moving via primary contract carriers.
The FreightWaves SONAR Outbound Tender Volume Index (OTVI), which measures contract tender volumes across all modes, was down 25% year-over-year (3.3% month-over-month), or 9.6% when measuring accepted volumes after the significant decline in tender rejection rates.
Given inflated consumer-ready retail inventories and slowdowns in retail import shipments, this year-over-year contract volume decline is consistent with the pullback we expected. However, such a significant decline is inconsistent with other sources meant to capture overall truckload demand, providing further evidence that FreightWaves data is likely heavily skewed toward retail freight rather than the overall market. Though unconfirmed by FreightWaves, considering retail-related demand has slowed substantially since Q4 2021, it would help explain the significant drop in tender volumes in recent months.
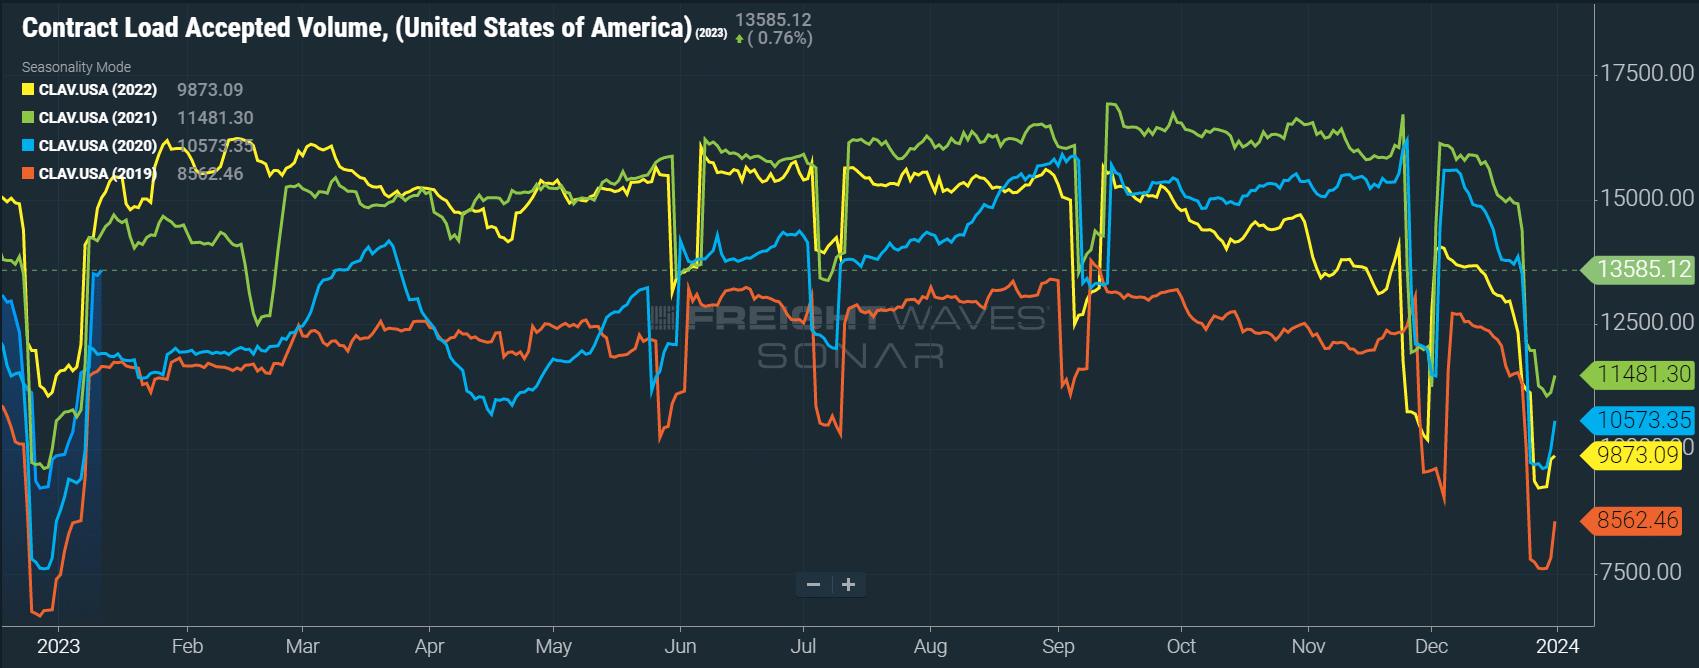
Accepted contract volumes are down 9.6% y/y in early January but remain above historical pre-pandemic levels.
With retail down, industrials and manufacturing remain the sectors most likely responsible for driving volumes. The Cass report indicated year-over-year volumes were down 3.9% in December after falling 3.3% month-over-month from November. This trend illustrates shipment volumes are declining compared to last year, but much more gradually.
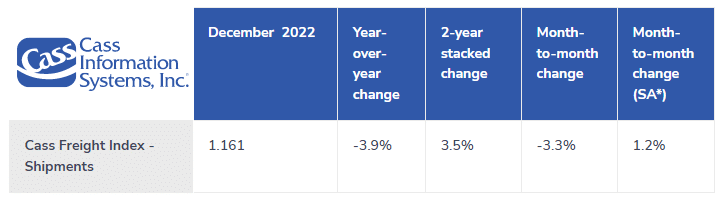
The Cass Freight Index indicated year-over-year volumes were down 3.9% in December but remained up 3.5% compared to 2020, a sign that overall demand remains healthy.
An alternative method to measuring demand is the ton-miles index. It can sometimes better estimate how much freight is moving and how far it has traveled, as volumes do not account for how full trucks are or haul distance. It is also spot and contract agnostic and thus offers a more complete view of the total market.
One such index is the For-Hire Trucking Ton-Mile Index (TTMI), published by Jason Miller, a professor at Michigan State University, and Yesimi Bolumole, a professor at The University of Tennessee, Knoxville. The most recent revision of the index indicates that total ton-miles in November 2022 were up 1.1% year-over-year. While this data lags slightly, it supports the assessment that demand is declining gradually instead of sharply.
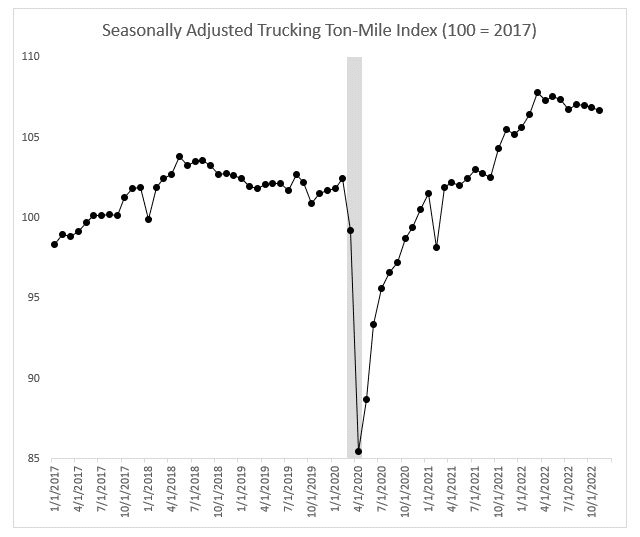 Trucking Ton-Mile Index, published by Jason Miller, a professor at Michigan State University and Yesimi Bolumole, a professor at The University of Tennessee, Knoxville.
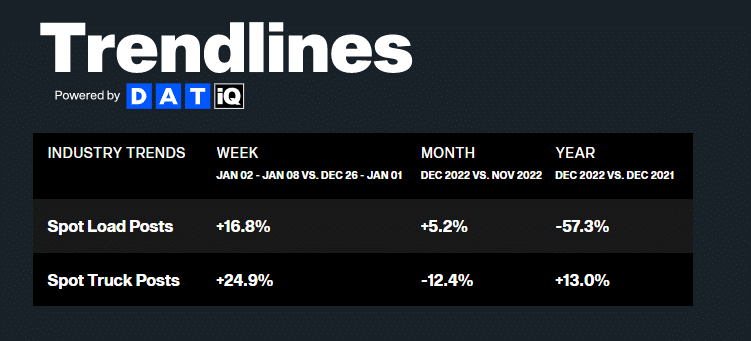
Contract still leads the way as spot volumes continue to suffer as shippers experience ongoing strong routing guide compliance. DAT data shows year-over-year spot volumes declined 57% in December, despite increasing 5% month-over-month from November. The increase in spot posts was likely due to disruption caused by widespread severe winter weather during the week leading up to Christmas.
The market faced its first real disruption in almost a year in December. Recent trends indicate that this was short-lived and brought about by a combination of factors, including severe winter weather and seasonal demand pressures. The impact on contract tender acceptance was less dramatic than that normal, as carriers and brokers prioritized service and protecting their freight in preparation for a year in which many expect volumes will be hard to come by.
The Sonar Outbound Tender Reject Index (OTRI) measures the rate at which carriers reject the freight they are contractually required to take. In line with typical seasonal trends, the rate increased from 3.83% on the 12th to 5.77% on the 29th. However, this was the lowest peak observed since the creation of the index. Reefer tender rejections moved slightly more than van tender rejections around Christmas, but overall rejection rates were low compared to historical norms.
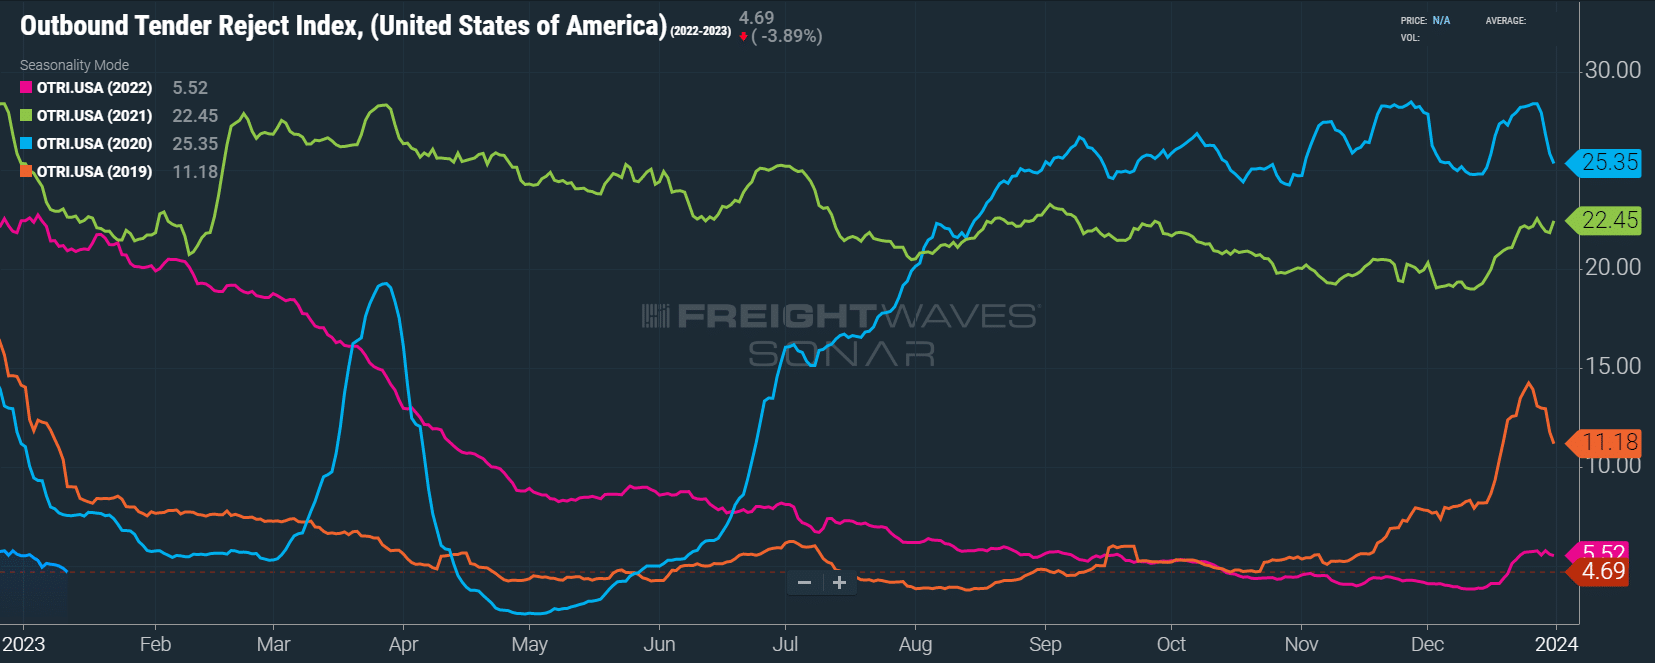
OTRI spiked in line with normal seasonal pressures around the holidays, but remains at al all time low for this time of year. A sign carriers are protecting their contract freight.
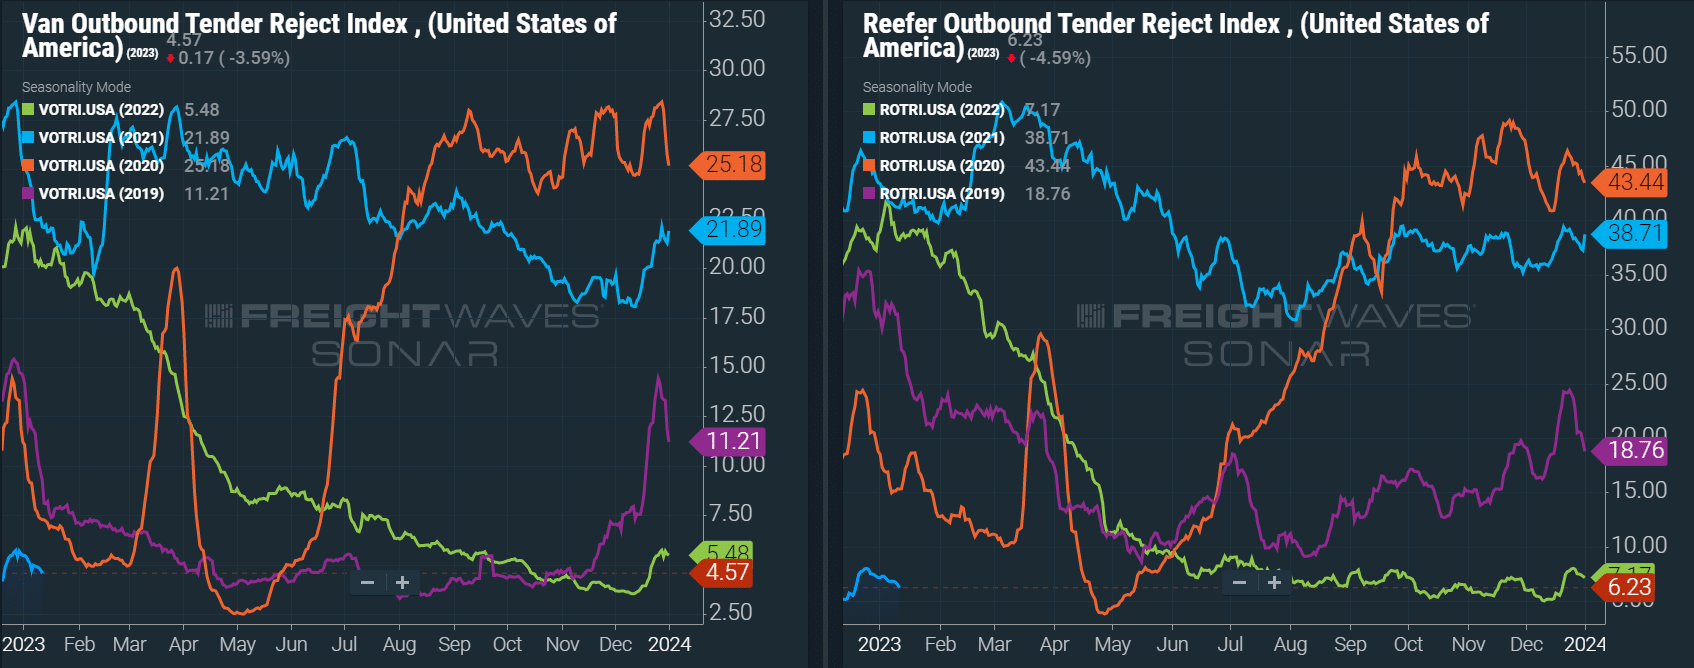
Dry van and reefer tender rejections are both trending at all-time lows for this time of year, with dry van rejection rates coming in below 5% and reefer rejections currently at 6.23%.
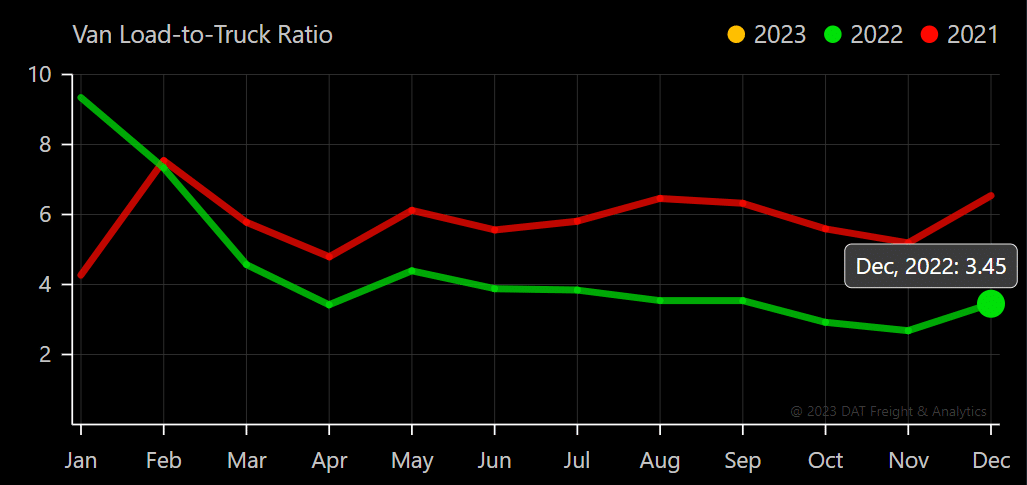
The DAT Load-to-Truck Ratio measures the total number of loads relative to the total number of trucks posted on their spot load board. In December, the Dry Van Load-to-Truck Ratio increased 28% month-over-month but remained down 47% year-over-year. This significant month-over-month increase illustrates volatility the OTRI data failed to capture fully. With carriers and brokers focused on servicing freight, the OTRI correlated more closely with participant behavior than actual market pressures. As a result, shippers with high spot exposure experienced somewhat different conditions than contractually oriented shippers.
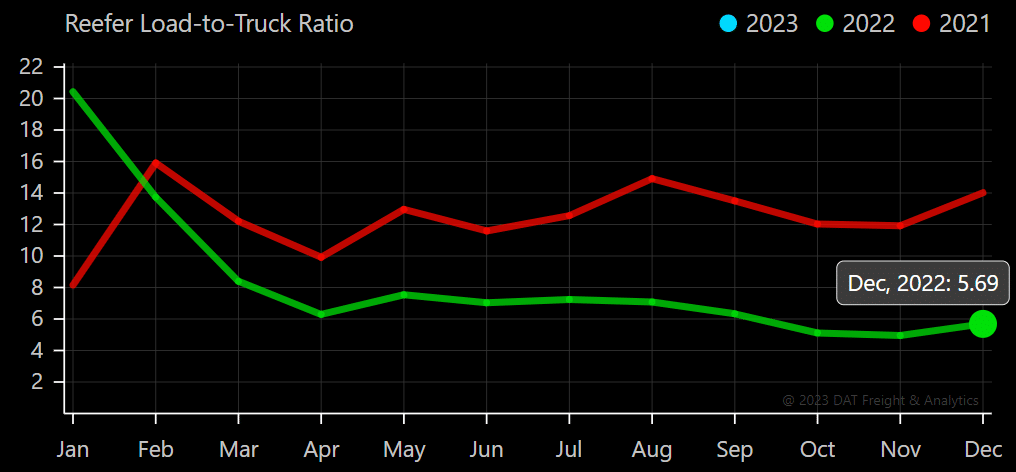
The Reefer Load-to-Truck Ratio also increased month-over-month, rising 15% from November but remaining down 59% year-over-year. The disparity between the OTRI and Load-to-Truck Ratio trends for Reefer equipment was present but less significant.
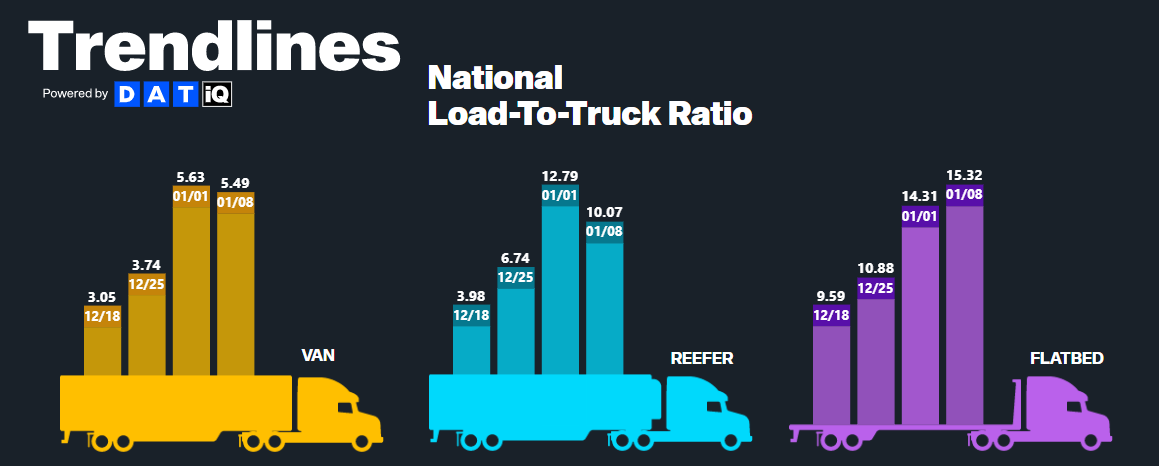
Weekly Load-to-Truck Ratio trends help illustrate the significant tightening in the spot market toward the end of the month. It showed large spikes across all three equipment types as drivers took time off around the holidays. Conditions have already begun to improve, and we expect these ratios to return to lower levels by the end of the month.
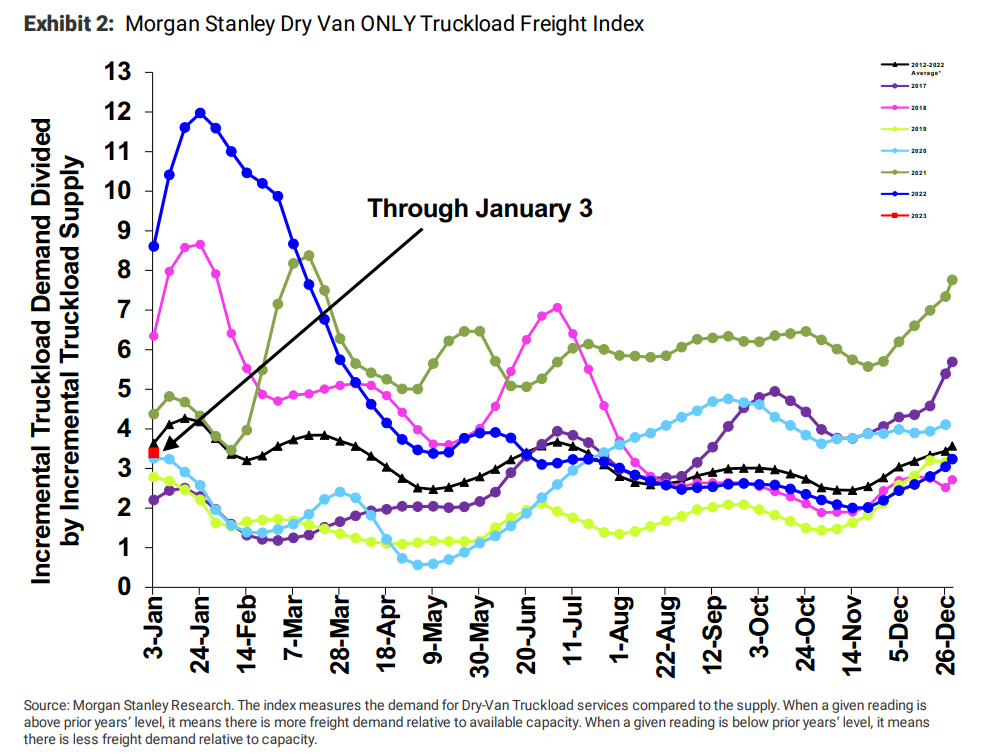
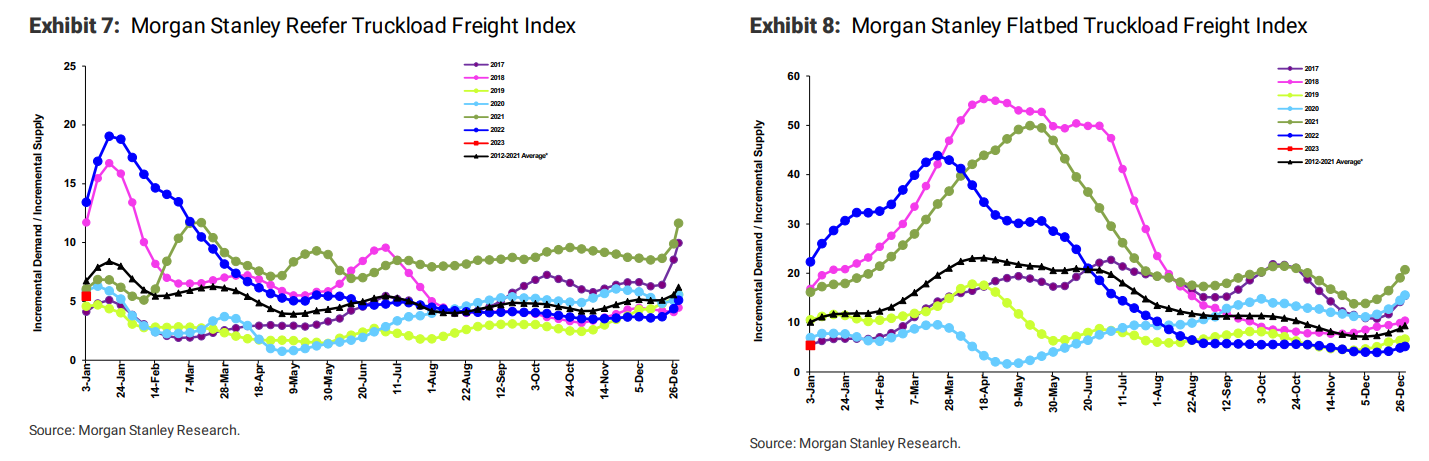
The Morgan Stanley Dry Van Freight Index is another measure of relative supply; the higher the index, the tighter the market conditions. The black line with triangle markers on the chart provides a great view of what directional trends would be in line with normal seasonality based on historical data dating back to 2007. Throughout December, trends closely followed this curve, indicating that market pressures were consistent with average historical trends. Looking forward, we expect to see softening through at least February as seasonal demand eases in the first two months of the year.
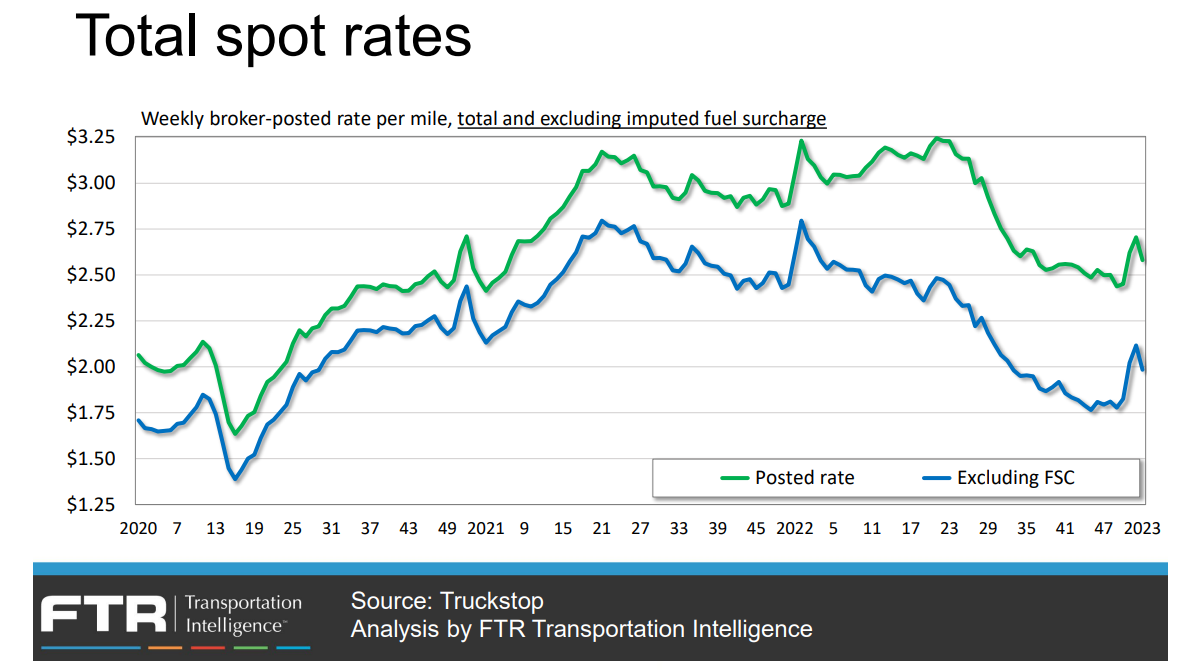
When looking at Truckstop’s weekly rate chart, it’s clear recent trends say more about the short-term spike associated with year-end and peak retail season volatility than longer-term expectations. The rate surge was significant, but as in previous years, it lasted only a few weeks before returning to prior levels. Given the current supply and demand dynamics, we expect similar trends this year.
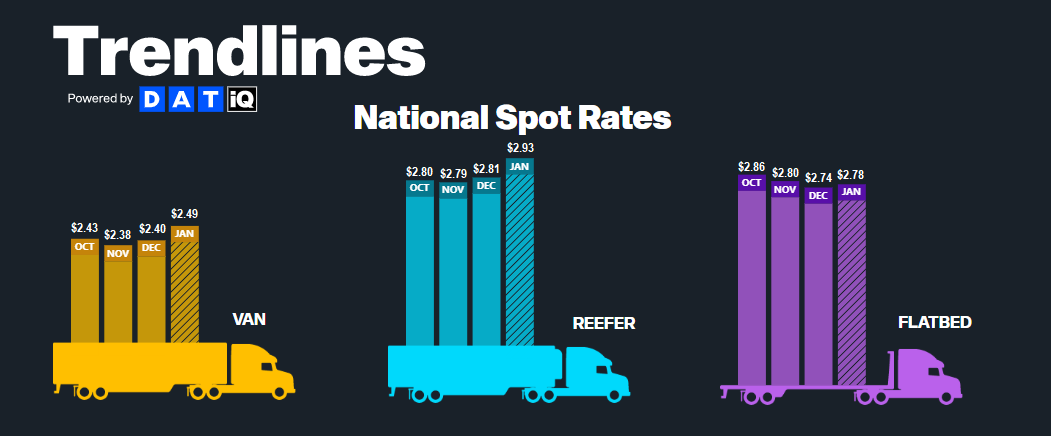
All-in spot rates, including linehaul and fuel costs, are up across all three modes in early January, influenced mainly by shipments during the period affected by driver time off, severe winter weather and seasonal demand surges around the holidays. As of January 12th, van and reefer equipment have seen larger increases than flatbed equipment, rising by $0.09 and $0.12, respectively, compared to just $0.04 for flatbed.
Early January linehaul rates show the spot market has responded to recent seasonal and other market trends, but contract rate declines have taken a pause. Anecdotally, we have heard feedback from shippers that after several years of frequent repricing and the anticipation of the market finding a floor before Q2, many businesses are waiting for the first quarter bid season to put new pricing in effect. As a result, we expect to see contract rates move lower in the coming months.
Seasonal spot rate pressures and stalling contract declines have helped close the gap between spot and contract rates by $0.23 per mile since November; this is significant, but a large disparity remains and should continue to drive downward pressure on contract rates for the foreseeable future, especially as we see spot rates return to pre-holiday levels.
The recent rise in spot rates does not change our 2023 forecast. We expect further spot declines in the first quarter and contract to continue to fall in the coming months as more shippers lock in lower pricing and as new business goes live.
On a year-over-year basis, all-in spot rates are down 20%, and linehaul spot rates are down 30%. All-in contract rates are down for the first time, falling 2.3% year-over-year, and linehaul contract rates are down 8.1%. Contract rates, excluding fuel, remain down 9.5% from their peak in February 2022.
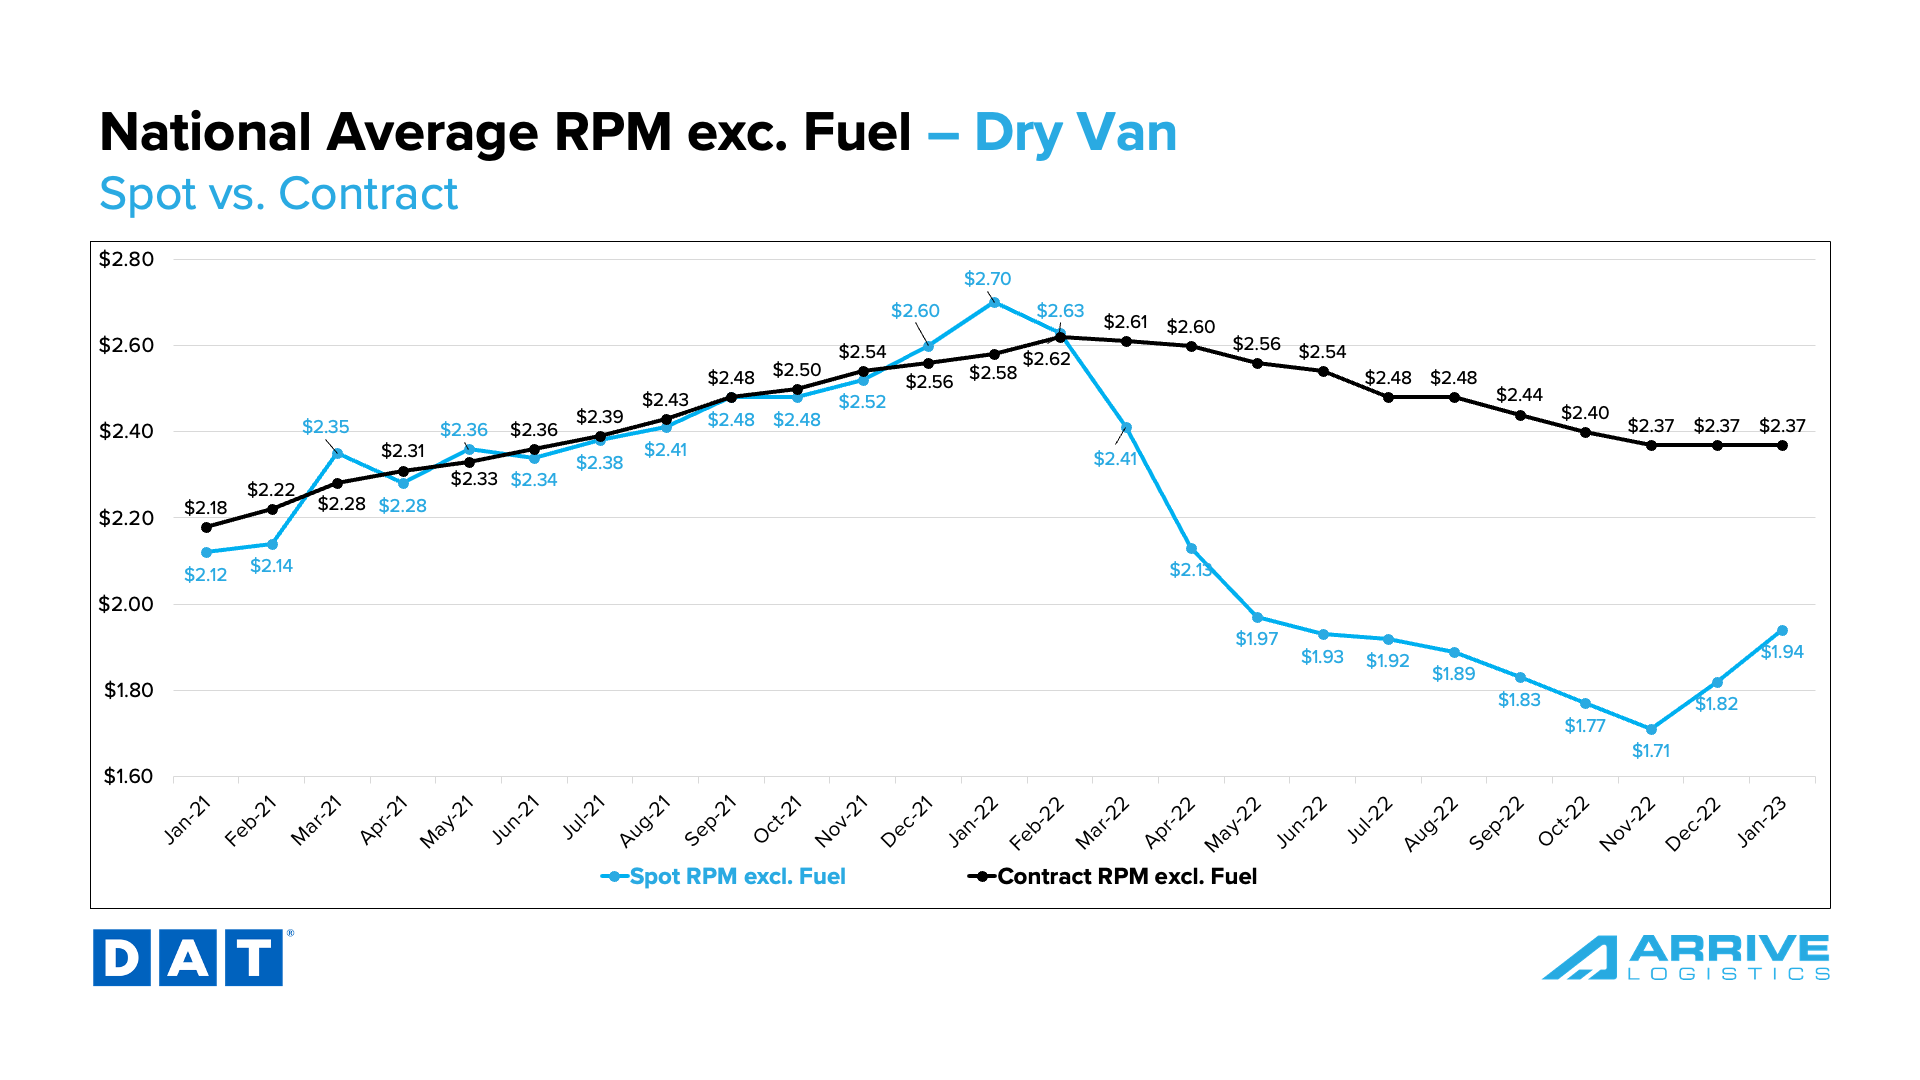
Van spot rates surged in late December and early January as the spot market heated up. We anticipate rates to fall in Q1 as supply and demand rebalance to pre-holiday conditions.
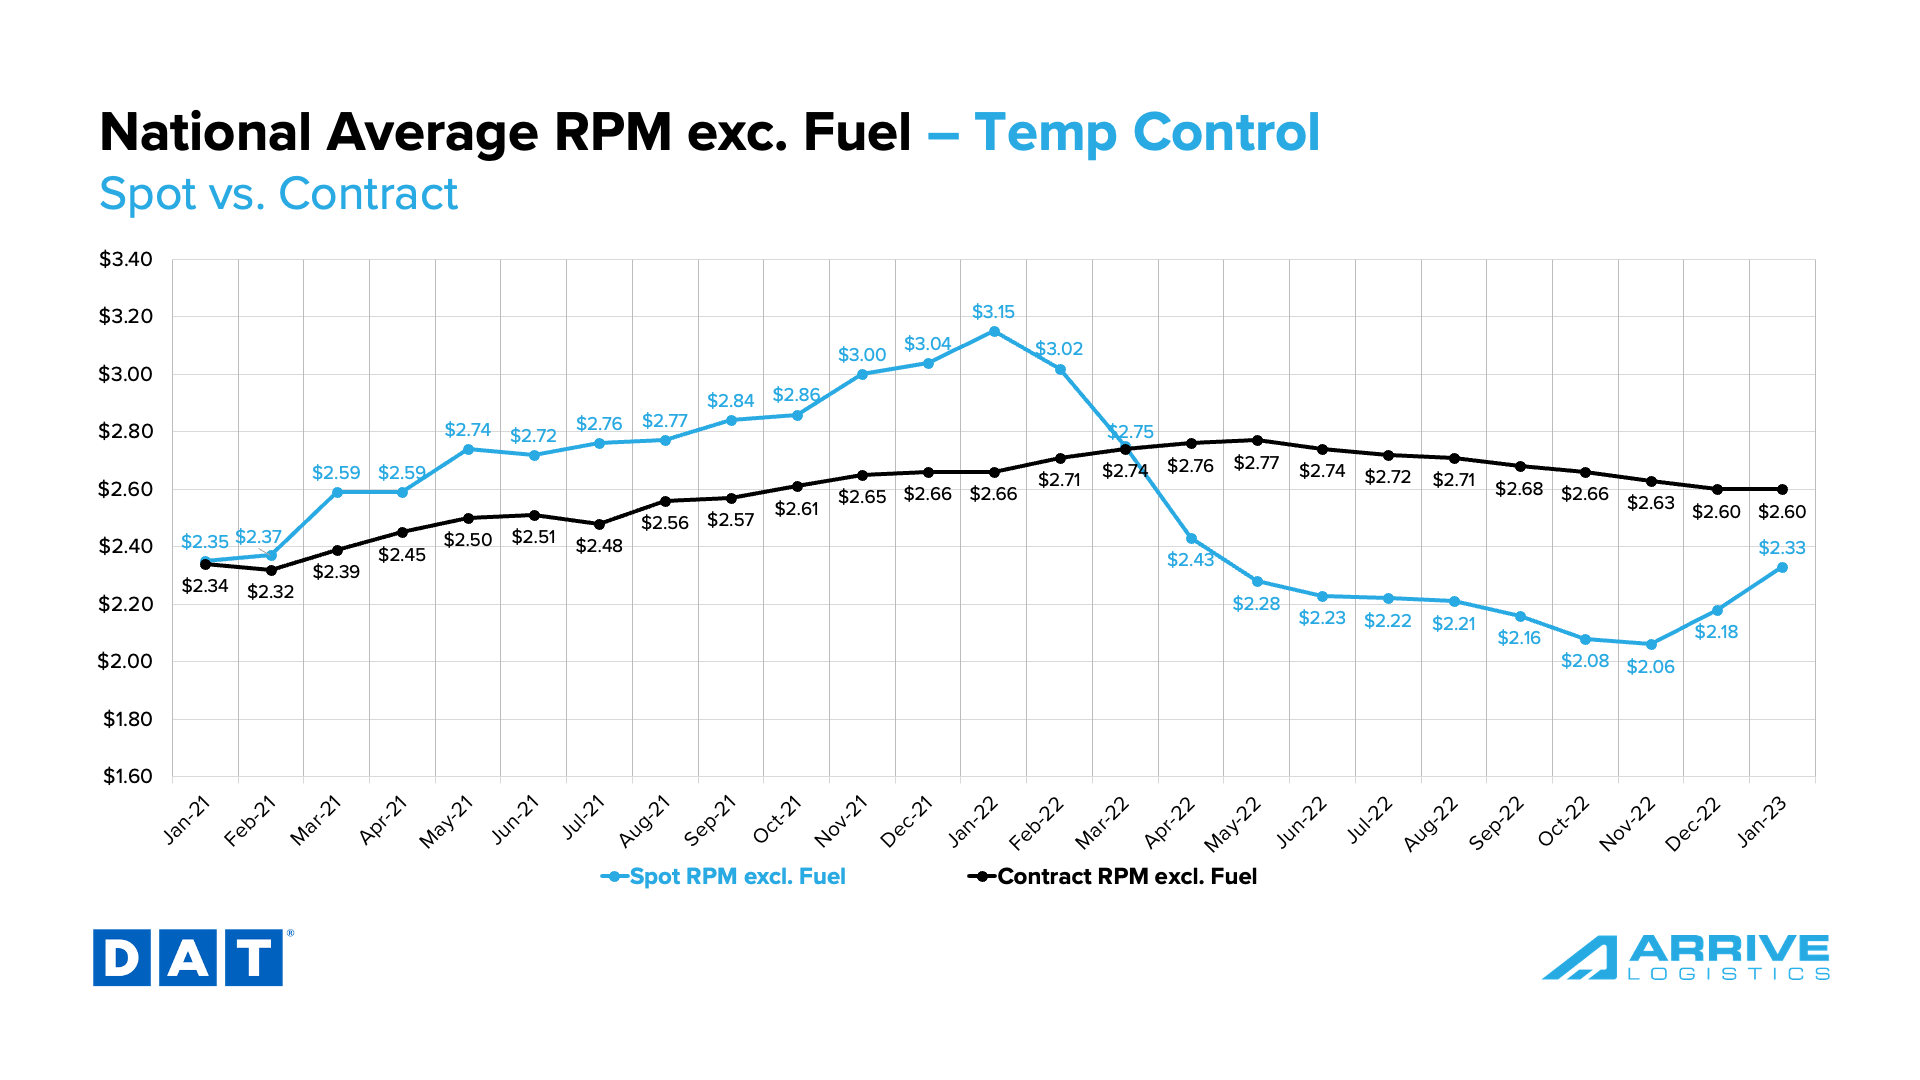
Following a similar pattern to van rates, reefer contract linehaul rates are flat early in the month, while spot linehaul rates have surged. The current reefer contract rate is $2.60 per mile, excluding fuel, while the current reefer spot rate at $2.33 per mile, excluding fuel — a 26% decrease from $3.15 per mile in January 2022, the peak for reefer spot rates. Contract rates are now down by $0.06 per mile, excluding fuel, over the same period.
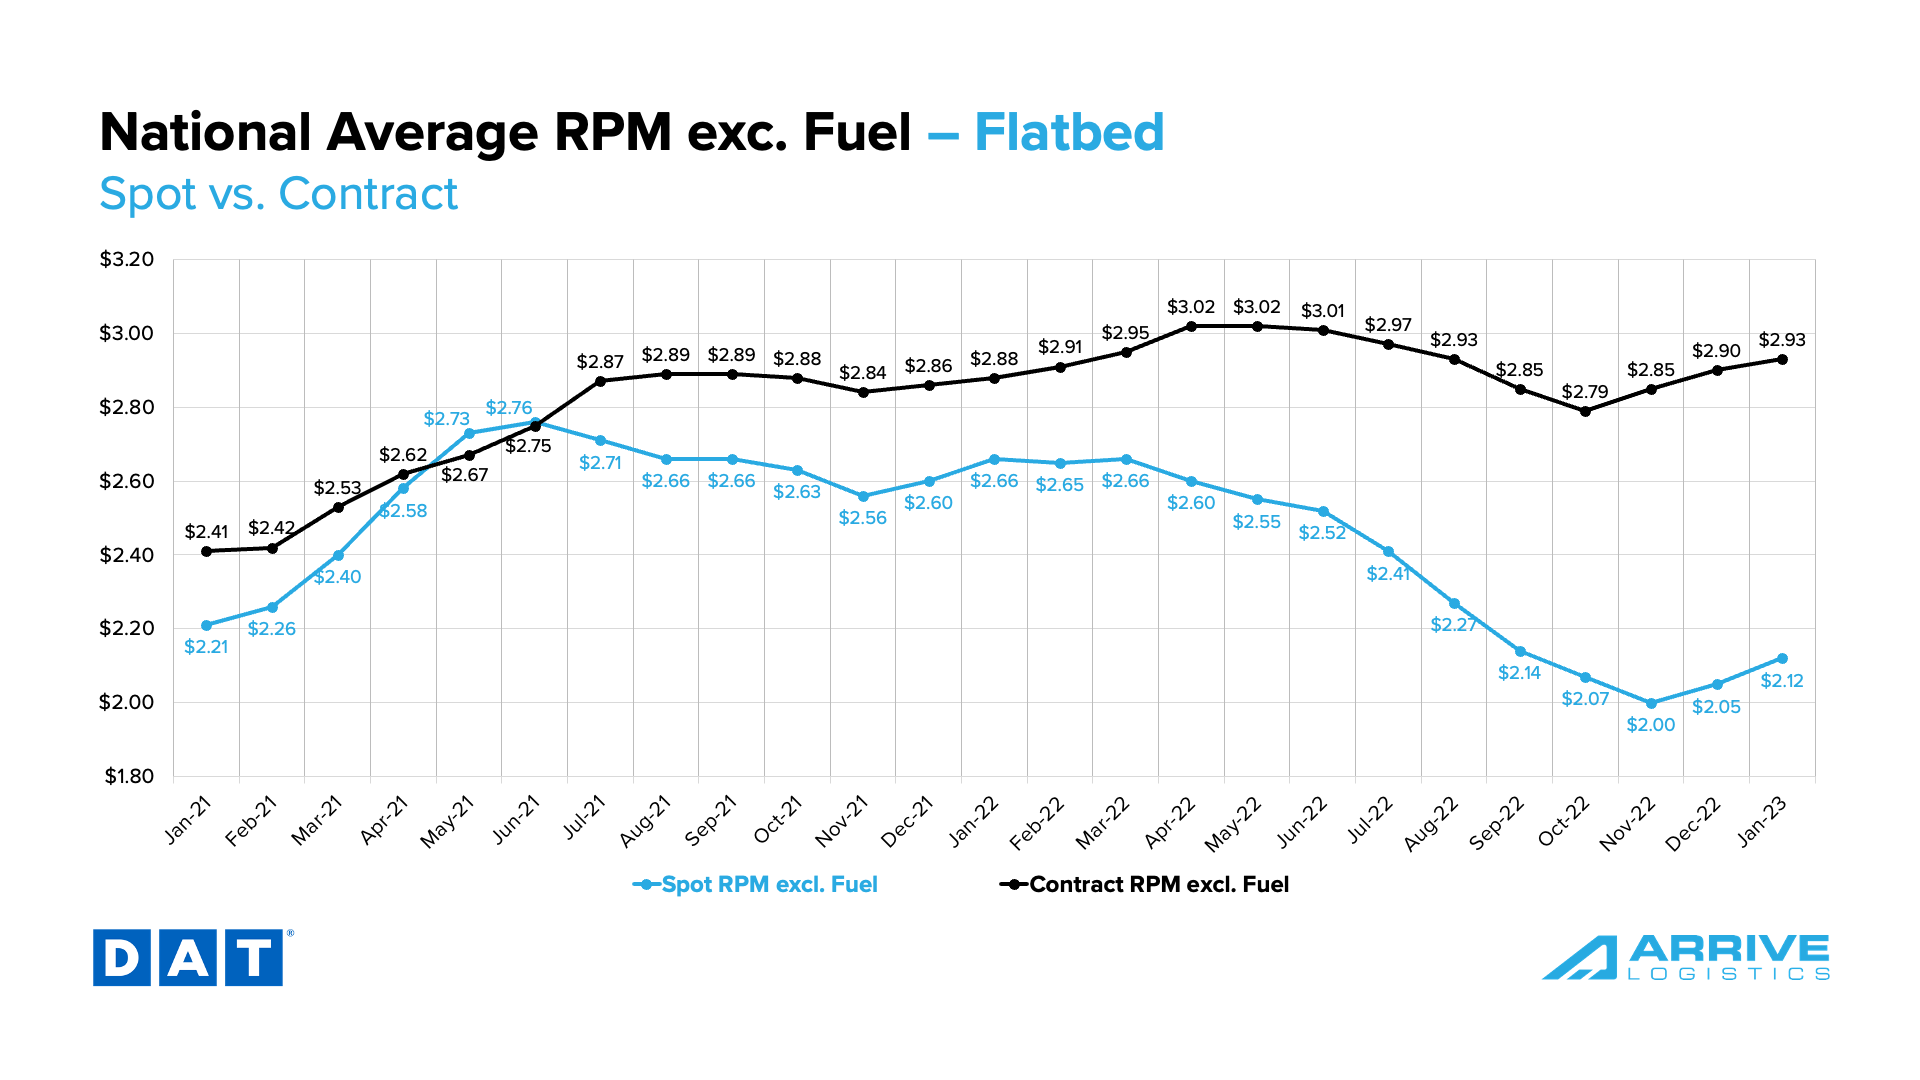
In the flatbed market, both spot and contract rates increased over the last few months and into early January. The current spot rate is $2.12 per mile, excluding fuel — a 20% decrease from $2.66 per mile in January 2022. Flatbed contract rates are currently $2.93 per mile, excluding fuel. Flatbed contract rates are now up by $0.05 from $2.88 per mile, excluding fuel, in January 2022.
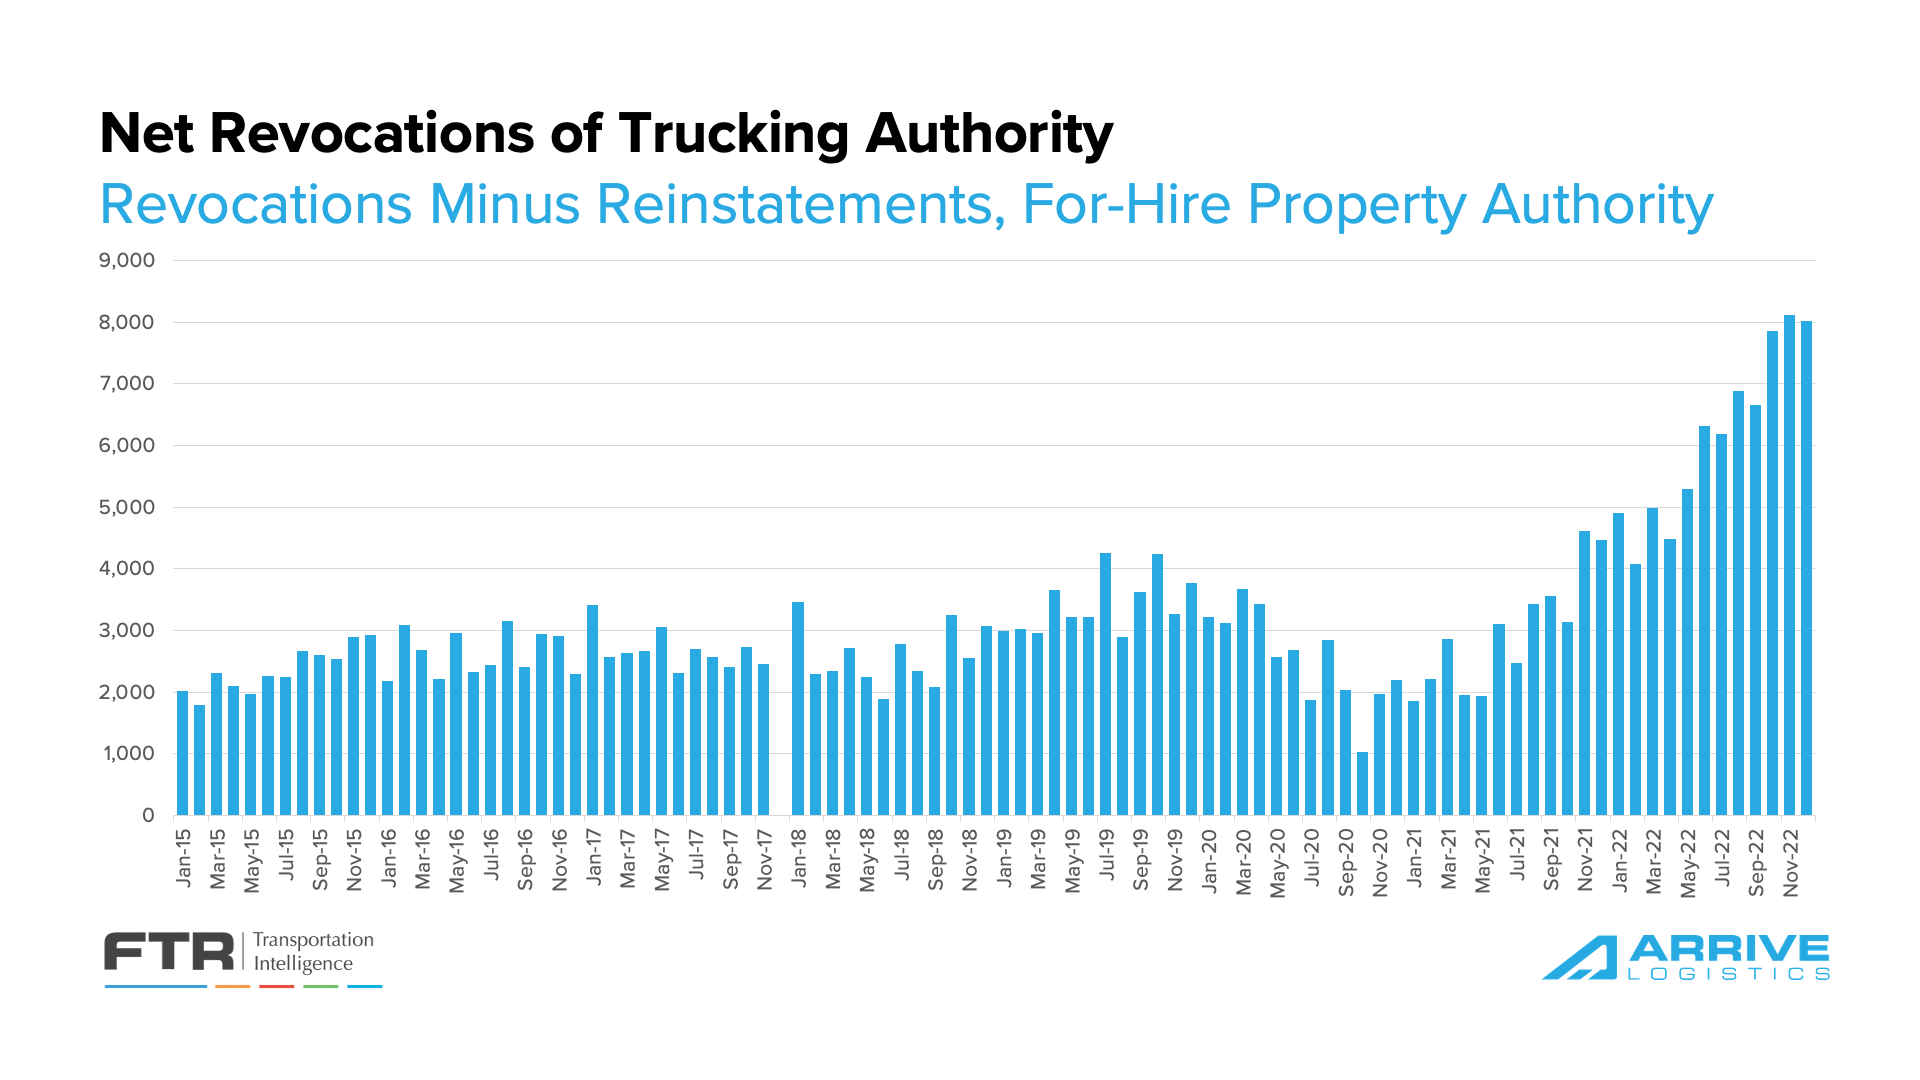
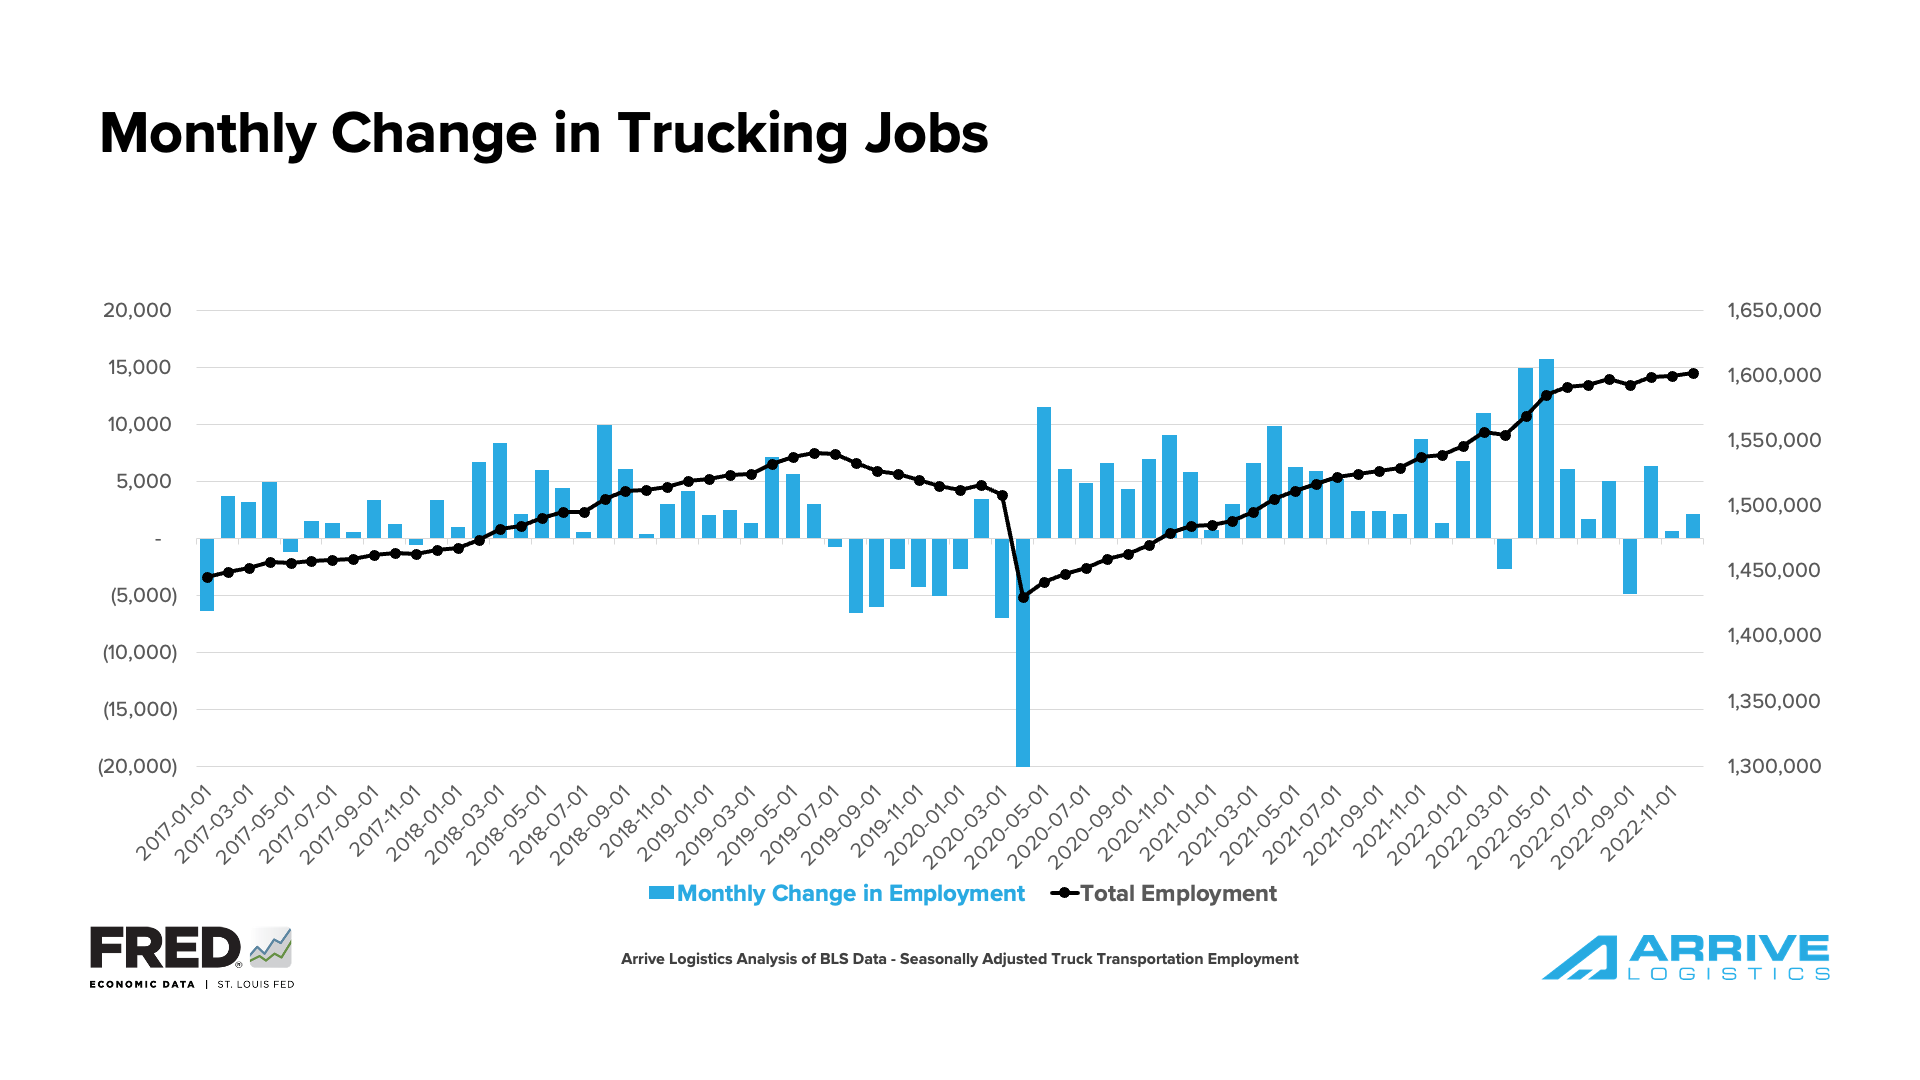
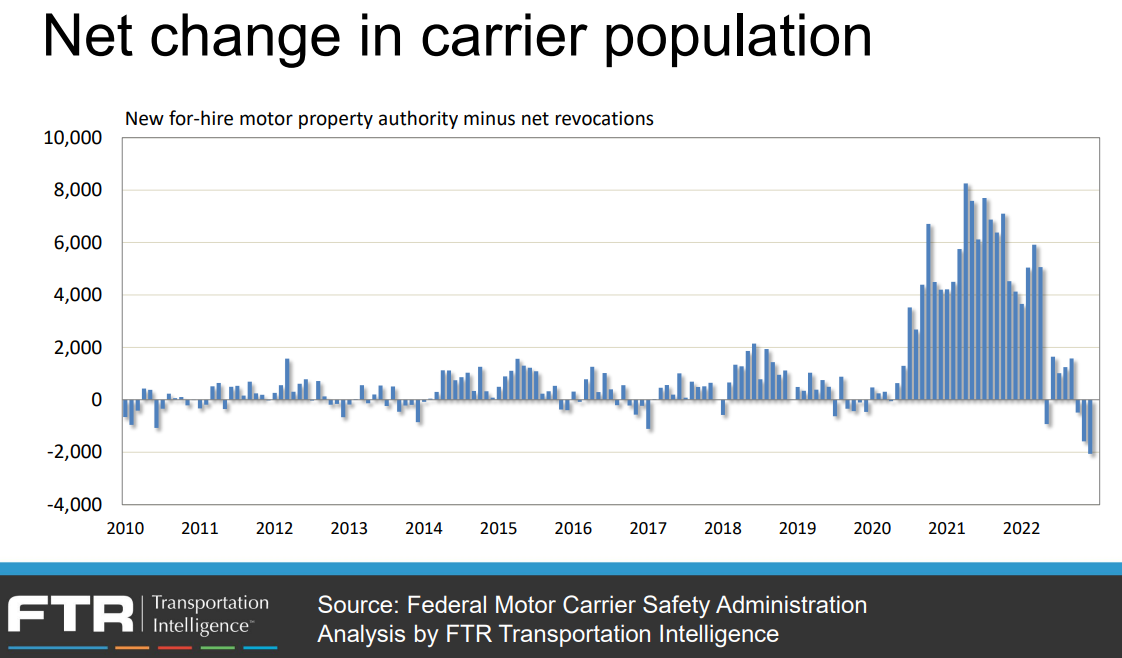
Revocations of trucking authority, as calculated by FTR, remain at historically high levels as trucking conditions have worsened. Up to this point, we believe this trend supports the theory that many owner-operators are taking company jobs with larger assets instead of trying to survive independently. It proves that turnover is high in the carrier space but not high enough to say with certainty that capacity is leaving the market. At least not yet. In fact, total trucking jobs ticked up slightly to a new all-time high in December.
Job growth during the pandemic appears to be flattening in recent months, indicating that the number of drivers leaving the market is beginning to surpass the total number of owner-operators taking company jobs. These individuals are now represented in the trucking employment numbers as they sign on to the larger asset carriers since the owner-operator headcount is not included in employment data.
If demand falls as we progress into 2023, larger carriers will begin to see less need to add drivers. In that case, we would expect to see trucking employment trend in the opposite direction, leaving a depleted workforce and the market vulnerable to future demand surges.
A recent trend we’re watching is the number of revocations starting to outpace net new carriers entering the market, leading to three straight months of a reduction in total carriers. Until trucking jobs begin to decline, this trend is likely additional evidence to support owner-operators closing shop and moving to company jobs.
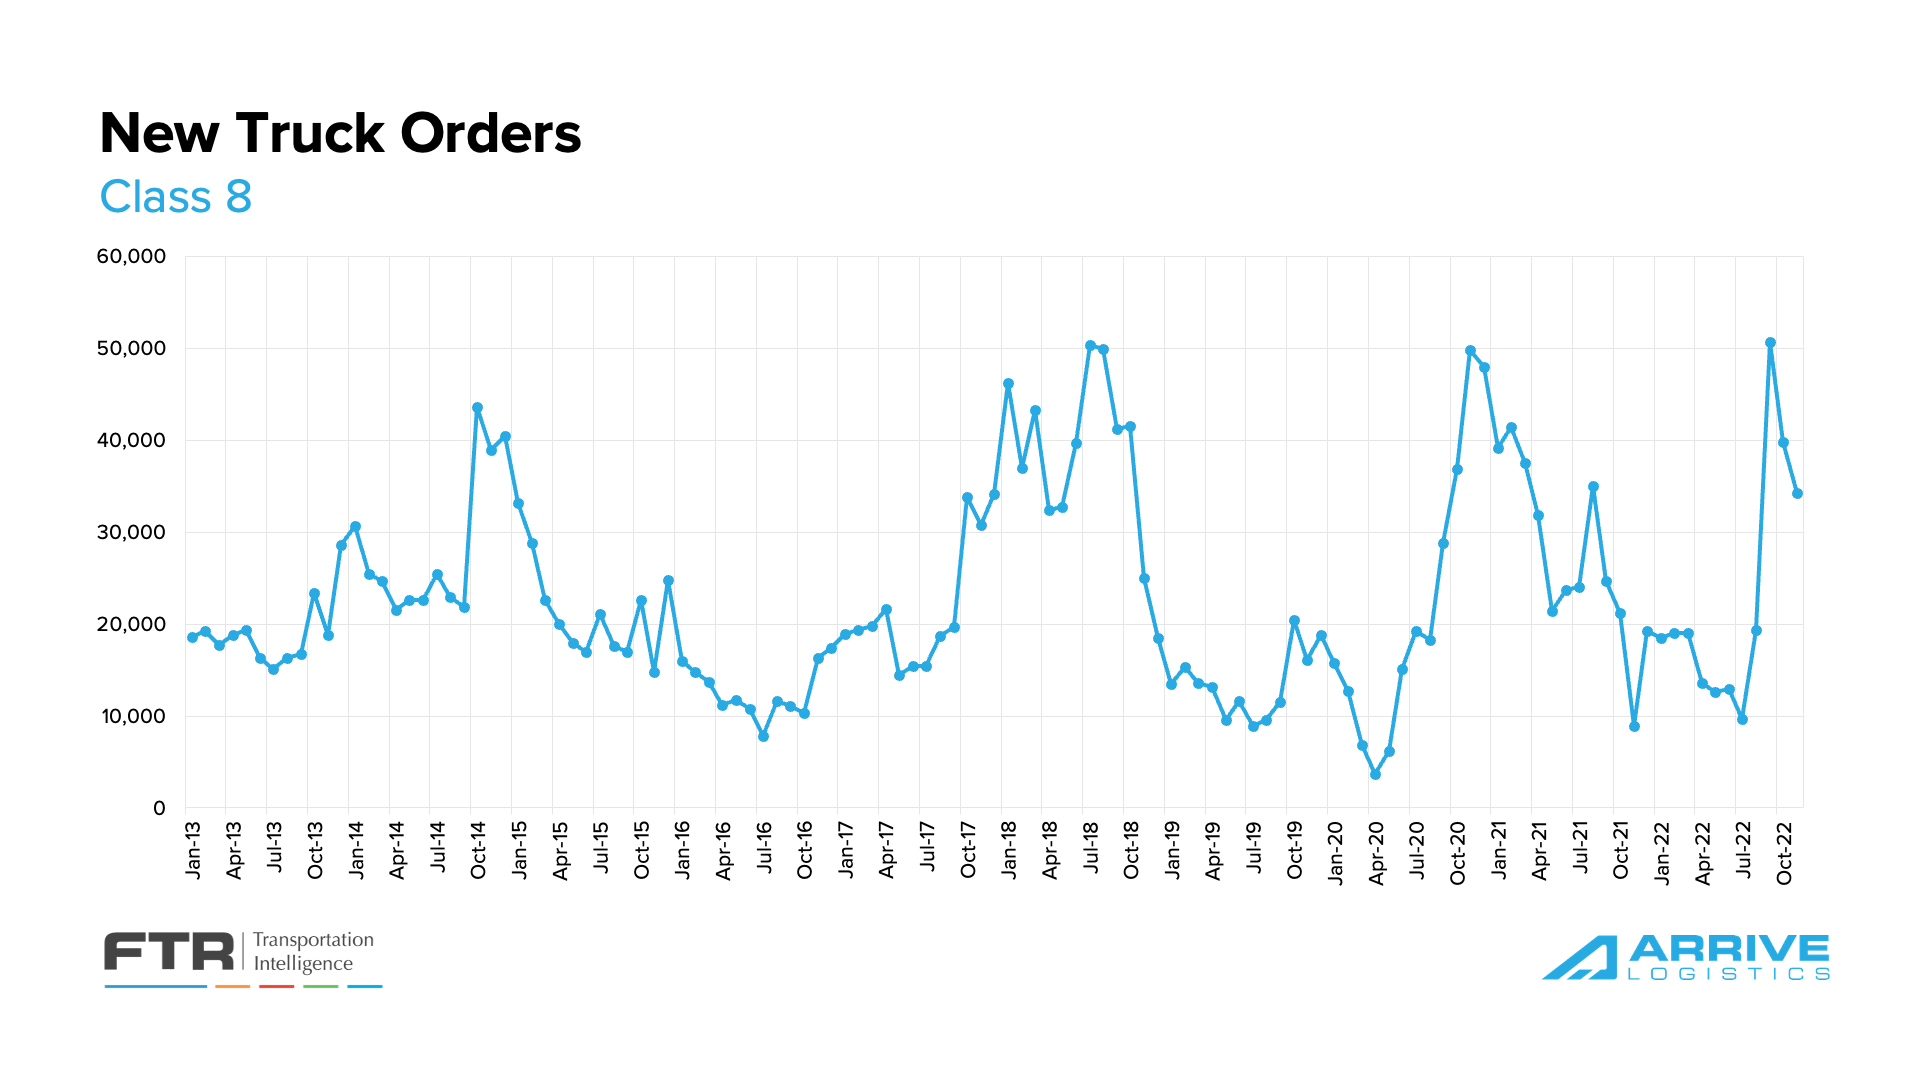
According to FTR, New Class 8 truck orders fell for a third straight month to 28,300 in December. Demand for new equipment remains relatively strong, driven by pent-up replacement demand due to several years of limited production that prevented many fleets from replacing aged equipment.
However, FTR indicated that most OEM build slots for 2023 are full, and these production limitations likely mean new orders will fall in the coming months. From this perspective, we do not consider new truck orders a good indicator of carrier sentiment about future demand. Healthy order numbers are required to replace aging equipment, and OEMs are metering the actual number of orders based on their production capabilities.
Despite declining orders, growing backlogs have increased the average time from order to delivery from 8.5 to 9.1 months. FTR also noted that orders are now in line with sales and production levels, so any further reductions in orders should also allow backlogs and lead times to begin to decline.
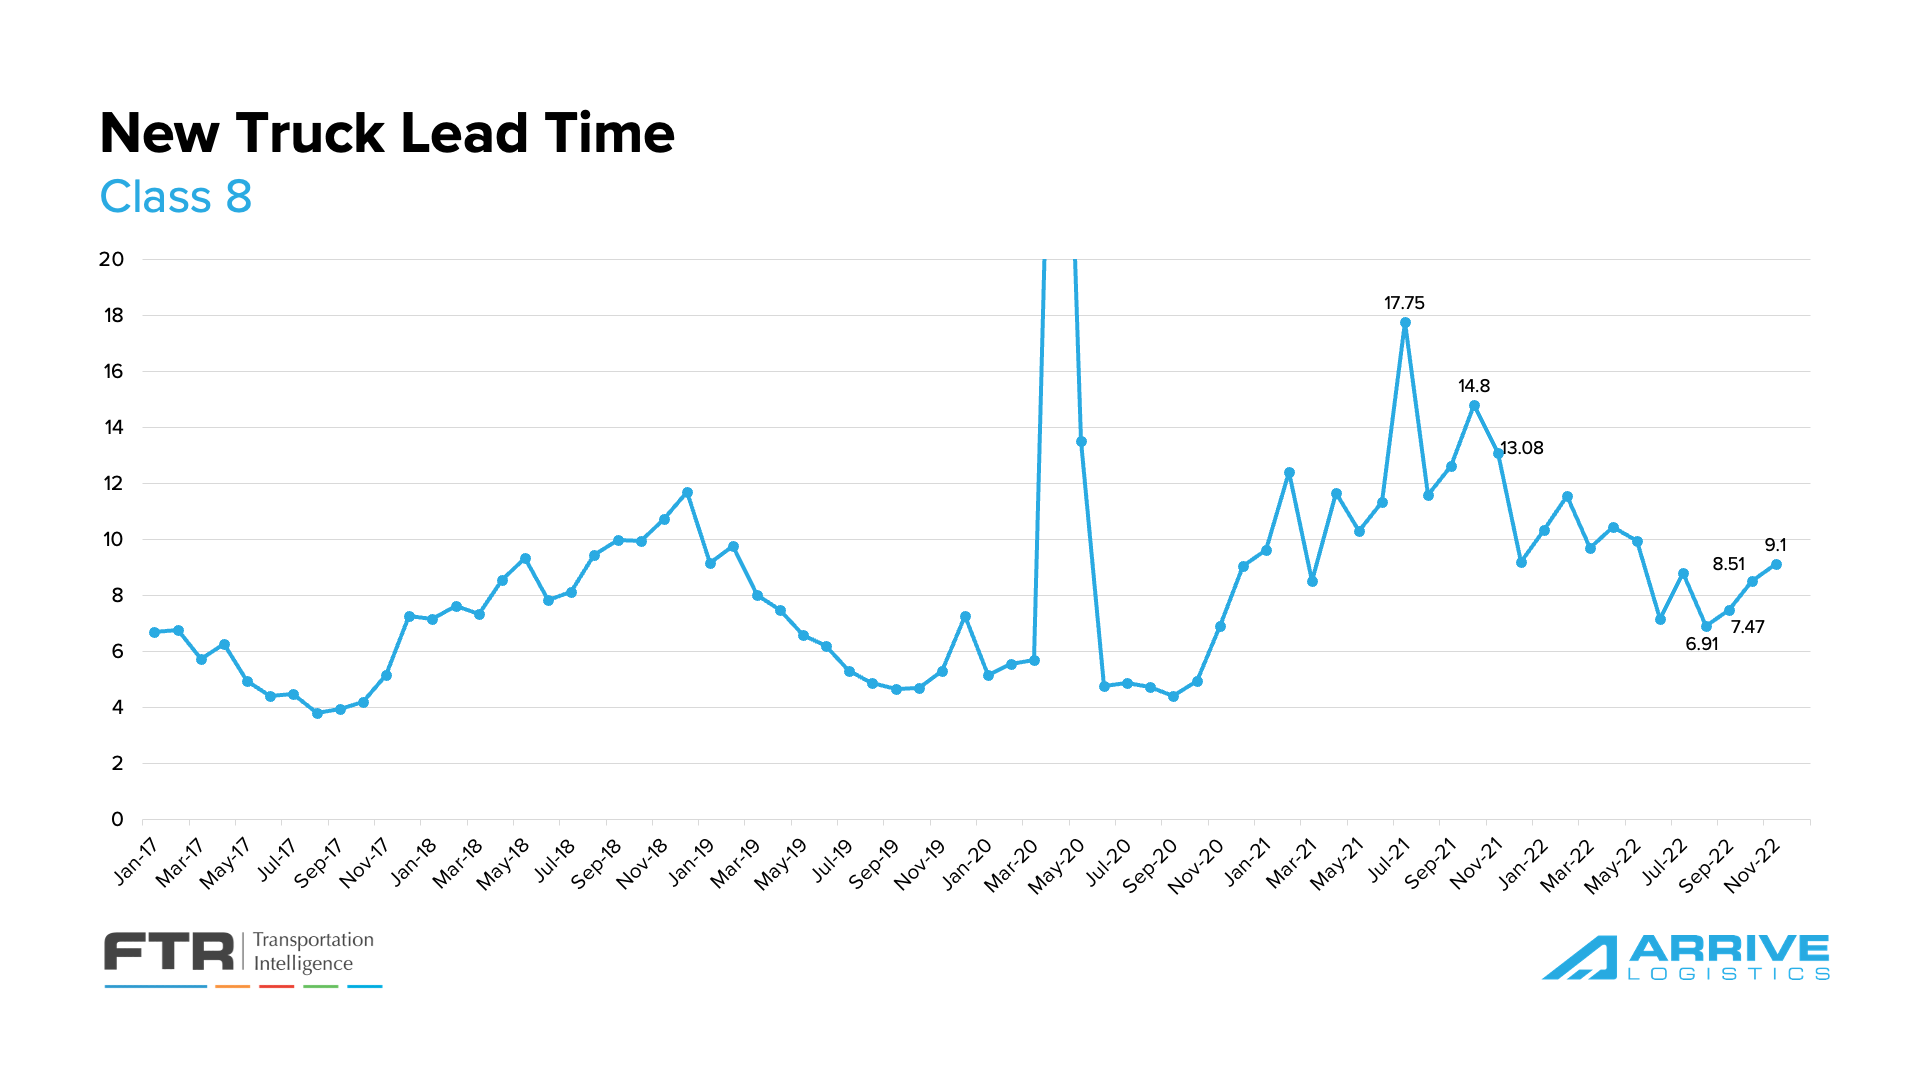
New truck lead time increased from 8.51 months in October to 9.1 months in November.
Shippers in Arrive’s network continue to note the value of drop trailers in creating warehouse efficiencies amid labor challenges and overstocked inventories. The ability to plan has limited unnecessary dwell times and detention payments to carriers. Drop trailers also benefit carriers, who are getting increased asset utilization on tractors by spending less time waiting for loads to be loaded or unloaded. As a result, trailer orders remained up 19% year-over-year.
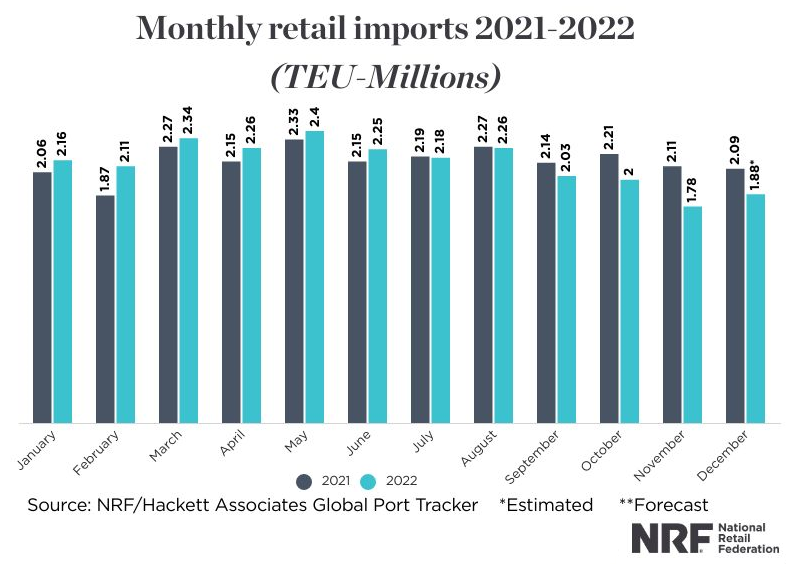
Trends emerging in the back half of 2022 remain core themes heading into the new year. The FED has been relatively successful in slowing down inflation by raising interest rates, which we believe is putting downward pressure on demand. Imports dropped below two million TEUs for the first time in nearly two years, and the manufacturing sector, as measured by ISM, posted its second consecutive month of contraction.
Import levels, a key contributor to overall truckload demand, are projected to remain below two million TEUs through most of the spring. The NRF is reporting that ports should be getting a break as consumer demand moderates amid ongoing inflation and high interest rates. They also noted that consumers are still spending and volumes remain high, but the widespread port congestion experienced this time last year is no longer an issue.
The ISM manufacturing report indicated easing backlogs as new orders slowed, despite production slowing. Manufacturing was forecasted to be one of the main drivers behind continued volume strength in the new year; if contraction persists, it becomes more likely demand will fall further than previously forecasted. That said, there is still significant pent-up demand in the space that should enable healthy volumes.
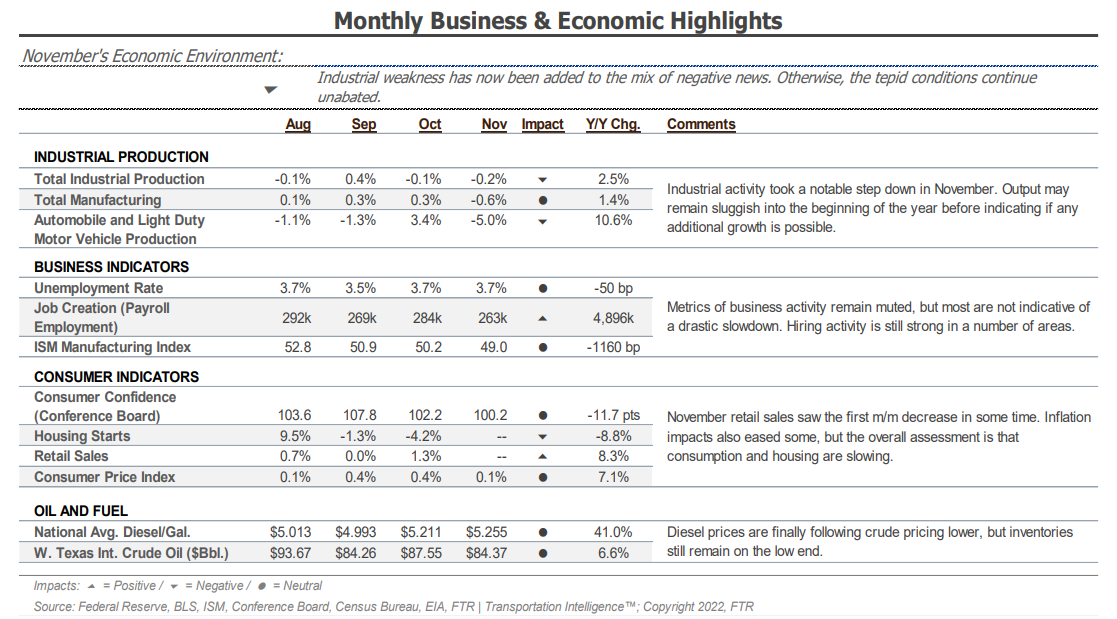
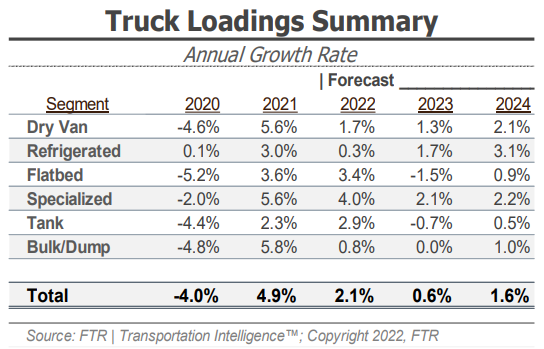
According to the previous report, FTR’s latest truck loadings reported a 2.1% year-over-year increase in 2022, down slightly from an estimated 2.2% heading into December. The 2023 forecast has been revised to the upside and shows 0.6% growth, up from -0.1% as of the last update. Stronger outlooks for food and automotive loadings are primarily responsible for the forecast improvement.
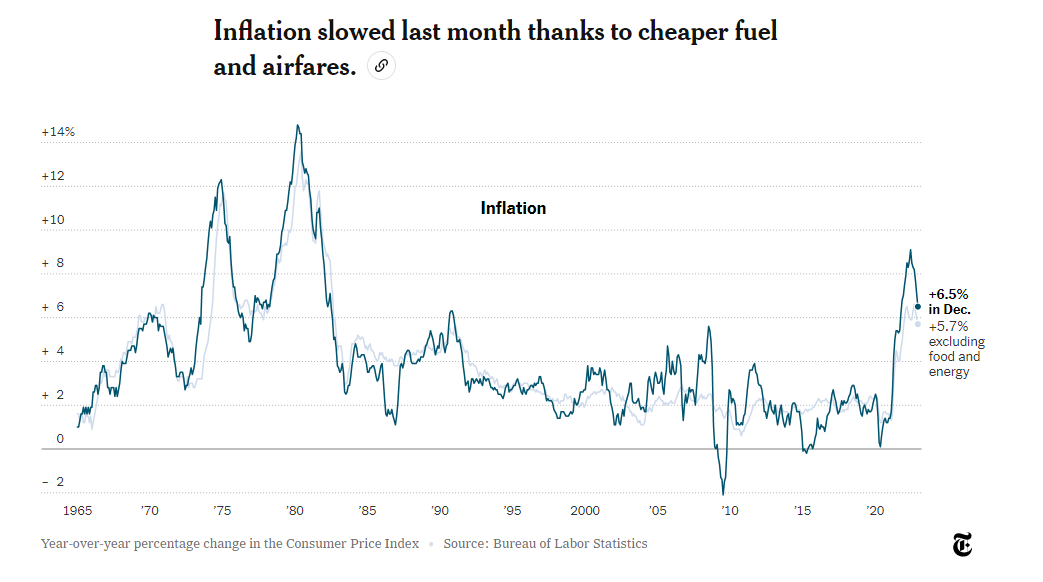
Largely in line with expectations, CPI data released in early January showed inflation slowed in December, falling from 7.1% to 6.5% year-over-year growth (5.7% when excluding food and energy). Declining gasoline prices and airfare costs are primarily responsible for the dip. The outlook for the year ahead remains positive when considering goods prices. Still, the FED fears that price increases for services amid elevated demand could keep prices above their target.
As for what these trends mean for future interest rate increases, hopes are high that the FED will begin to slow the pace and aggressiveness with upcoming opportunities. This is welcome news for consumers and could lead to increasing goods demand in the back half of the year as prices decline further.
According to Bank of America card data, year-over-year consumer spending grew by 2.2% in December. That’s up from 1.7% year-over-year growth in November after falling 0.8% month-over-month on a seasonally adjusted basis in December. BofA noted sizable decreases in many retail categories, including clothing, furniture, general merchandise, gas, and department stores, as factors contributing to the change.
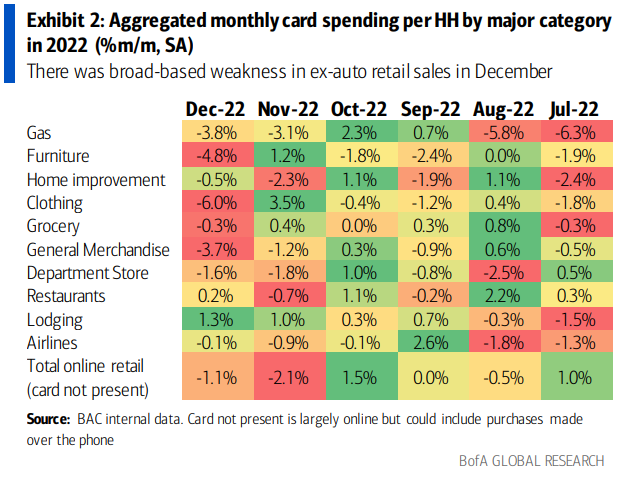
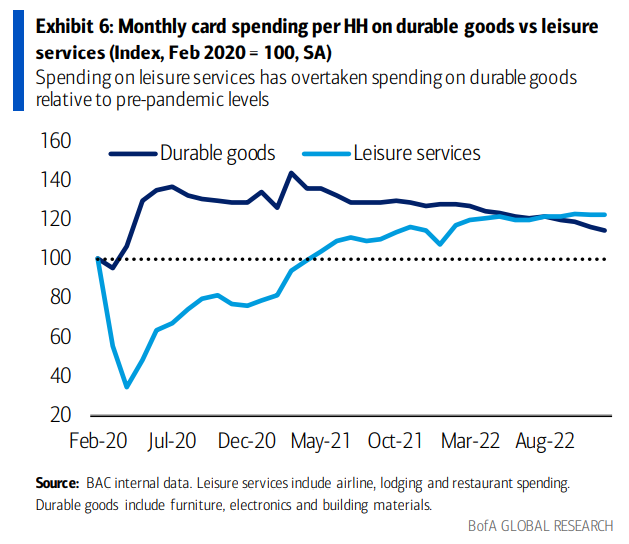
Consumer spending on durable goods remains elevated but is being outpaced by leisure services spending relative to pre-pandemic levels. Airline travel, in particular, is a category that has seen significant growth and is a sign consumers are traveling more.
BofA has maintained a wait-and-see approach to evaluating consumer health as the shift to services spending is likely a major factor in the decline in retail spending. At the very least, this provides some confidence that we are not yet seeing any major concerns with consumer spending power.
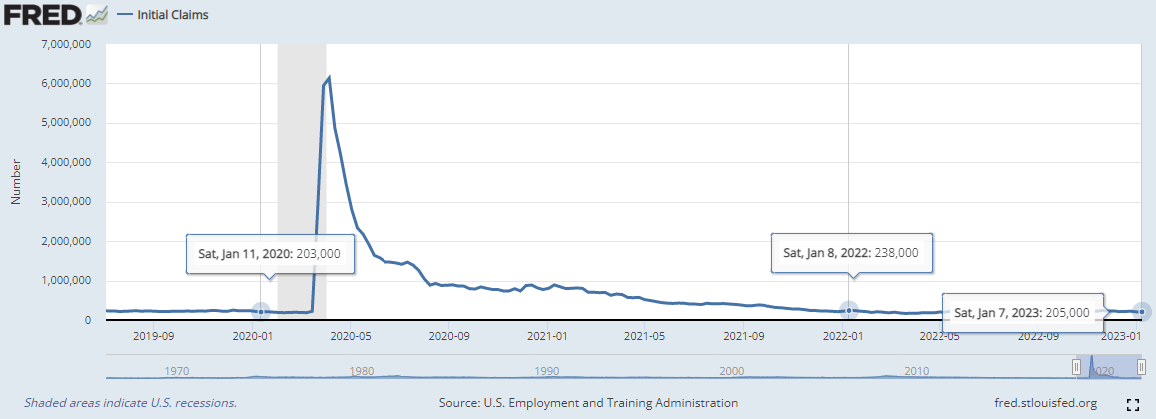
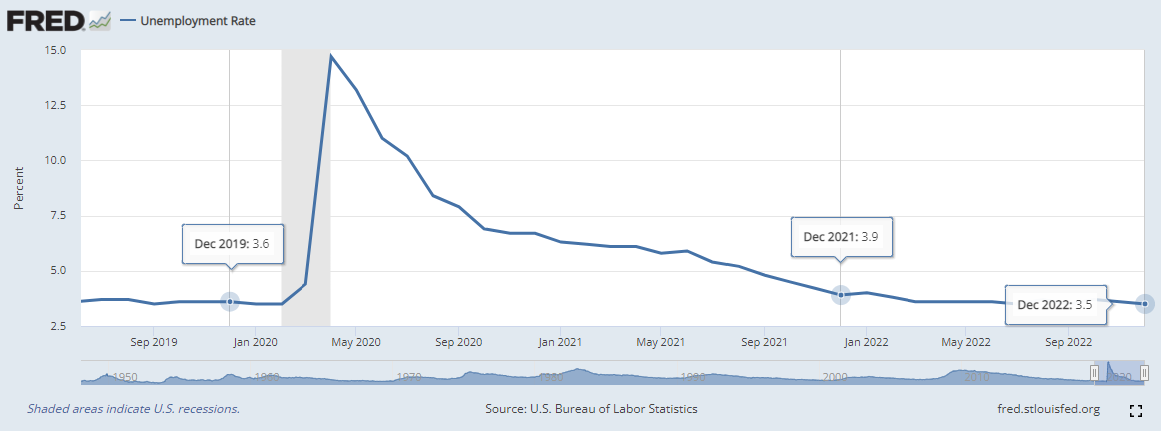
Initial jobless claims fell slightly in the first week of January; however, they are beginning to trend below year-ago levels and are closely in line with pre-pandemic levels. The unemployment rate was also nearly flat compared to December 2019 and down from December 2021, a sign that the labor market remains tight despite recent reports of layoffs.
The strong labor market signals confidence in consumers’ ability to maintain current spending levels and prevent any crash that could suddenly lead truckload demand off a cliff.