


Summer peak season’s arrival and the recent CVSA Roadcheck drove a sharp uptick in May spot market activity. DAT reported a month-over-month spot load post increase of nearly 30%, but posts were still down by more than 61% year-over-year. The surge is unlikely to last, with all signs pointing to significant pullbacks as shippers continue leveraging contract freight amid the oversupplied market.
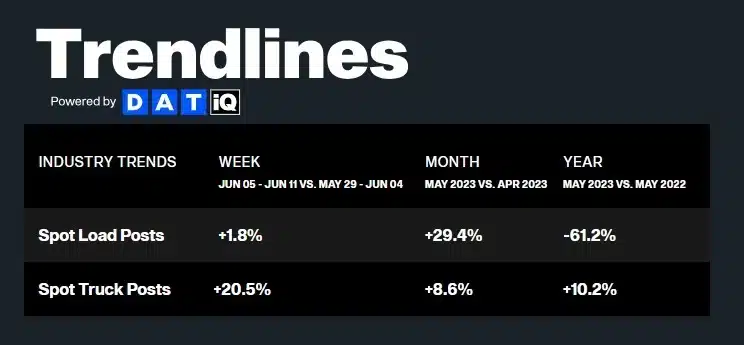 Figure 1: DAT Trendlines
Cass reported a 1.9% increase in May shipments, translating to a 0.8% month-over-month decline on a seasonally adjusted basis. The index was down 5.6% year-over-year, a significant jump from 2.4% in April. Declining real retail sales and ongoing inventory destocking were the primary headwinds facing freight volumes, but the worst destocking woes are likely over now.

Figure 2: Cass Freight Index
The FreightWaves SONAR Outbound Tender Volume Index (OTVI), which measures contract tender volumes across all modes, was down 17% year-over-year, or 12% when measuring accepted volumes after the significant tender rejection rate decline. Accepted volumes were up 5.8% month-over-month, driven by a 6% increase in accepted dry van tenders and a 9% increase in accepted reefer tenders.
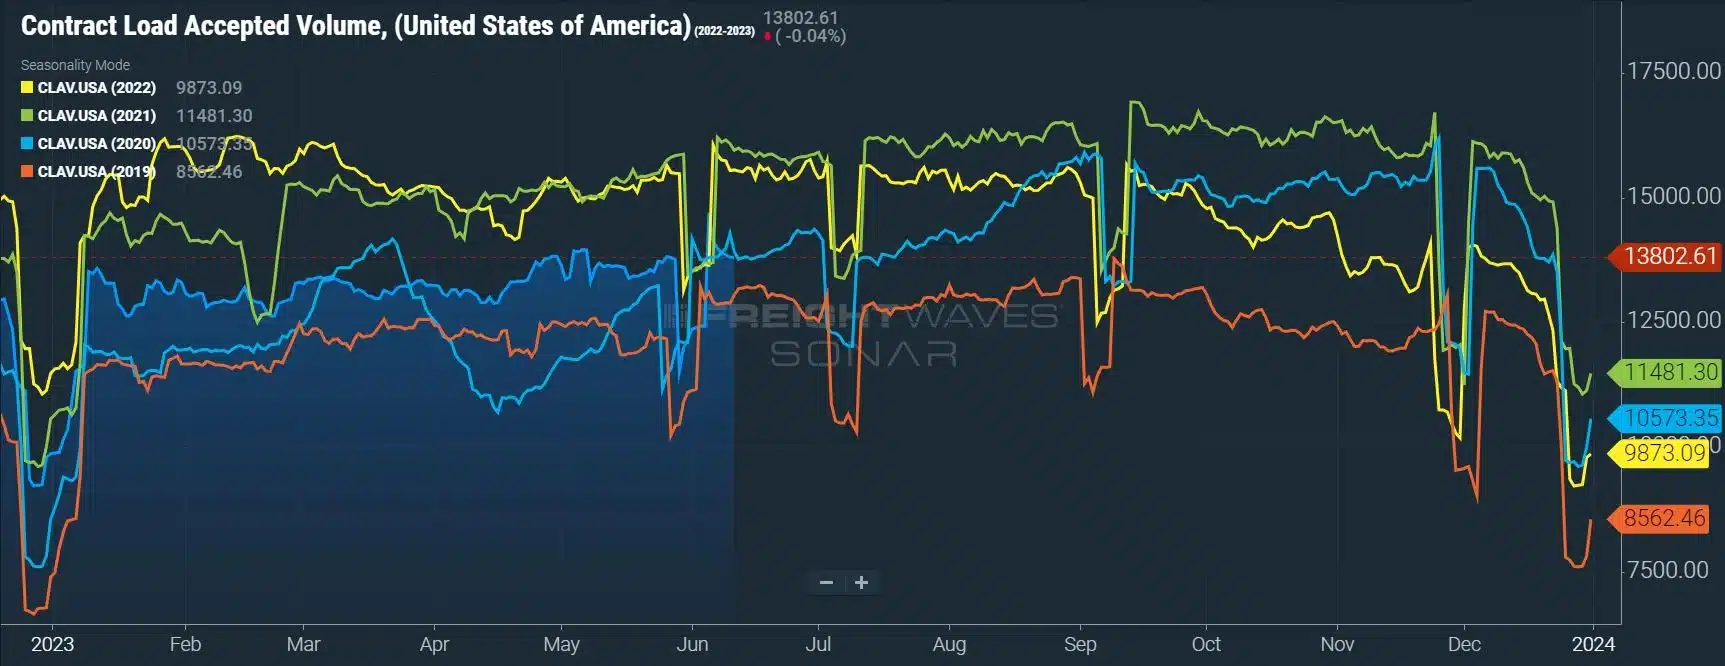 Figure 3: Contract Load Accepted Volume, SONAR: Accepted contract volumes were down 12% y/y in early June but remained above historical pre-pandemic levels.
Low crop yields had led to muted peak season conditions for reefer equipment in early May. However, recent data shows signs of improvement, with Freightwaves reporting that year-over-year accepted reefer volumes were flat in early June after being down a month ago.
USDA truck shipment data for fresh fruits and vegetables also showed improvement from a month ago. The three-week trend in early May showed total shipments were down 10% year-over-year, with U.S.-grown shipments down 18% and imported crop shipments down 2%. In early June, the three-week trend showed total shipments were down just 6% year-over-year, with U.S.-grown shipments down 15% but imported crop shipments up by 6%.
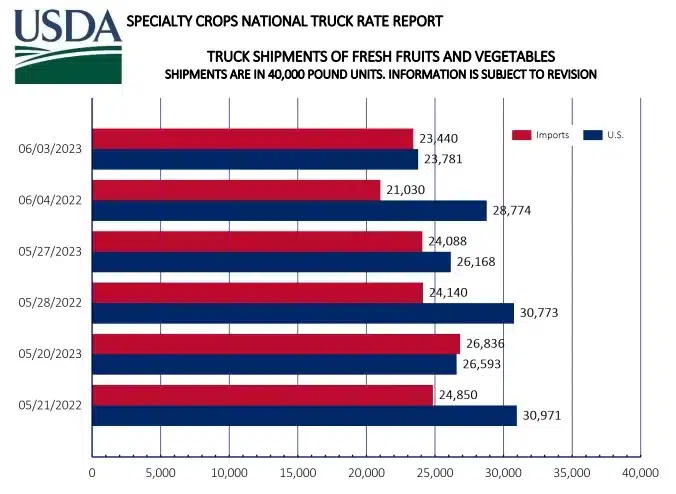 Figure 4: USDA Specialty Crops National Truck Rate Report
The latter half of May and early June are good measures of where we stand in the capacity correction cycle. As expected, certain pockets and regions experienced some seasonal spot rate volatility, but it had little to no impact on tender acceptance and service for shippers. Carriers also continued to show strong interest in and ability to support current contractual freight demand.
The Sonar Outbound Tender Reject Index (OTRI) measures the rate at which carriers reject the freight they are contractually required to take. The numbers fluctuated between a low of 2.5% and a high of 3.25% in May, indicating routing guide compliance on shippers’ contractual freight remained historically high.
Both van and reefer tender rejections held steady in May. However, reefer rejections increased rapidly over the past week, indicating tightening conditions for this equipment class in line with normal seasonality. The 5% rate is still an all-time low for this period but is nearly double the low of 2.6% seen in mid-May.
 Figure 5: Outbound Tender Reject Index, SONAR: OTRI remains below 3%, an all-time low for this time of year — a sign capacity is still sufficient to support demand and carriers are protecting their contract freight despite increases in spot.
 Figures 6 & 7: Van and Reefer Outbound Tender Reject Indices, SONAR: Dry van and reefer tender rejections are trending at all-time lows for this time of year, however reefer rejection rates have nearly doubled over the last few weeks.
The DAT Load-to-Truck Ratio measures the total number of loads relative to the total number of trucks posted on their spot board. May data was consistent with typical seasonal pressures: The Dry Van Load-to-Truck Ratio was up 32% month-over-month but down 43% year-over-year, whereas the Reefer Load-to-Truck Ratio was up 34% month-over-month but down 52% year-over-year.
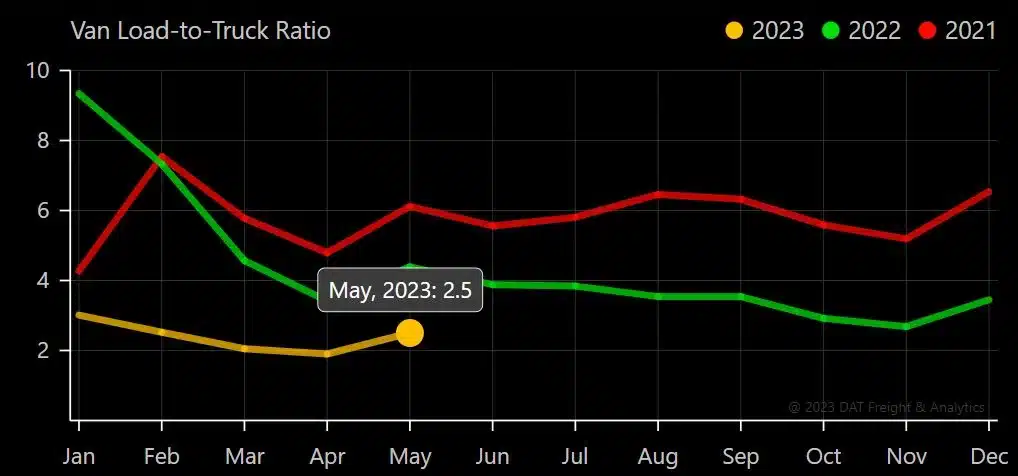 Figure 8: DAT Van Load-to-Truck Ration
 Figure 9: DAT Reefer Load-to-Truck Ratio
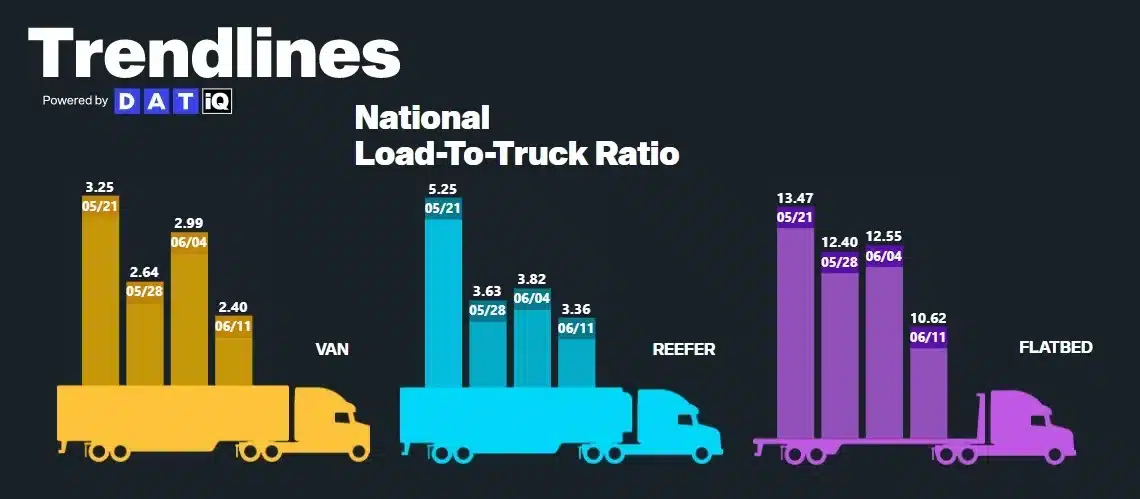 Figure 10: DAT Trendlines National Load-to-Truck Ratios: Weekly Load to Truck Ratio trends across all modes showed easing conditions into the second week of June, after spiking up due to CVSA Roadcheck and Memorial Day disruptions in May.
The Morgan Stanley Dry Van Freight Index is another measure of relative supply; the higher the index, the tighter the market conditions. The black line with triangle markers on the chart provides a great view of what directional trends would be in line with normal seasonality based on historical data dating back to 2007.
Normal seasonal trends typically show tightening from mid-May to July Fourth. This year is no exception. The data shows greater volatility than indicated by contract tender rejection trends, supporting the idea that carriers are honoring contractual commitments despite increasing spot demand. If normal seasonal trends continue, conditions could tighten as we approach Independence Day and ease in the weeks following.
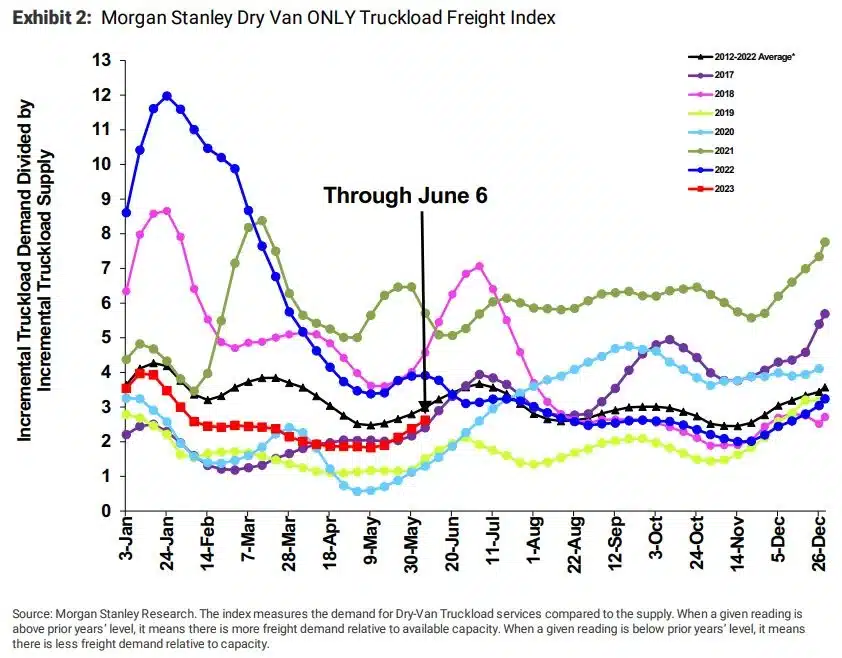 Figure 11: Morgan Stanley Dry Van Truckload Freight Index
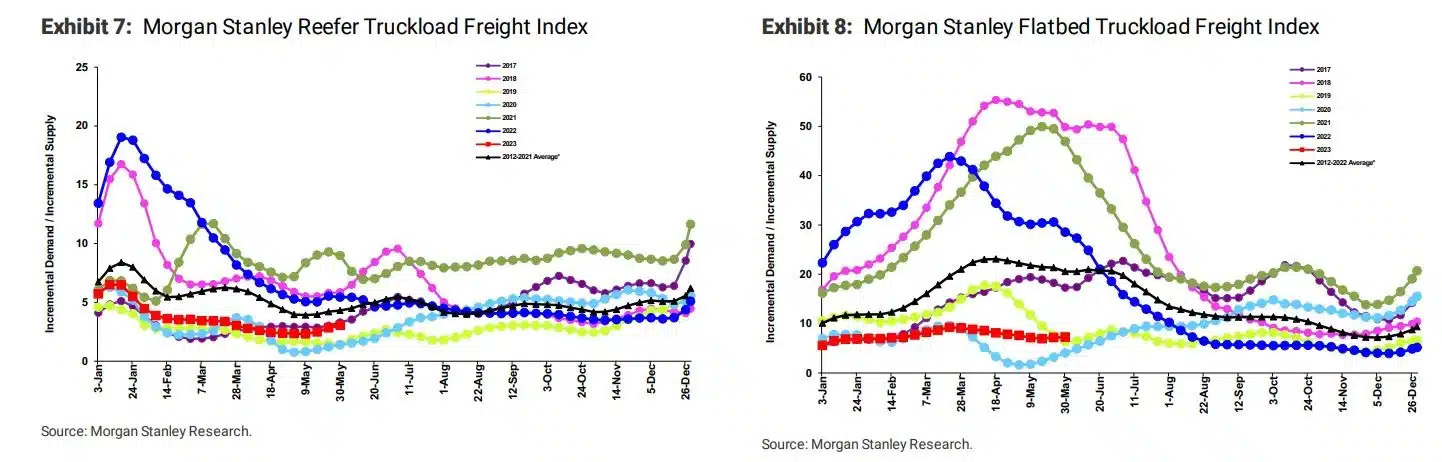 Figures 12 & 13: Morgan Stanley Reefer and Flatbed Truckload Freight Indices
CVSA Roadcheck week and a seasonal produce activity uptick turned out to be the sparks needed to finally get rates up from the floor. Truckstop and FTR reported weekly dry van and flatbed spot rates rose in three of the last four weeks, while reefer rates stabilized after increasing by nearly $0.40 per mile throughout May.
However, we believe the spike is due to seasonality rather than a fundamental shift in market conditions. As such, rates will experience upward pressure through July Fourth, then ease relatively quickly.
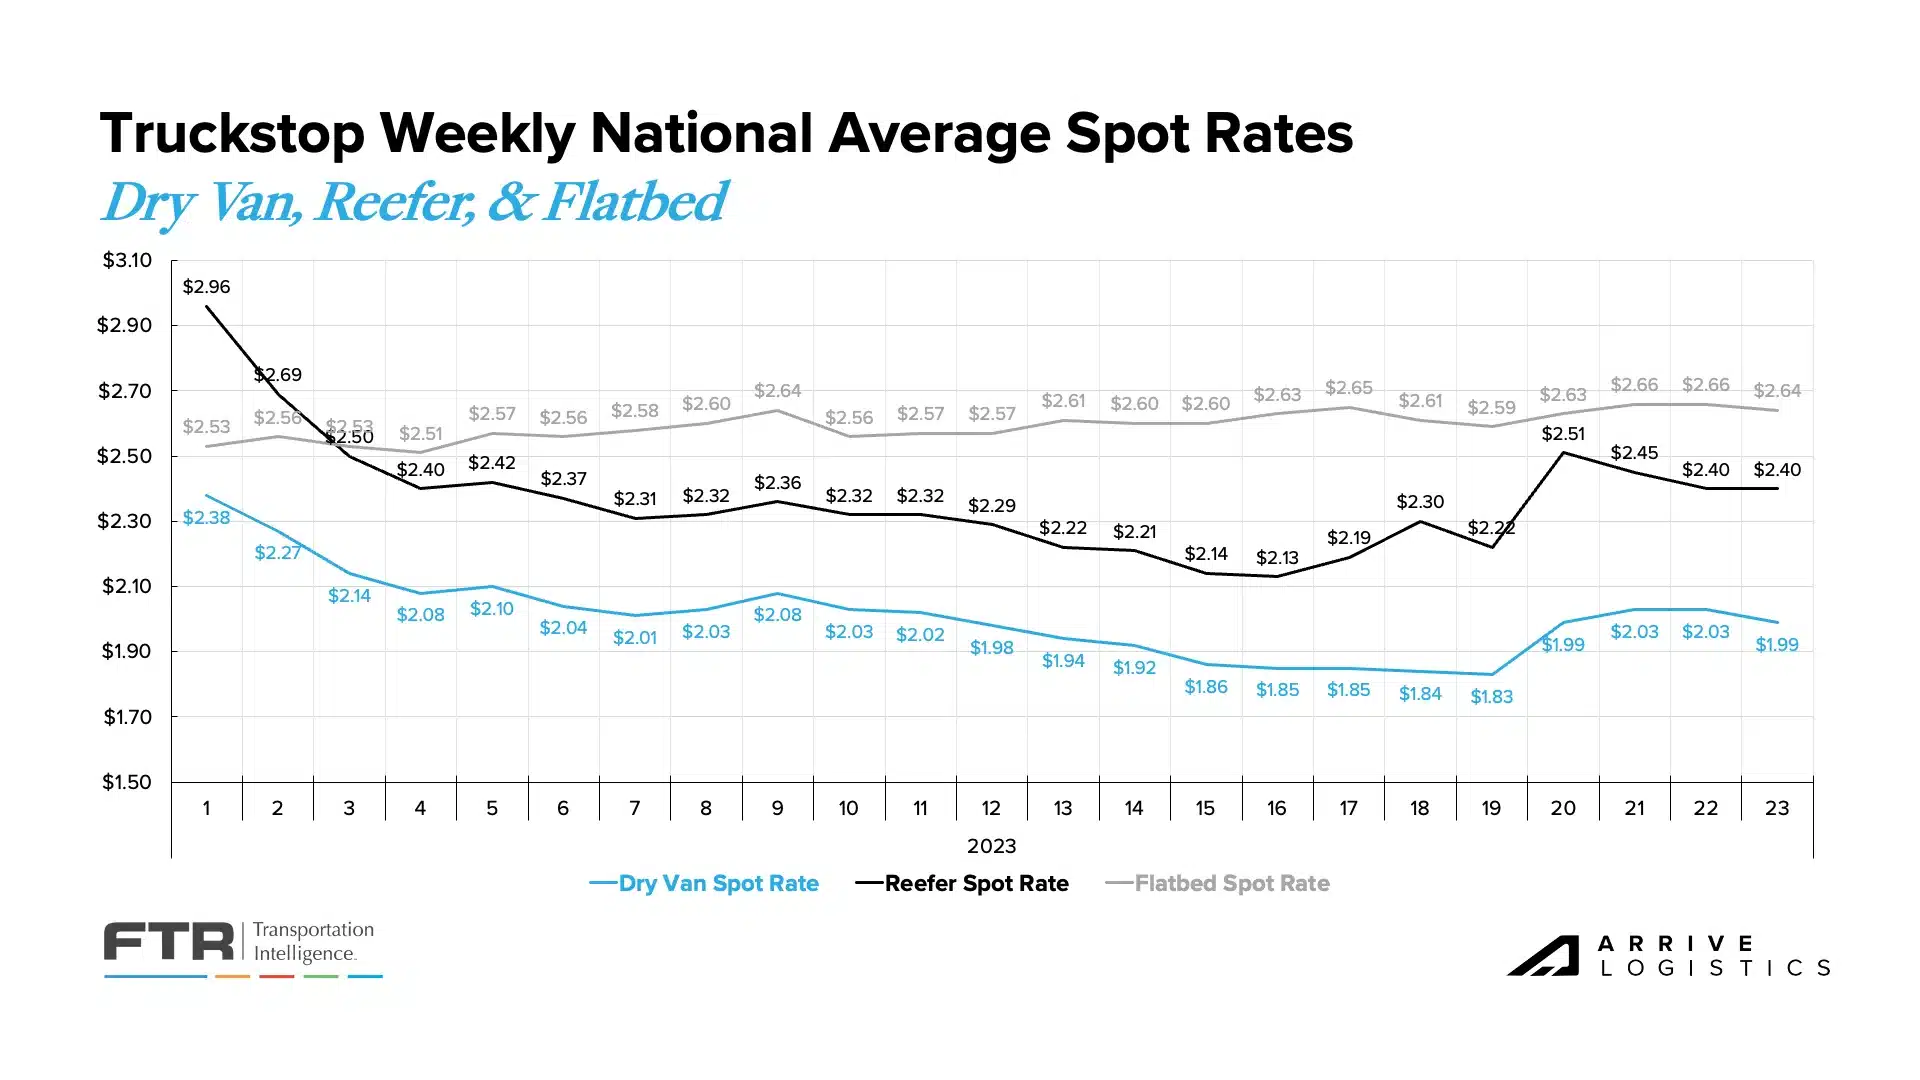 Figure 14: Truckstop Weekly National Average Spot Rates
According to DAT, monthly all-in spot rates, including linehaul and fuel costs, are up for van and reefer equipment and flat for flatbed equipment. As of June 13th, van rates are up $0.03 per mile, while reefer rates have jumped by $0.02. These trends align with Truckstop’s weekly rate data and indicate normal seasonal pressures.
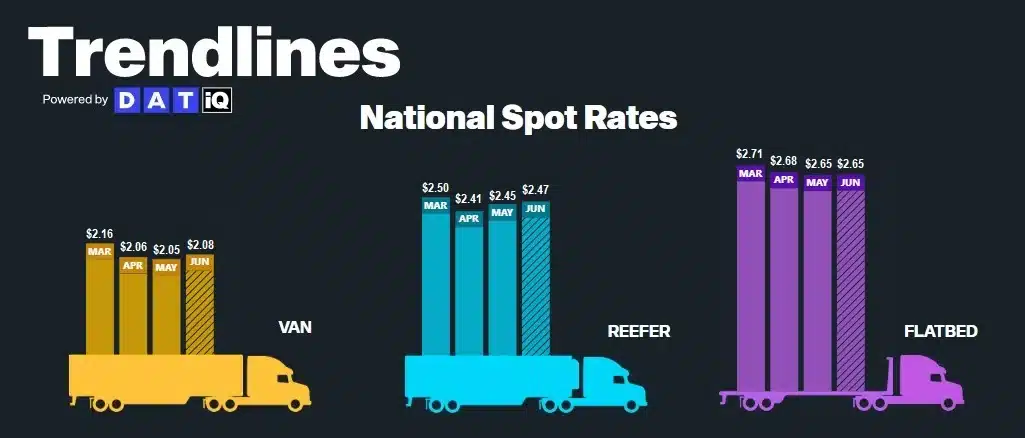 Figure 15: DAT Trendlines National Spot Rates
The month-over-month van rate spread declined sharply in May, creating a $0.50 difference between spot and contract. While surely an improvement, this is still a large gap, so downward pressure on contract rates should continue for the foreseeable future. Seeing this trend persist through recent volatility provides further evidence that the upward rate pressure observed is due to seasonality rather than a fundamental market shift.
All-in dry van spot rates are down 22.4% year-over-year, while linehaul spot rates are down 14.0%. All-in dry van contract rates are down 21.6% year-over-year, and linehaul contract rates are down 15.0%. While contract rates continue to experience negative year-over-year growth, three consecutive months of year-over-year spot rate growth demonstrates that they are well past peak deflationary pressures.
 Figure 16: DAT Dry Van National Average RPM Spot vs. Contract: Van contract rates have continued trending downward in early June, however, normal seasonal pressures are resulting in upward pressure on spot rates through summer peak season.
May reefer spot linehaul rates followed the same trend as van linehaul spot rates but with even greater upward movement. From April through early June, the national average reefer spot rate has jumped by $0.12 per mile, while the national average contract rate ua down $0.11 per mile. If this holds, it will result in a meaningful reefer spot-to-contract rate spread decline from $0.58 in April to just $0.35 per mile in early June. In that case, the spread would likely increase again when spot rates ease in July, but this is still an early sign that market conditions are normalizing.
Down 13.9% year-over-year, the current reefer contract rate is $2.36 per mile, excluding fuel, while the current reefer spot rate is down nearly 10% year-over-year to $2.01 per mile, excluding fuel. Though the trend is significant, we have likely passed peak year-over-year deflationary pressures.
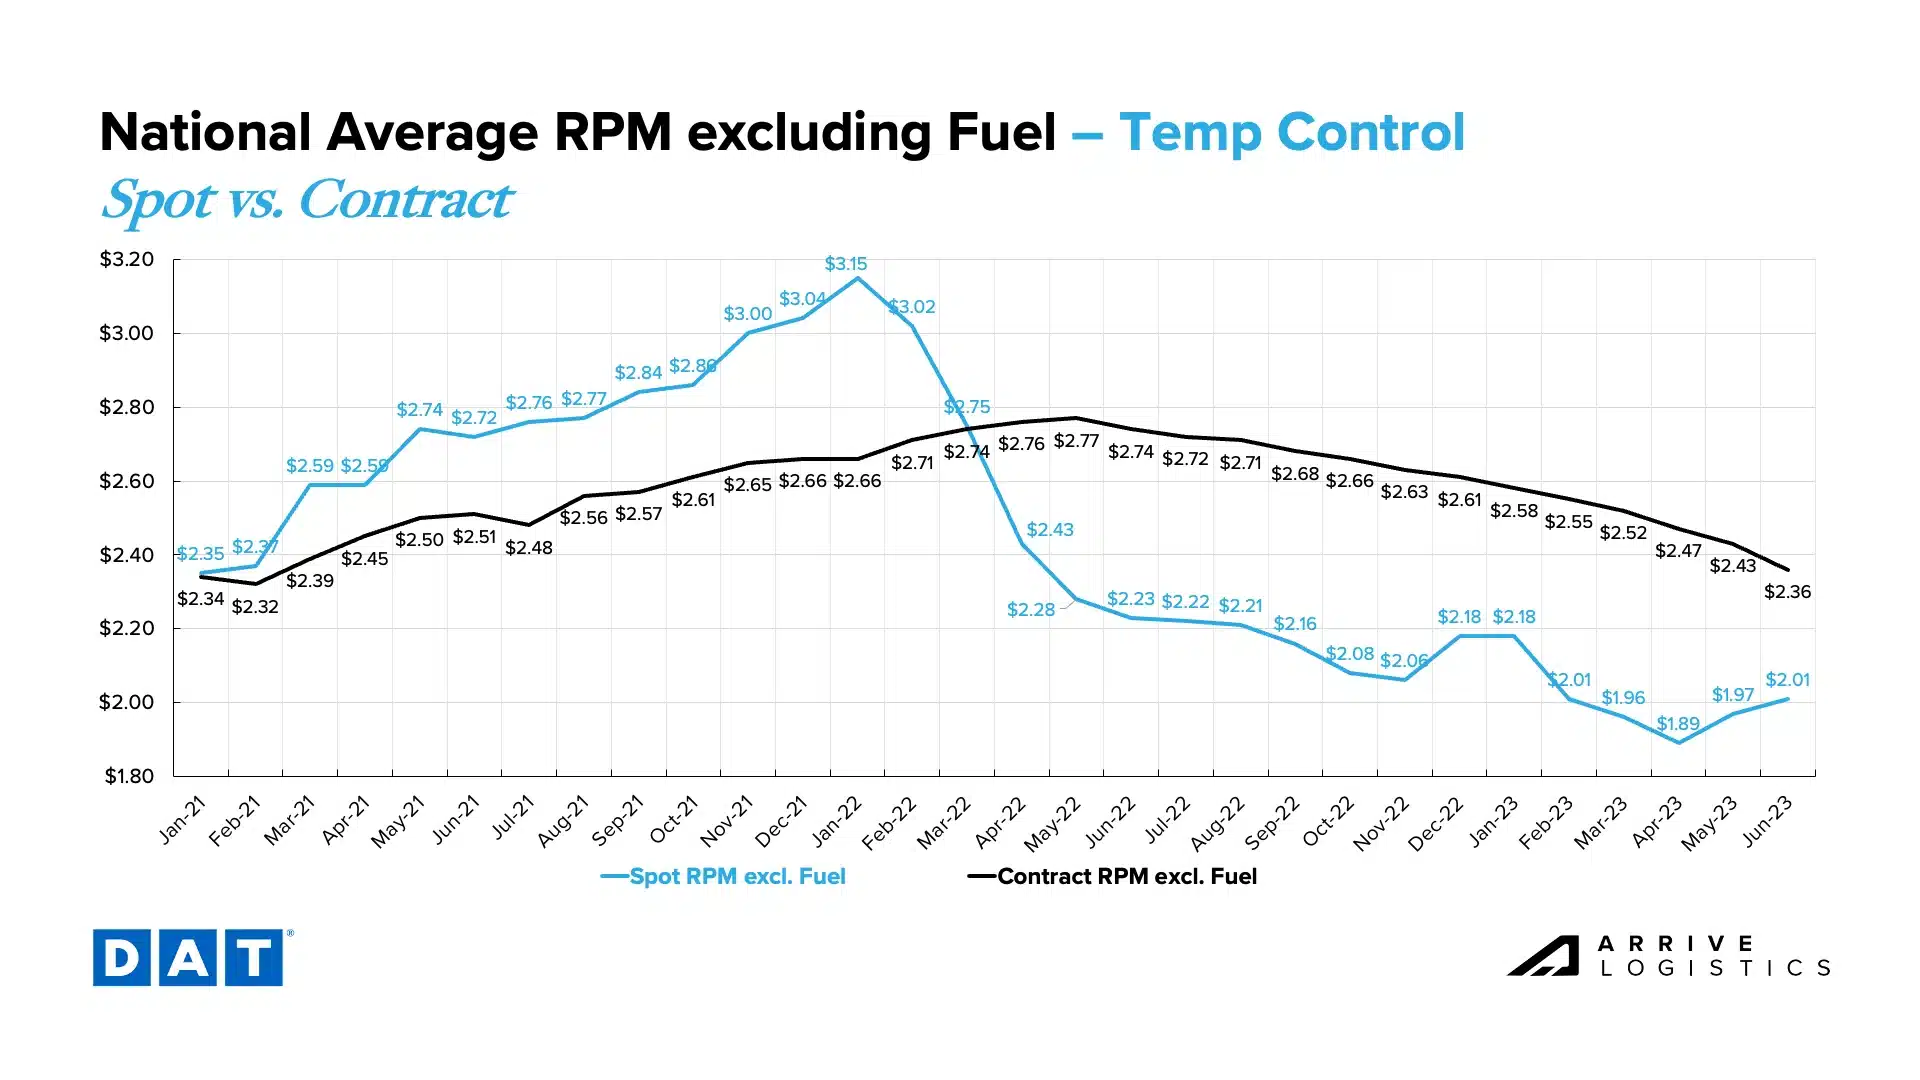 Figure 17: DAT Temp Control National Average RPM Spot vs. Contract
Flatbed rates have been significantly more stable this year. Rising spot rates are slowly closing the spot-contract gap, which moved from $0.71 in January to $0.61 in June. Spot flatbed linehaul rates increased by $0.02 in June, while contract rates dipped by $0.01. Spot rates landed at $2.14 and contract at $2.75, excluding fuel.
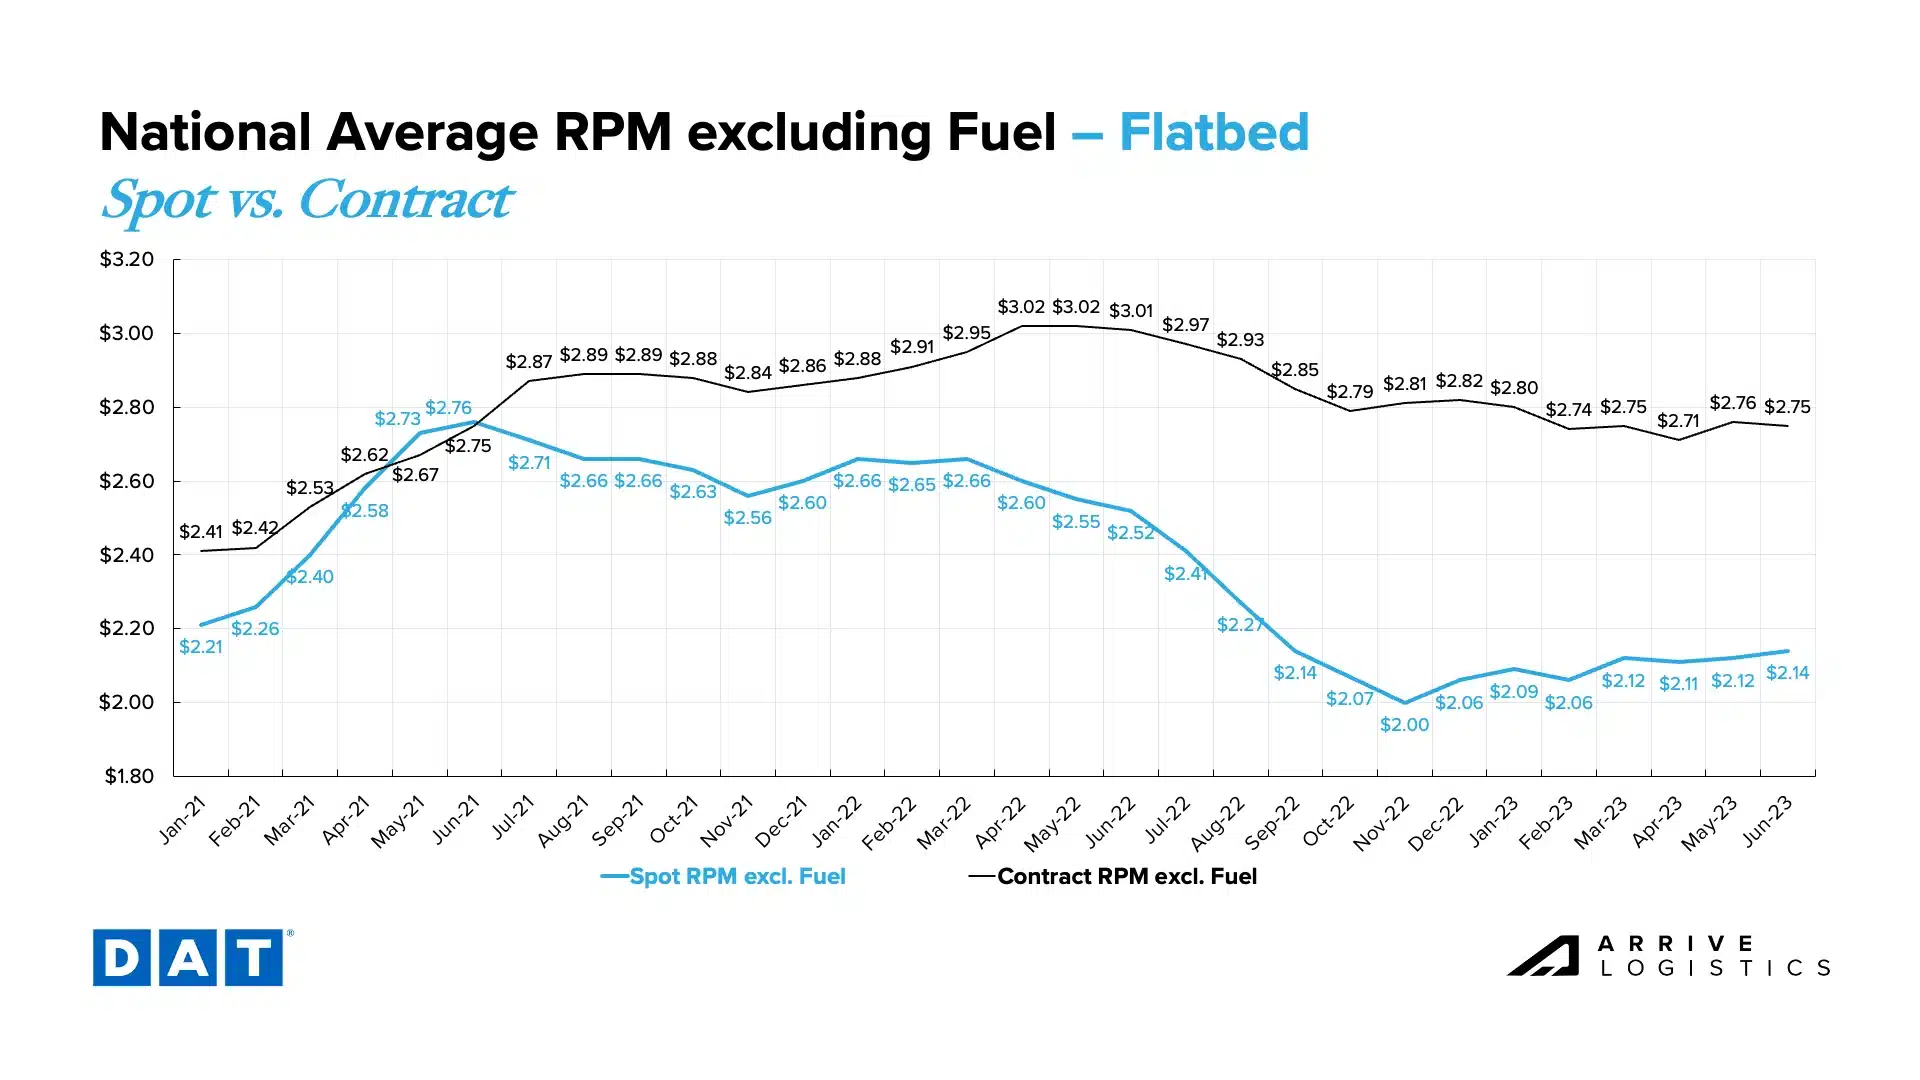 Figure 18: DAT Flatbed National Average RPM Spot vs. Contract
Carriers are happy to see the return of normal summer seasonal demand, especially those who have faced tough conditions over the last year due to high spot market exposure. Improved conditions will likely persist for at least the next month until demand and rates drop again following the July Fourth holiday. This rate ebb and flow through normal seasonal cycles reflects what we expect the spot market to look like through at least early 2024.
Whether or not current conditions are favorable enough to support the capacity surplus on the road today remains to be seen; seasonal opportunities help but may only delay the inevitable correction.
FTR’s Avery Vise recently noted that “During the first five months of 2022, 10 for-hire trucking firms with 100 or more trucks lost authority. During the same period in 2023, 31 carriers with 100 or more trucks lost authority.” While one or two truck operations going under is bad, it is safe to assume their capacity will stay in the market and eventually be absorbed by other firms. However, when a 100-truck operation folds, the impact is much more significant and points to how tough this landscape is for carriers.
Increased operating expenses are the primary culprit causing carriers to close, as overall rates are still high compared with historical (pre-pandemic) levels. This trend continues to drive historically high revocations of authority, with May numbers reaching the second-highest level ever.
 Figure 19: FTR Analysis of FMCSA Data
The resilient trucking sector job market showed month-over-month growth in May. However, it’s important to note that revisions to the previous month were lower by more than 3,000 jobs, and total employment is below what it was in January of 2023. So, while job growth continues to defy expectations given the declining truckload rate environment, the long-term trend points to more of a plateau for trucking employment, potentially as a result of having cash reserves on hand due to the highly elevated rates seen in the past few years.
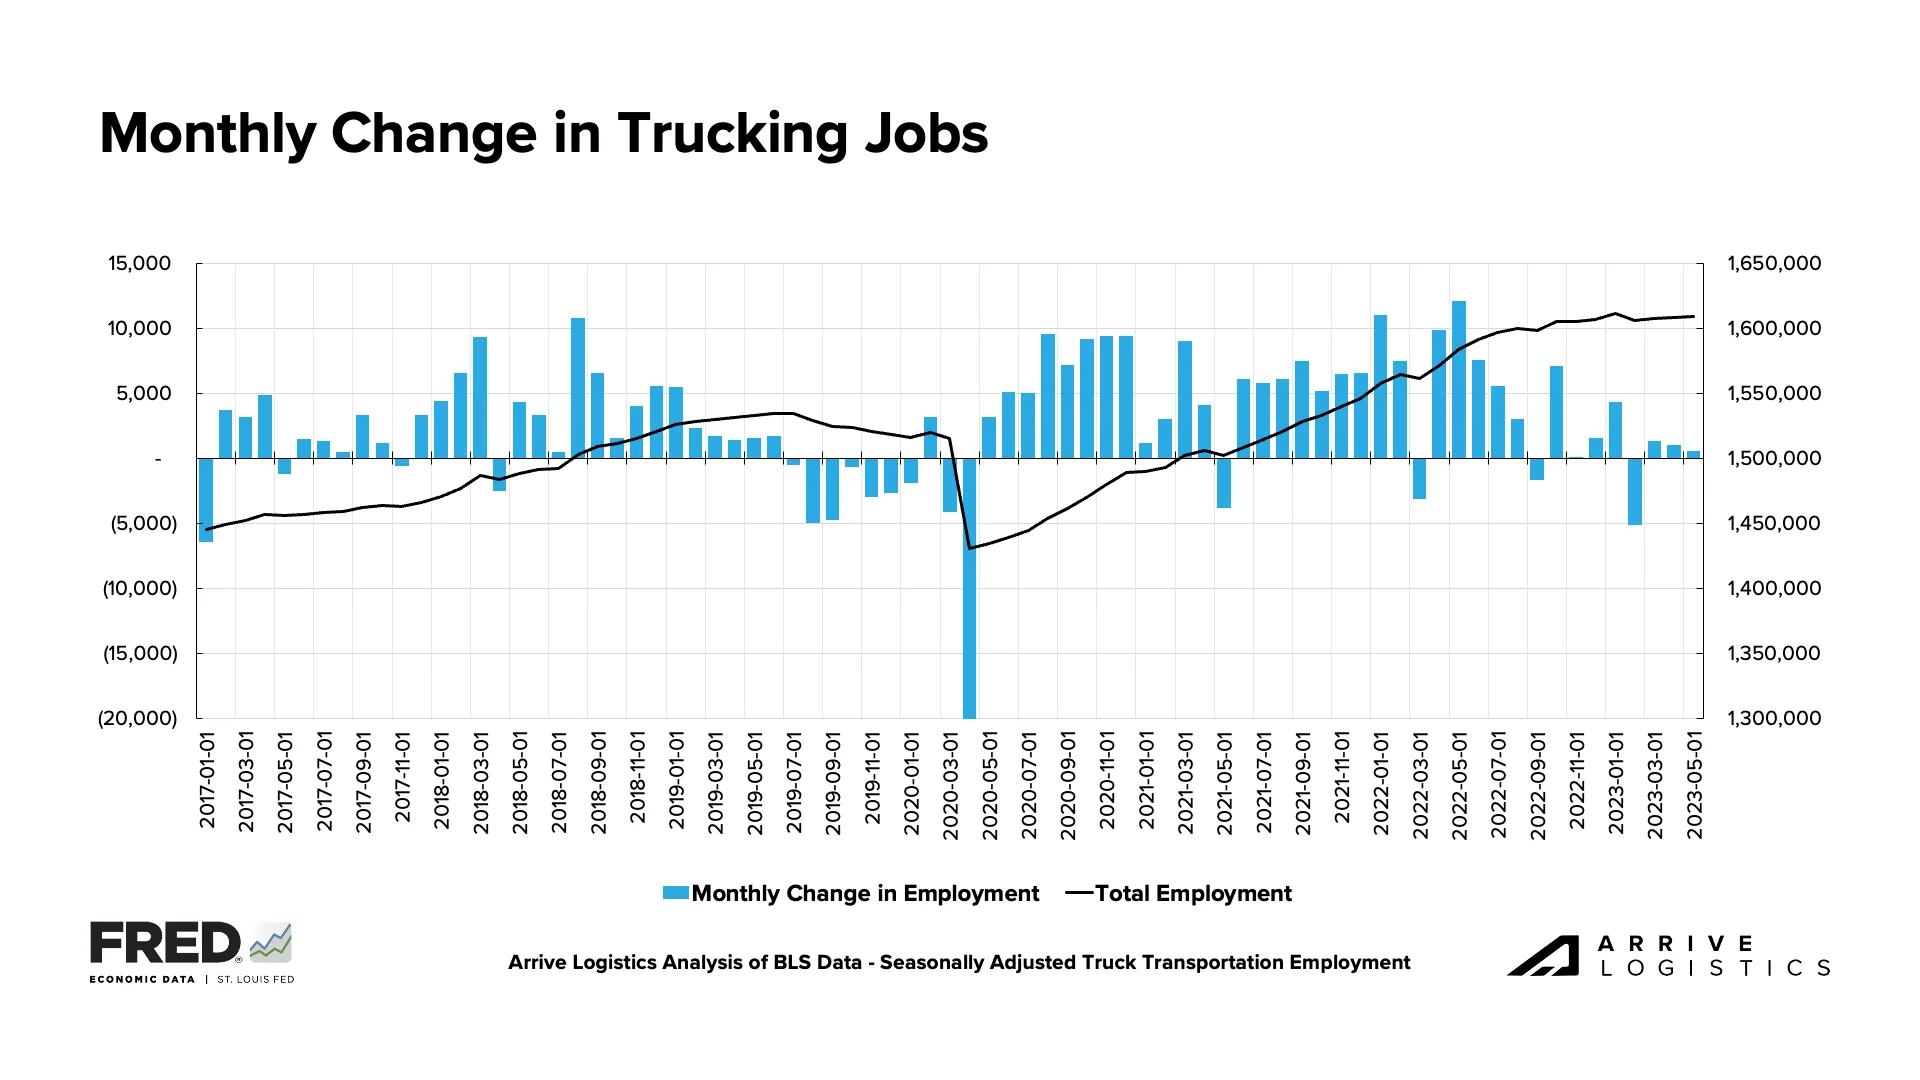 Figure 20: FTR’s Monthly Change in Trucking Jobs
A key trend we’re still watching is revocations outpacing new carriers entering the market for seven of the last eight months, reducing the total number of carriers. A significant amount of capacity that entered the market over the last few years remains unutilized, so we expect this disparity to continue for at least the near term.
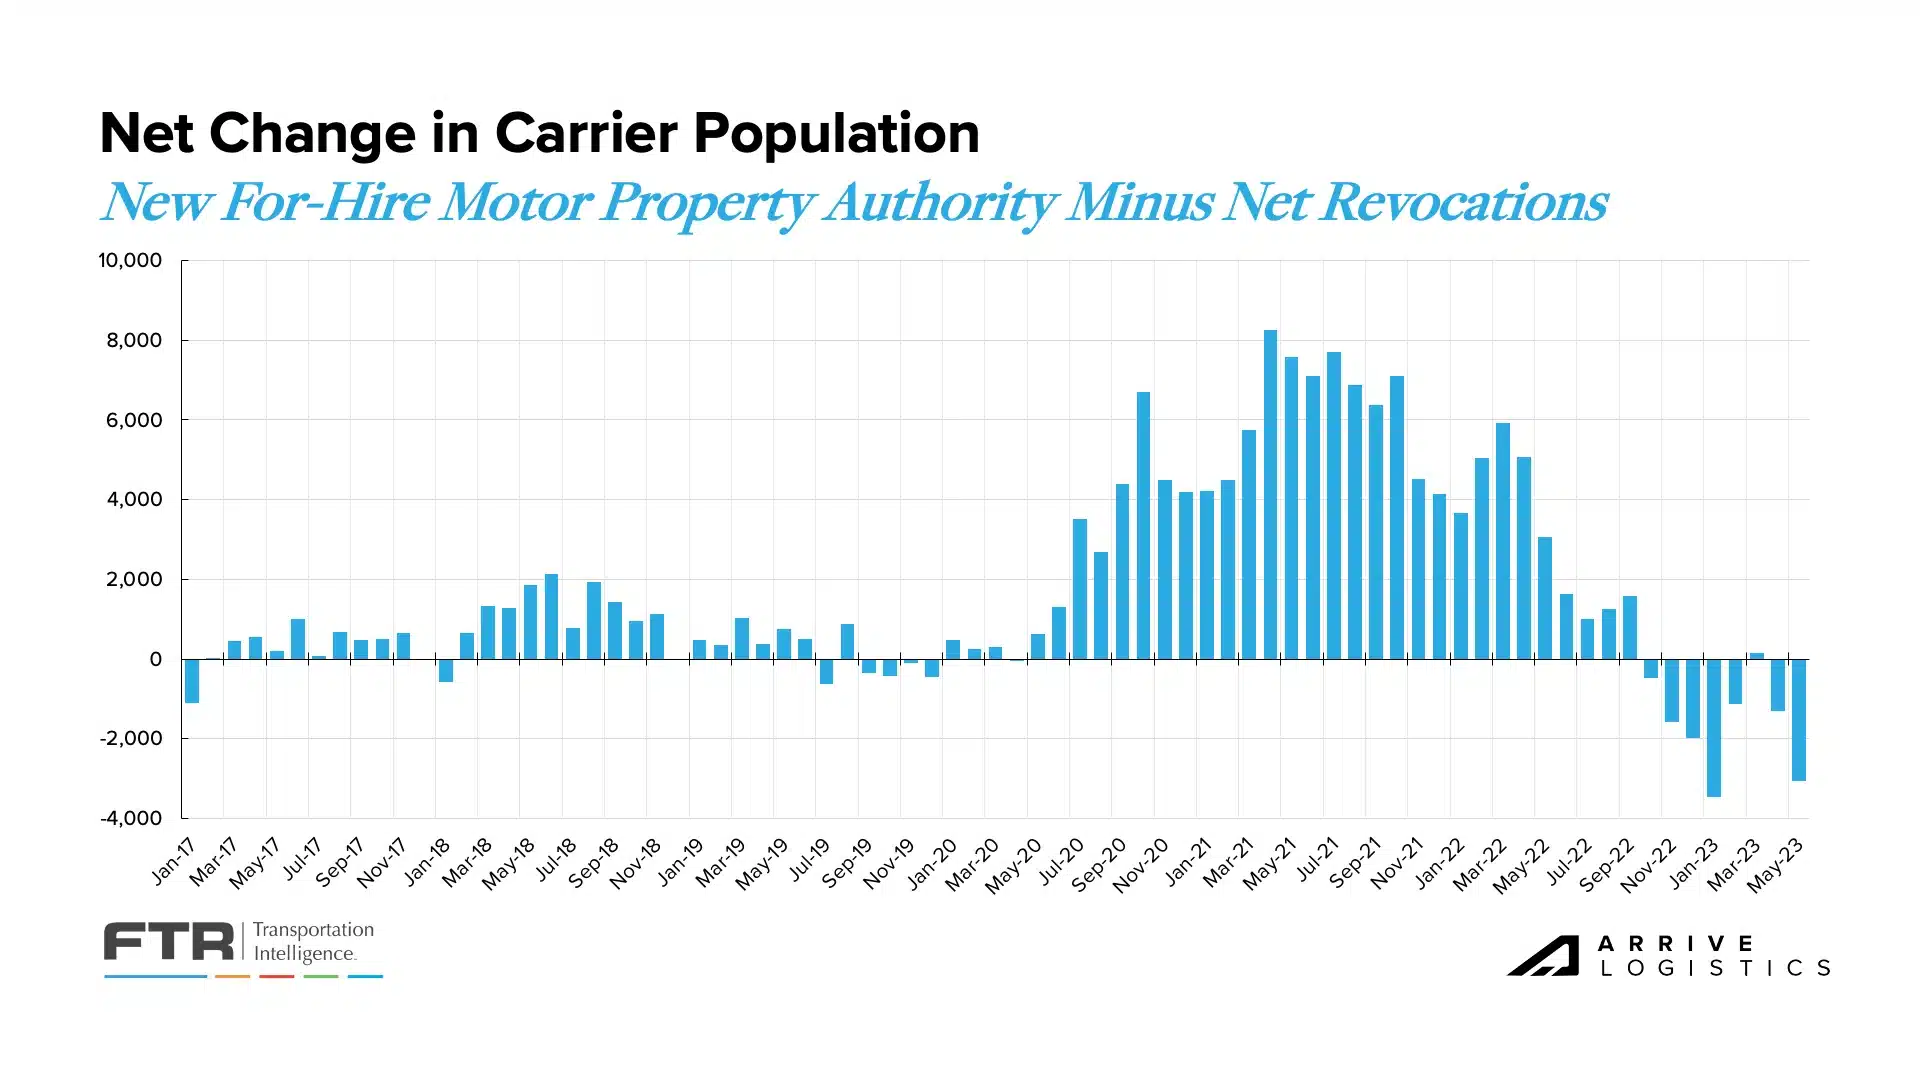 Figure 21: Net Change in Carrier Population: FTR Analysis of FMCSA Data
May was the second consecutive month FTR reported that new Class 8 truck orders increased slightly but remained below replacement levels. They noted the low order number isn’t a sign of falling demand but rather the result of 2023 build slots already being full. On the contrary, sources at ACT Research report that build slots are open, so the low orders are in fact a sign of falling demand. Despite these conflicting stories, one thing is certain: Historically, orders falling below replacement indicate a soft market.
 Figure 22: New Class 8 Truck Orders: Source: FTR
We continue to report on retail and manufacturing trends due to their significant impact on domestic freight demand. Recent data indicated a concerning outlook for both sectors. Manufacturing contracted for the seventh consecutive month, while imports have significantly declined from the record-setting levels observed a year ago.
The National Retail Federation (NRF) recently reported that import cargo volume at the nation’s major container ports could be 22% lower through the first half of 2023 than last year. According to the latest update from its Global Port Tracker, “Import container shipments have returned to the pre-pandemic levels seen in 2019 and appear likely to stay there for a while.” In the same report, the NRF had a much less optimistic tone than a month ago regarding labor negotiations at West Coast ports, having recently issued a statement calling on the Biden administration to intervene following reports of disruptions at terminals in Oakland and Long Beach.

Figure 23: NRF Monthly Imports
The latest ISM manufacturing report indicated more easing backlogs as new orders contracted for the ninth consecutive month amid slowing production. The new orders index contracted even faster, raising additional uncertainty about future backlogs and, in turn, truckload demand. Manufacturing was expected to be one of the main volume drivers in 2023, and if contraction continues, demand will likely fall further than previously forecasted. However, there is still significant pent-up demand in the sector that should enable healthy volumes in the near term.
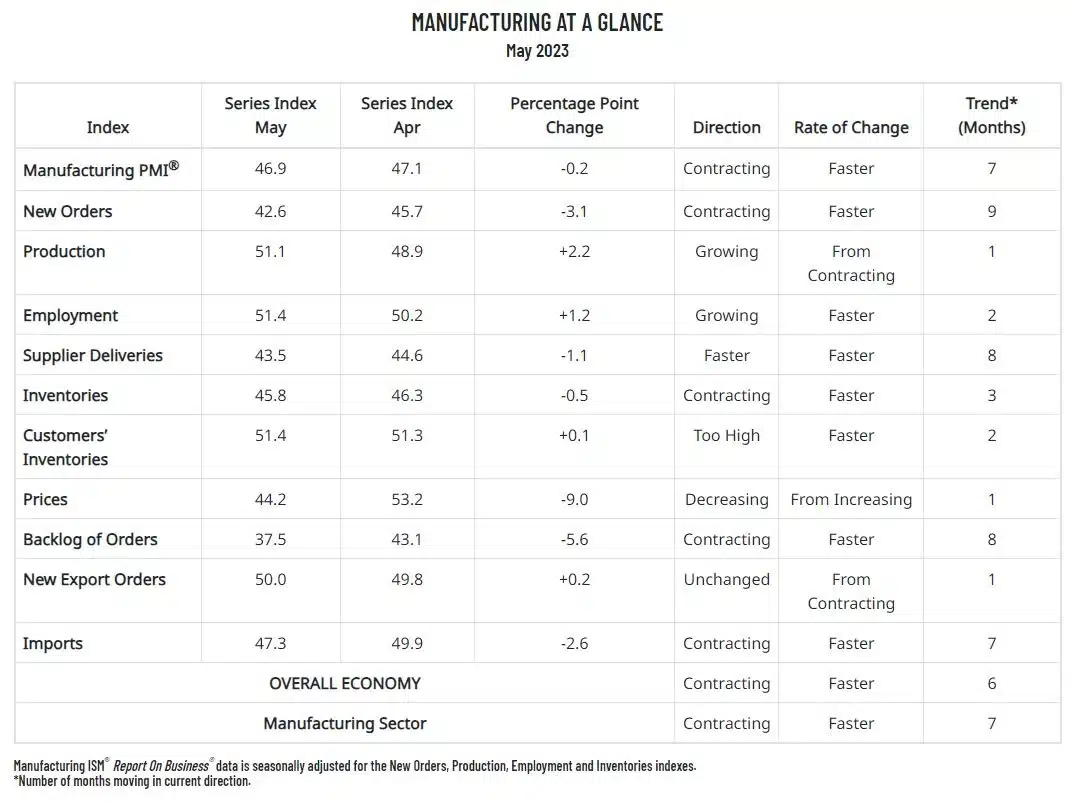 Figure 24: ISM Manufacturing Report, Manufacturing at a Glance
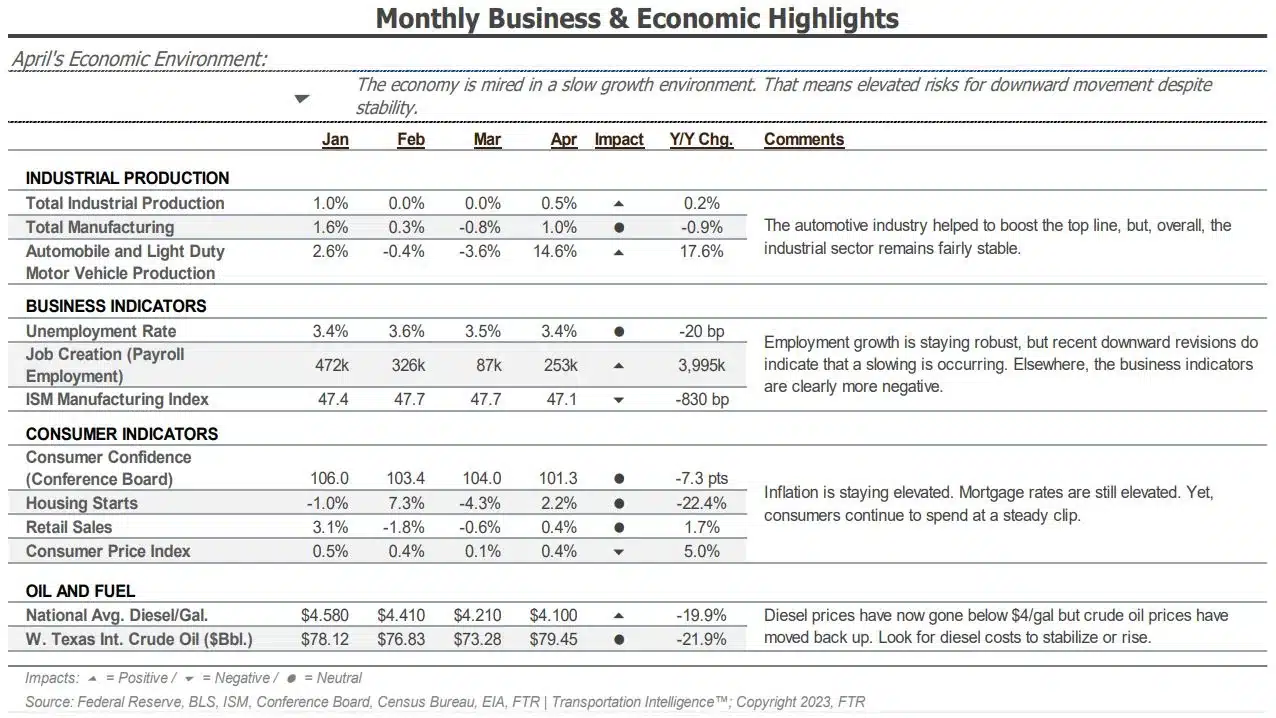 Figure 25: Monthly Business & Economic Highlights
FTR’s latest truck loadings forecast improved again this month, increasing 0.5% from flat year-over-year growth following a stronger construction and food loadings outlook in most trucking segments. The 2024 outlook was also marginally stronger.
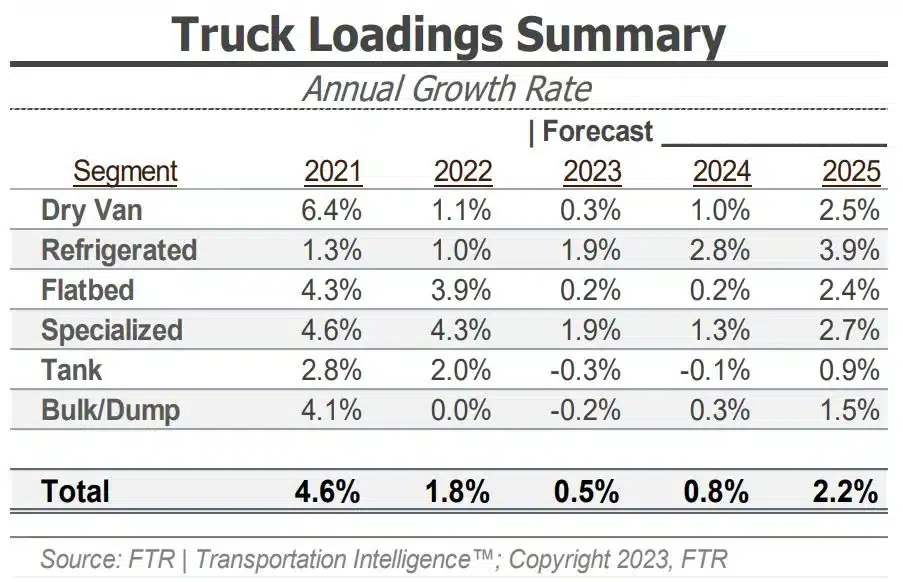 Figure 26: FTR’s Truck Loads Summary
June CPI data showed inflation slowed for the eleventh consecutive month in May, falling to 4.0% year-over-year growth (5.3% excluding food and energy). The data will give the Fed much to consider when they meet to decide whether or not to continue raising interest rates. Many believe there has not been enough disinflation to pause rate hikes for at least one session to see how prices react. Ultimately, slowing or reversing course on rate hikes positively affects future freight demand.
 Figure 27: New York Times Inflation Data
May Bank of America card data showed consumer spending per household decreased by 0.2% year-over-year. While this is the second consecutive year-over-year decrease, month-over-month spending did rise on a seasonally adjusted basis. Department store, grocery and home improvement spending helped drive the increase. Gas spending was the only major category to see negative growth, though it was likely due to falling prices. Overall, card spending was relatively strong in May.
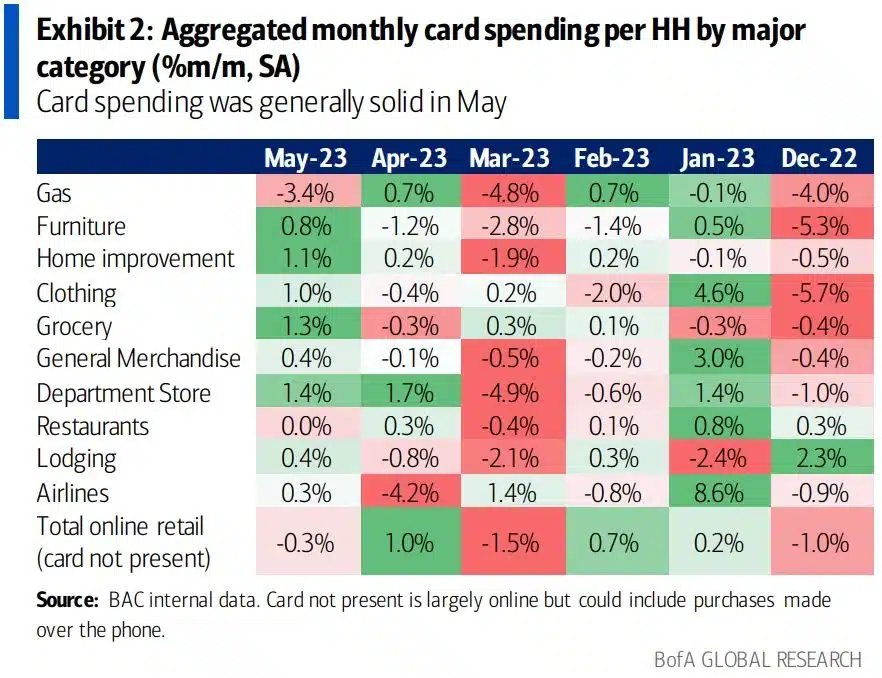 Figure 28: Bank of America Aggregated Monthly Card Spending
Services spending has slowed by 0.8% in the last three months, indicating that the tailwinds associated with reopening may have run their course. Durable goods spending increased slightly in May, but we believe the durable goods spending story remains the same. Because durable goods tend to move on trucks, these spending declines significantly impact truckload demand.
 Figure 29: Bank of America Monthly Card Spending on Durable Goods vs. Leisure Services
Initial jobless claims have increased slightly in recent months, and current levels are the highest since October 2021. Overall claims remain low, but recent increases indicate the labor market may be showing some cracks. The unemployment rate, however, remains extremely low and is a sign that the market is still relatively strong despite the recent rise in layoffs. The robust labor market signals confidence in consumers’ ability to sustain current spending levels and avoid a sudden drop in truckload demand.
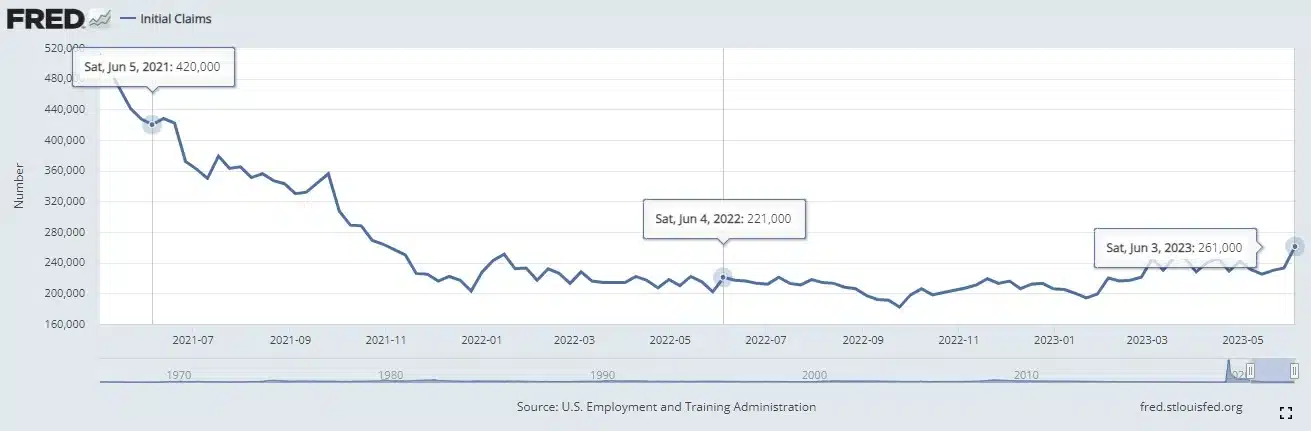 Figure 30: FRED Initial Claims
 Figure 31: FRED Unemployment Rate