


February is typically the slowest month of the year for the freight market, and this one was no exception. Though overall demand remained healthy relative to pre-pandemic levels and trends were in line with normal seasonality, the market did show some early signs of faltering. Volumes are picking up in early March, and accepted tenders are currently up 1.4% from where they were at this time last month. However, it is still unclear whether this seasonal uptick will be strong enough to stave off further demand declines in the coming months.
The FreightWaves SONAR Outbound Tender Volume Index (OTVI), which measures contract tender volumes across all modes, was down 30% year-over-year, or 17% when measuring accepted volumes after the significant decline in tender rejection rates. The significant decline is still inconsistent with other sources. Though unconfirmed by FreightWaves, it is likely that their data is heavily skewed toward retail freight, for which demand has slowed substantially since Q4 2021. If true, this would help explain the significant drop in volumes.
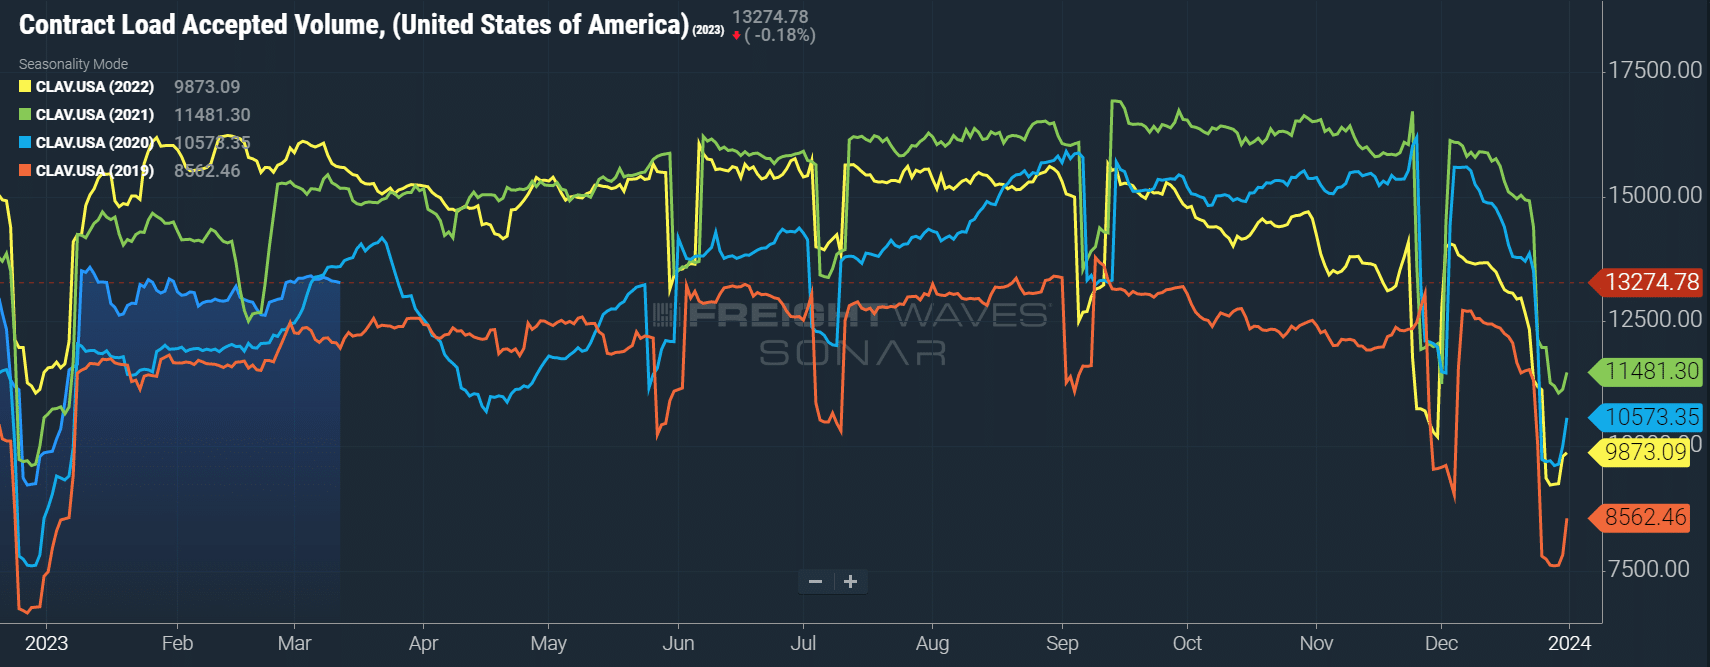 Figure 1: Contract Load Accepted Volume (SONAR): Accepted contract volumes are down 17% y/y in early March but remain above historical pre-pandemic levels.
The February contract versus spot market story stayed consistent with January, as shippers still heavily favored contractual freight. DAT data showed spot volumes were down 70% year-over-year and 17% month-over-month in February, a sign of easing seasonal pressure at the end of January.
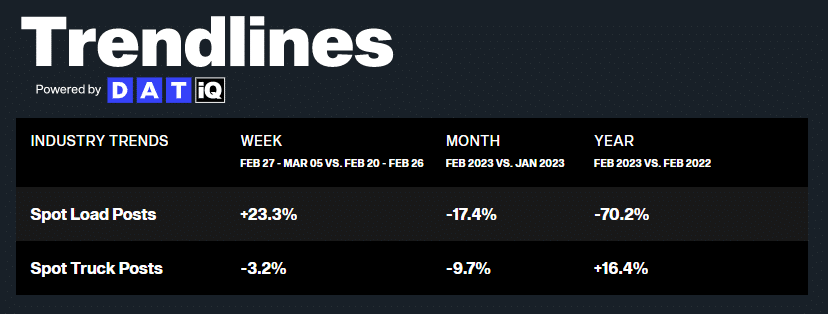 Figure 2: DAT Trendlines: Industry Trends, Spot Load Posts vs. Spot Truck Posts
February provided further proof that capacity is and will likely continue to be abundant in the market for at least the short term. Aside from a nominal uptick last month, tender rejections remain historically low for this time of year, indicating that carriers are still willing and able to support current demand.
The Sonar Outbound Tender Reject Index (OTRI) measures the rate at which carriers reject the freight they are contractually required to take. The rate remained relatively flat month-to-month, increasing from 3.47% in early February to 3.52% in early March. This indicates that shippers are still seeing good routing guide compliance on contractual freight. Meanwhile, reefer tender rejections aligned with van rejections, easing throughout the month.
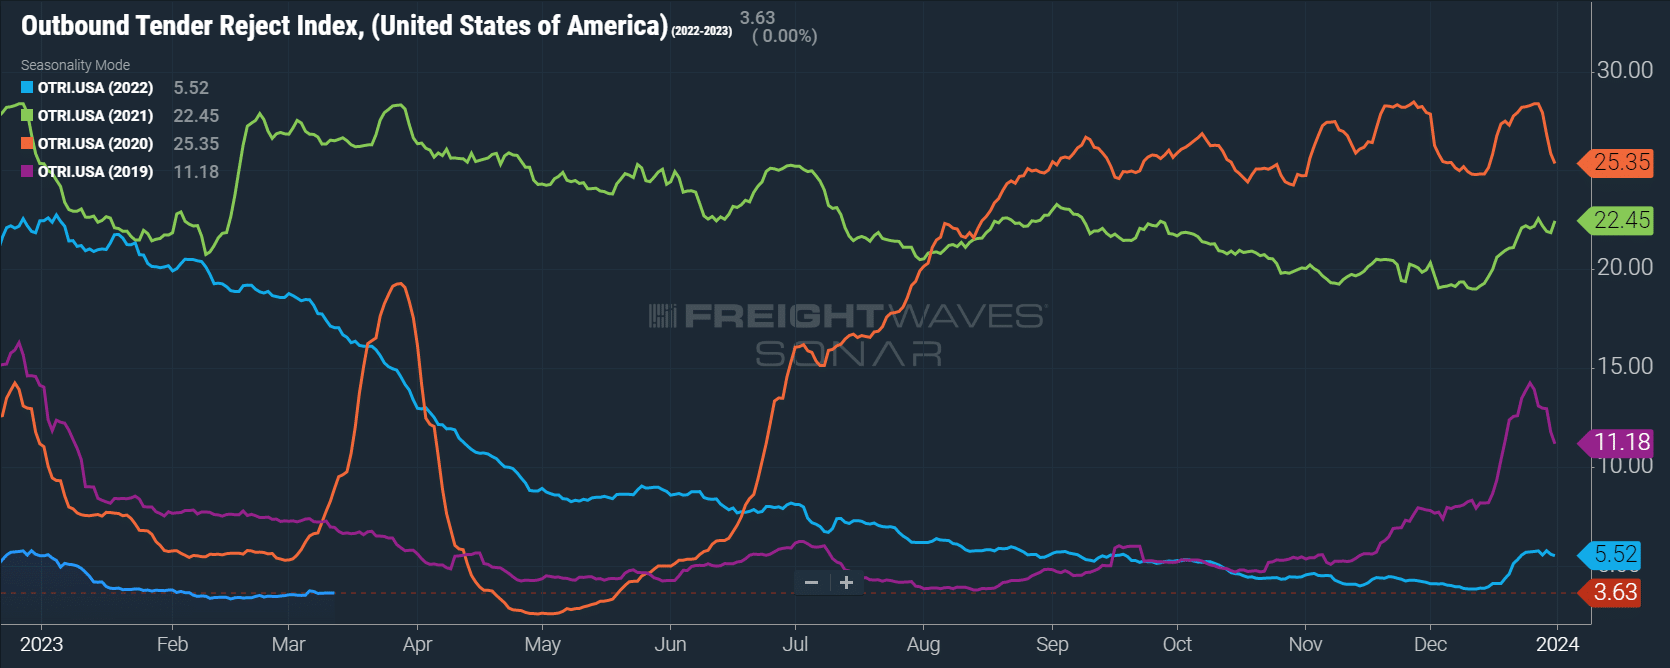 Figure 3: Outbound Tender Reject Index (SONAR): OTRI remains at an all time low for this time of year — a sign capacity is sufficient to support demand and carriers are protecting their contract freight.
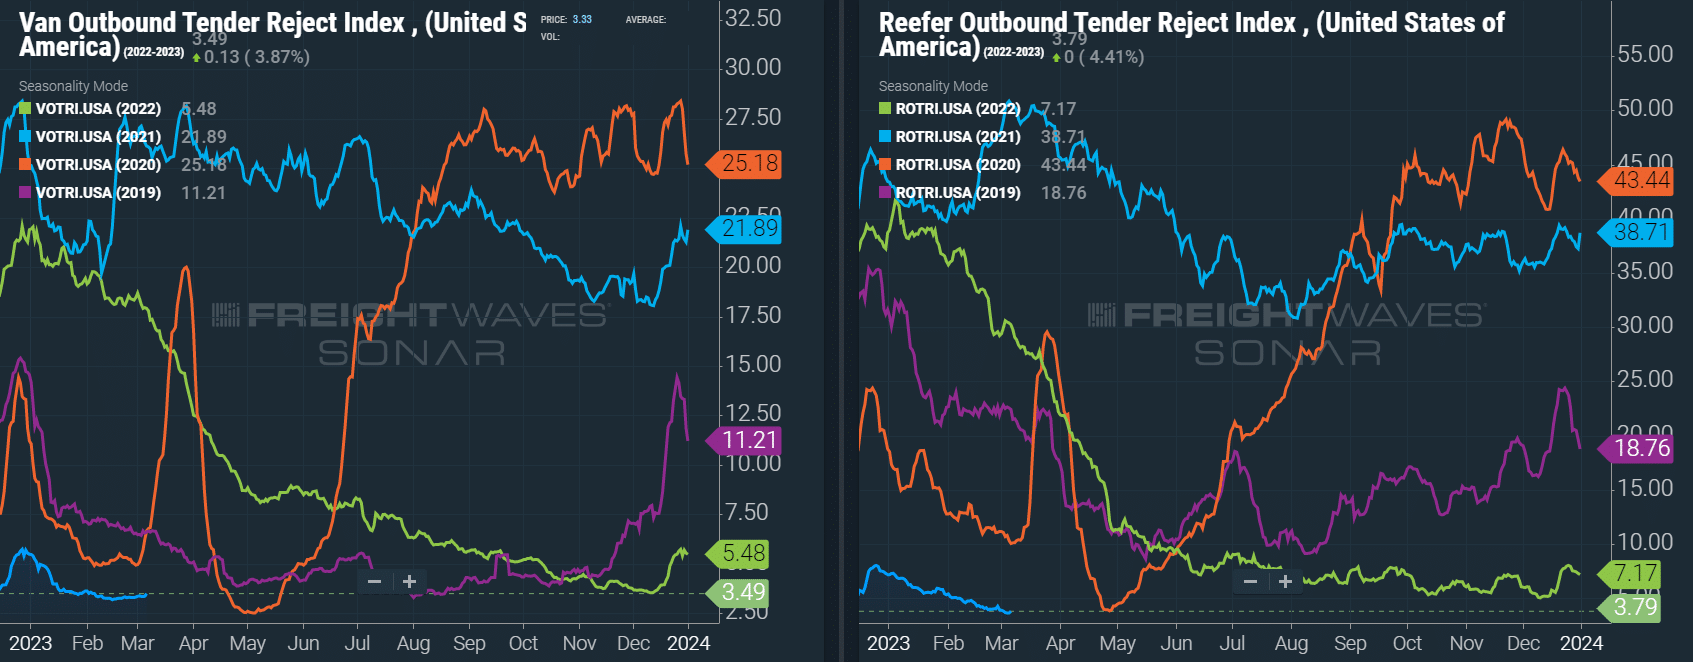 Figures 4 & 5: Van & Reefer Outbound Tender Reject Indices (SONAR): Dry van and reefer tender rejections are trending at all-time lows for this time of year, with dry van rejection rates below 3.5% and reefer rejections below 4%.
The DAT Load-to-Truck Ratio measures the total number of loads relative to the total number of trucks posted on their spot load board. February data was consistent with typical seasonal easing: The Dry Van Load-to-Truck Ratio was down 16% month-over-month and 65% year-over-year, and the Reefer Load-to-Truck Ratio was down 20% month-over-month and 72% year-over-year.
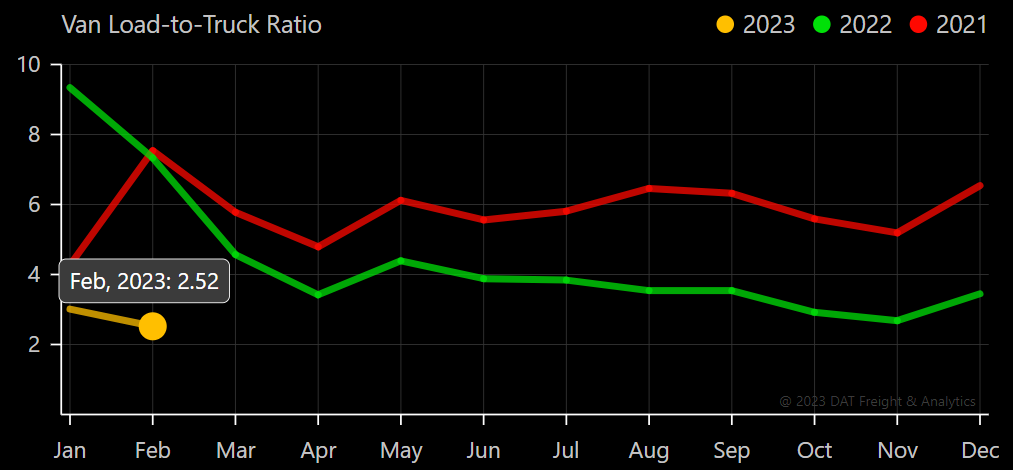
Figure 6: DAT Van Load-to-Truck Ratio
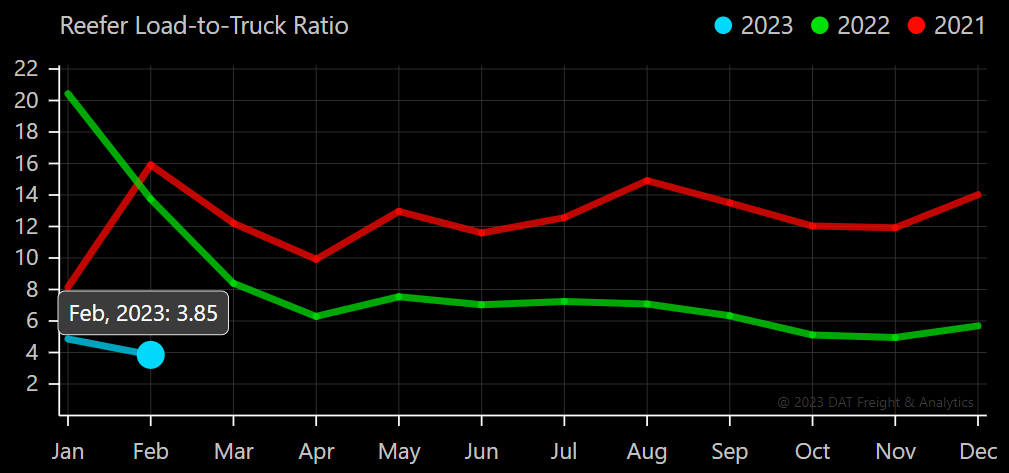 Figure 7: DAT Reefer Load-to-Truck Ratio
Weekly Load to Truck Ratio trends across all modes showed a spot load increase in the last week of February due to the overlap of a short-lived activity surge and widespread winter weather.
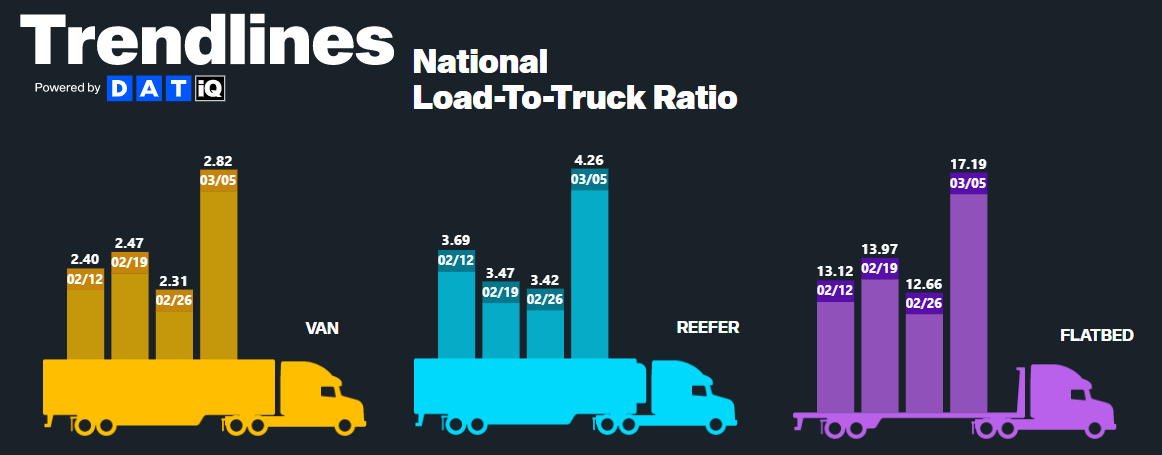 Figure 8: DAT Trendlines, National Load-to-Truck Ratio
The Morgan Stanley Dry Van Freight Index is another measure of relative supply; the higher the index, the tighter the market conditions. The black line with triangle markers on the chart provides a great view of what directional trends would be in line with normal seasonality based on historical data dating back to 2007.
While the data continues to show underperformance relative to normal seasonality, a recent plateau signals we are still seeing movements in line with expectations. Nonetheless, some tightening is expected with the early produce season in March, but it is unlikely to significantly disrupt shipper tender acceptance.
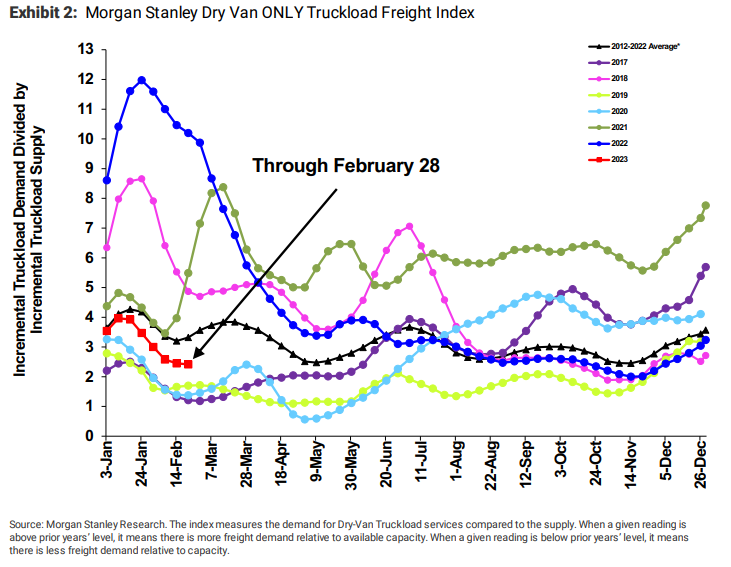 Figure 9: Morgan Stanley Dry Van Only Truckload Freight Index
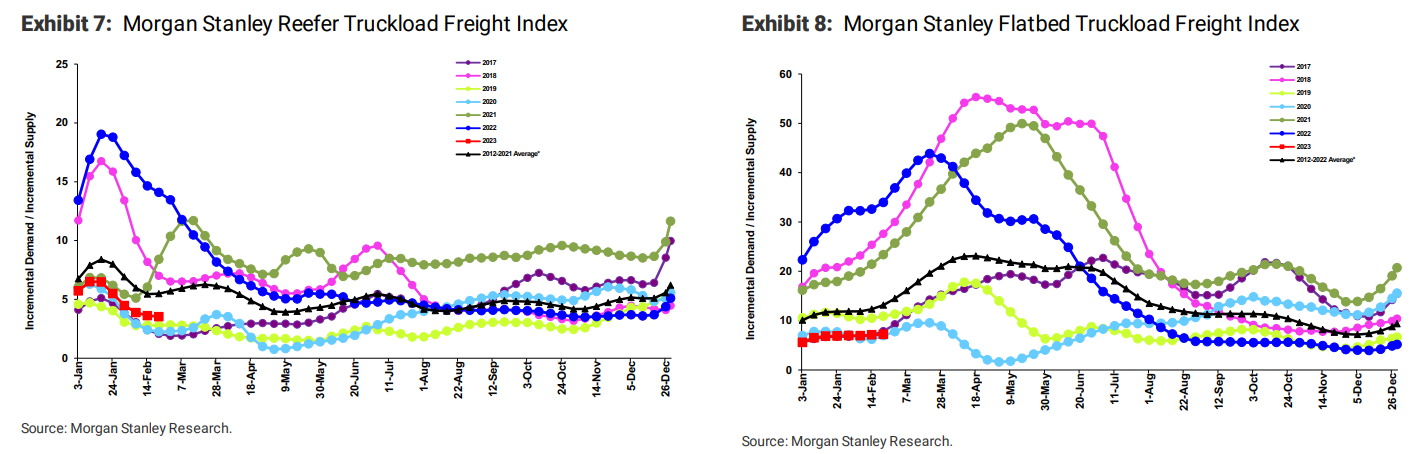 Figures 10 & 11: Morgan Stanley Reefer & Flatbed Truckload Freight Indices
As with Load-to-Truck Ratio trends, rates spiked briefly near the end of the month due to widespread winter weather and a resulting brief spot demand surge. However, February rates remained mostly in line with normal seasonal patterns. Spot rates don’t appear to have fully bottomed out just yet, so shippers are still in a great position to lock in low contract rates before we reach the floor.
Looking at the Weekly Dry Van Spot Rates chart, rates briefly found a floor in recent weeks but have since trended back up. A similar situation occurred in 2019 when capacity conditions and other market pressures were much like today. At that time, rates continued to trend down into April after the March uptick, and we expect to see the same scenario play out this year.
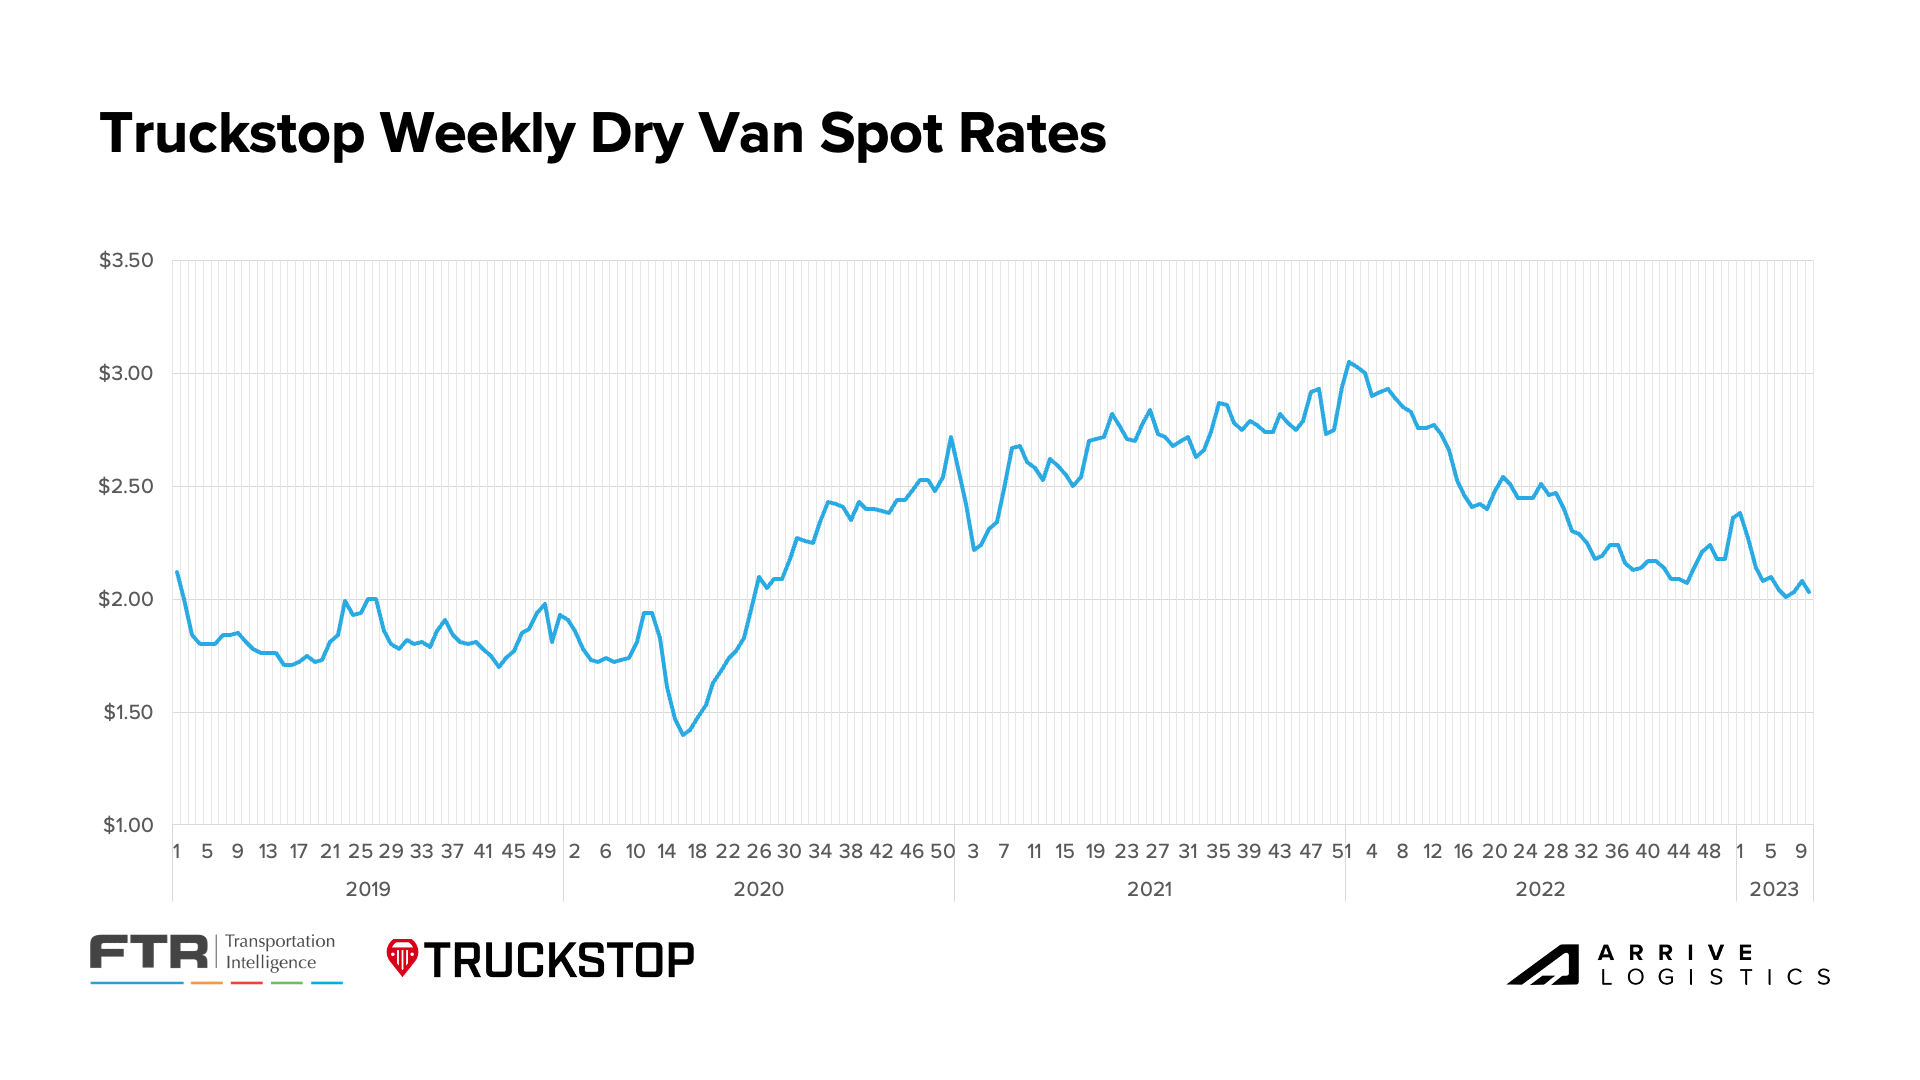 Figure 12: Truckstop & FTR: Weekly Dry Van Spot Rates
According to DAT, all-in spot rates, including linehaul and fuel costs, are down across dry van and reefer equipment types but are up for flatbed equipment. As of March 10th, van and reefer equipment have fallen by $0.02 and $0.04, respectively, compared to an increase of $0.04 for flatbed.
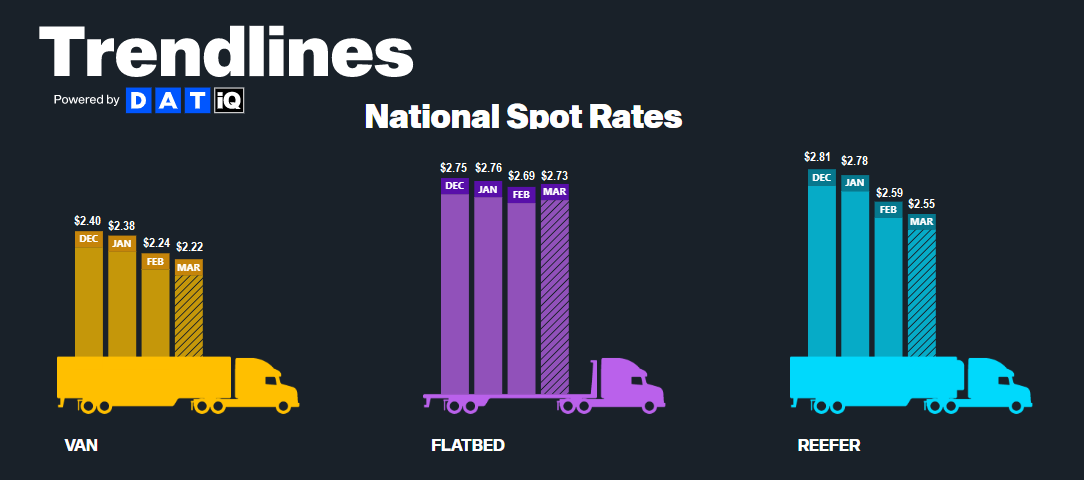 Figure 13: DAT Trendlines, National Spot Rates
Early March linehaul data shows spot rates stabilizing and contract rates continuing their downward trend of the past year for van and reefer equipment, while flatbed spot and contract rates are on the rise.
The van rate spread is holding relatively steady at $0.61 between spot and contract rates. As a result, downward pressure on contract rates should continue for the foreseeable future, even if the market experiences some seasonal pressures in the back half of the second quarter.
All-in spot rates are down 27% year-over-year, and linehaul spot rates are down 29%. All-in contract rates are down 13% year-over-year, and linehaul contract rates are down 11.1%.
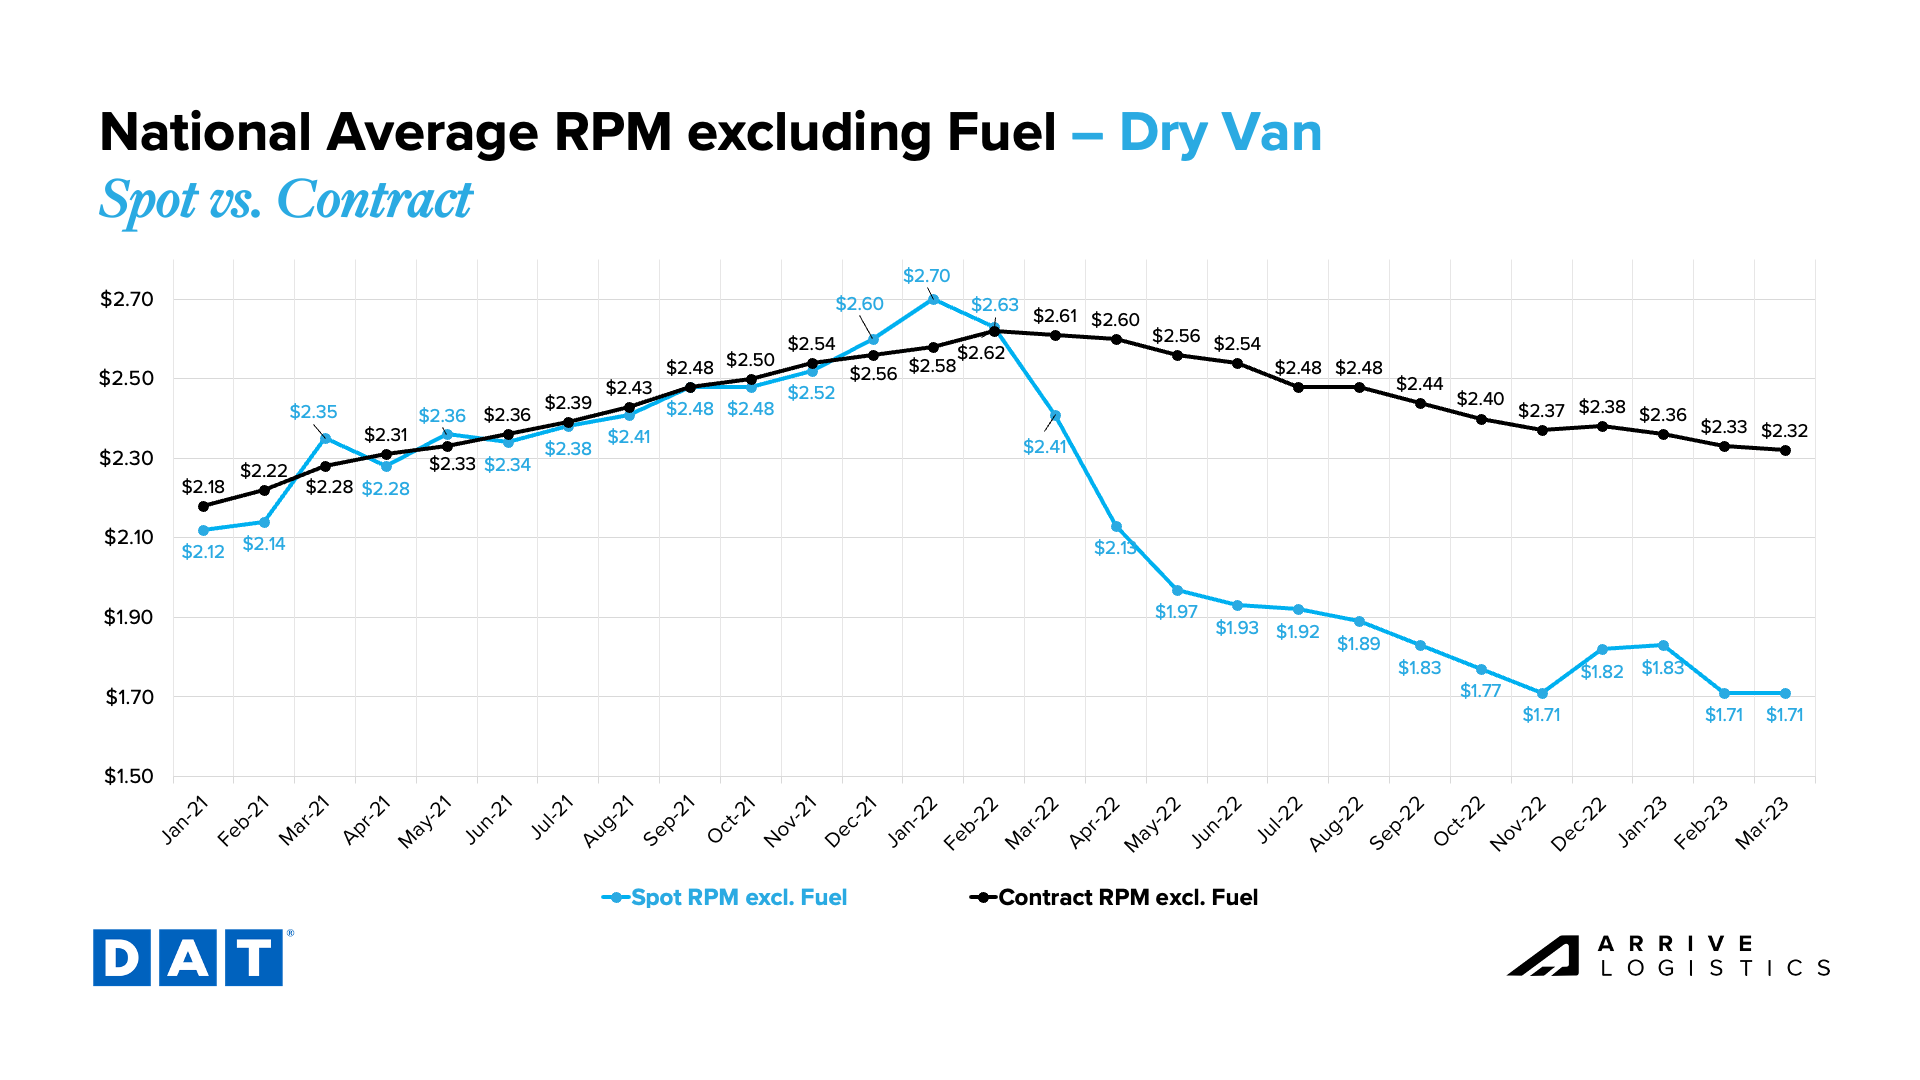 Figure 14: DAT National Average RPM, Dry Van, Spot vs. Contract: Van spot rates have stabilized in February and early March as supply and demand rebalanced to pre-holiday conditions.
Reefer spot and contract linehaul rates are following the same pattern as van rates early in the month. Down 7.7% year-over-year, the current reefer contract rate is $2.53 per mile, excluding fuel, while the current reefer spot rate is down 27% year-over-year to $2.00 per mile, excluding fuel. This is still a significant decline, but slightly less dramatic than the 33% plummet in February.
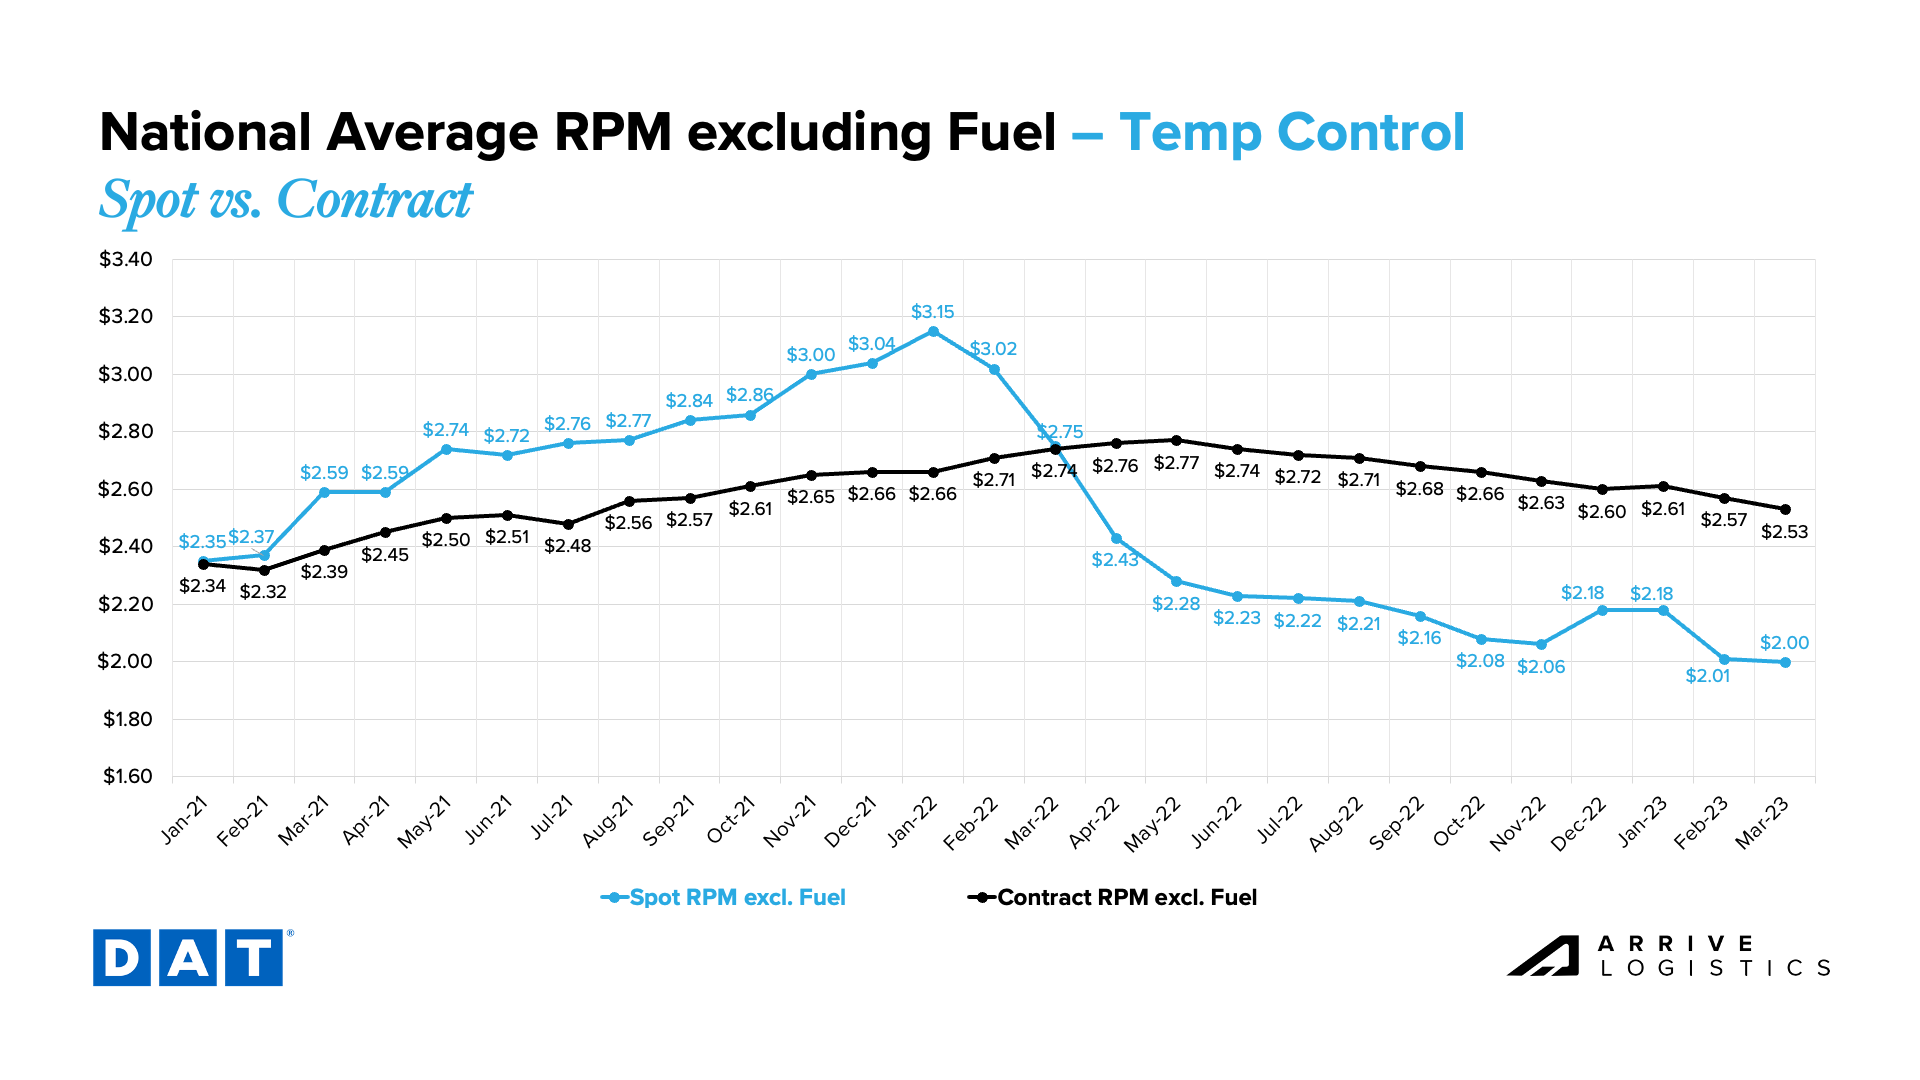 Figure 15: DAT National Average RPM, Temp Control, Spot vs. Contract
Thanks in part to the return of warm weather and the onset of construction season in the south, spot and contract flatbed rates both had meaningful month-over-month increases. Spot rates landed at $2.12 and contract at $2.81.
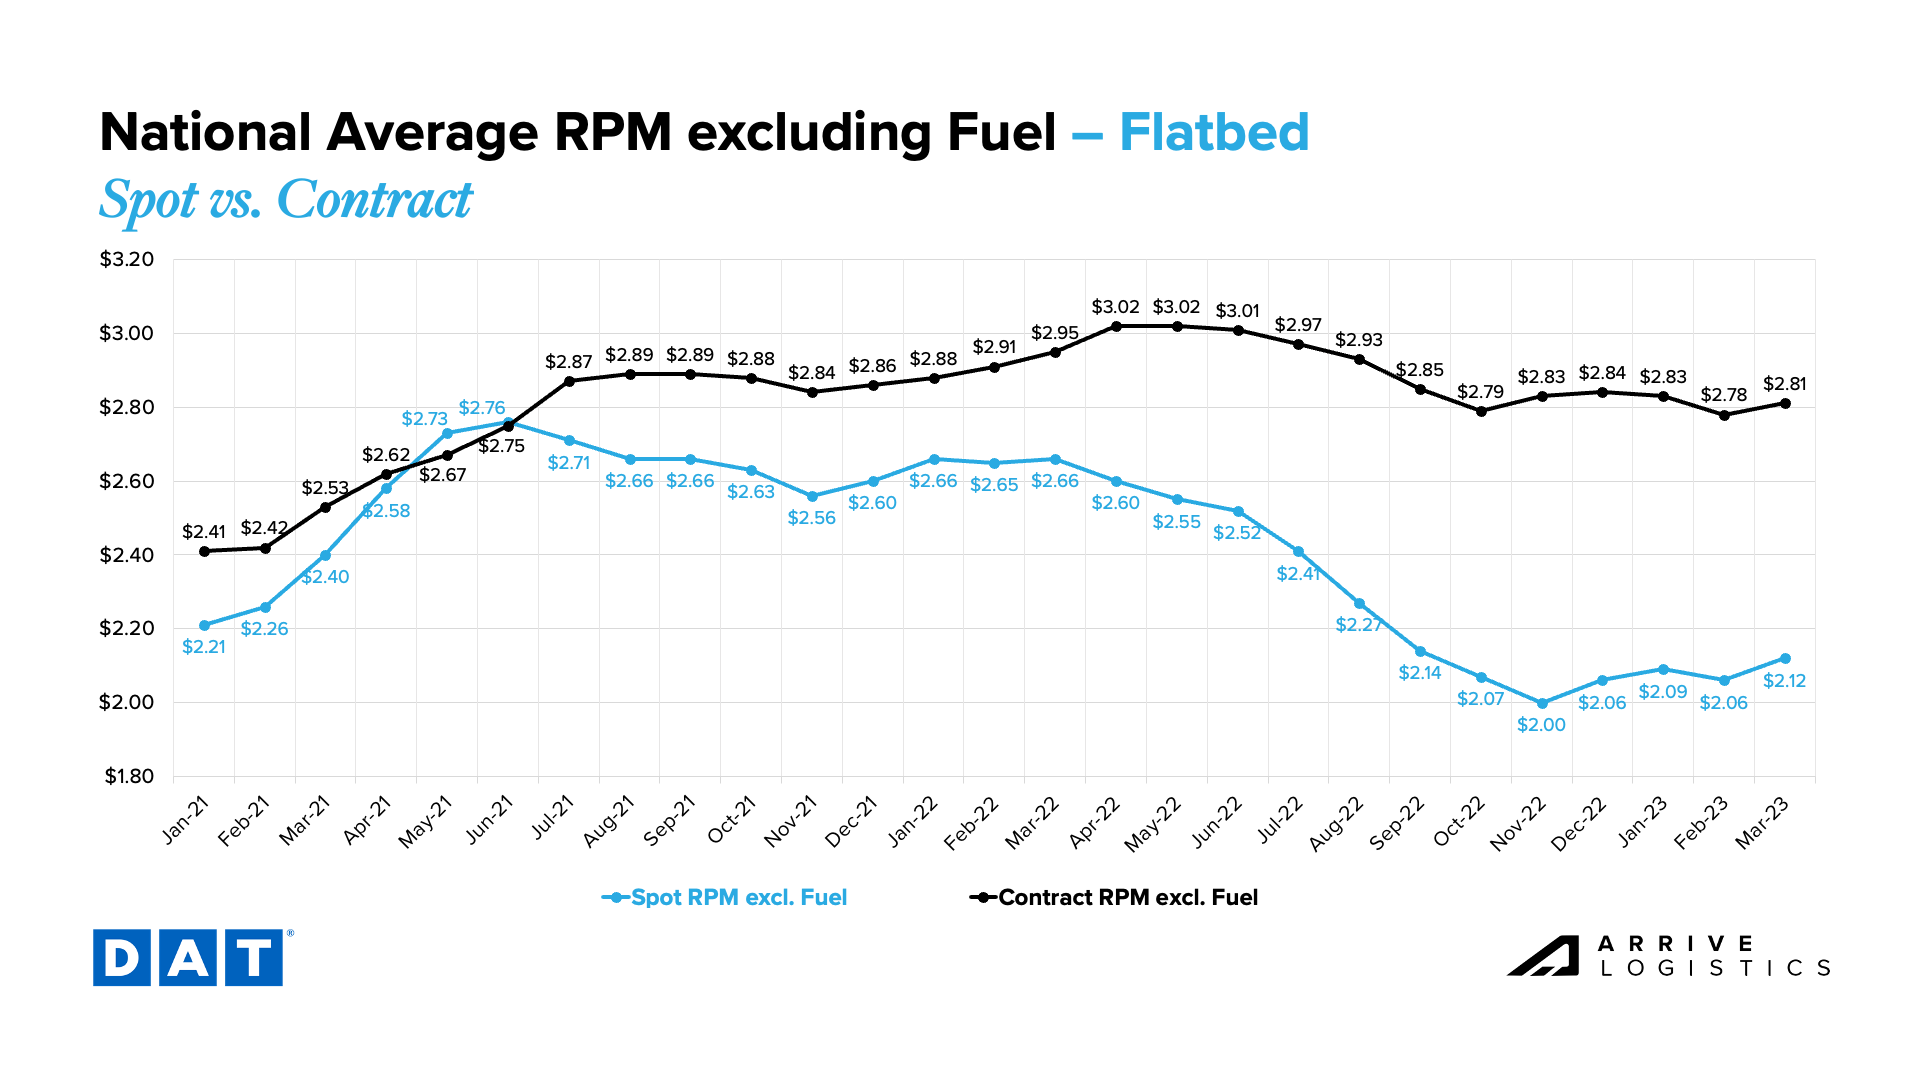 Figure 16: DAT National Average RPM, Flatbed, Spot vs. Contract
Decreasing demand is expected to continue causing oversupply in the market, resulting in ongoing capacity normalization. Carriers in the spot market are still facing poor conditions, and revocations of trucking authority remain at historically high levels, despite a slight pullback from January. Some revocations may be owner-operators taking company jobs, while others are carriers opting out of the market altogether.
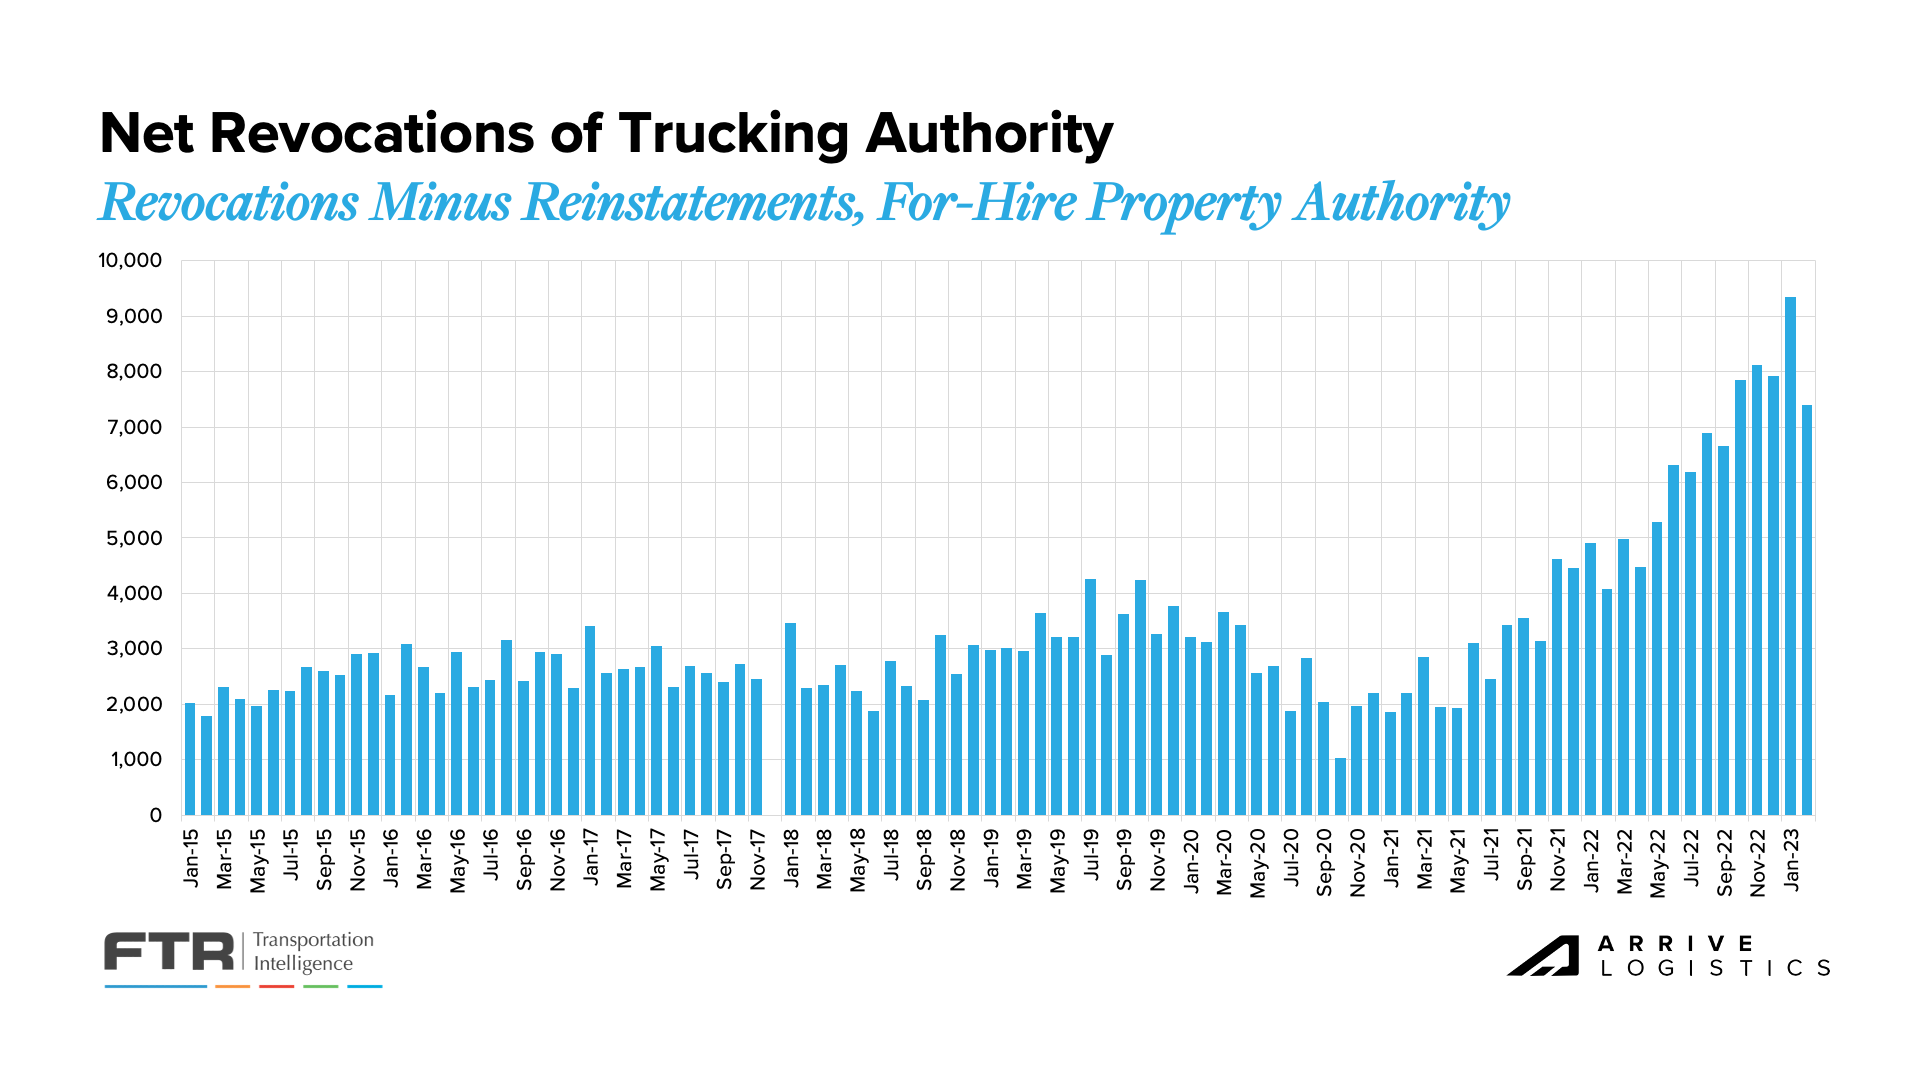 Figure 17: Net Revocations of Trucking Authority: FTR Analysis of FMCSA Data
In February, the trucking industry experienced the largest decline in employment since the May 2020 pandemic lockdowns. This decline indicates that the number of drivers leaving the market is now surpassing the total number of owner-operators taking company jobs, which we believed was the main reason for the increase in employment for the better part of the past year. It is also representative of what we anticipate moving forward. The expectation is that shippers, many of whom have revised their volume forecasts down from pandemic levels, will be distributing smaller contract awards coming out of the Q1 RFP season. Carriers impacted by smaller awards will be forced to right-size their fleets.
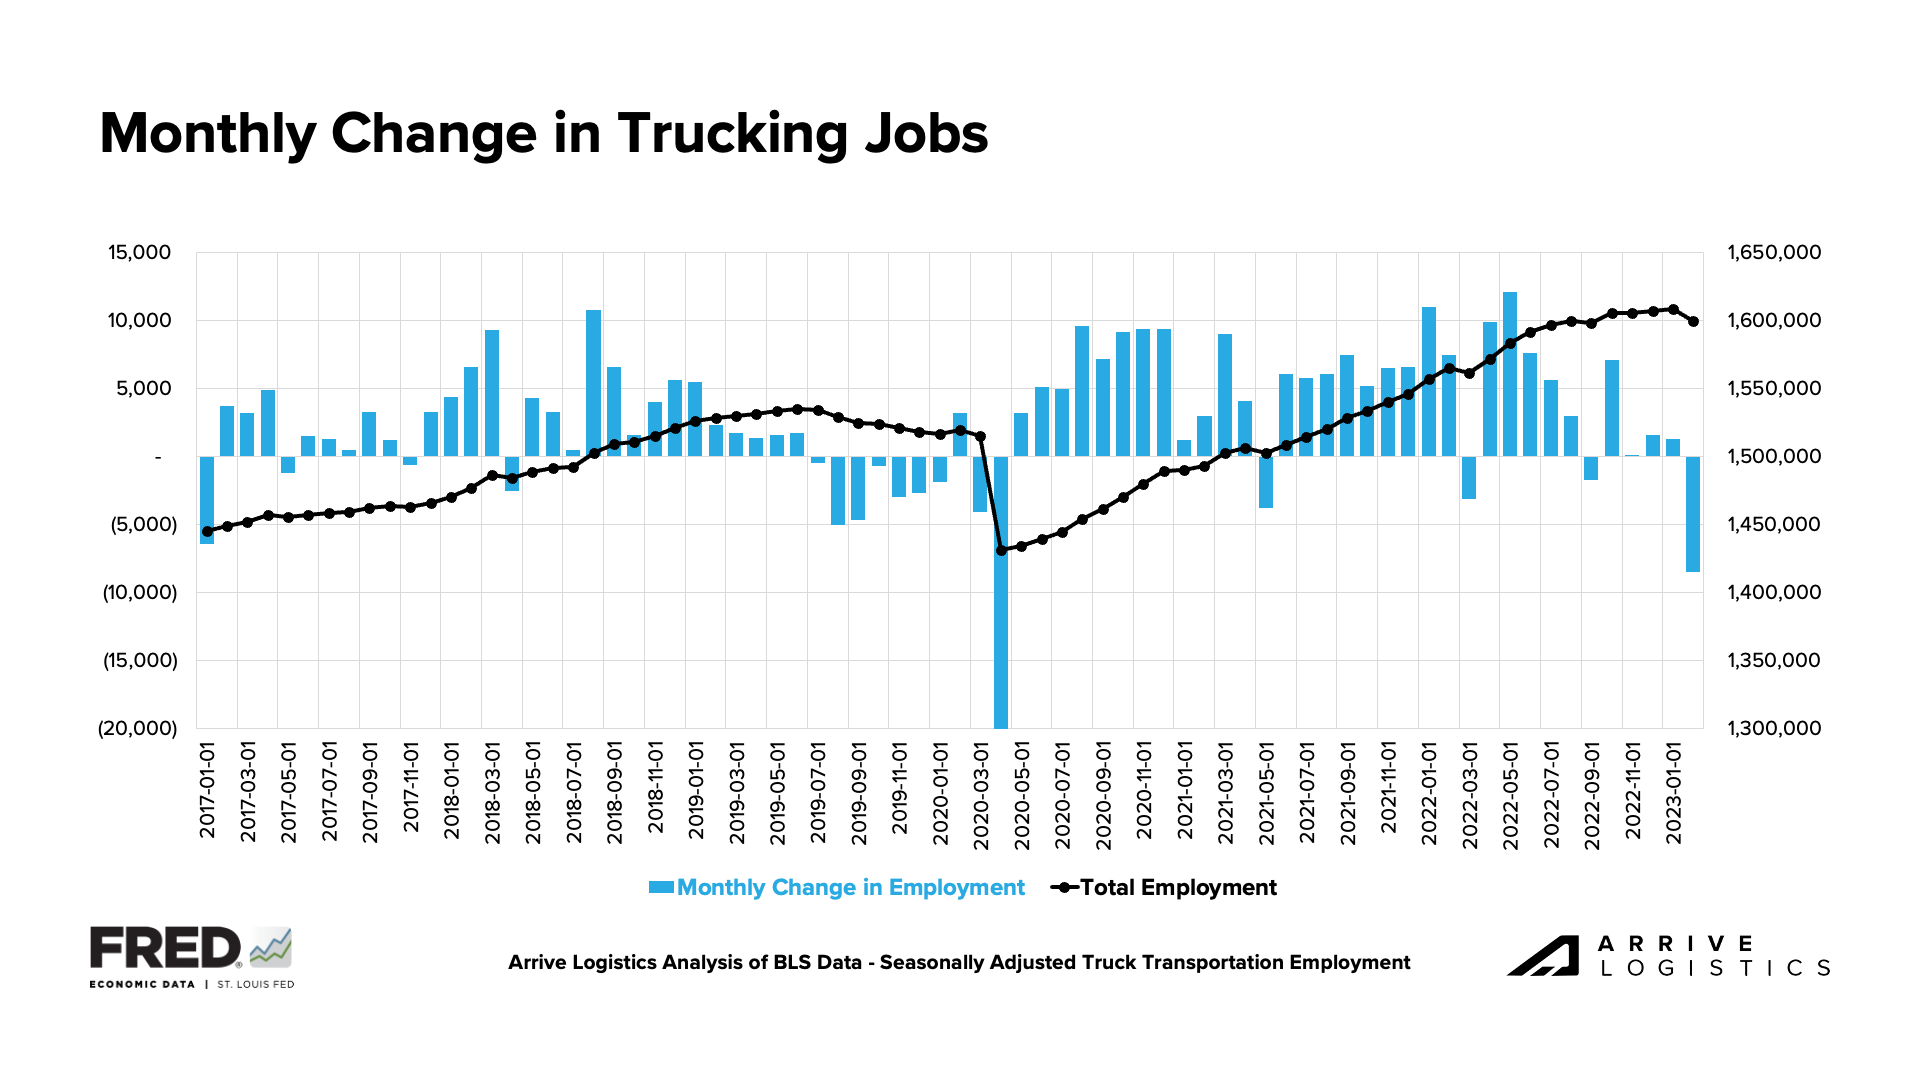 Figure 18: Monthly Change in Trucking Jobs
Q4 cost data of publicly traded carriers showed spot rates continue to trend below operating costs per mile, which may be causing more carriers with high spot exposure to close their businesses. Historically, capacity normalizes, and spot rates rise quickly when this occurs, but the gap could remain stickier than in past cycles if demand continues to fall.
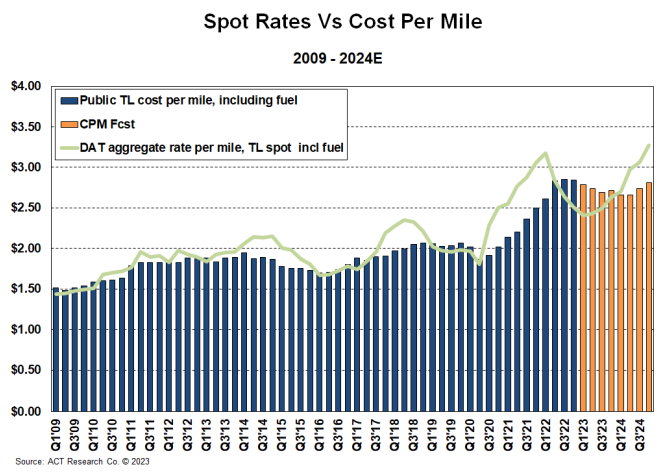 Figure 19: Spot Rates vs. Cost Per Mile: ACT Research
A key trend we’re watching is that for five consecutive months, the number of revocations has outpaced the number of net new carriers entering the market, leading to a reduction in total carriers. Although the number is lower than in January, it remains historically significant. Observing this trend alongside the latest trucking employment data reveals that current capacity levels are normalizing to meet demand by taking drivers and, in some cases, carriers off the road.
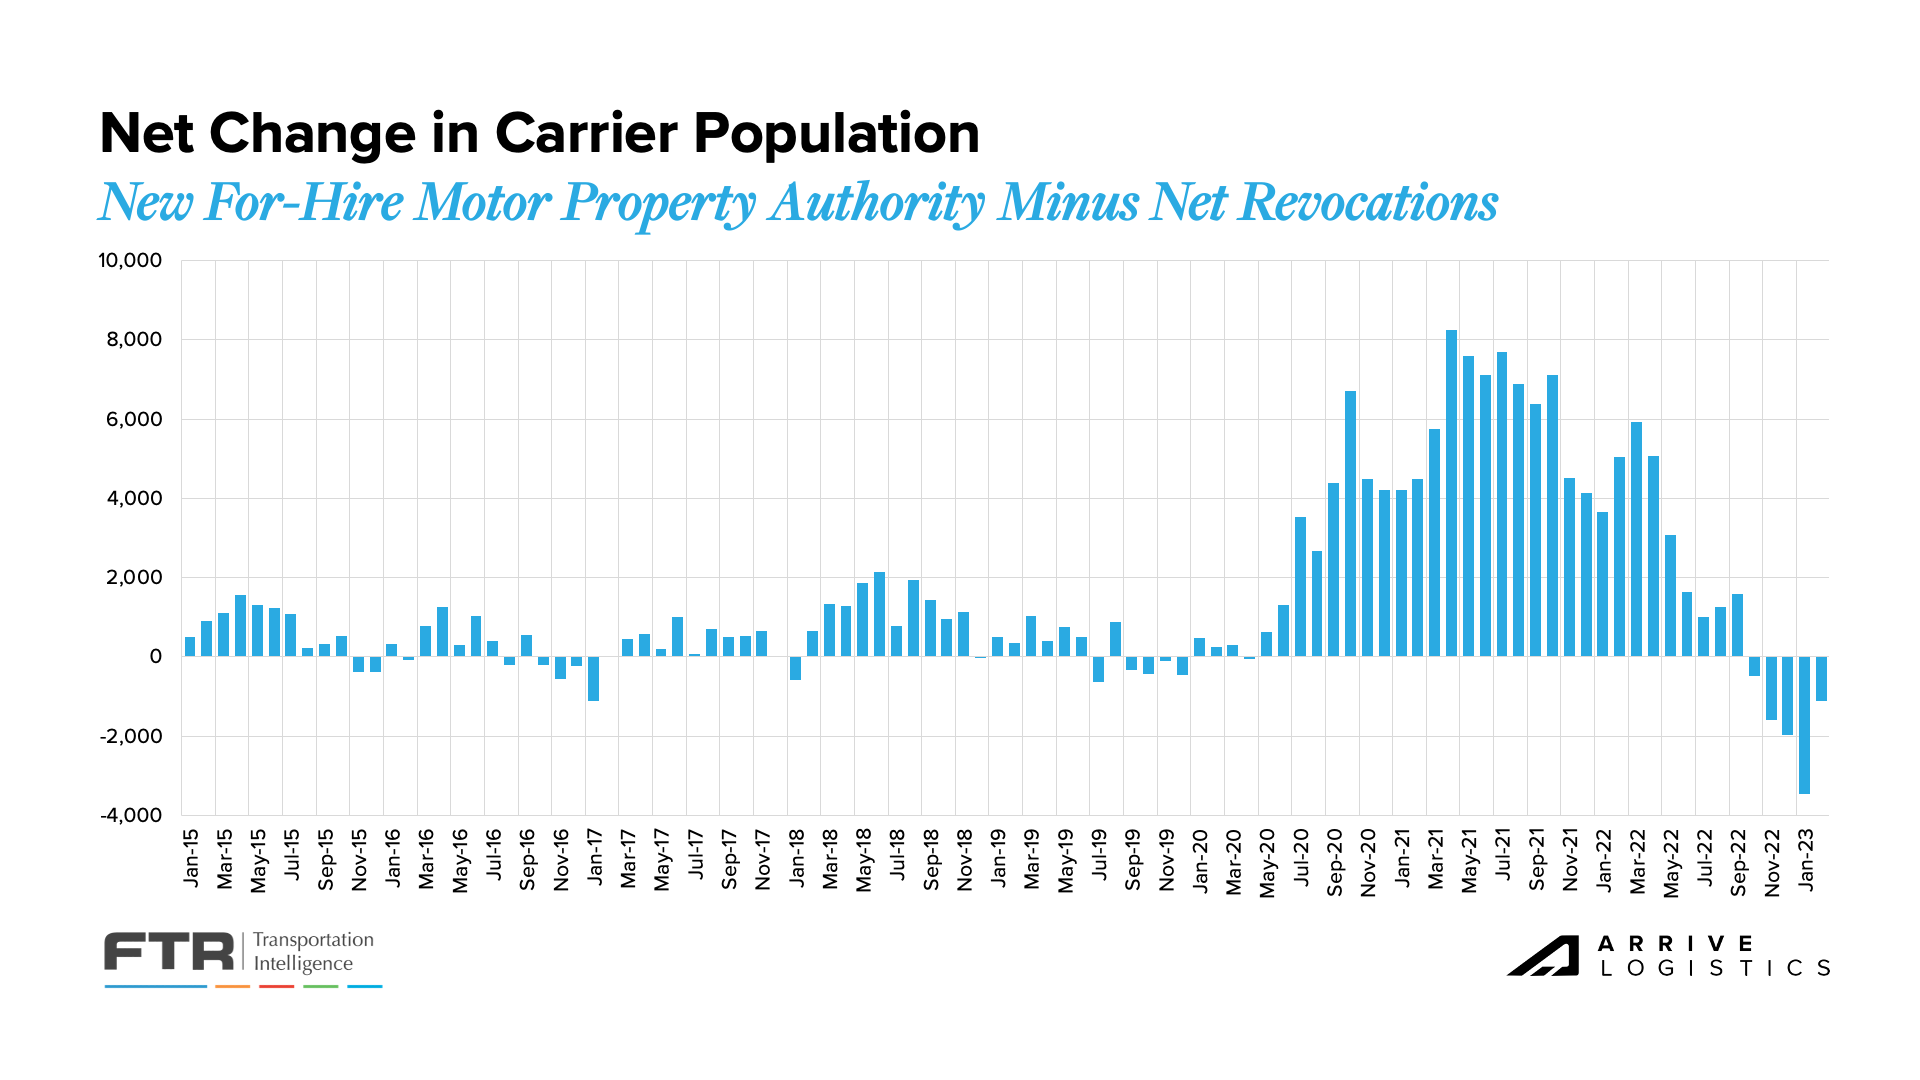 Figure 20: Net Change in Carrier Population: FTR Analysis of FMCSA Data
In February, FTR reported that new Class 8 truck orders rose for the first time in five months to 22,800, and orders stabilizing in the low 20,000 range is a good sign for the industry. Although new orders are likely below build levels, backlogs are expected to decline but remain high, and production slots are filled through Q3 of this year. In fact, the average time from order to delivery decreased from 9.6 to 8.26 months.
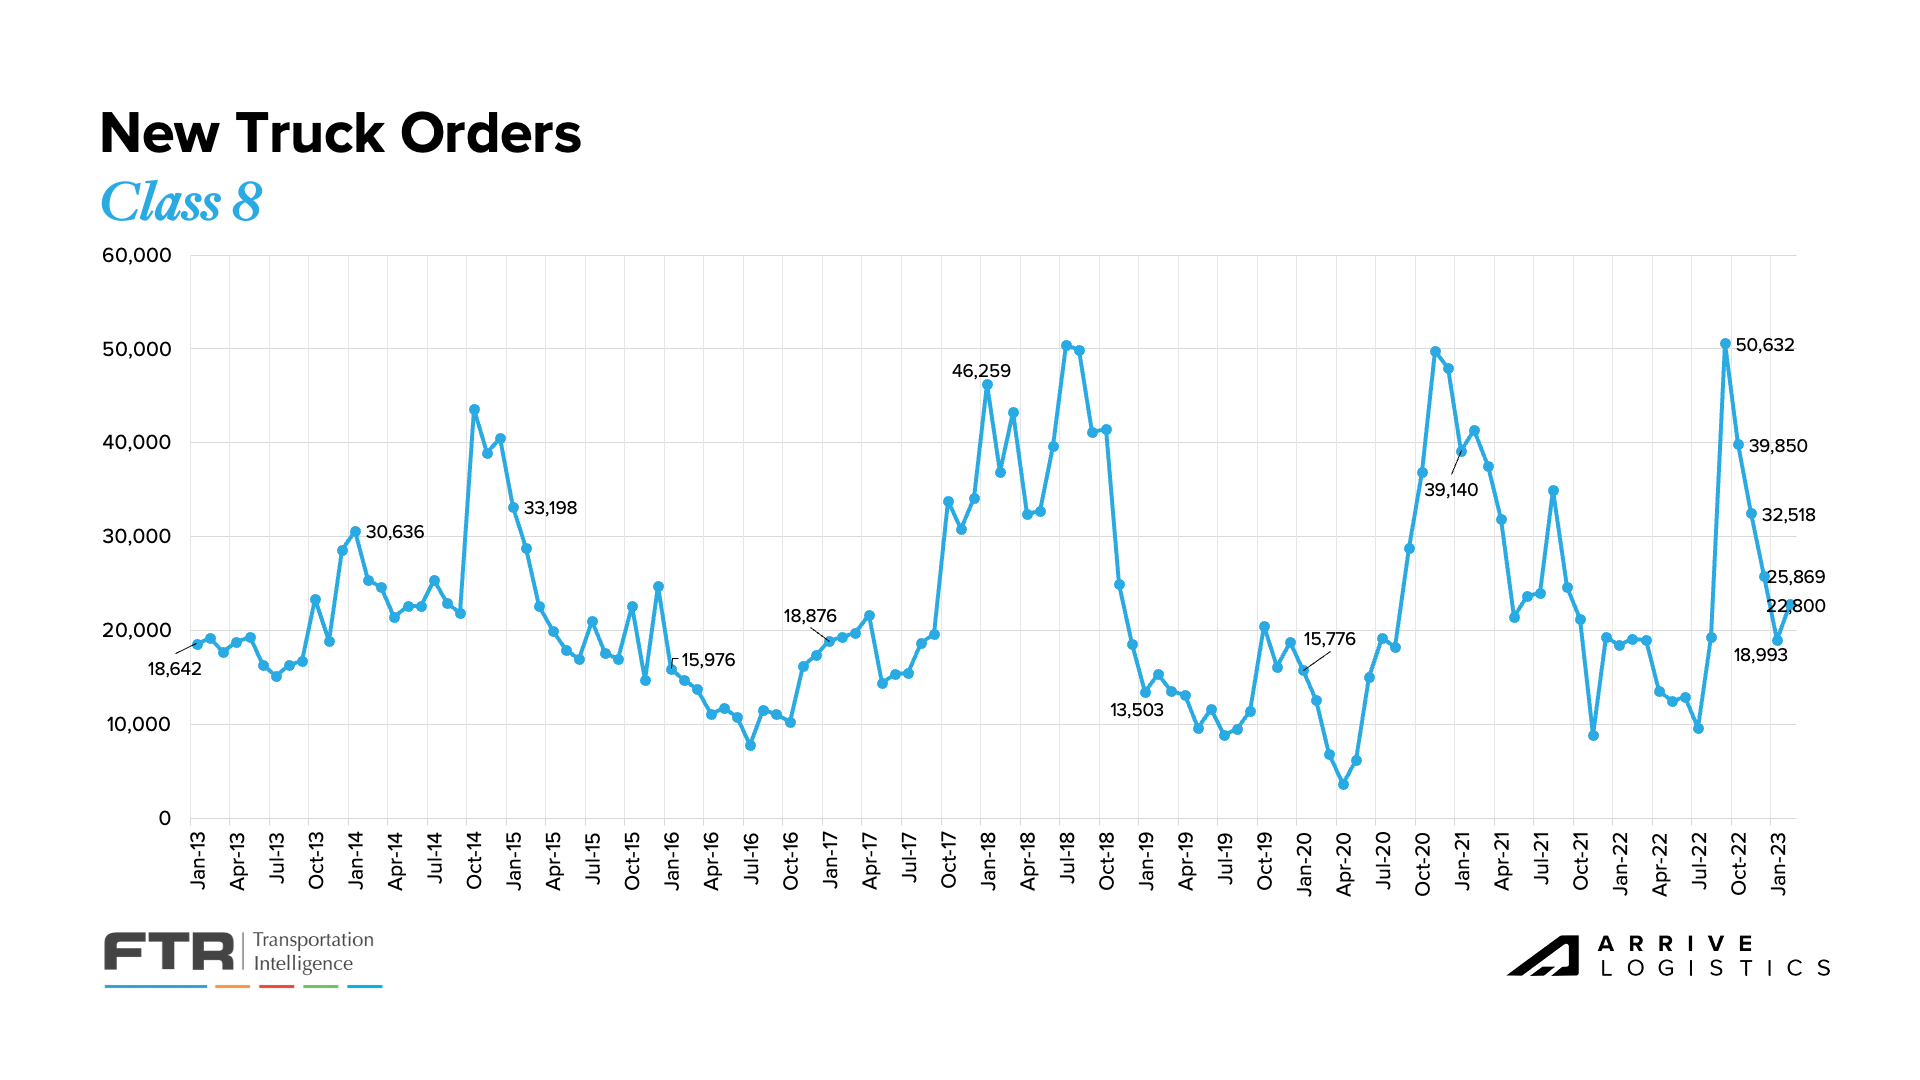 Figure 21: New Truck Orders: Source: FTR
Indicators for future freight demand are bleak for 2023 as volume forecasts continue to be revised downward. Two major concerns are the manufacturing and retail sectors. The manufacturing sector posted its fourth consecutive month of contraction, and imports, a significant contributor to overall truckload demand, are estimated to have fallen to their lowest levels since May 2020, when many factories and stores were closed due to pandemic-related lockdowns. Projections suggest import levels will remain low but begin to recover as retailers work through inventories built up due to over-ordering in prior years. According to the NRF, retailers are importing less merchandise as they work to keep inventories in line with consumer demand.
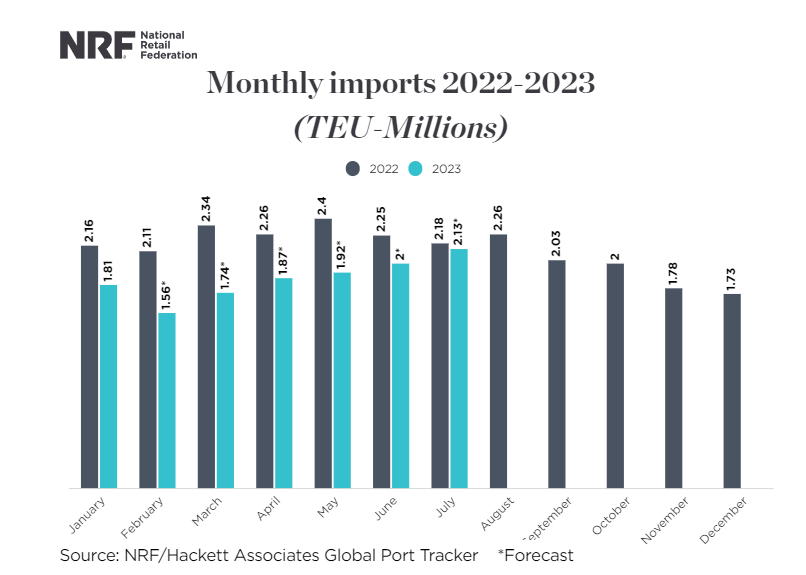 Figure 22: Monthly Retail Imports 2022-2023: Source: NRF
The ISM manufacturing report indicated continued easing backlogs as new orders contracted for the sixth consecutive month amid slowing production. Although the new orders index improved to 47% in manufacturing, further contraction raises more uncertainty about future backlogs and, therefore, truckload demand. Manufacturing was expected to be one of the main volume drivers in 2023, and if contraction persists, demand will likely fall further than previously forecasted. However, there is still significant pent-up demand in the sector that should enable healthy volumes in the near term.
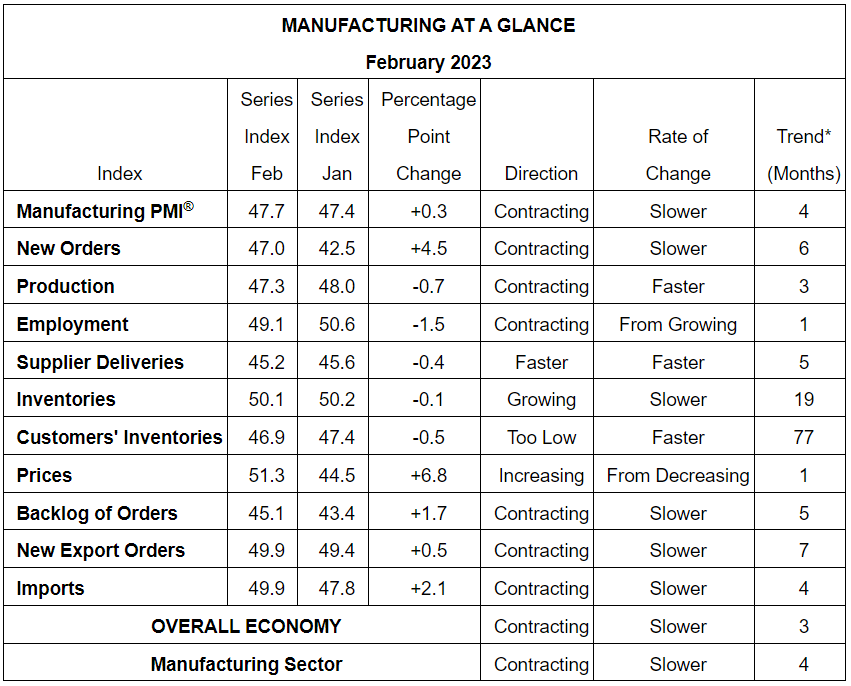 Figure 23: Manufacturing PMI Report on Business. Data is seasonally adjusted for the New Orders, Production, Employment and Inventories indexes.
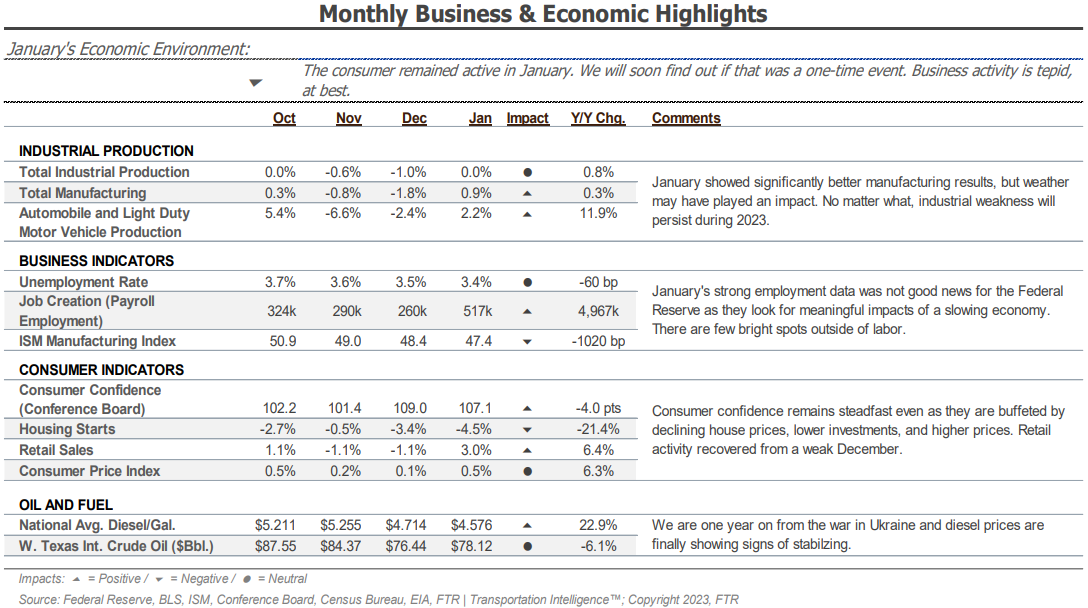 Figure 24: FTR Monthly Business & Economic Highlights
FTR’s latest truck loadings showed a 1.7% year-over-year increase for 2022, an estimated 2.0% decline after downward revisions to previously reported loading data. The 2023 forecast has been revised downward substantially, showing a 1.4% decline from the 0.2% decline reported in the last update. In the latest forecast, weaker outlooks for food and packaged goods and automotive cut the dry van loadings forecast to a 1.3% decline from a previously reported flat outlook for 2023.
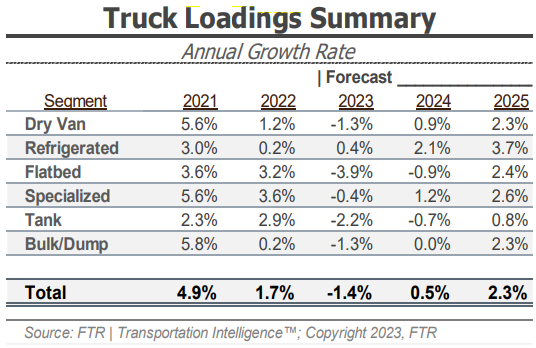 Figure 25: FTR Truck Loading Summary
Largely in line with expectations, early March CPI data showed inflation slowed in February, falling from 6.4% to 6.0% year-over-year growth (5.5% when excluding food and energy). Rising shelter costs continue to be a key driver of the inflation data, as they account for about a third of the CPI index. When excluding housing and looking at core services, prices are up 3.7% from a year ago. With the Fed targeting inflation of 2%, this means that the Fed is still likely to continue taking action with their next opportunity to raise rates. Speculators are indicating another rate hike of 25 basis points is the most likely scenario.
While this data continues to point to light at the end of the tunnel and some improvement in overall inflation, there are other signs of economic uncertainty to consider. The recent failure of Silicon Valley Bank, although potentially an isolated incident, has sent shockwaves throughout the financial world and left many uneasy about the times ahead. Events like this can have an impact on consumer behaviors and we will be watching closely in the weeks and months ahead to see what potential impact it may have on freight demand.
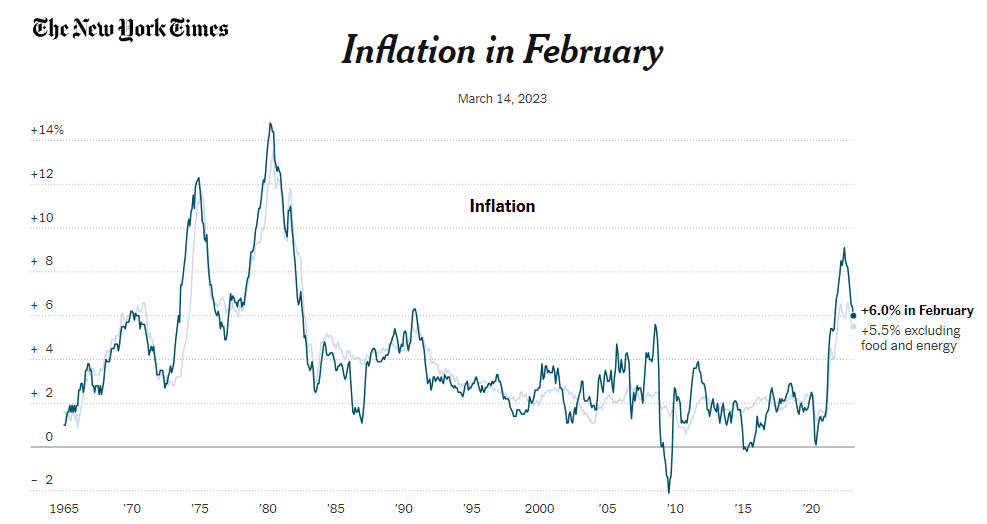 Figure 26: NYT’s Inflation in February
Bank of America’s card data revealed that consumer spending increased by 2.7% YoY in February, down from 5.1% YoY growth in January. This was expected, as a favorable seasonal adjustment and a few one-off factors boosted January’s growth. BofA observed that services spending experienced a significant increase, offsetting a decline in goods spending. This trend aligns with the strength seen in services spending relative to pre-pandemic levels.
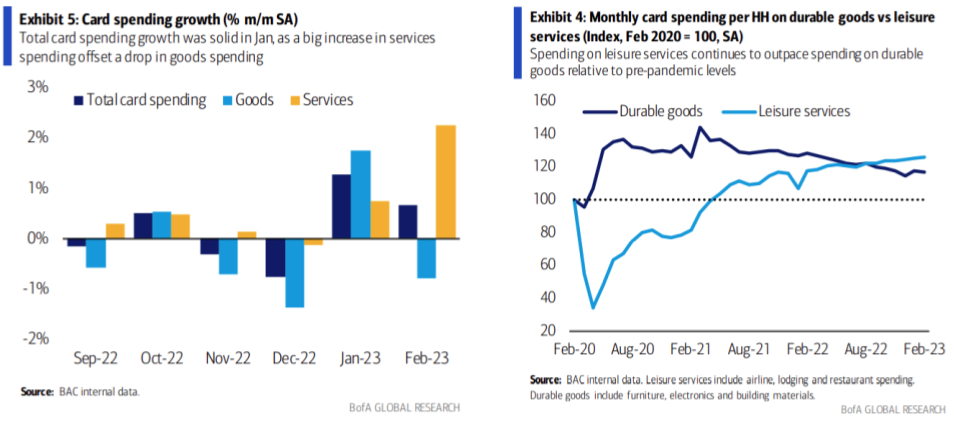 Figures 27 & 28: Card Spending Growth & Bank of America Monthly Card Spending (Durable Goods vs. Leisure Services)
When analyzing monthly spending trends by category, clothing and furniture saw weak spending, whereas airlines, gas, and restaurants showed strength.
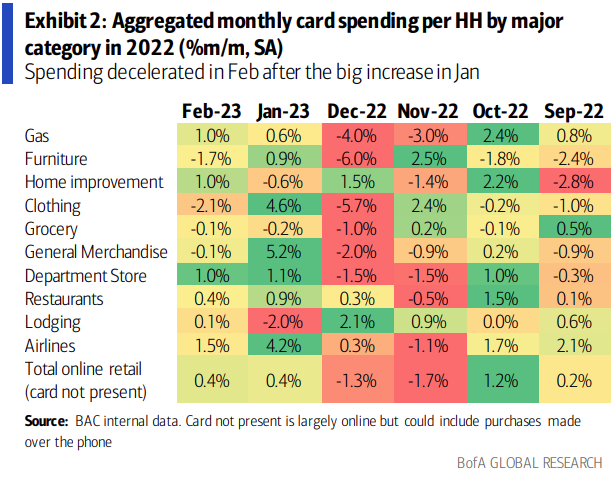 Figure 29: Bank of America Monthly Card Spending
Furthermore, BofA reported that the lowest-income bracket’s spending is still strong, surpassing that of higher-income households year-over-year. BofA theorizes that a tight labor market for blue-collar workers has offset inflation’s cost-of-living increase and that consumer spending will likely continue until the labor market cools off.
Although initial jobless claims increased slightly in early March, they remain close to last year and even pre-pandemic levels. The unemployment rate remains nearly flat compared to January 2020, a sign that the labor market is strong despite recent reports of layoffs. This robust labor market signals confidence in consumers’ ability to sustain current spending levels and avoid a sudden drop in truckload demand.
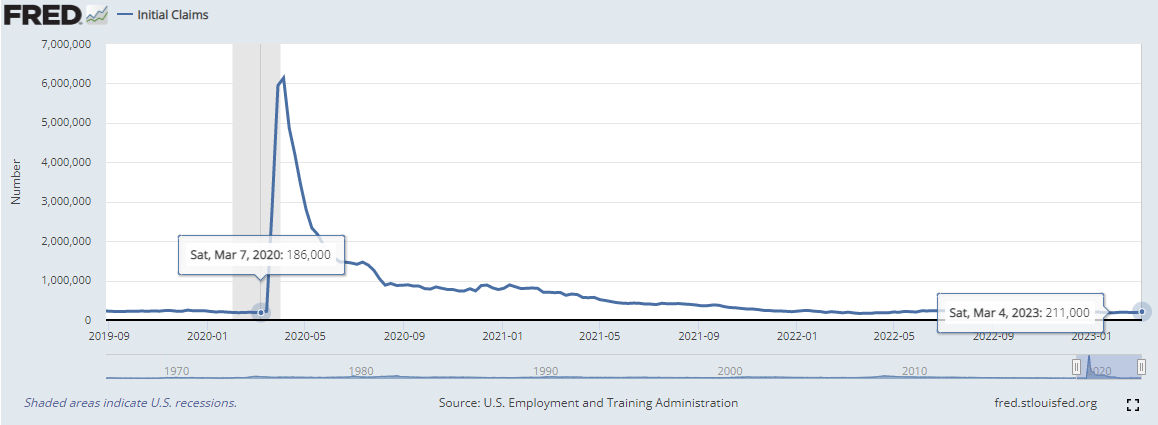 Figure 30: FRED Initial Jobless Claims
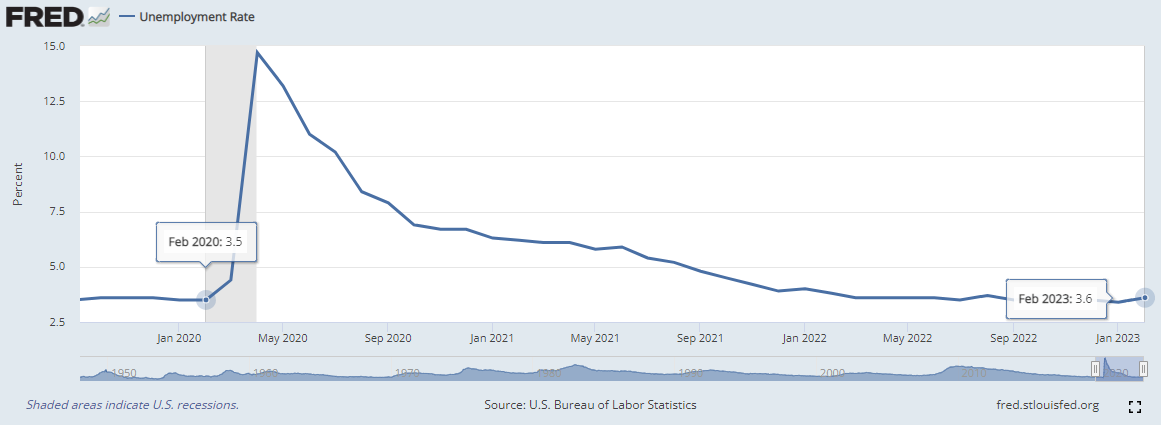 Figure 31: FRED Unemployment Rate


