"*" indicates required fields
"*" indicates required fields
"*" indicates required fields

January 2021
The Arrive Monthly Market Update, created by Arrive Insights, is a report that analyzes data from multiple sources including but not limited to FreightWaves SONAR, DAT, FTR Transportation Intelligence, Morgan Stanley Research, Bank of America Internal Data, Journal of Commerce, Stephens Research, National Retail Federation and FRED Economic Data from the past month as well as year-over-year.
We know that market data is vital to making real-time business decisions, and at Arrive Logistics, we are committed to giving you the data you need to better manage your freight.
Uncertainty remains at the forefront of what is to come in 2021. Our research indicates that the most likely scenario is a first half that plays out similar to 2018 where constrained capacity kept rates elevated. In the back half of the year, softer conditions will lead to decreasing rates as capacity begins to re-enter the market and consumer spending shifts away from durable goods. Our forecasts show spot rates return to flat year-over-year by late Q3 and down at least 10% by end of year. Contract rate correction will have a longer time horizon. We expect an annual average increase of 8-10% year-over-year in 2021. Below are a few high-level takeaways from the report:
Tender Volumes are representative of nationwide contract volumes and act as an indicator of Truckload Demand
Tender Rejectionsindicate the rate at which carriers reject loads they are contractually required to take and acts as an indicator of the balance between Truckload Supply and Demand
New Truck Orders is an indicator of the trucking industry’s health and carrier sentiment, as carriers typically invest in new trucks when demand and optimism are high.
Industrial Production measures the output of the industrial sector, including mining, manufacturing and utilities.
US Customs Maritime Import Shipments, China to the United States measures the total number of import shipments being cleared for entry to the U.S. from China.
Rate Spread measures the difference between the national average contract rate per mile and the national average spot rate per mile and is closely inversely correlated to movements in tender rejections and spot market volumes.
Weekly Jobless Claims are used as a barometer for the pace of layoffs in the general economy.
Unemployment Rate is the number of people who are unemployed that are actively seeking work.
"*" indicates required fields
The pull forward effect of e-commerce on holiday retail spending led to declining truckload demand month-over-month in December. Volumes remained elevated due to the ongoing restocking boom and normal season patterns, but fell from the highs in the week leading up to Thanksgiving. It is still too early to tell if the increase in e-commerce will lead to a large enough increase in retail returns to cause a spike in demand large enough to disrupt capacity, but we remain vigilant of that possibility in early January.
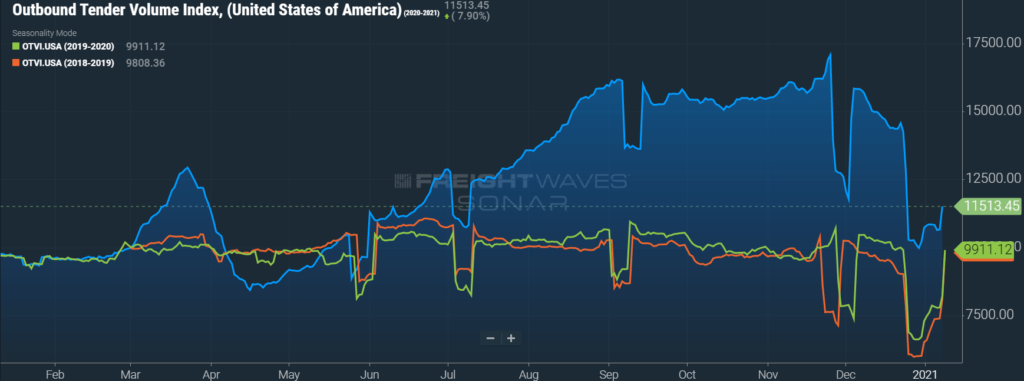
FreightWaves SONAR Outbound Tender Volume Index (OTVI), which measures contract freight volumes across all modes, has been on the decline since Thanksgiving. The index, which is expressed as a 7-day moving average, is still impacted by Christmas and New Years. That being said, historical trends indicate that we should expect tender volumes to return to levels at or near what was seen just prior to the dip on Christmas Eve. At that point, volumes were up 45% year-over-year, but down nearly 15% from the peak before Thanksgiving. It is important to note that OTVI includes both accepted and rejected load tenders, so we must discount the index by the corresponding Outbound Tender Rejection Index (OTRI) to uncover the true measure of accepted tender volumes. If we were to apply this method to the year-over-year OTVI values in late December, the increase in volume drops to roughly 20.9%. The Dry Van and Reefer Tender Volume Indices are up more than 48% and 62% year-over-year, which equated to 24.1% and 14.6% increases in actual volumes for the two modes, respectively.
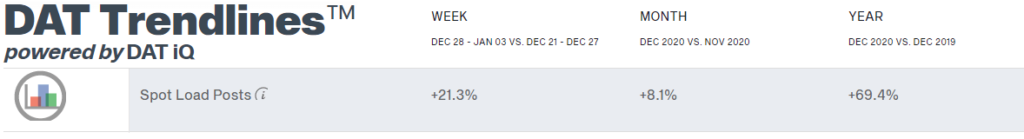
DAT reported that dry van spot load posts rose quickly in December, increasing by 8.1% month-over-month and 69.4% year-over-year. This is the first monthly increase since September after back-to-back declines in October in November.
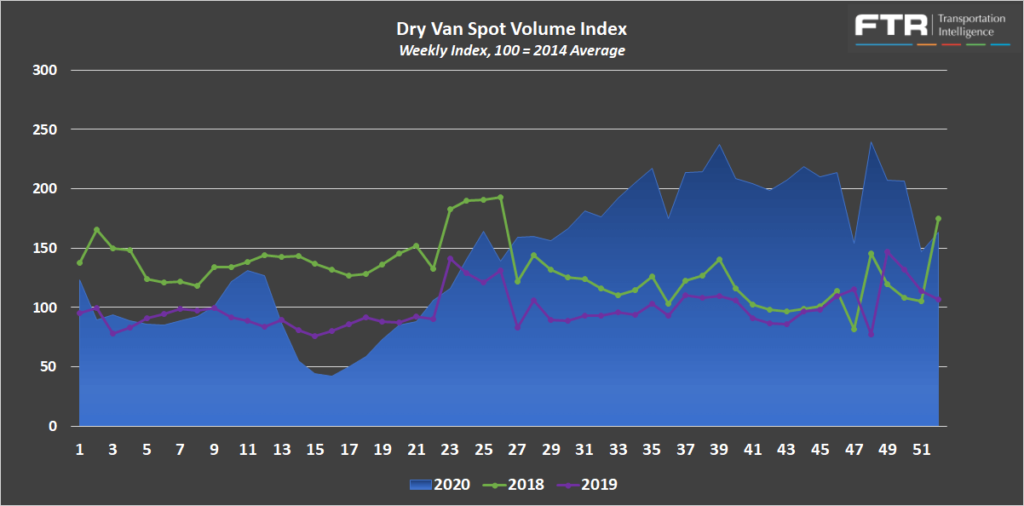
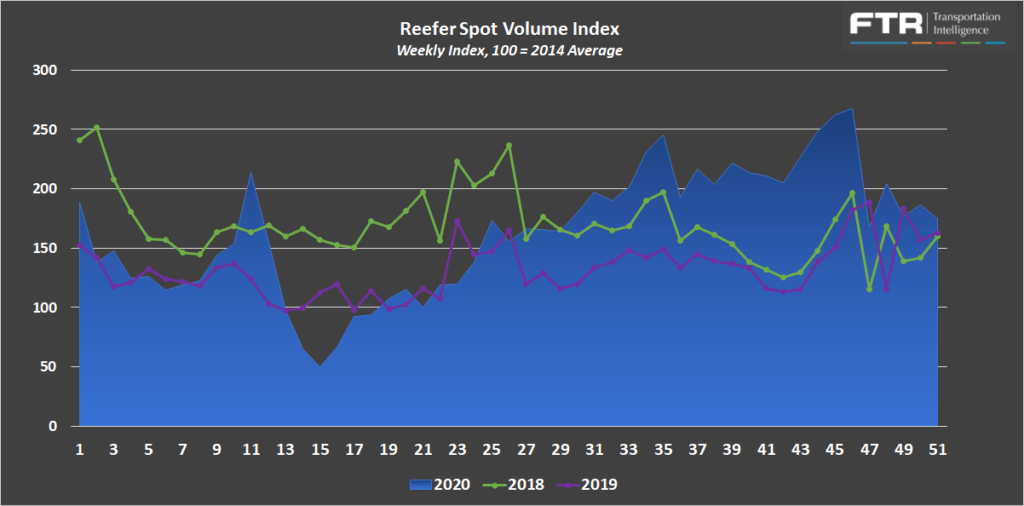
FTR and Truckstop’s Total All Mode Spot Volume Index peaked in week 48 in early December. At this point, it was up by about 3% from the high point in November and up by 70% year-over-year. These demand trends were driven by a 9.5% month-over-month increase and 63% year-over-year increase for the Dry Van Spot Volume Index. The Reefer Spot Volume Index decreased by -23.5% month-over-month from the peak in November, but increased 11% year-over-year.
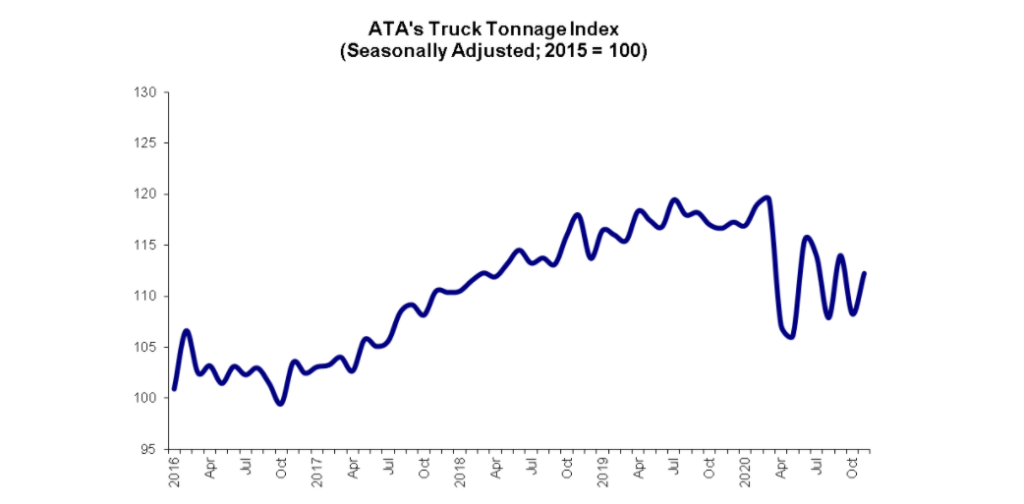
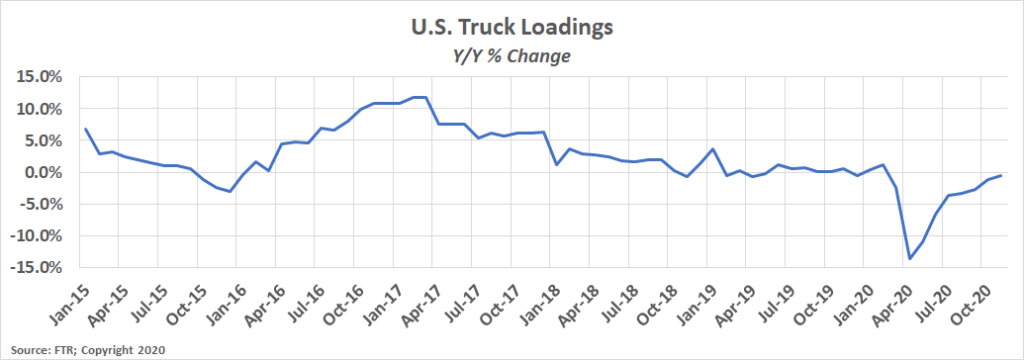
The remaining indices, ATA’s Truck Tonnage Index and FTR’s Truck Loadings Index, continue to indicate that the total trucking market is down on a year-over-year basis.
The Seasonally Adjusted ATA Truck Tonnage Index increased 3.7% month-over-month in November and was the seventh straight year-over-year decline, falling to -3.8% year-over-year.
FTR’s Truck Loadings Index was down by just -0.5% year-over-year in November after rising by 0.6% month-over-month. In 2019, the Truck Loadings Index fell by -0.1% month-over-month in the same time period before increasing by 1.1% in December.
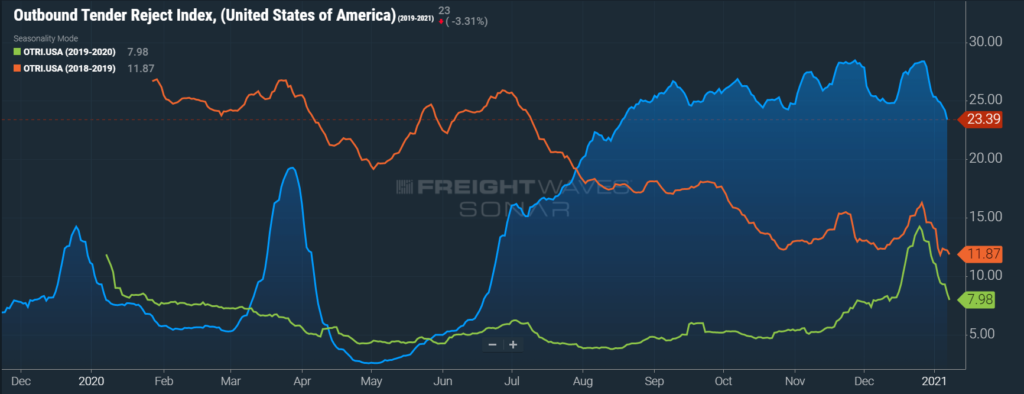
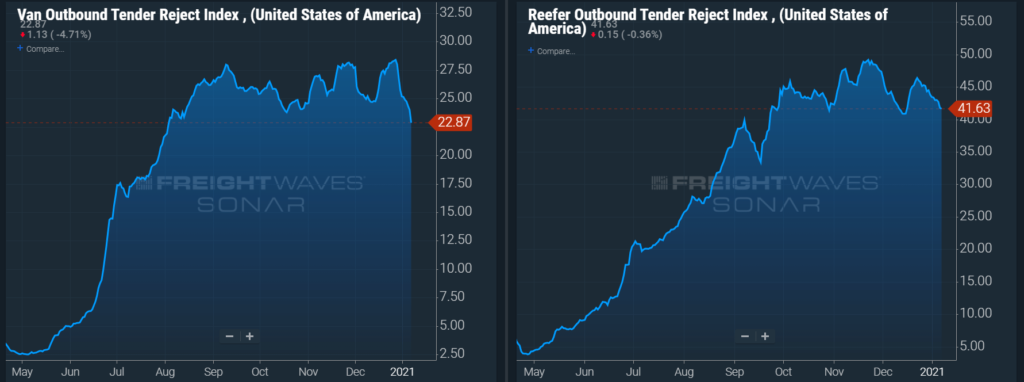
Sonar Outbound Tender Reject Index (OTRI) measures the rate at which carriers are rejecting the freight that they are contractually required to take. Tender rejections peaked near Christmas, just slightly below the all time record high of 28.46% set in November. Following typical seasonal trends, Tender Rejections rates began to fall quickly and are currently down to 23.39% in early January. The peak seen in December represented an increase of 100% when compared to the peak seen in the same month in 2019. The Dry Van Tender Reject Index peaked in December at 28.4%, a new record high coming in slightly above the high of 28.2% seen in November. Dry van tender rejections have fallen rapidly since and currently sit at 22.87%. The month-high Reefer Tender Rejection Index of 46.38% in late December was up 90% year-over-year from the peak seen in December 2019. Reefer tender rejections have fallen only slightly to 41.63% in early January, nowhere near as rapidly as dry van rejections.
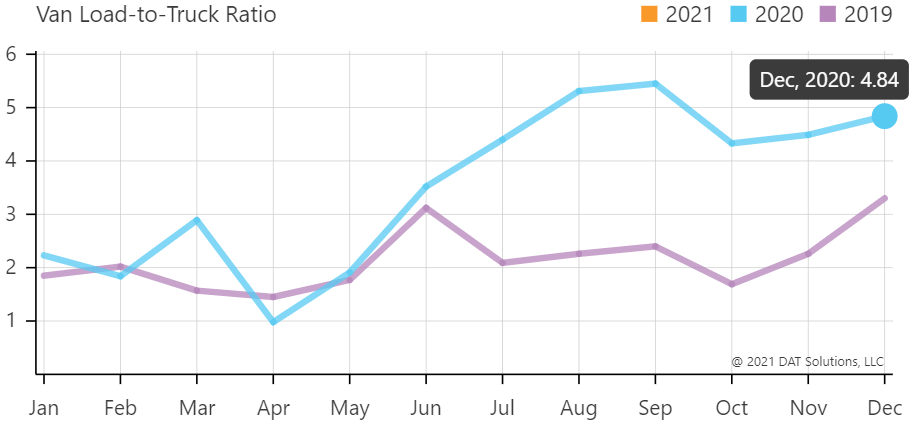
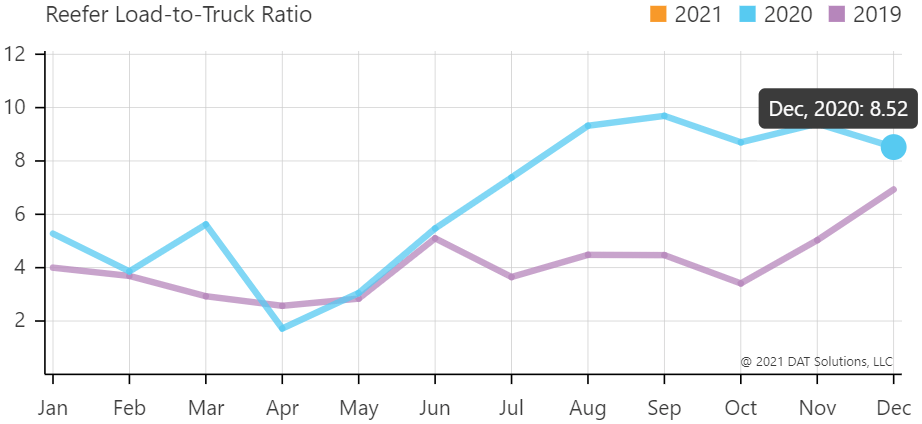
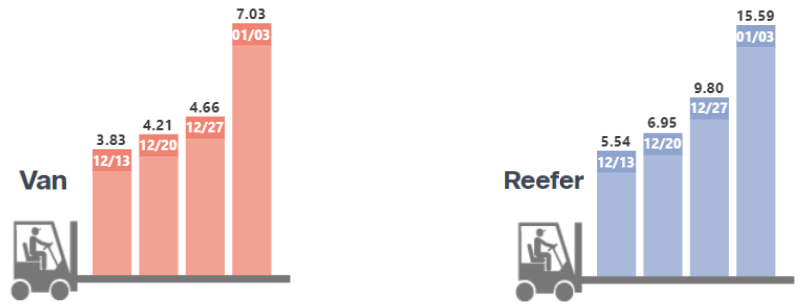
The DAT Load to Truck Ratio measures the total number of loads posted compared to the total number of trucks posted on their loadboard. In December, the Dry Van Load to Truck Ratio increased slightly to 4.84, an increase of 7.8% month-over-month and 46.7% year-over-year. The Reefer Load to Truck Ratio fell to 8.52 in November, a decrease of 9.4% month-over-month, and an increase of 22.9% year-over-year. The dry van load to truck ratio increasing in December is in line with expectation for this time of year, but the decrease in the reefer load to truck ratio in December is abnormal. This is likely due to fewer people gathering for the holidays than in a year not affected by the pandemic where there is less demand for transporting food.
We expect both ratios to fall in January as demand softens following the holiday season.
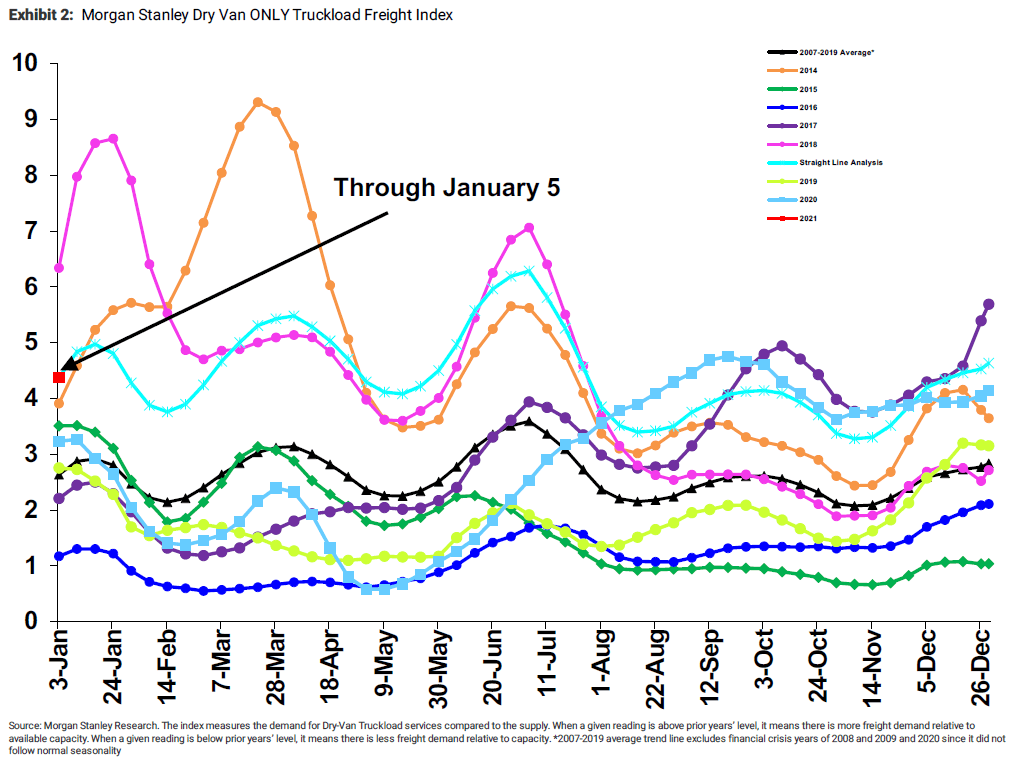
The Morgan Stanley Dry Van Freight Index is another measure of relative supply. The higher the index, the tighter the market conditions. The index is indicating that the conditions are tighter at the start of the year than any year outside of 2018. Their forecast indicates that Q2 and Q3 will play out similar to 2018, before finishing the year off similar to 2020. This forecast is bullish and seems to indicate relatively flat growth between now and the end of the year.
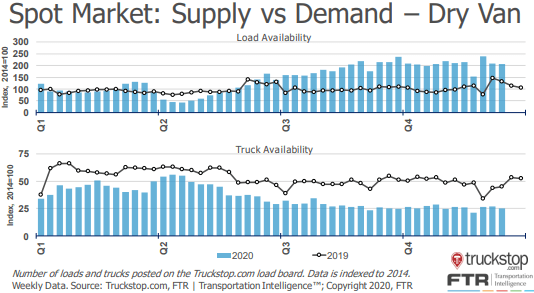
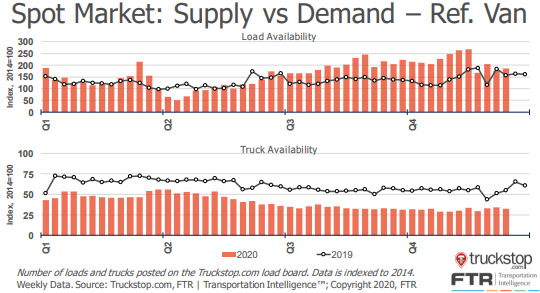
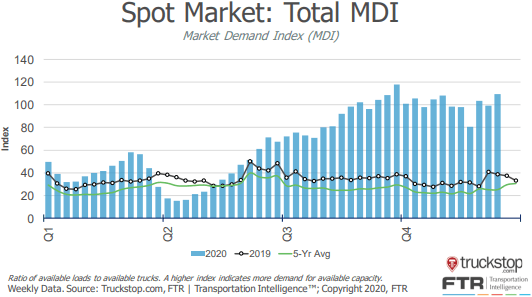
The Truckstop/FTR Market Demand Index measures the ratio of available loads to available trucks. In the first two sets of charts below, load and truck availability are plotted separately for both dry van and reefer freight. Load availability remained elevated for dry van, but flat for reefer, while truck availability declined for both equipment types year-over-year. This imbalance is indicative of tighter market conditions as demand has remained elevated above supply. The result of these trends is a flat but elevated Market Demand Index which has been trending at or near record highs since early in the third quarter.
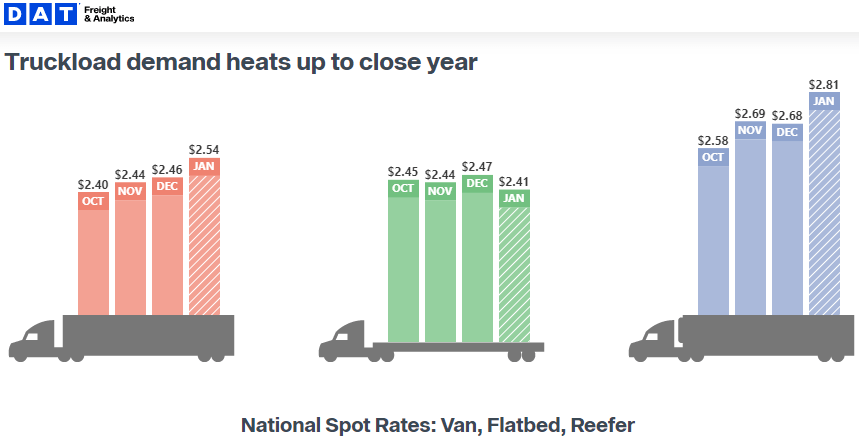
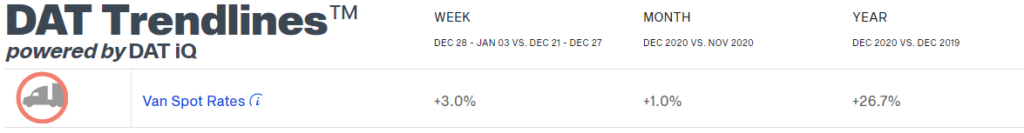
Van and reefer spot rates continued their climb in December as tender rejections remained near all-time highs. Flatbed rates fell slightly from a high in November. The DAT is reporting that dry van spot rates have now increased by 59.8% from $1.59 per mile in May to $2.54 in the first week in January. Contract rates have increased by 21.8% from $1.97 to $2.40 over the same time period.
The dry van linehaul rate per mile of $2.46 for the month of December was an increase of 36.7% year-over-year and was the fifth straight month where rates hit a new record high. This is indicative of the strength of the carriers’ negotiating power as we closed out the month of December.
The Contract-Spot Van Rate Spread experienced a $0.52 swing during an eight month span, from $0.40 in April to -$0.12 in December.
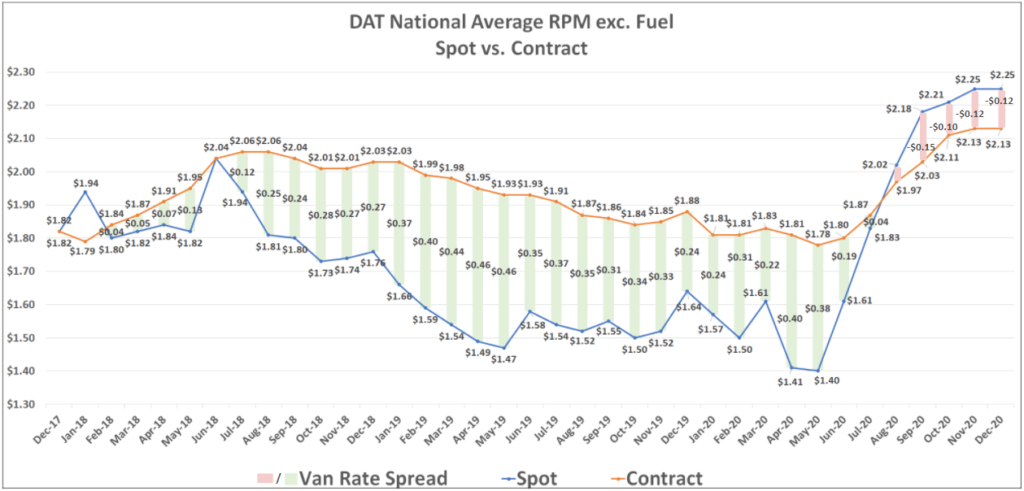
The negative gap between spot and contract rates indicates that we are still in an inflationary cycle in the market. The slowing growth rate, however, means that we may be nearing a peak for spot rates. Tender rejections have fallen rapidly and are now at the lowest levels since mid-August. It is too early to tell for certain, but with contract rates at all-time highs, carriers may be starting to jump at the opportunity to lock in contract pricing well above pre-pandemic rates.
The duration of the inflationary market conditions will depend largely on how quickly capacity can return to the market. Throughout the fourth quarter, driver supply has fallen to -2%, while truck loadings have trended back to flat year-over-year.
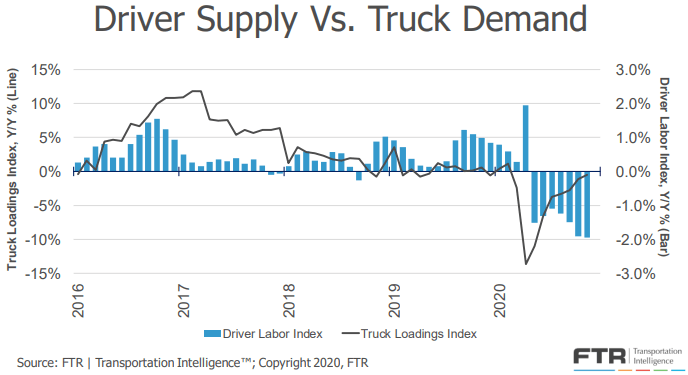
The growing disparity between driver supply and truckload demand has resulted in increasing pressure on driver availability. When this is the case, we expect upward pressure on truckload rates, just as we did throughout the back half of the year. The chart below shows a forecast for truck driver pressure peaking in Q4-2020 before slowly fading throughout 2021. This supports the outlook that we could currently be seeing the peak of inflated spot rates, and indicates that even though pressure on driver availability will decline, difficulties with driver availability should maintain some upward pressure on rates.
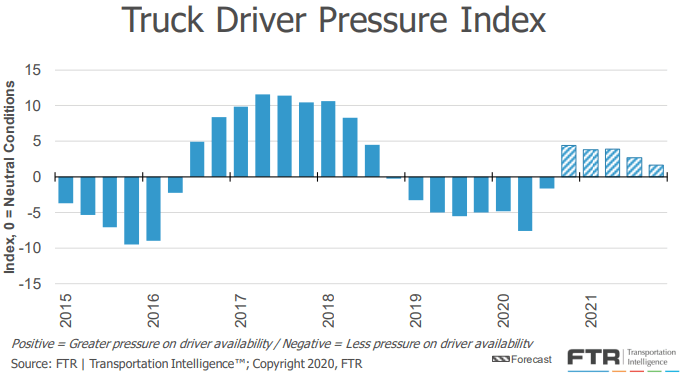
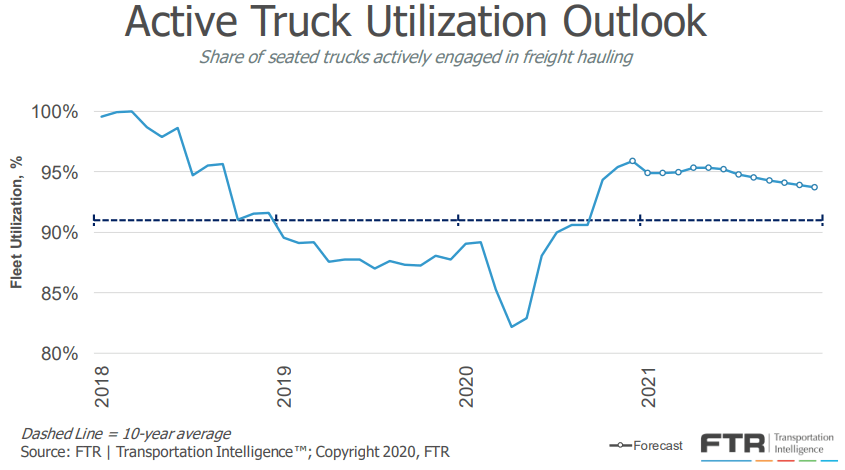
Active truck utilization, the share of seated trucks actively engaged in freight hauling, is now forecast to remain near 95% throughout the front half of 2021 before easing late in the year.
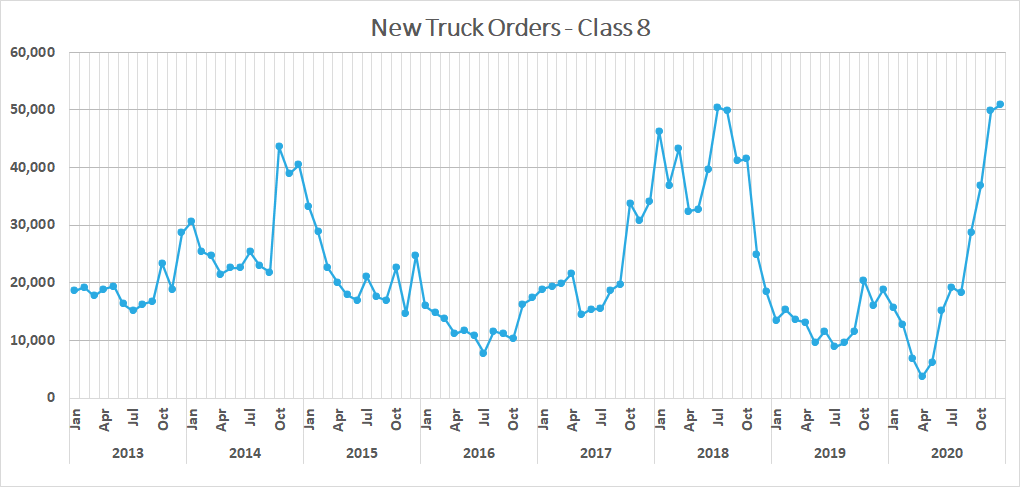
FTR is reporting that new truck orders increased again in December to more than 50,000 units. This is the highest single month total on record and well above the 20,000 units required to sustain current levels of capacity. Carriers are preparing to capitalize on a continued demand surge in 2021. Driver availability will continue to be the biggest hurdle to overcome, but if carriers continue to add capacity at this rate while maintaining utilization, we could see load to truck ratios ease significantly.
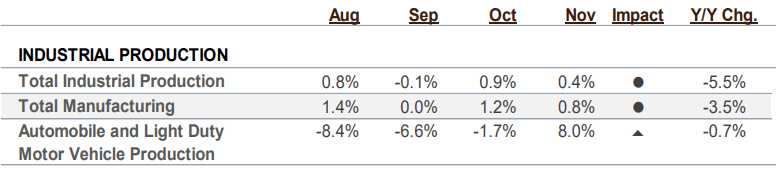
Industrial production is an important metric to watch due to its relationship to domestic shipment volumes. Industrial production data is now up to date through the end of November and shows a slight uptick of just 0.4% month-over-month, but remains down by -5.5% year-over-year in the month.
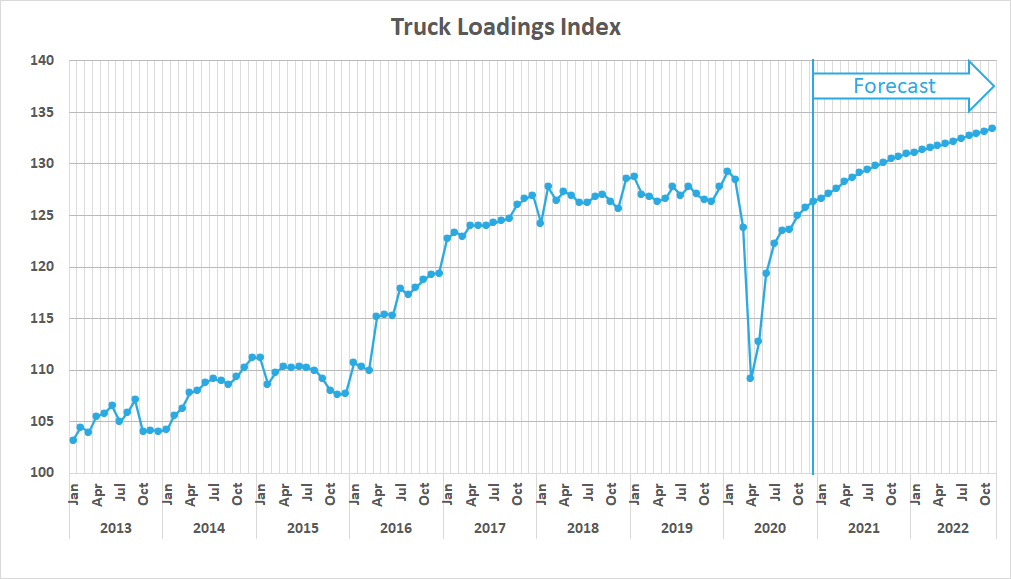
FTR’s Truck Loadings Index, which has a heavy concentration of industrial freight volumes, has declined by -3.7% year-over-year, on par with the -6.9% decline in industrial production forecasted for the full year 2020. Looking forward, FTR has only slightly increased their estimates for 2021. They are forecasting a 5.4% year-over-year increase in 2021, up just slightly from 5.2% last month. More specifically, they expect freight volumes to experience year-over-year inflationary levels by March and back to pre-pandemic levels by the third quarter.
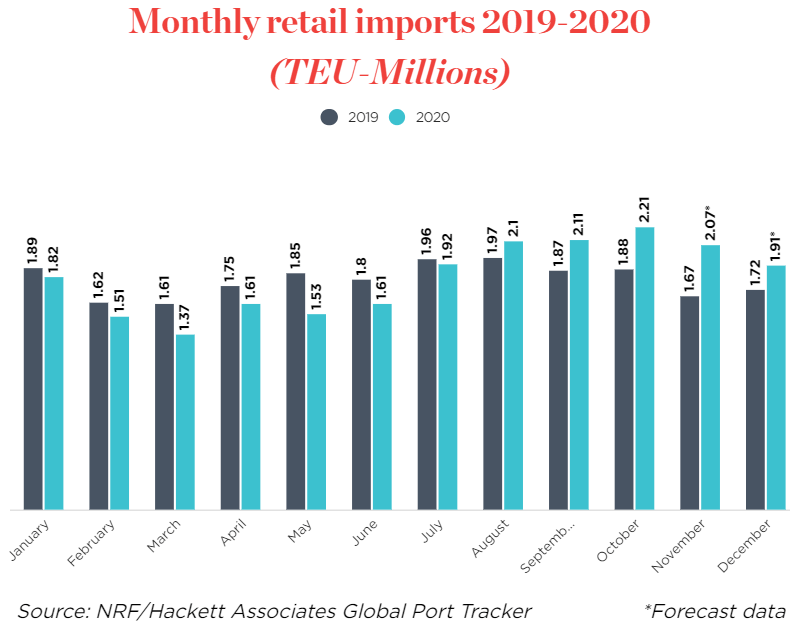
An inventory restocking boom is well underway, translating to record levels of retail imports. Retail import shipments set a new record for the second straight month in October, coming in at 2.21 million TEU’s. November and December totals have yet to be reported, but above average import shipments are expected to continue through at least the Chinese New Year in February to support restocking depleted inventories.
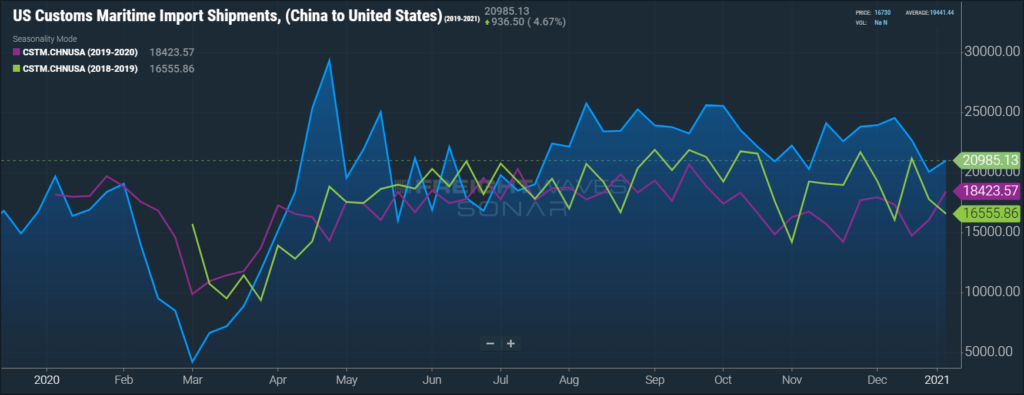
We can look to US Customs Maritime Import Shipments from China to the U.S. to help approximate ongoing retail import trends. Although it appears that imports from East Asia have moderated from levels seen in late Q3, total imports have remained elevated above prior years.
The Bank of America (BofA) consumer spending data provides visibility into changing consumer behaviors as a result of the pandemic.
When looking at aggregated daily card spending by major category, total card spending was up 2.2% year-over-year for the week ending January 2nd. BofA noted that the daily data was particularly volatile during the holiday season and suggested caution when interpreting the data.
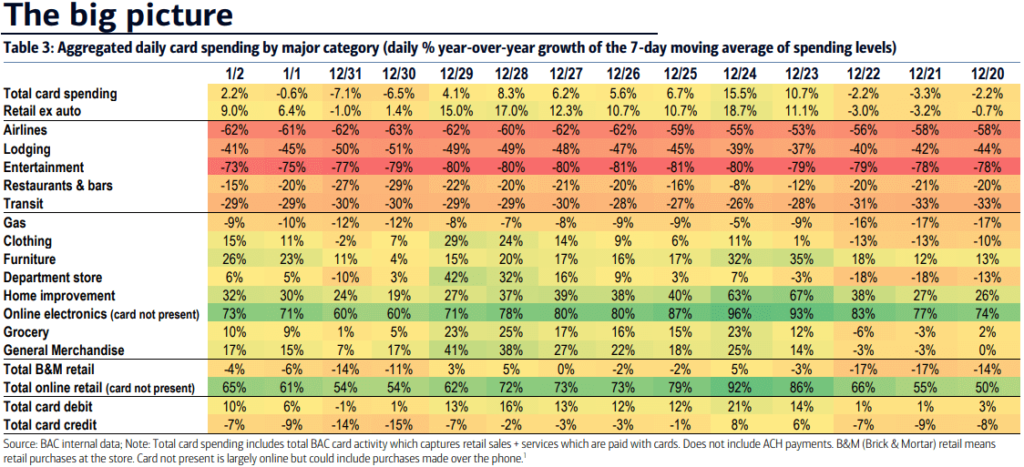
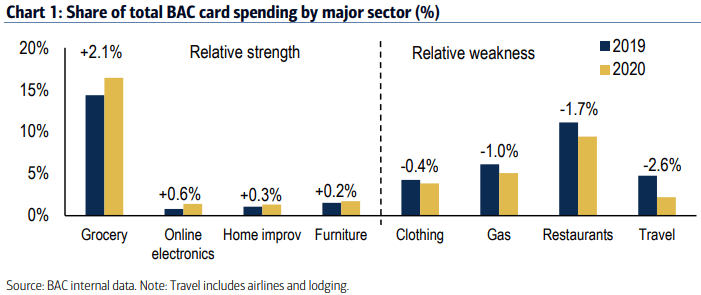
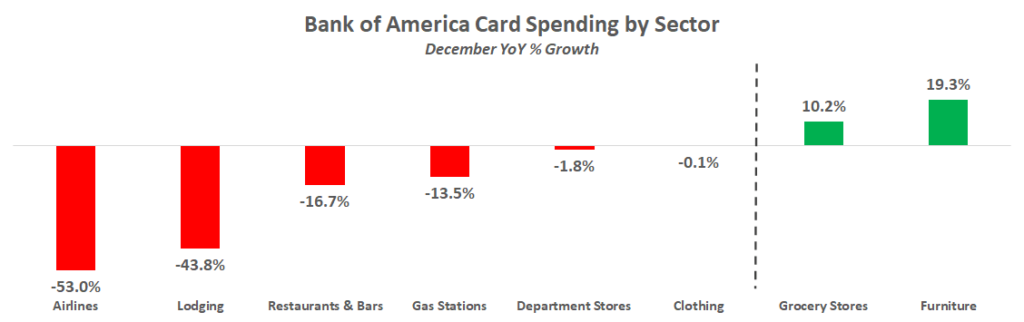
Now that 2020 is complete, we can get a complete look at the shift in the consumer basket. An increase in grocery spending offset spending at restaurants. Travel spending suffered, while durable goods, particularly relating to electronics, furniture and home improvement remained steady with notable increases.
The trend illustrating increased spending on durable goods was seen at the monthly level in December as well. Although airline spending was up 14.7% month-over-month due to holiday travel, it remained down by -53% year-over-year. Furniture spending was down by -5% month-over-month, but year-over-year growth remained strong, experiencing 19.3% growth.
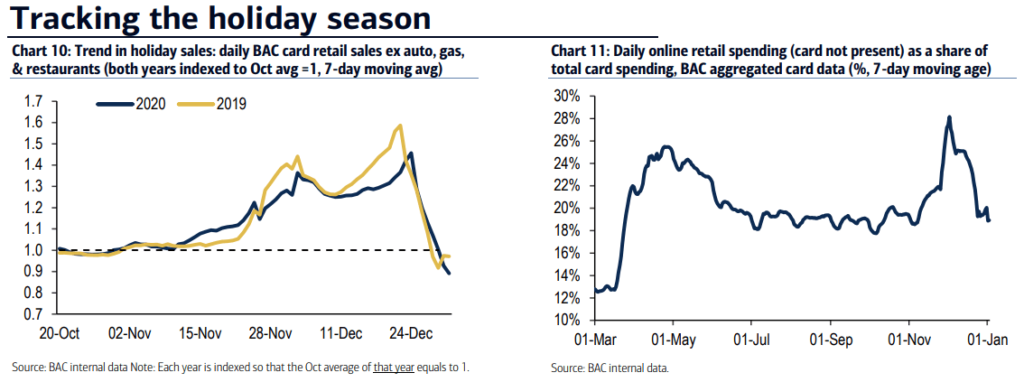
Holiday spending followed a slightly different path this year than most. Chart 10 below illustrates how holiday spending got off to a great start, outpacing 2019 until Black Friday, where retail sales ended a bit weaker. Chart 11 provides further evidence, showing the decline in online retail spending as a percentage of total card spending, falling from 28% in early December to just 19% late in the month.
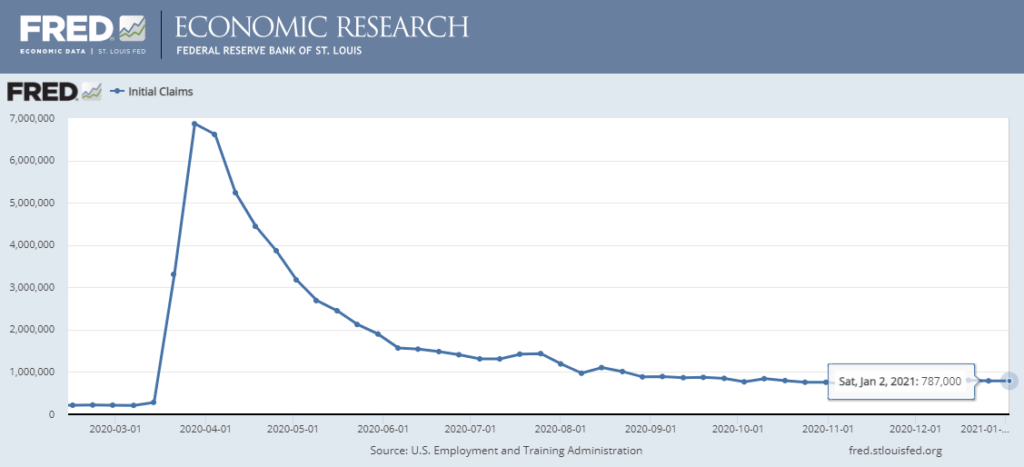
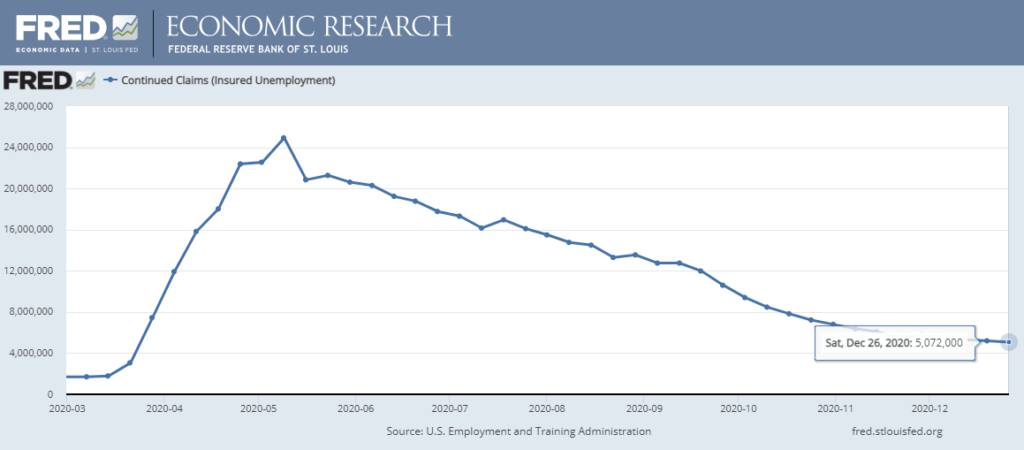
The unemployment trends continue to be concerning. Initial claims and continued claims are no longer improving week-over-week. Both metrics have continued on their level trend over the past few months. Initial claims in the most recent week came in at 787,000, and continued claims are still greater than 5 million on a weekly basis.
Carrier pricing power was on full display in March as contract rates climbed at an unprecedented rate throughout the month. The winter storms in mid February exposed just how insufficient supply is to support truckload demand, and carriers have responded by demanding a premium on their committed capacity.
Unfortunately for shippers, there does not appear to be much relief in sight. Our research indicates that there will continue to be greater upside risk to demand as we move into the second quarter. Spring produce season is just getting underway, the backlog at the port of Los Angeles and Long Beach should support healthy demand outbound from port cities on the East, Gulf and West Coast ports through at least the third quarter, and the third round of government stimulus is generating increased economic activity and consumer spending that will result in an additional boost to truckload demand.
On the supply side, there is no indication that carriers will be able to add capacity quickly enough to support the surge in demand in the near term. Both driver availability and delays in new truck delivery timelines remain the biggest challenges to carriers’ ability to do so. Driver availability should improve as the vaccine rollout enables driver schools to increase throughput, but the delays in new truck production will limit the rate that capacity is added.
As a result, our forecast for the remainder of the year remains consistent. Rates will likely remain at or near all-time highs through at least the second quarter, with the possibility of easing market conditions in the back half of the year as drivers and new equipment begin to enter the market.