"*" indicates required fields
"*" indicates required fields
"*" indicates required fields

July 2021
The Arrive Monthly Market Update, created by Arrive Insights, is a report that analyzes data from multiple sources, including but not limited to FreightWaves SONAR, DAT, FTR Transportation Intelligence, Morgan Stanley Research, Bank of America Internal Data, Journal of Commerce, Stephens Research, National Retail Federation and FRED Economic Data from the past month as well as year-over-year.
We know that market data is vital to making real-time business decisions, and at Arrive Logistics, we are committed to giving you the data you need to better manage your freight.
(Click to scroll to section.)
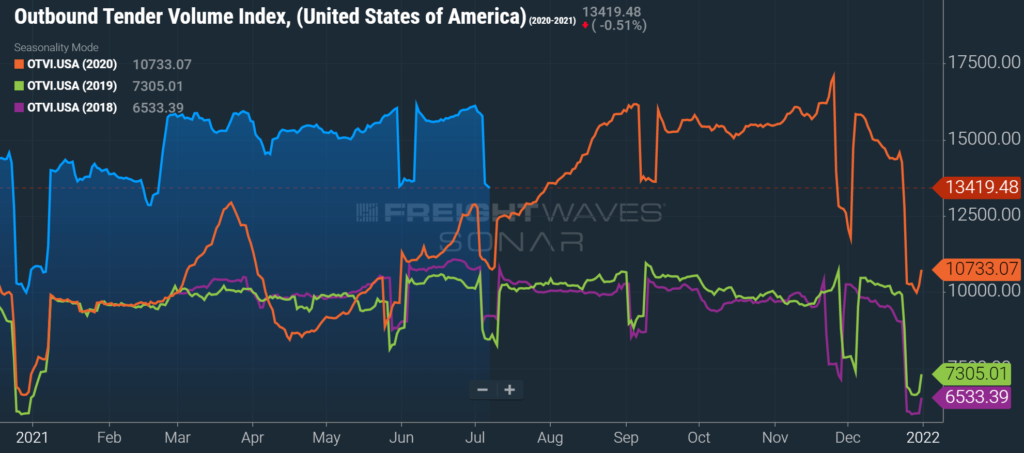
Tender Volumes are representative of nationwide contract volumes and act as an indicator of Truckload Demand
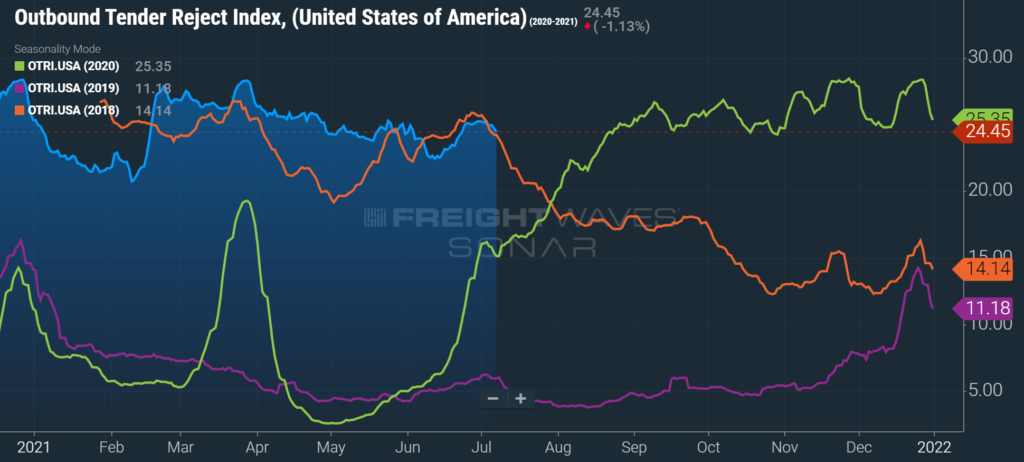
Tender Rejectionsindicate the rate at which carriers reject loads they are contractually required to take and acts as an indicator of the balance between Truckload Supply and Demand
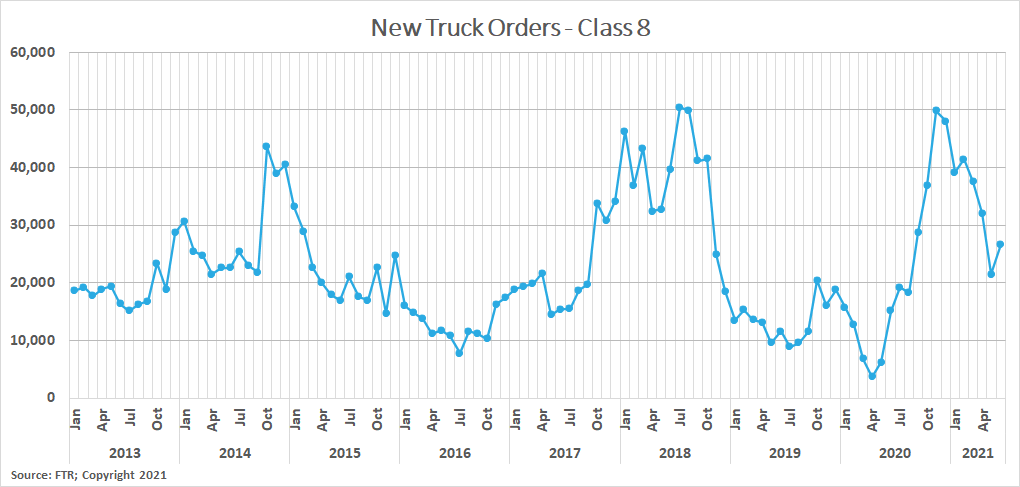
New Truck Orders is an indicator of the trucking industry’s health and carrier sentiment, as carriers typically invest in new trucks when demand and optimism are high.
Industrial Production measures the output of the industrial sector, including mining, manufacturing and utilities.
US Customs Maritime Import Shipments, China to the United States measures the total number of import shipments being cleared for entry to the U.S. from China.
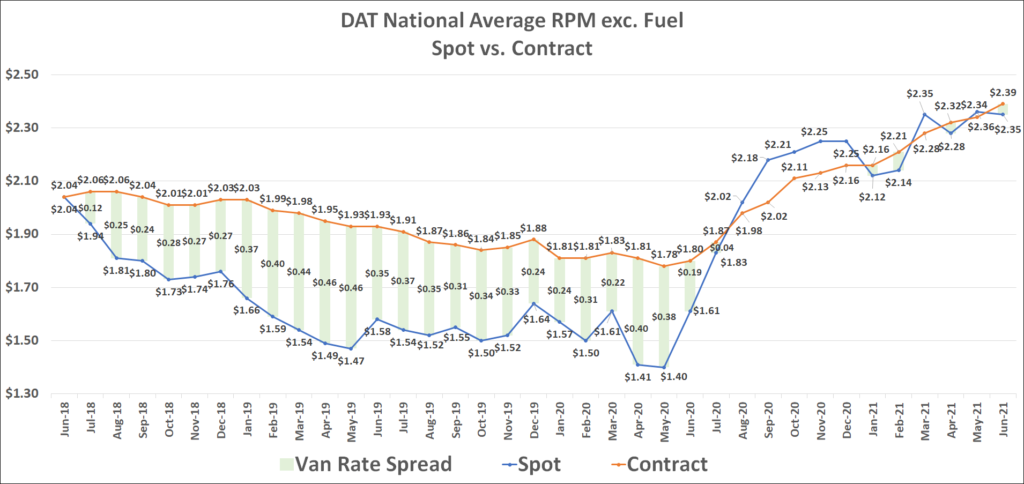
Rate Spread measures the difference between the national average contract rate per mile and the national average spot rate per mile and is closely inversely correlated to movements in tender rejections and spot market volumes.
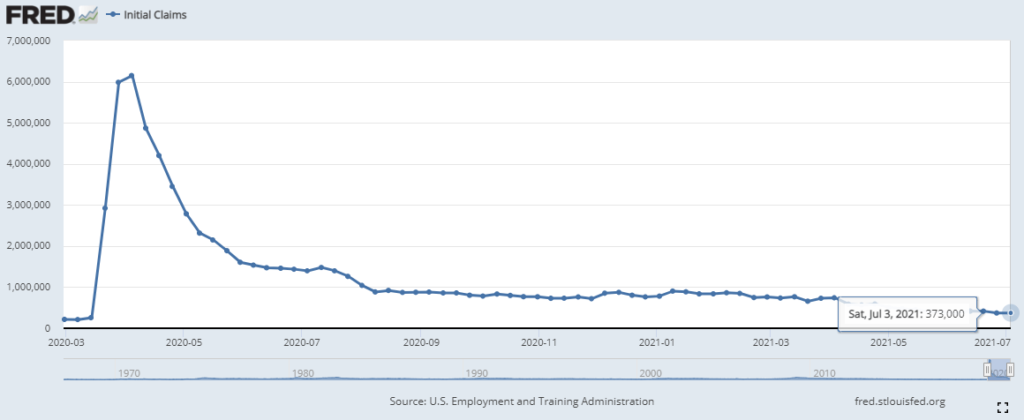
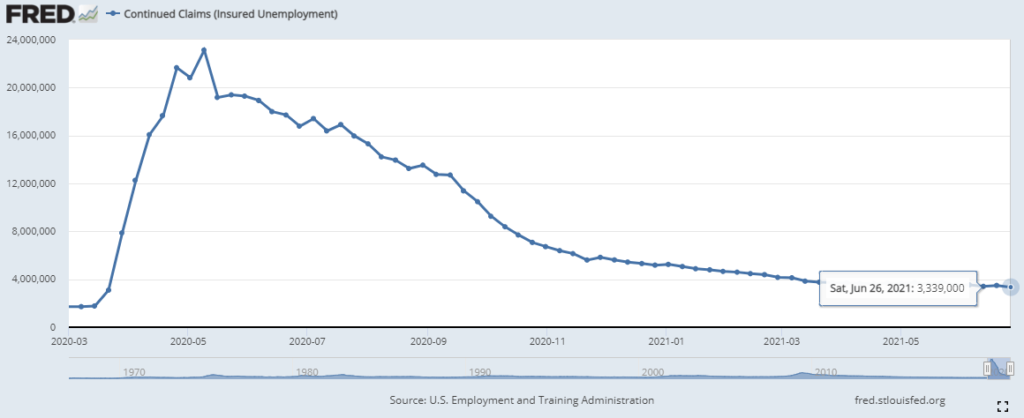
Weekly Jobless Claims are used as a barometer for the pace of layoffs in the general economy.
Unemployment Rate is the number of people who are unemployed that are actively seeking work.
"*" indicates required fields
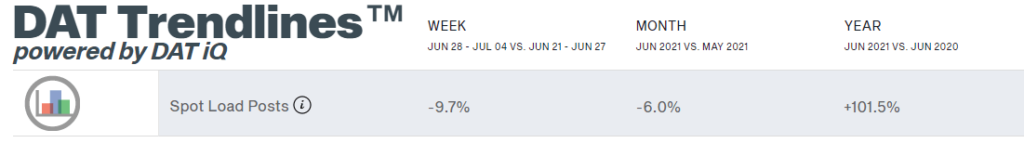
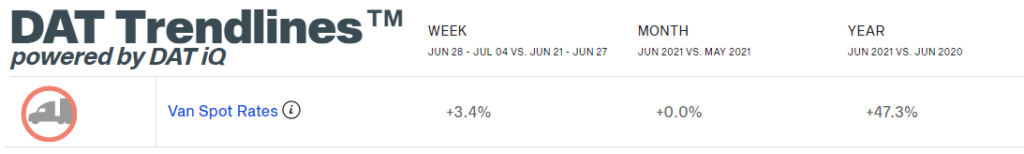
DAT reported that dry van spot load posts fell 6% month-over-month in June, but remained up by 101.5% year-over-year. Week-over-week spot volume growth shows a 9.7% decline, but this is, in part, due to there being one less business day than usual due to Independence Day.
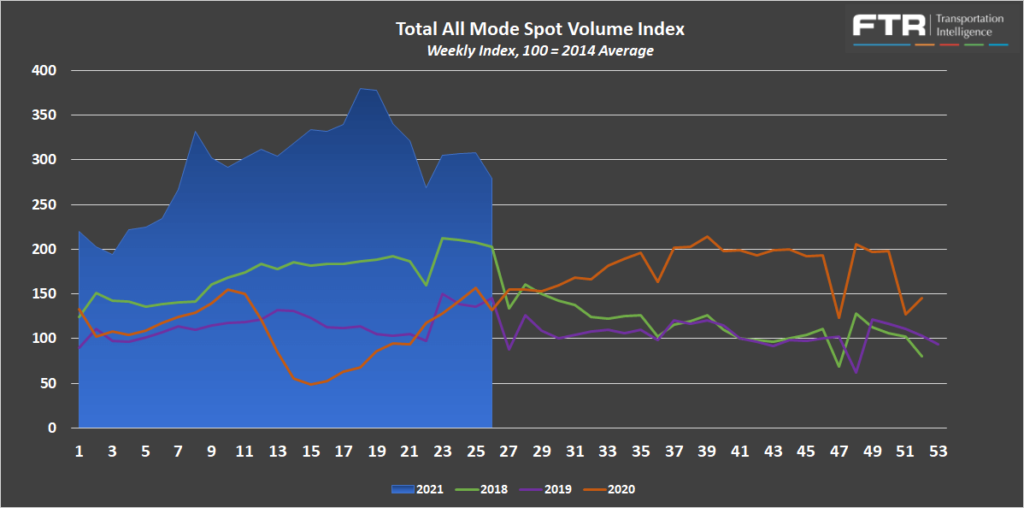
FTR and Truckstop’s Total All Mode Spot Volume Index does the best job at isolating the impact from different equipment types due to the increased allocation of flatbed freight in the data. In the most recent week, total load postings were down more than 9% despite increases in load postings for both dry van and reefer equipment types. Flatbed load postings falling by 15.6% more than offset the gains of 0.3% for dry van and 2.1% for reefer. Despite the recent declines, the total all mode index is still indicating load postings are up 112% year-over-year.
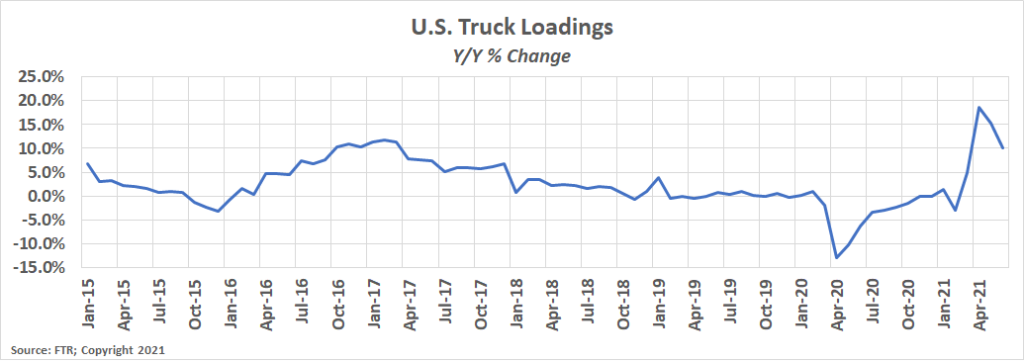
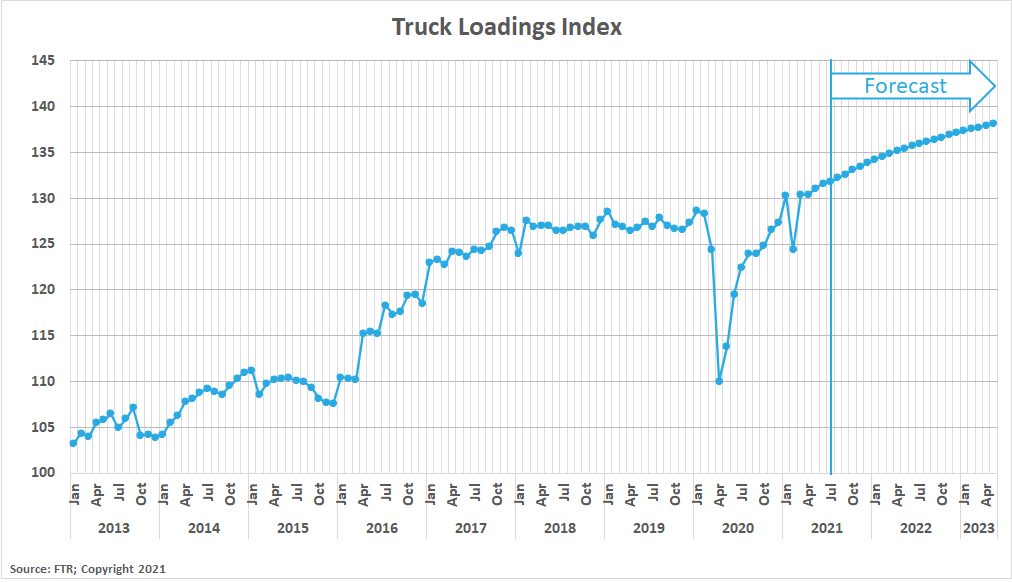
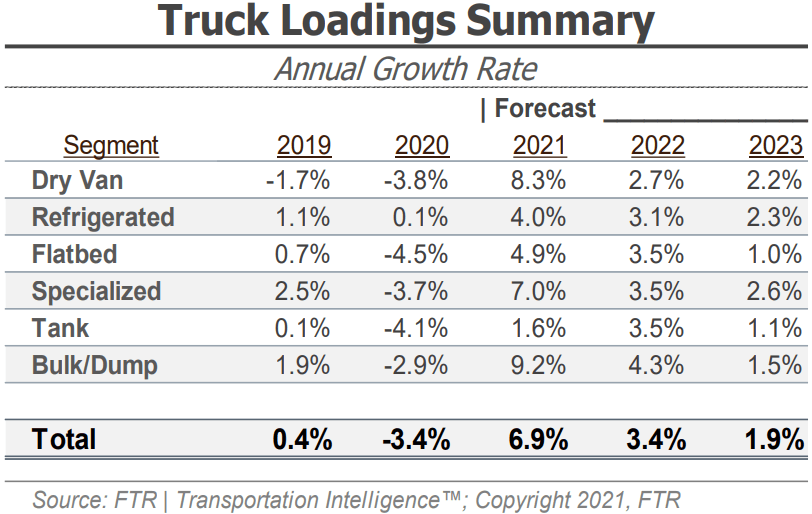
FTR’s Truck Loadings Index was up by more than 11% year-over-year in June after rising by 0.6% month-over-month from May. The pandemic lockdowns of 2020 are contributing to the favorable year-over-year comparisons, but the month-over-month growth indicates total all-mode volumes have been relatively consistent as of late. We are continuing to pay more attention to two-year growth trends in place of year-over-year comparisons due to the pandemic effect in 2020. June 2021 truck loadings were up 3.9% from June 2019 truck loadings, a slight decrease from 4.3% in the two-year period beginning May 2019.
The DAT Load to Truck Ratio measures the total number of loads compared to the total number of trucks posted on their load board. In June, the Dry Van Load to Truck Ratio decreased to 5.56, down 9.2% month-over-month, but up 57.8% year-over-year. The Reefer Load to Truck Ratio fell to 11.59, down 10.6% month-over-month, but up 112% year-over-year.
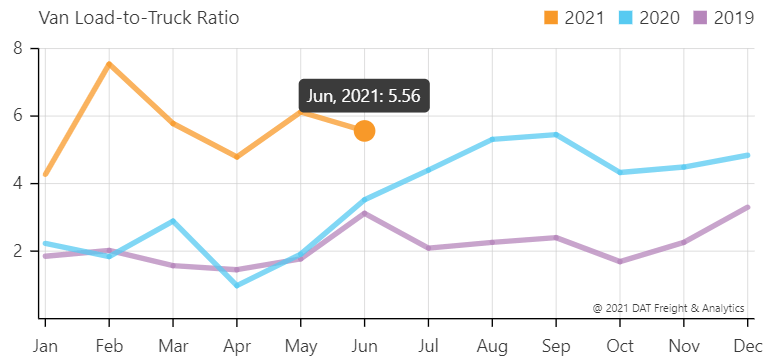
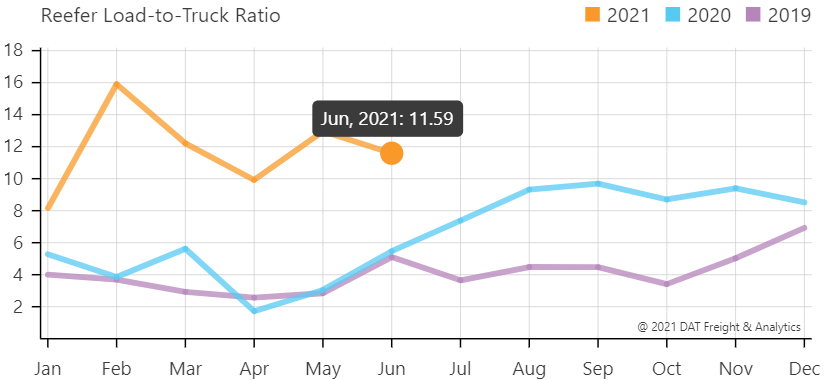
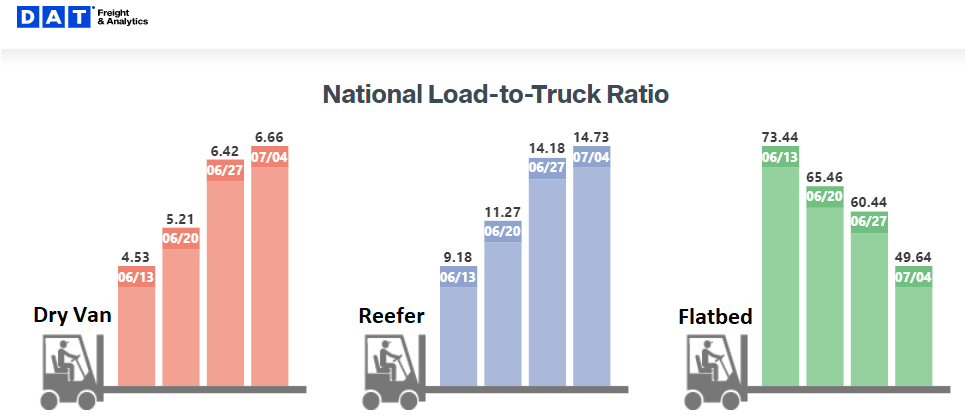
The weekly load to truck ratios show that conditions tightened throughout June and peaked in the week leading up to the Fourth of July for dry van and reefer equipment types. Flatbed market conditions, however, have been rapidly softening, falling 32% over the past four weeks. If normal seasonal trends were to hold, we should expect load to truck ratios to fall as July progresses. This would result in softer market conditions and downward pressure on spot rates.
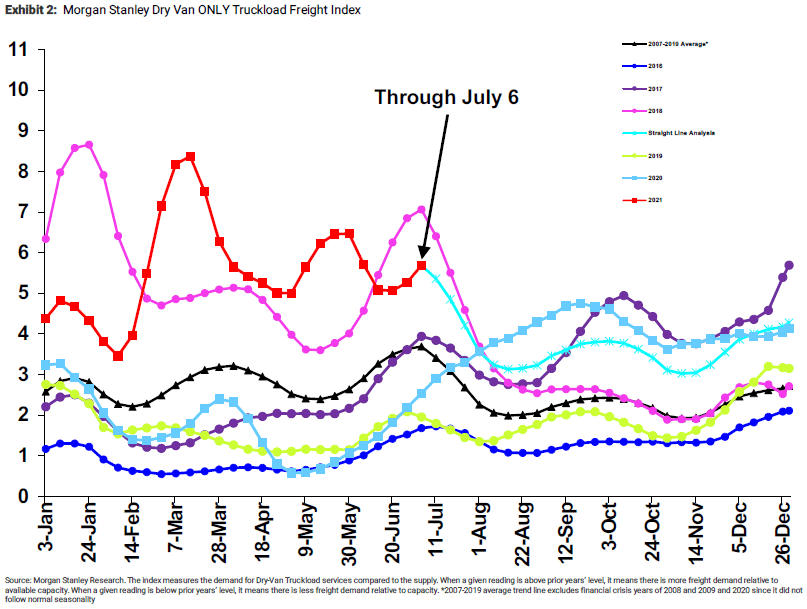
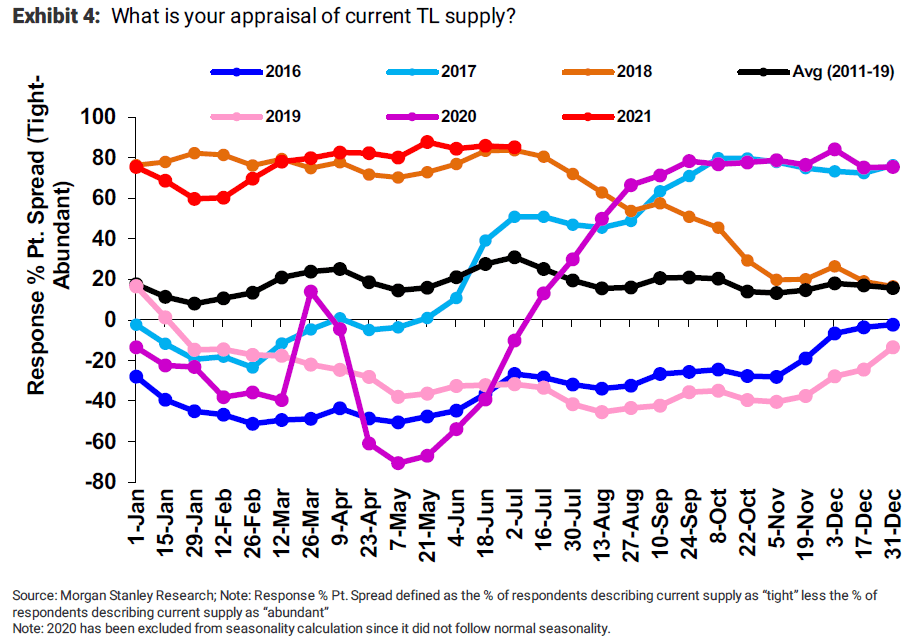
The Morgan Stanley Dry Van Freight Index is another measure of relative supply. The higher the index, the tighter the market conditions. According to the index, conditions have tightened as of late. This trend is in line with what we have seen across the other measures of relative supply. Looking forward, normal seasonality would indicate softening conditions between now and mid-August. Morgan Stanley’s straight-line forecast suggests conditions will reverse their recent trend and begin to settle throughout the back half of the year.
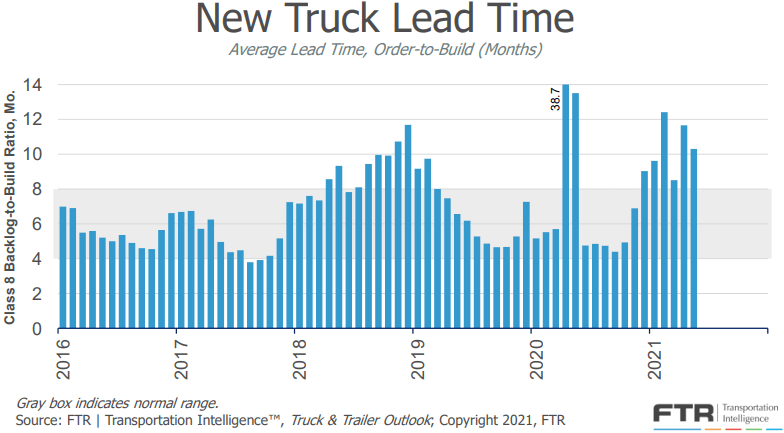
Carriers that are able to find drivers are still experiencing challenges with delivery delays on new truck orders. New truck lead time improved slightly to 10.3 months in May, down from 11.7 in April. The biggest factor in these delays is the continued shortages OEMs are experiencing with sourcing semiconductors.
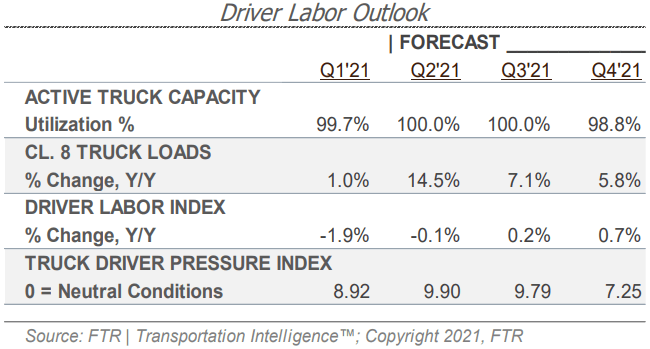
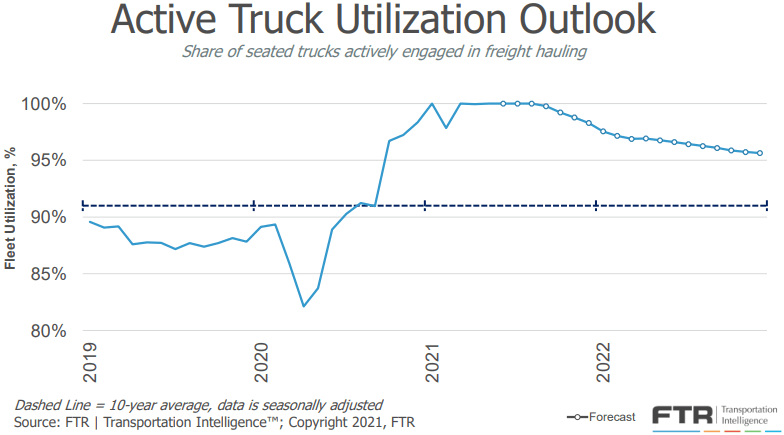
near term due to adjustments in the assumptions for driver capacity and productivity. The updated forecast now shows active truck utilization maxing out at 100% in the second quarter, remaining there throughout Q3 and only pulling back slightly to 99% in Q4. FTR noted that the one risk to this forecast is that if unemployment benefits are sharply reduced, higher rates of labor participation could mean capacity will return more quickly than expected.
FTR reports that new truck orders picked back up slightly in June, with preliminary results indicating 26,700 new Class 8 trucks were ordered in the month — a 24.5% increase from 21,454 in May, and a 77% increase from 15,104 in June 2020. This is now the tenth straight month with new orders above the 20,000 units required to sustain current levels of capacity. FTR noted they expect a surge of orders when manufacturers start booking orders for 2022 as soon as this month.
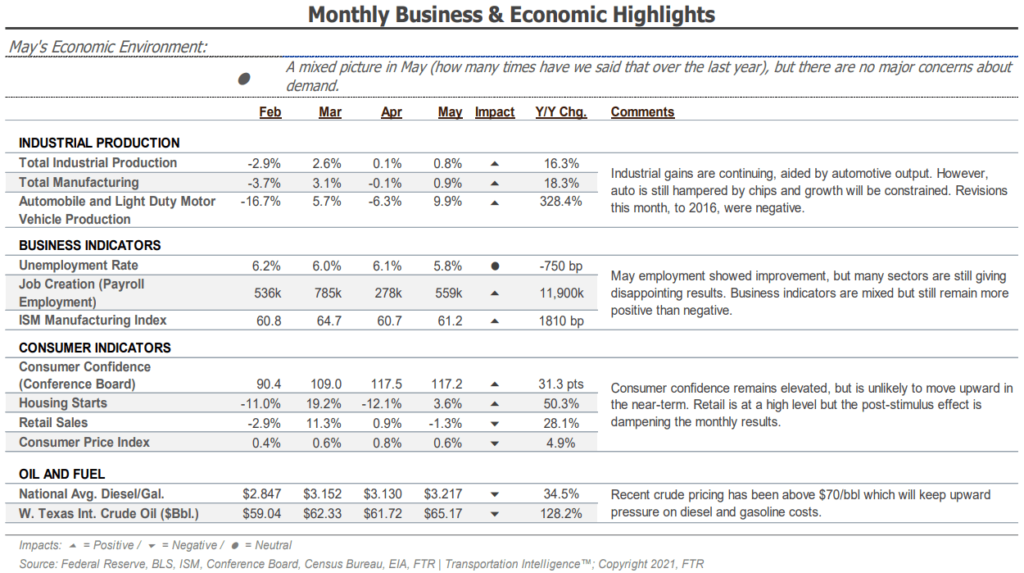
There are several indicators that the economy will maintain its strength over the next several months as the country continues to reopen. Although rising prices may limit growth going forward, housing activity remains up more than 50% year-over-year. Additionally, industrial production and manufacturing are both up month-over-month and year-over-year, driven by an almost 10% increase in auto output.
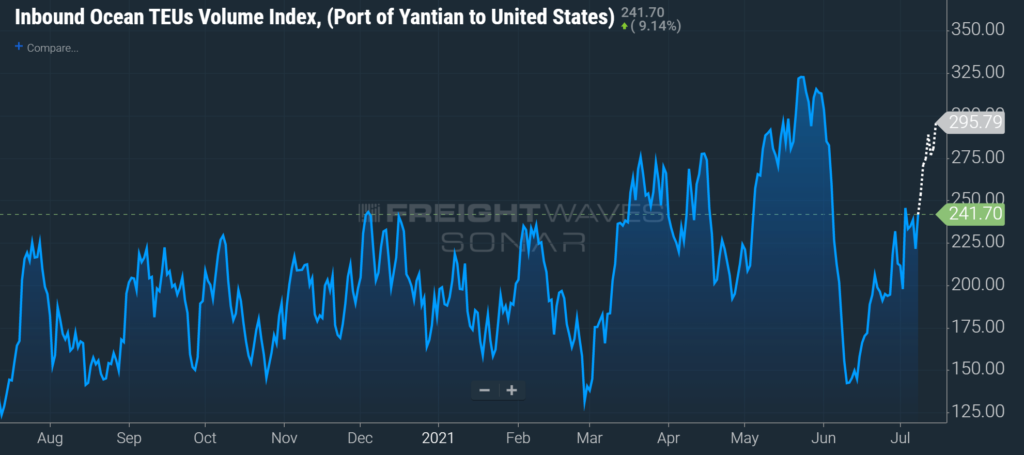
There is a strong relationship between the volume of Chinese imports to the U.S. and over-the-road freight volumes. Last month, a Covid outbreak at the Port of Yantian in China resulted in a partial shut down of operations at the port. The port, which is part of the third busiest gateway in the world, was operating at 30% capacity. The chart below shows the impact to inbound freight volumes from the Port of Yantian, a clear dropoff in early June. If this were to persist, it would certainly have been detrimental to truckload demand here in the states. Fortunately, the breakout was contained relatively quickly and operations have resumed at 100% capacity.
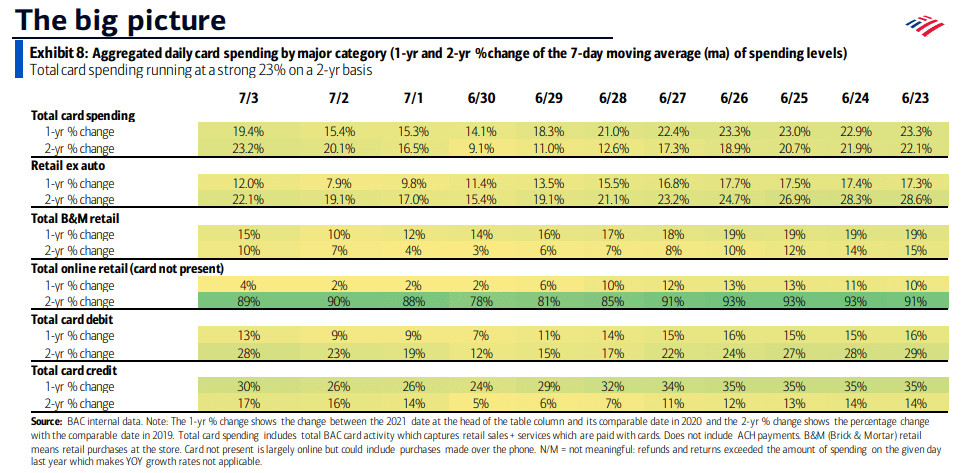
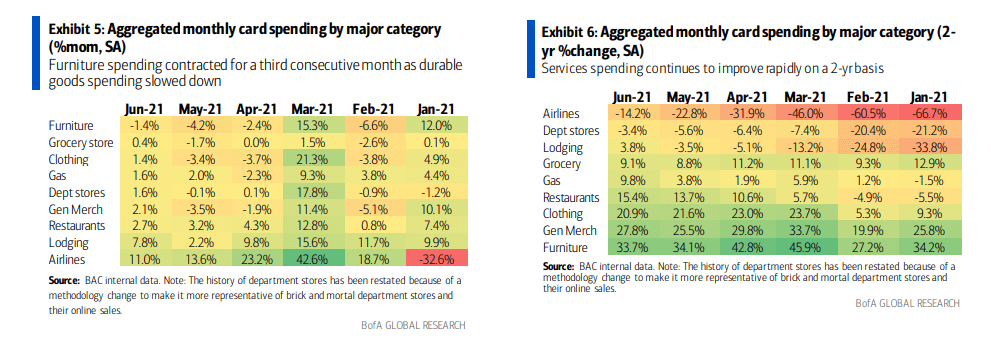
When looking at monthly card spending by major category, airlines and lodging increased the most sequentially in consumer spending month-over-month in June (Exhibit 5). Airline spending continues to grow but remains down when considering the growth over the prior two years (Exhibit 6). Lodging spending has finally turned positive, up 3.8% from 2019.
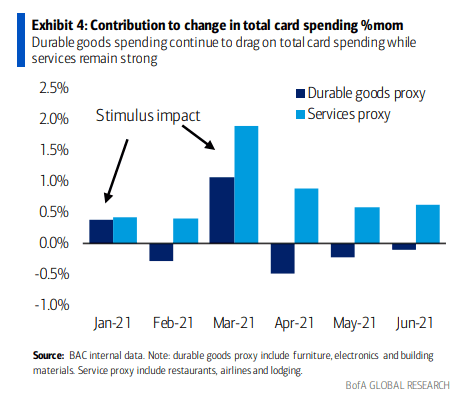
This increase in spending on services is consistent with a larger trend we have seen play out sequentially over the past three months. The chart below illustrates the impact to total card spending from gains/losses on durable goods vs. services. Over the last three months, the impact to total spending from durable goods has been negative, meaning spending is slowing on the representative categories. On services, the impact has been positive every month this year, meaning spending on services is increasing. Over the last three months, the gain in services spending has more than offset the negative growth from durable goods by 300%. It is clear that Americans are returning to normal activities such as travel and entertainment. This shift in consumer behavior and spending could help lead to a decrease in truckload demand if sustained. It is unlikely that a downshift in demand would be enough to bring about an equilibrium market, but it could certainly help ease the burden on carriers looking to add capacity.
The unemployment trends have continued their gradual improvement in June. Initial claims in the most recent week came in at 373,000, down just 3,000 from last month, and continued claims are relatively flat at 3.3 million on a weekly basis. Total payroll employment continues to rise, up 559,000 in May after increases of 770,000 in March and 266,000 in April. The largest gains were again seen in the leisure and hospitality sector, which added 292,000 jobs in May, following increases of 331,000 in April and 206,000 in March.