
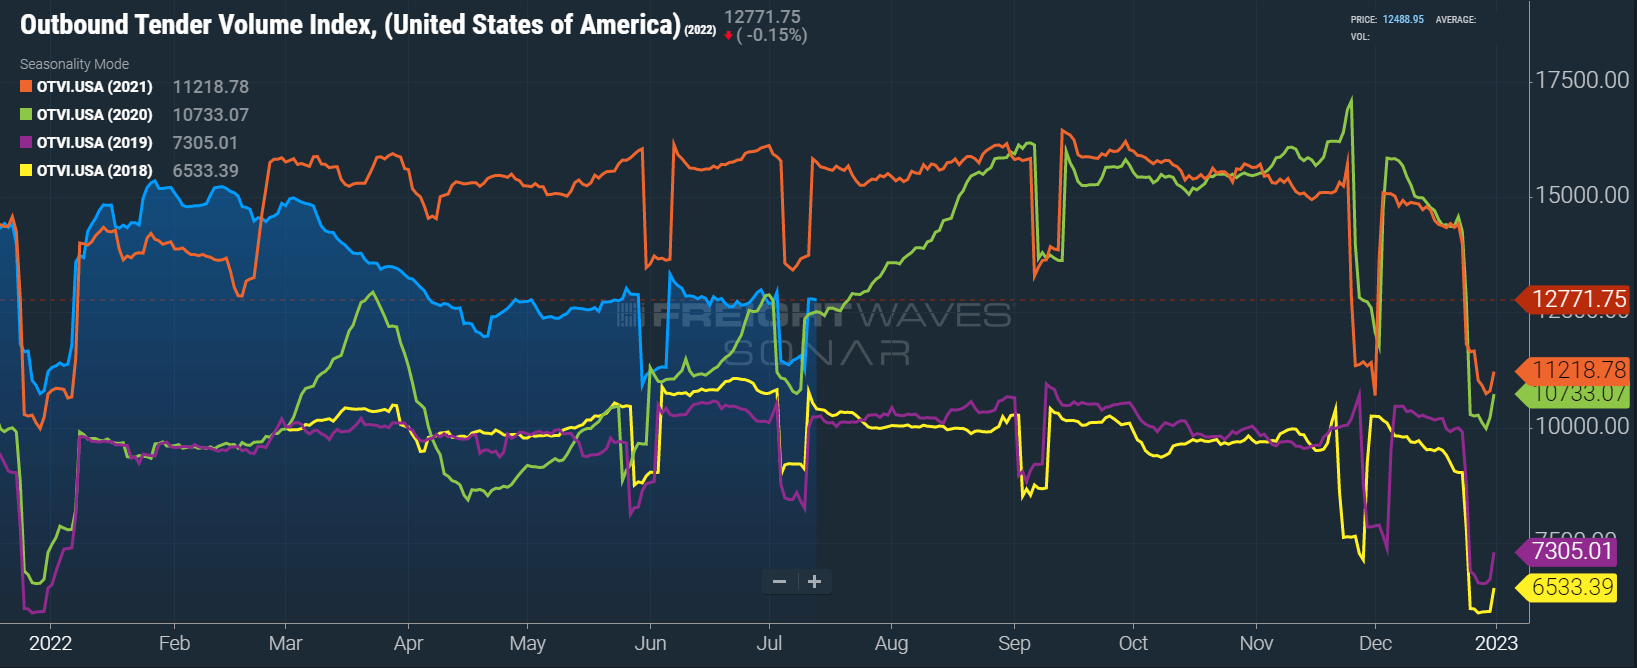
The FreightWaves SONAR Outbound Tender Volume Index (OTVI), which measures contract freight volumes across all modes, was down 19.2% year-over-year in early July.
Of course, it is important to note that OTVI includes both accepted and rejected load tenders, so we must discount the index by the corresponding Outbound Tender Rejection Index (OTRI) to uncover the true measure of accepted tender volumes. The downward tender volume trend drops to just 3.1% below last year’s all-time high when applying this method to year-over-year OTVI values.
Tender rejections are down 67%, from 22.8% a year ago to 7.4% as of Tuesday, July 12th, which helps explain the accepted tender volume increase despite the significant decline in total tender volumes.
As for specific equipment types, the dry van tender volume index was down 20.7%, and the reefer tender volume index was down by 25.8%. This equates to a 3.5% year-over-year decrease and a 0.5% decrease in actual volumes for the two modes. As of July 12th, dry van tender rejections were down nearly 69% year-over-year. For reefer equipment, that number is as high as 72%.
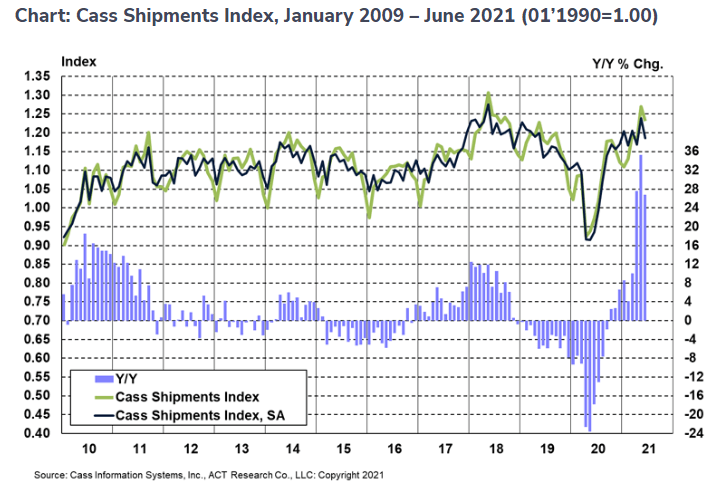
Contrary to FreightWaves data, the June Cass Shipments Index is showing nearly 27% year-over-year growth in the total number of shipments. Even though there was a month-over-month sequential decline of 3% from May as demand eases, the year-over-year growth is a sign that freight demand remains strong.
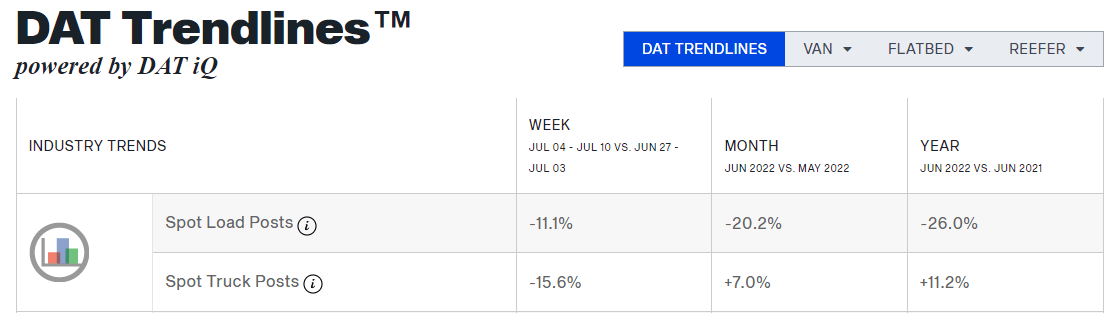
DAT data indicates that year-over-year spot volumes were down by 26% in June after falling by 20% month-over-month from May. This degree of decline in June is abnormal and showcases the strength of the contract market.
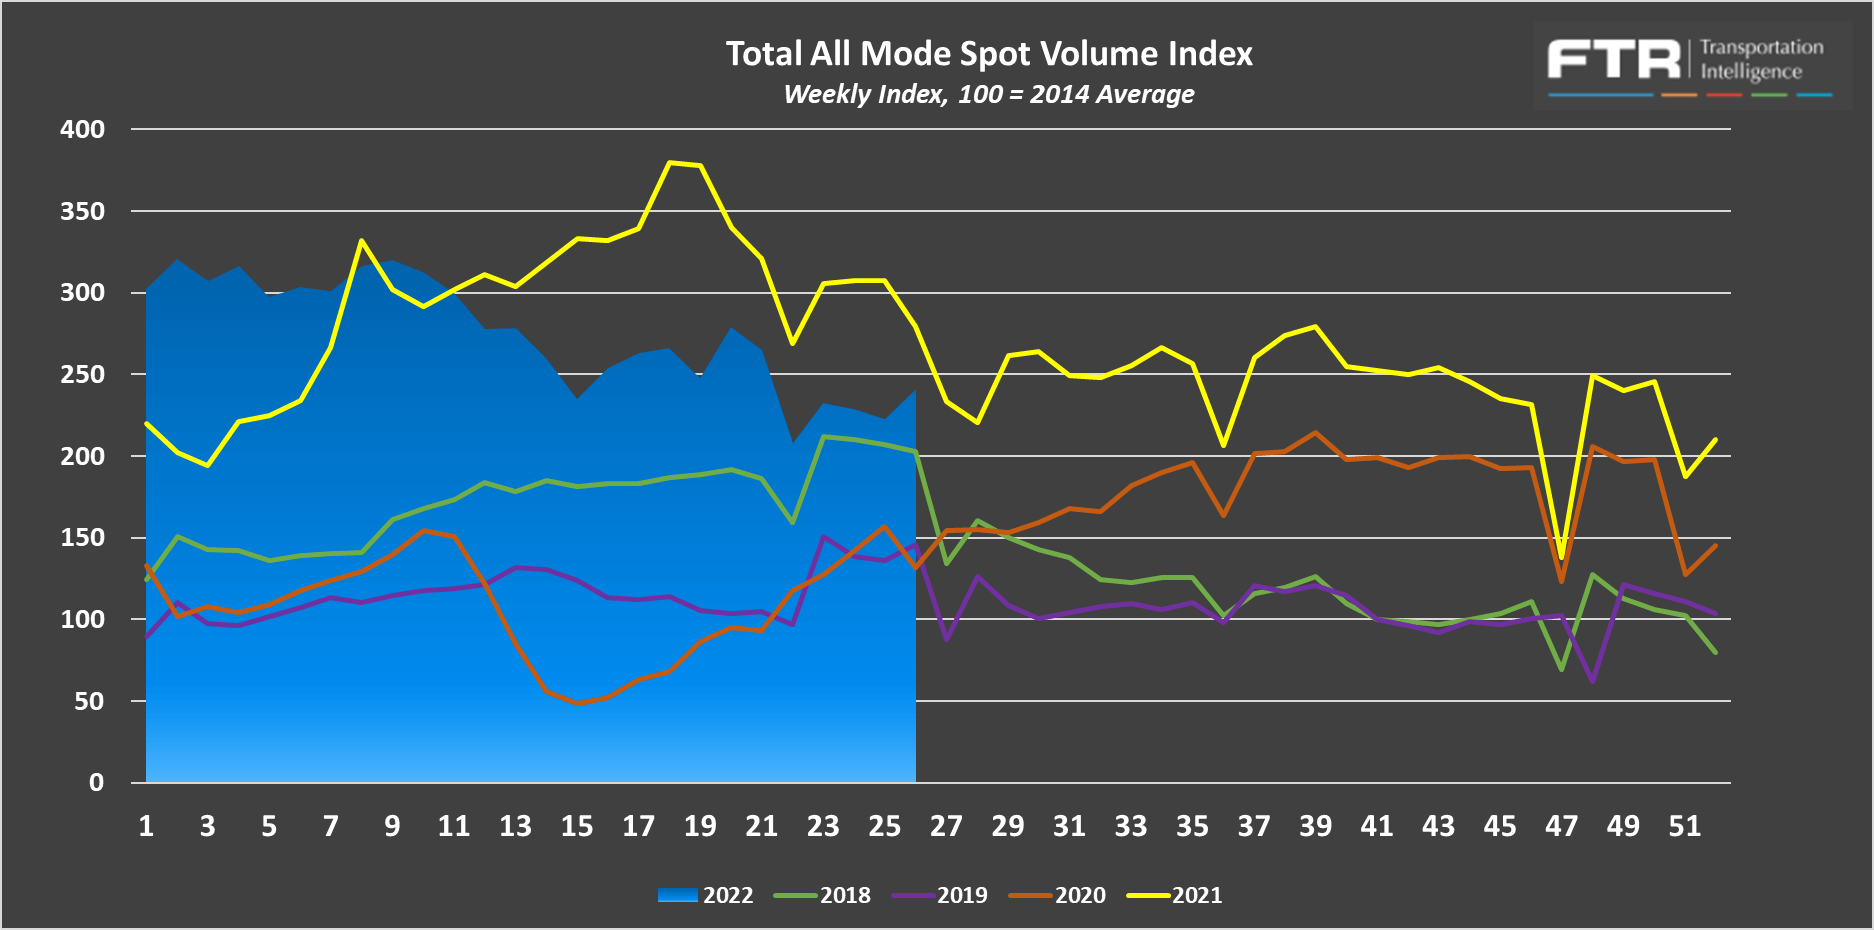
FTR and Truckstop’s Total All Mode Spot Volume Index help illustrate that even though spot volumes are down from last year, they remain above previous historical highs. The All Mode index is now down 13.8% year-over-year but is up 65% from 2019.
The Sonar Outbound Tender Reject Index (OTRI) measures the rate at which carriers reject the freight they are contractually required to take. The current rate is 7.21% in early July, down slightly from about 8% a month ago.
Rejection rates this low throughout the summer peak season are unusual and indicate that we are likely to see national tender compliance issues remain low for the foreseeable future.
Easing demand and the gap between spot and contract rates contributed to declines in tender rejections throughout the month. As we anticipated in last month’s report, conditions have continued to ease as we move beyond the Fourth of July holiday.
After a brief spike earlier this week, which we believe is associated with the onset of a CVSA Safe Driver Week, we expect further market softening throughout the month, with rejections approaching equilibrium levels of 5% or less as the summer peak season winds down. We saw this through much of 2019, the softest market in recent memory.
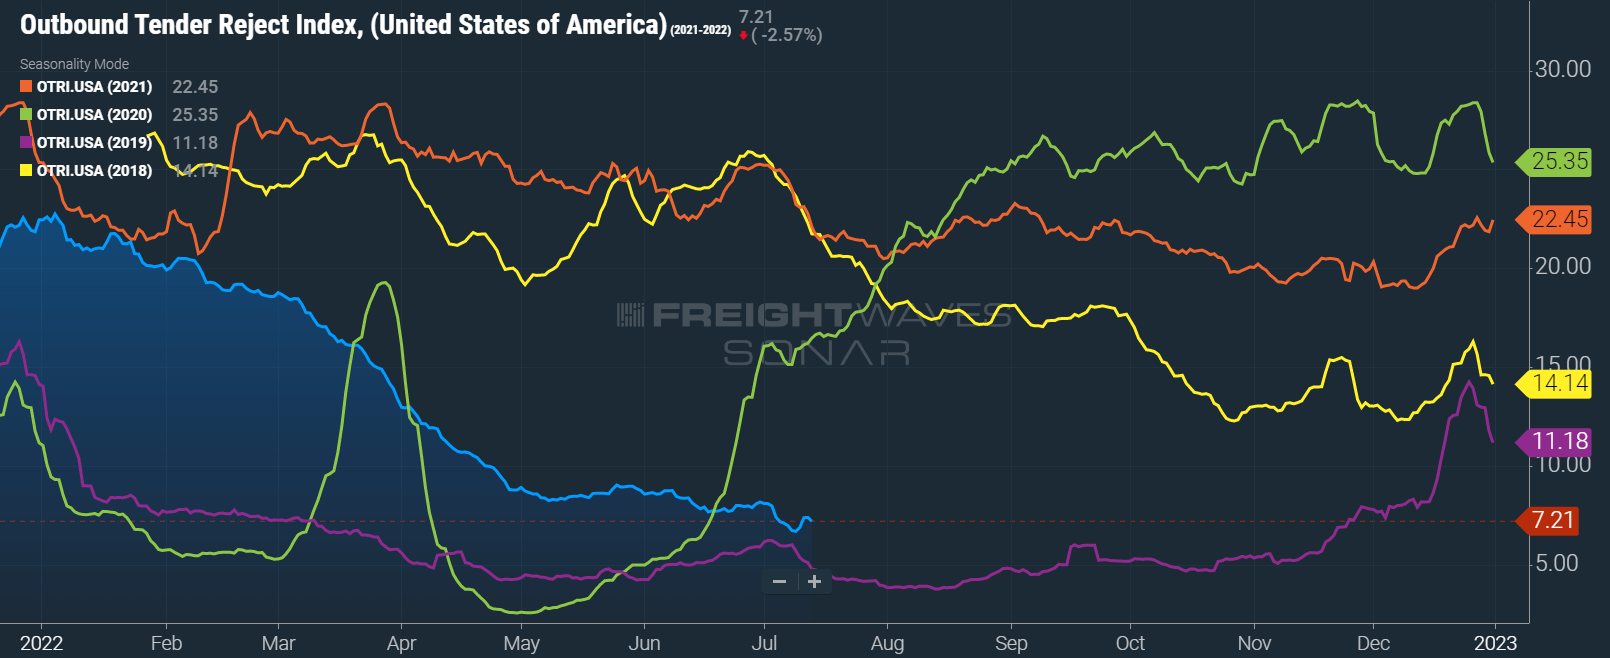 OTRI continued to normalize to equilibrium levels despite summer peak season pressures, a sign that strong routing guide compliance is here to stay.
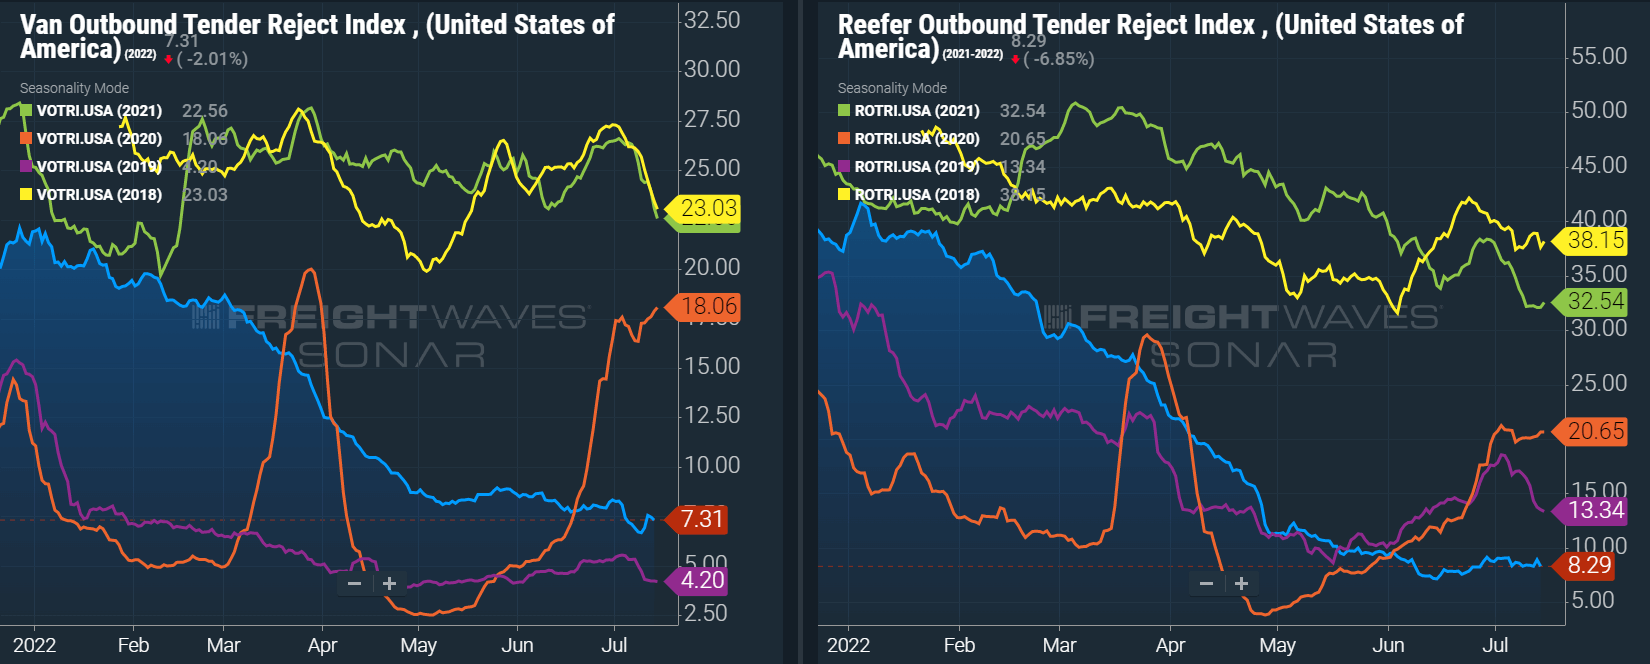 Dry van and Reefer tender rejections followed a similar trend to the all mode index, barely seeing any impact from summer peak season.
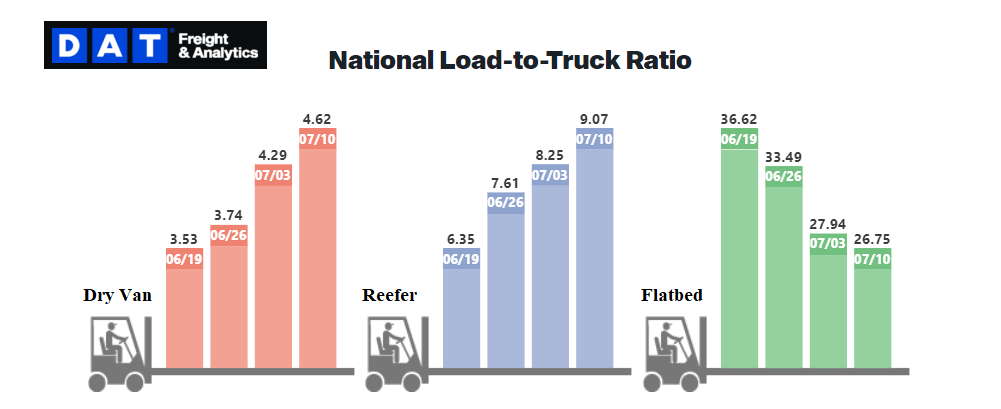
The DAT Load to Truck Ratio measures the total number of loads compared to the total number of trucks posted on their load board. In June, the Dry Van Load to Truck Ratio increased to 3.88, which was down 11.6% month-over-month and 30.2% year-over-year.
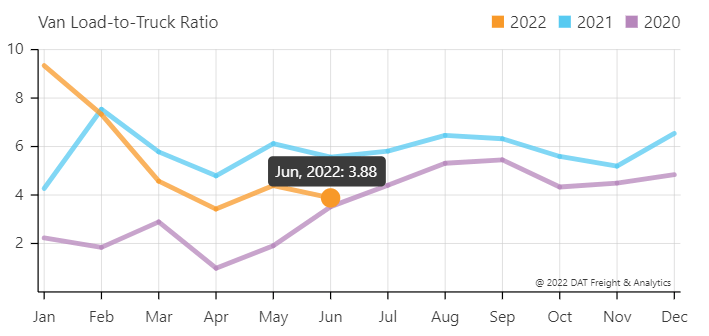
The Reefer Load to Truck Ratio decreased to 7.03, which was down 6.7% month-over-month and 39.3% year-over-year.
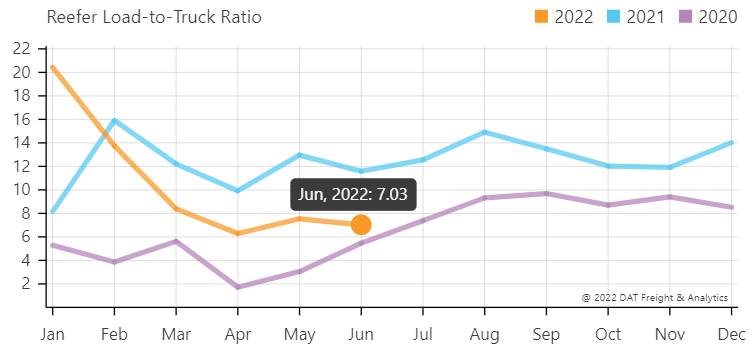
Weekly load to truck ratios for van and reefer have tightened for four straight weeks during the summer peak season. However, we expect this trend to reverse in the weeks ahead as demand eases in line with the seasonal demand slowdowns we typically see this time of year.
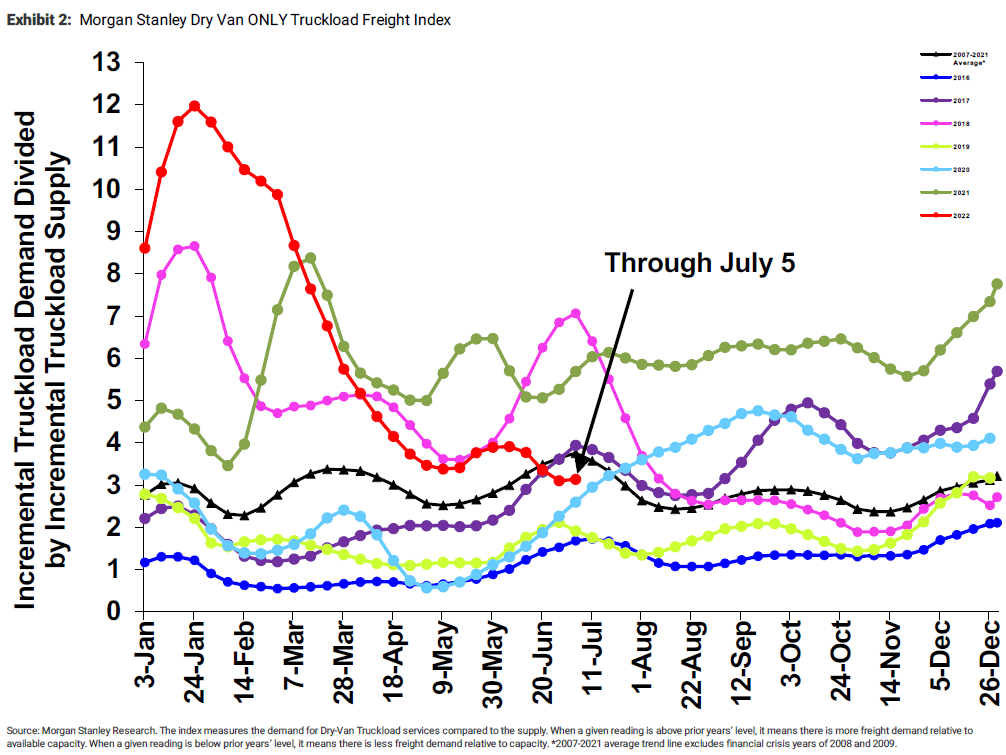
The Morgan Stanley Dry Van Freight Index is another measure of relative supply. The higher the index, the tighter the market conditions.
Data from June illustrates softening conditions at a time when we typically see tightening. The black line with triangle markers on the chart provides a great view of what directional trends would be in line with normal seasonality based on historical data dating back to 2007. This data leads us to believe that conditions will continue to ease throughout July and into August.
Van and reefer spot rates appear to have found a floor in June and early July as disruptions from the summer peak season put enough upward pressure on rates to slow the rapid declines from January to May.
Van rates were flat and reefer rates were up slightly through the first half of July. However, as the month progresses and seasonal demand wanes, we anticipate further downward rate pressure. Flatbed rates did not follow this trend, decreasing sharply through the first half of the month.
 Spot rates have trended down rapidly and are on pace to finish the month down year-over-year for the first time since 2020.
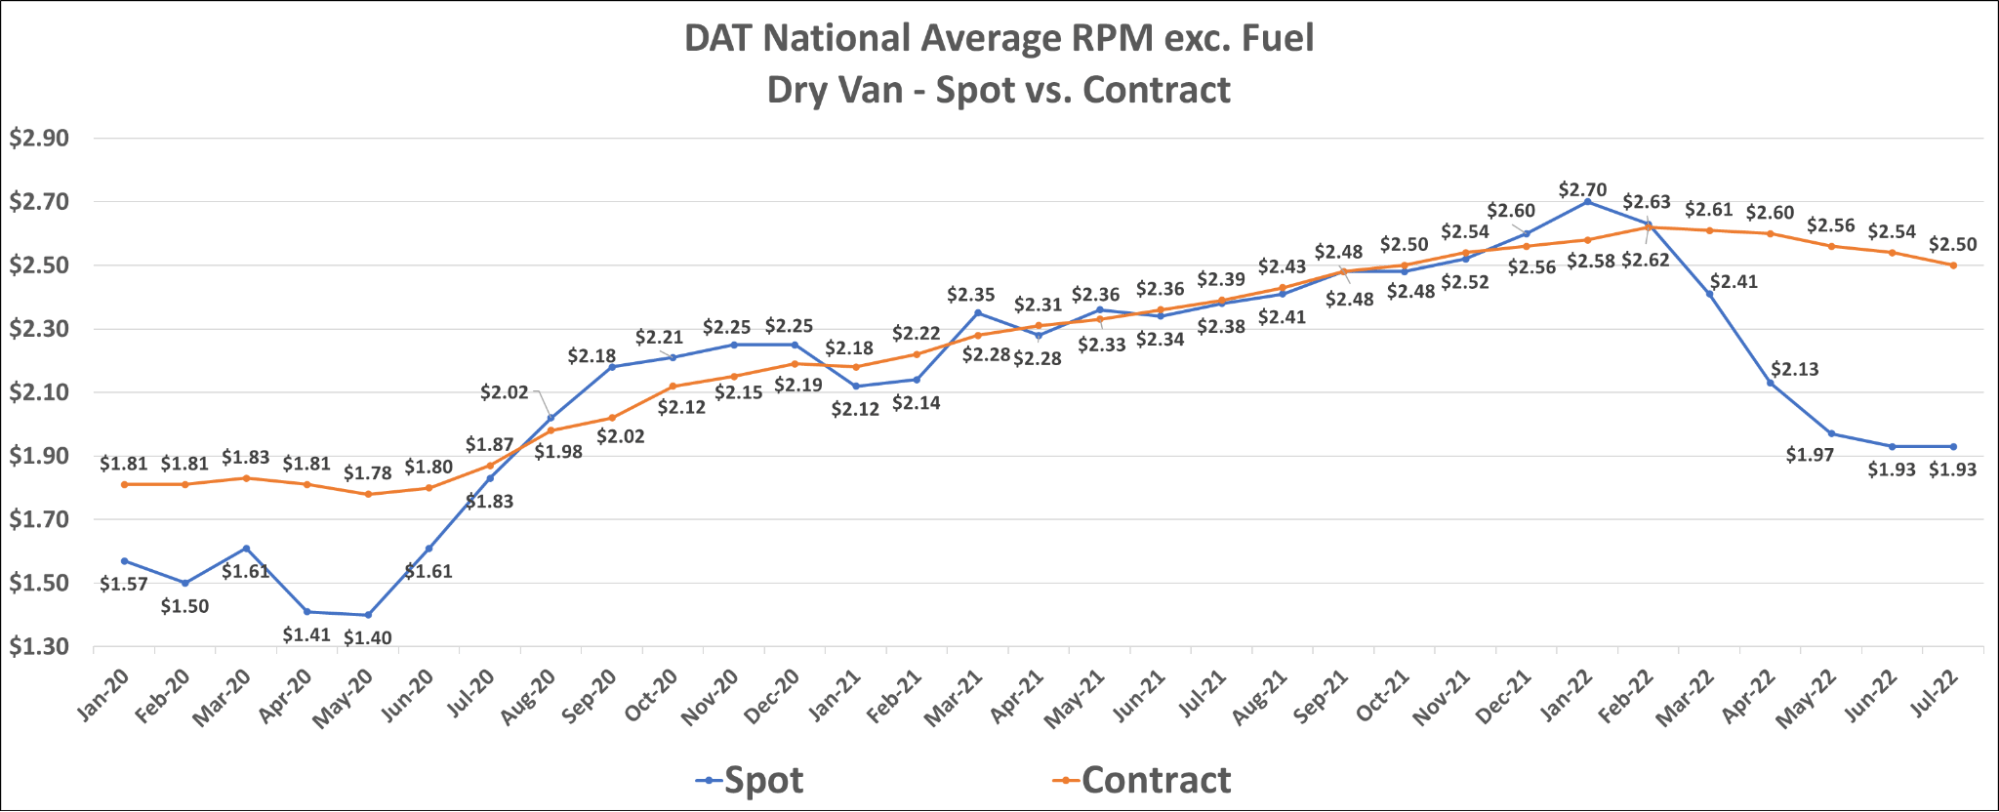
Dry van contract rates continued to slide in early July as shippers updated pricing. However, they remain well above spot rates, a sign that we can expect to continue to see downward pressure on contract rates until the gap between them closes further. The current dry van contract rate is $2.50 per mile, excluding fuel.
Shippers continue to experience elevated transportation costs due to high fuel prices, offsetting most or all of the benefits they would typically see from declining linehaul rates.
Historically, when spot rates fall quickly amid deflationary market conditions, it takes a long time for contract rates to follow. In this market cycle, however, van contract rates have fallen by $0.13 in just five months; last market cycle, it took ten months for contract rates to fall at the same rate (from their peak in mid-2018). For further context, since January 2022, spot rates have fallen $0.77 per mile, excluding fuel.
Over the past two years, many shippers who wanted contractual coverage hosted pricing exercises and RFPs more frequently to maintain routing guides as rates climbed monthly. This practice is a primary driver of rates falling more quickly now.
The gap between spot and contract rates is also a significant contributor. With the national spot rate average sitting $0.57+ below the national average contract rate, shippers are being incentivized to put their freight out to bid. However, we encourage caution because regional rate pressures may differ depending on proximity to major ports or rail hubs.
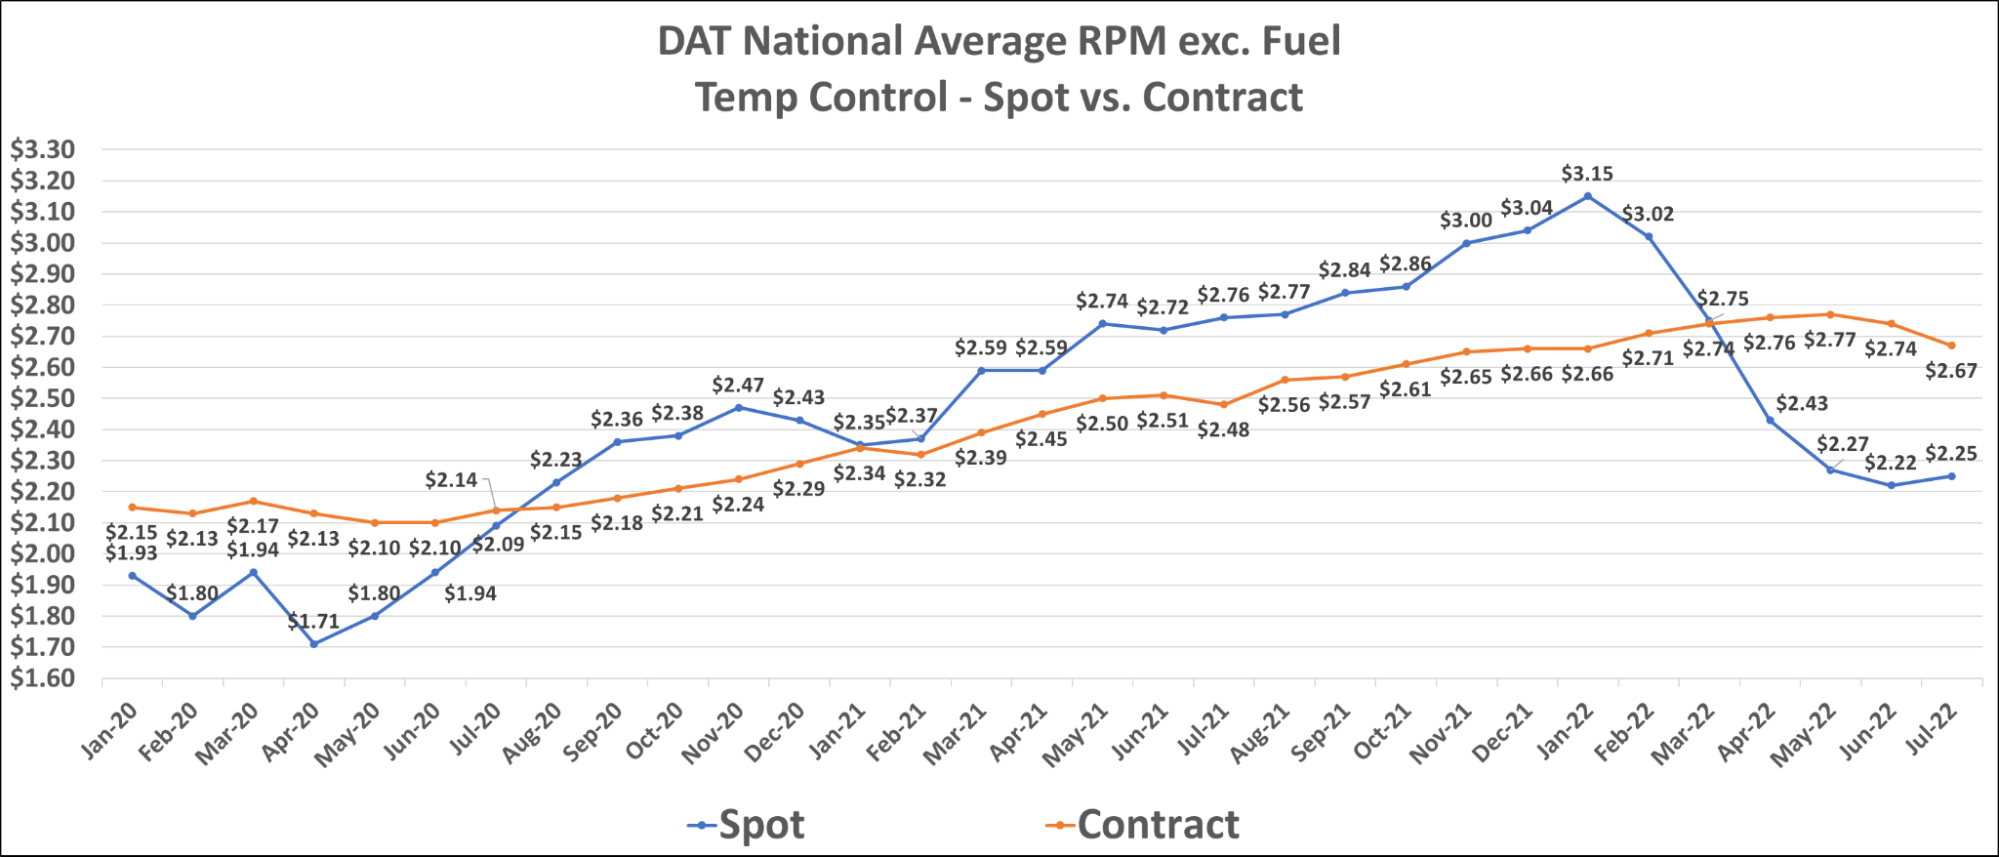
Reefer contract rates are finally starting to fall more rapidly, down $0.07 MTD in July after the first sequential decline of just $0.03 in June. They currently sit at $2.67 per mile, excluding fuel.
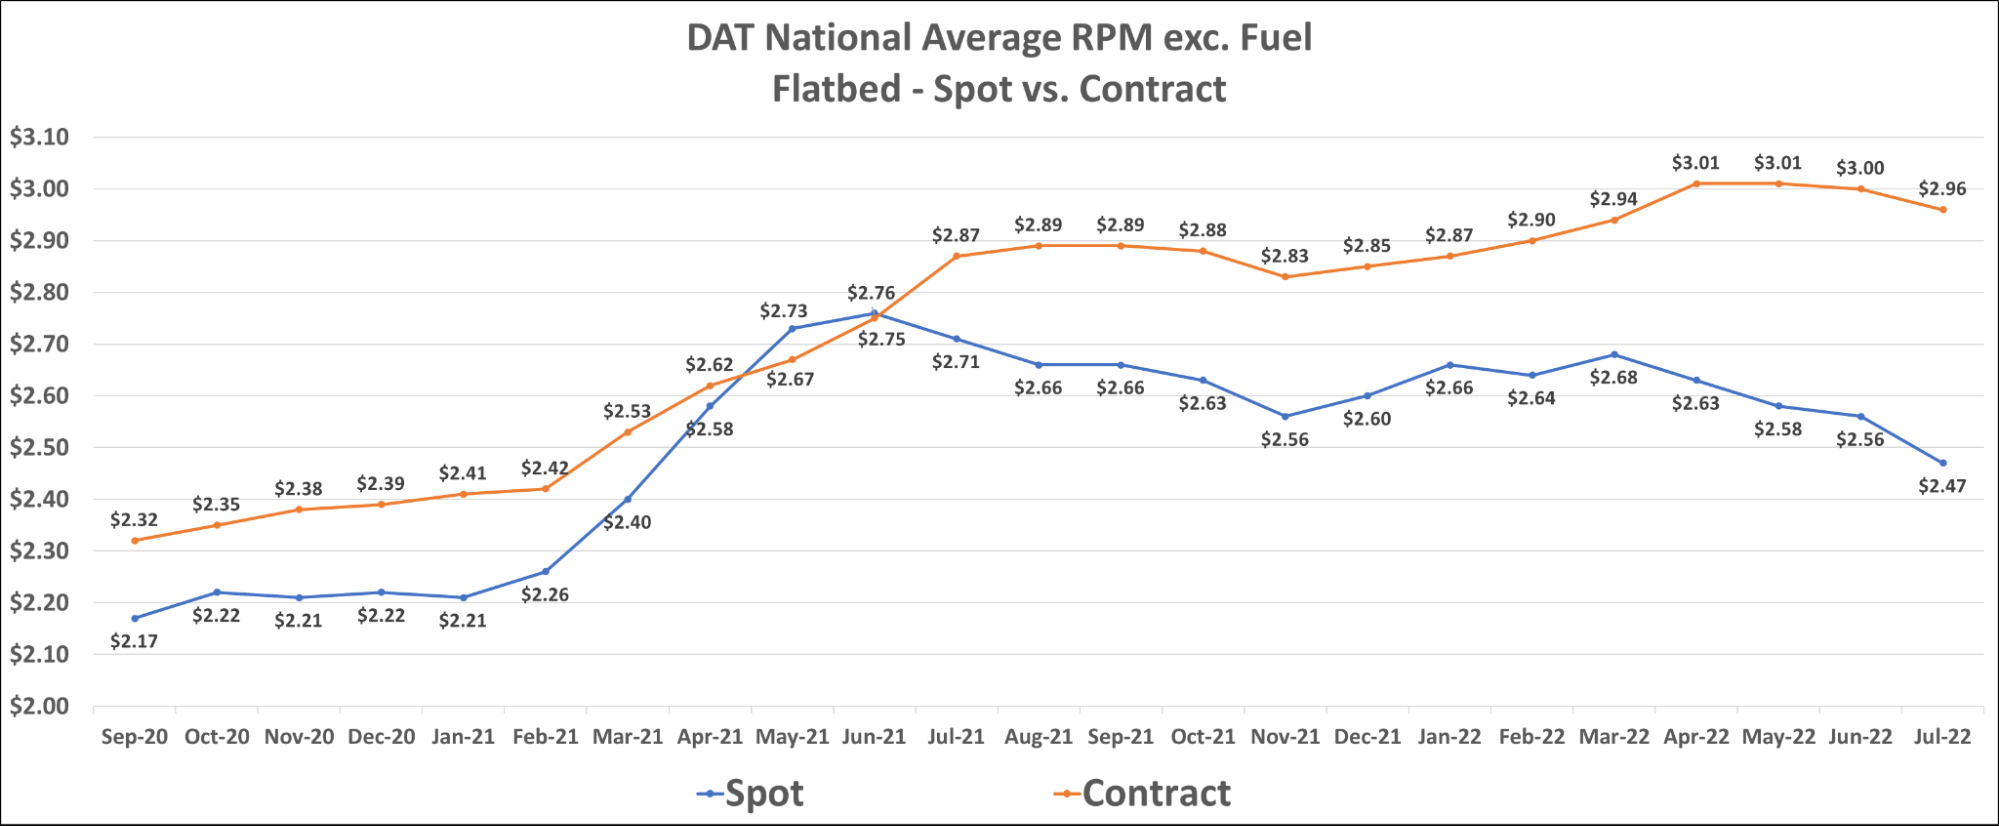
The flatbed market is also starting to see contract rates decline, down $0.04 MTD in July after the first sequential decline of just $0.01 in June. They currently sit at $2.96 per mile, excluding fuel.
Rising fuel costs are starting to take a toll on carriers. Those with fuel surcharge-protected contract freight have mitigated much of the impact. However, those with high exposure to the spot market are seeing the profitable opportunities they’ve grown used to over the past two years dry up.
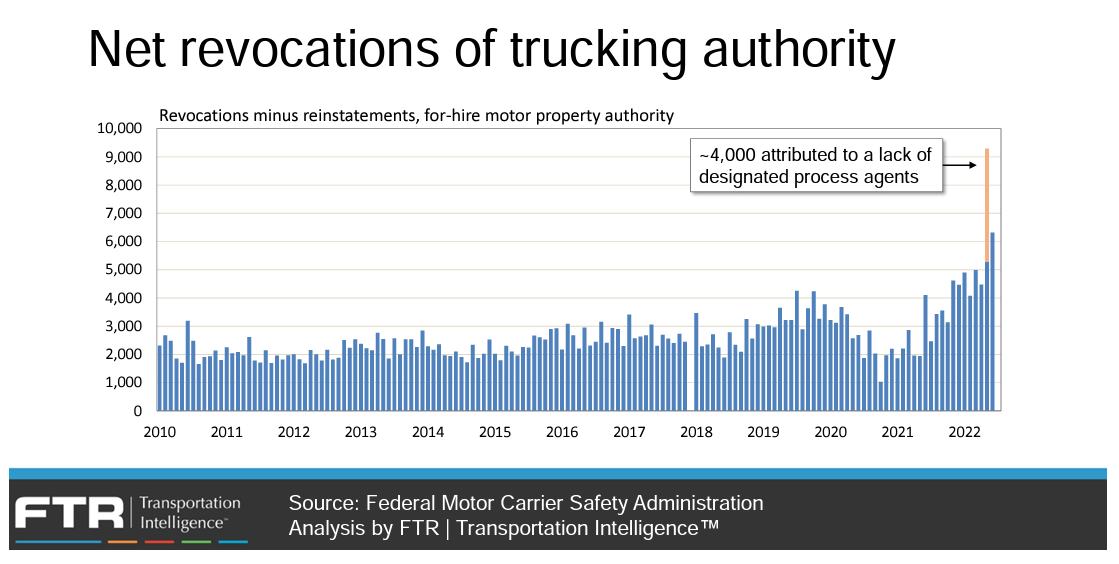
The carriers most impacted by the recent market shift are owner-operators and smaller fleets, many of whom just opened up shop during the past two years. As the spot market opportunities they counted on have disappeared, they have had to rethink their approach or close altogether. Net revocations of trucking authority, as calculated by the FTR, had a second consecutive record-setting month. Though much of this is due to equipment and drivers shifting to company jobs, we will see more carriers exit the market as spot demand continues to fall.
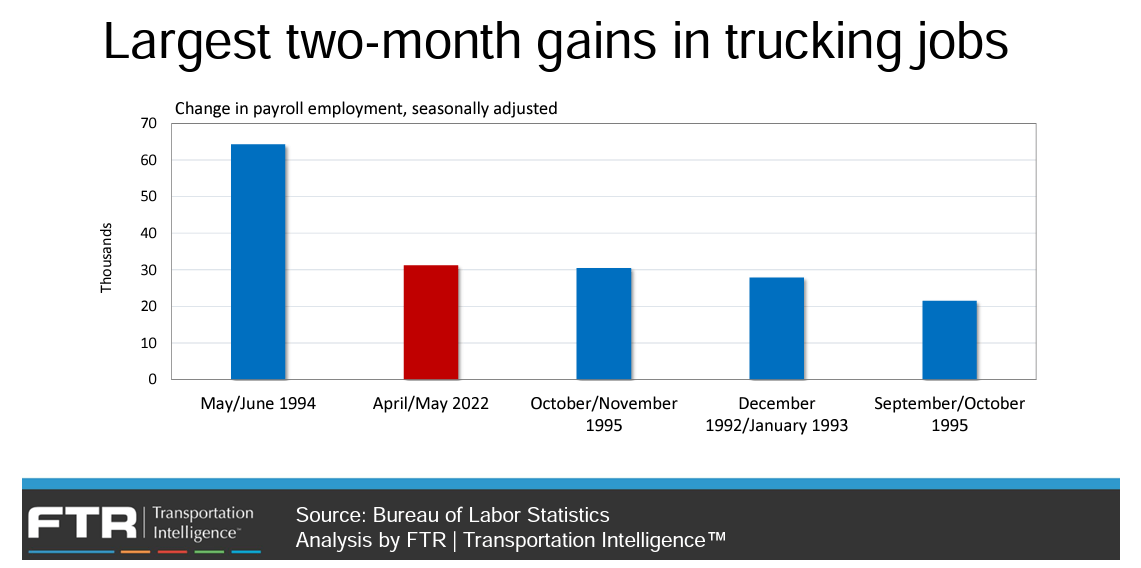
Despite the rise in trucking authority revocations, April to May saw the second largest two-month increase in trucking jobs ever, a sign of continued demand strength relative to supply and evidence that the market is still heavily constrained by supply-side shortages.
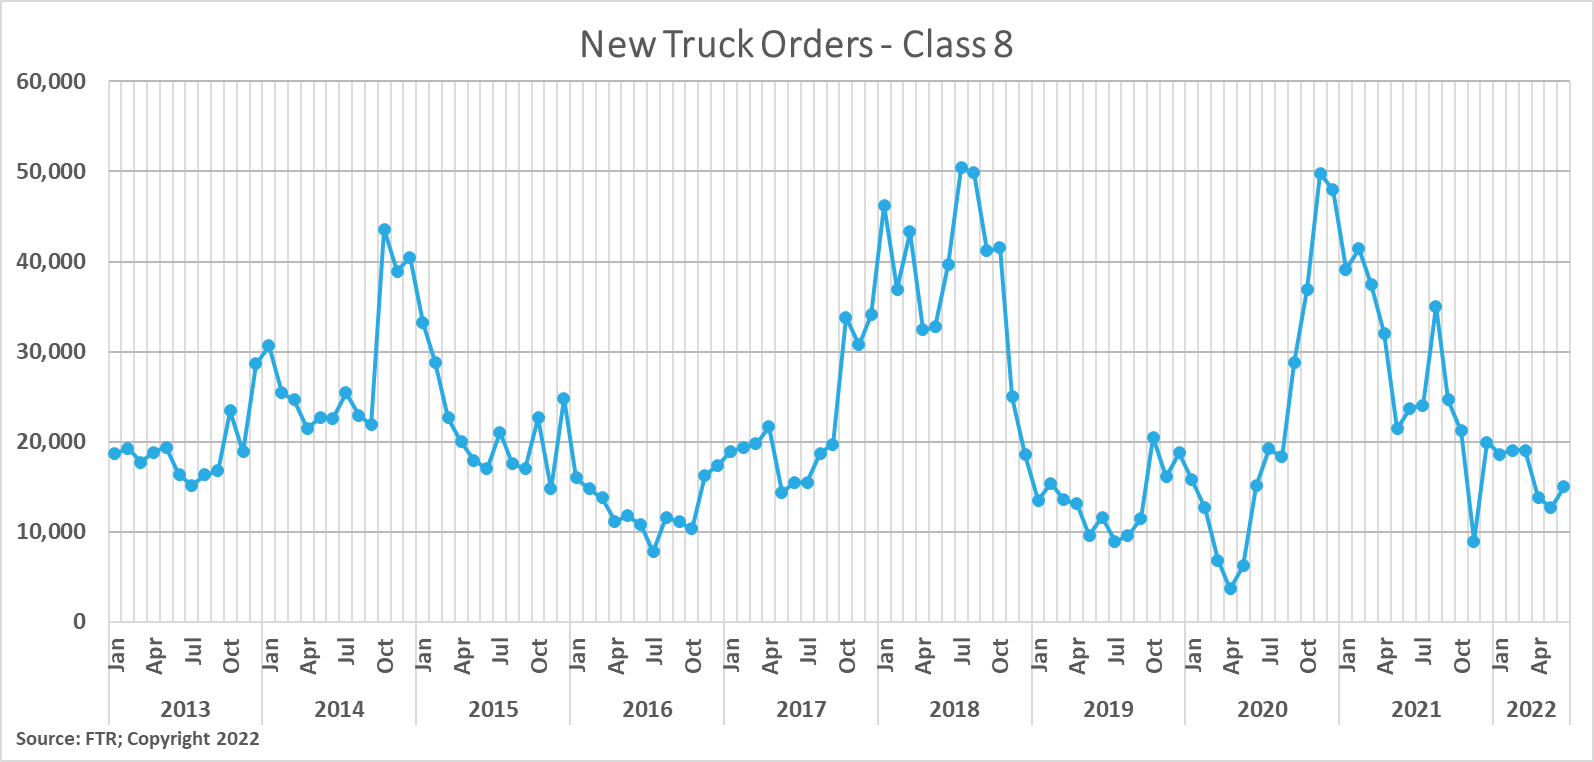
After two consecutive months of easing truck orders, we saw a slight rebound last month. New Class 8 truck orders are now estimated to reach around 15,000 for the month. Additional equipment is still in demand, and production delays are expected to force OEMs to continue working through backlogs throughout 2023. The average time from order to delivery actually decreased slightly from 10.5 months in April to 10.1 months in May.
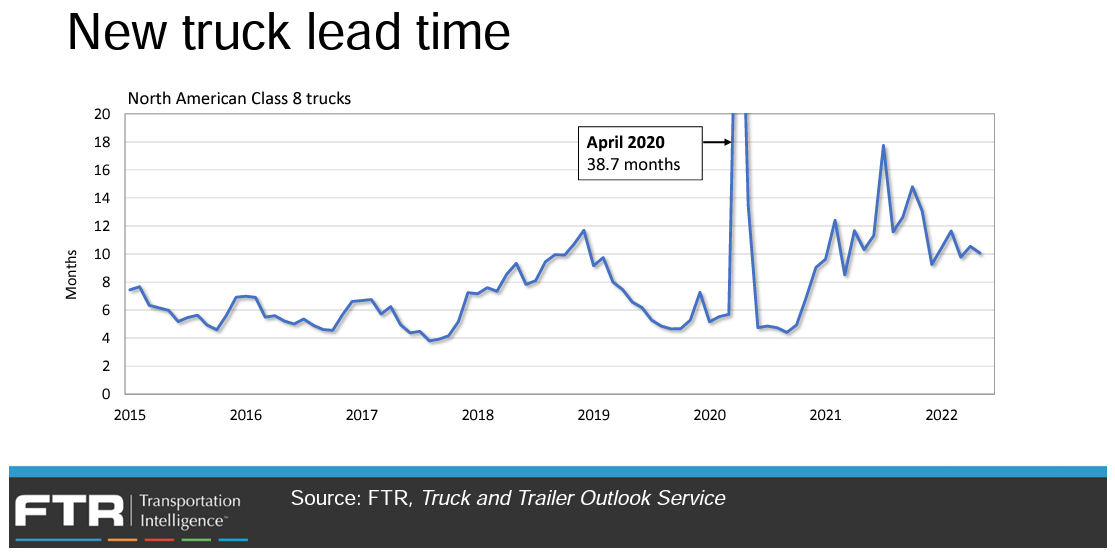
New truck lead time decreased slightly from 10.5 months in April to 10.1 months in May.
New trailer production levels improved by 4% in May, up from 5% pullbacks in April, which is a sign that trailer OEM’s are seeing some improvements as the supply chain begins to normalize.
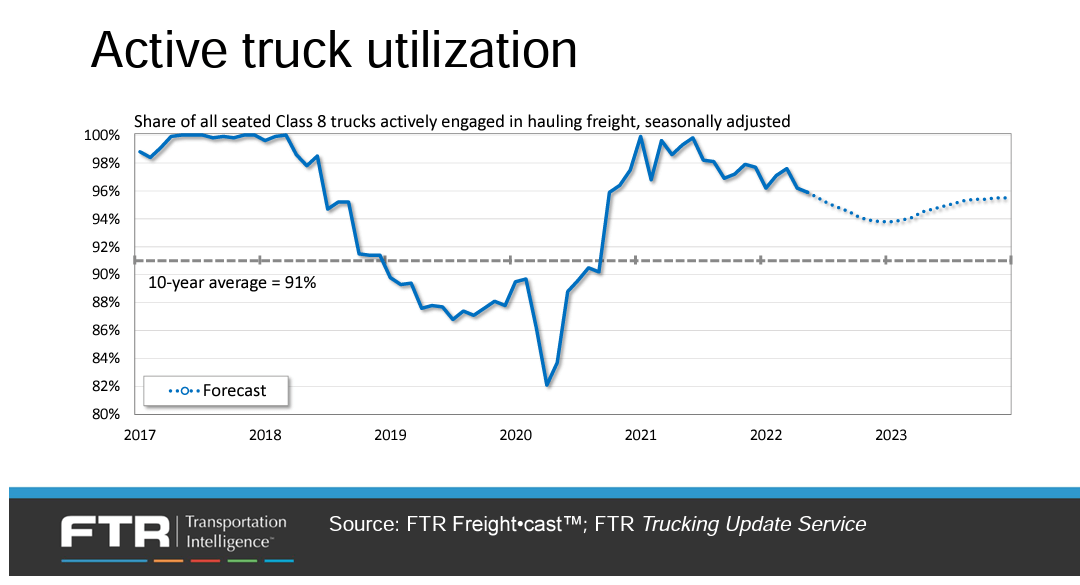
FTR’s forecast for truck utilization — the share of seated trucks actively engaged in freight hauling — is significantly weaker than last month due to accelerated payroll job growth and productivity gains. Previously, it was expected to remain close to but below 97% through 2023, but it is now estimated at about 96% and should bottom out at around 94% by year-end.
The outlook for freight demand continues to be muddied by supply chain and supply-side constraints. Inflationary pressures and a seemingly imminent recession have many thinking we would see a significant decline in freight demand. This has held true in the spot market, but overall freight volumes have remained relatively stable.
Global trade is a strong indicator of future freight demand as imported goods make up a significant portion of domestic freight demand. In June, Chinese exports were up nearly 18% from a year ago, beating forecasts of about 12% coming into the month. Exports to the U.S. were up more than 19% YTD compared to last year; that’s up from about 16% YTD in May.
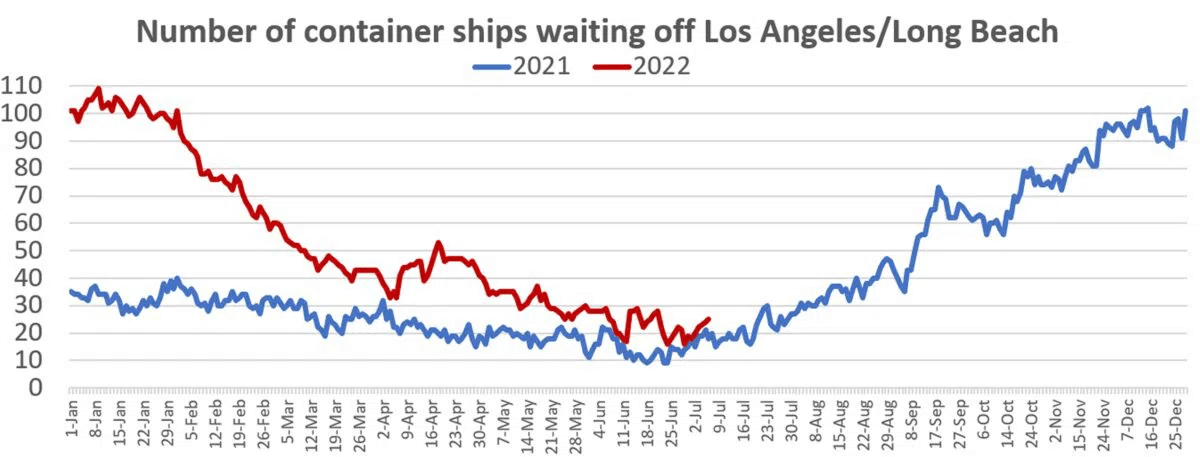
There are currently 125 ships waiting offshore at North American ports as of July 8th. This is down 16% from 150 in January, but up 36% from 92 a month ago. The start of Q3 last year was when port congestion really accelerated, and early indications point to the same trend happening this year. We have observed backlogs worsening at the East and Gulf Coast ports. Wait times for berth at Savannah and NY/NJ are 10-12 and 20 days, respectively. The threat of a strike at the ports in Southern California presents a serious downside risk to demand and has contributed to volume shifting to the East Coast as shippers look to avoid the potential shutdowns.
Downstream rail yard congestion is also contributing to port backups. Containers are stacked up high at rail terminals in Chicago, Memphis and Dallas as they have effectively run out of room for additional containers. This rail congestion is leading to service delays and ultimately forcing many shippers to avoid rail altogether.
Transloading freight to dry vans from international containers as they come off ships has already driven an increase in over-the-road demand as shipping lines look to keep their international containers close to the port. However, now the challenges with domestic intermodal shipping could lead to an even bigger overflow of freight from rail to over-the-road. For this reason, we believe markets close to ports or major rail yards could continue to see capacity constraints and poor utilization of equipment due to longer dwell times with intermodal services. Demand trends may look very different depending on the region in question for the remainder of the year as the congestion continues to push our port and intermodal infrastructure to the brink.
As supply chain and labor challenges ease, the manufacturing and industrial production backlog represents the potential for continued growth in related freight demand. Industrial production in May was up just 0.2% from April and is now up 5.8% year-over-year.
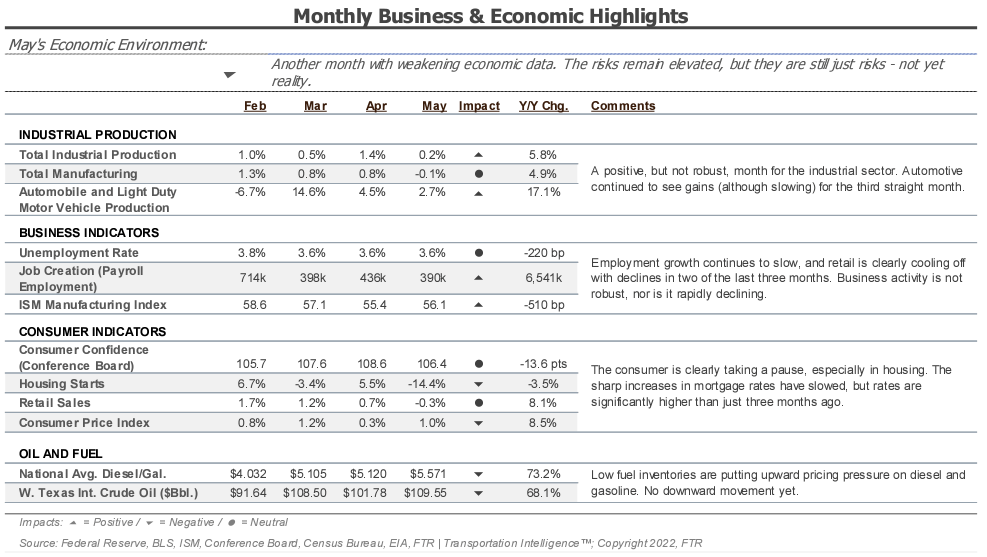
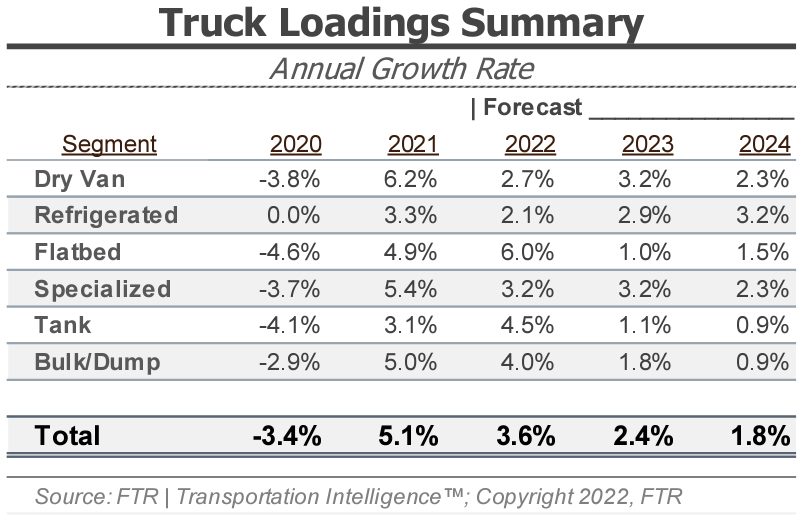
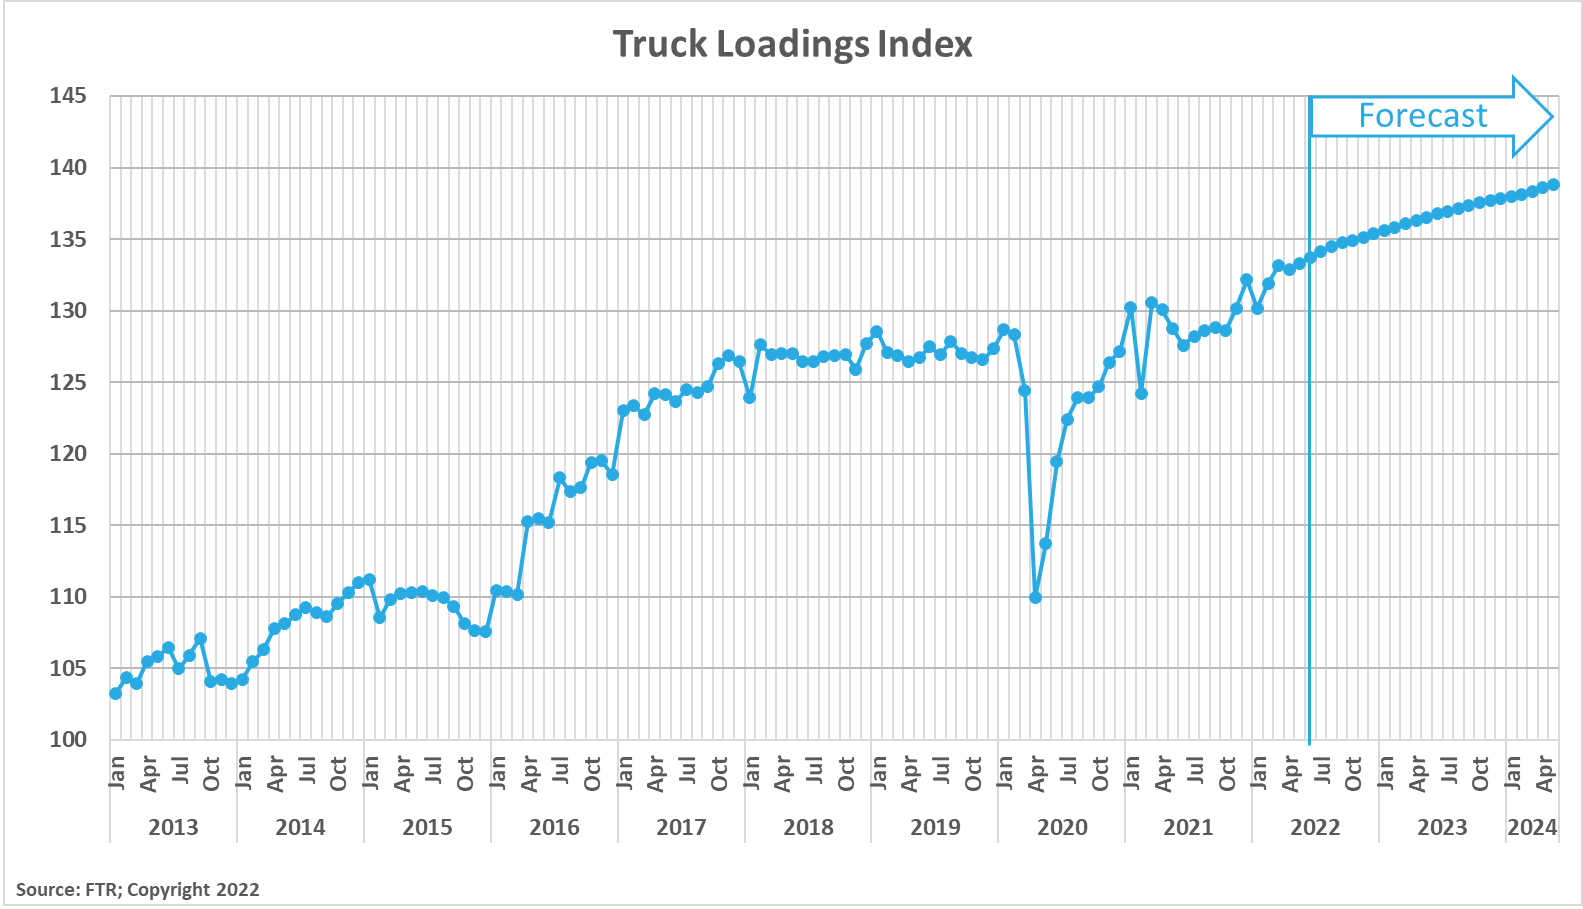
FTR’s latest truck loadings forecast is down from the previous, with revisions in construction and automotive loadings being principal factors. Last month’s 4.2% truck loading growth forecast for 2022 is now down to 3.6%. The dry van and flatbed forecasts fell the most, with dry van declining from 3.5% growth last month to 2.7% growth as of this writing, and flatbed loadings down from 7.4% last month to 6.0% today. Despite the softer outlook, all segments are expected to see volume growth through at least 2024.
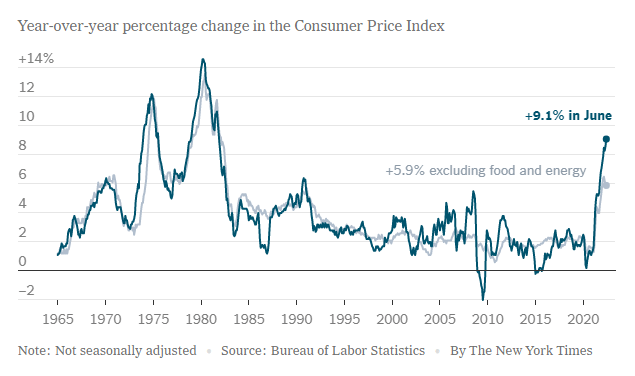
CPI data released in early July shows inflation remained highly elevated in June. Rising energy and food costs led the way as prices came in at 9.1% above the prior year (5.9% when excluding food and energy).
Consumer spending trends, particularly on services, have lost momentum faster than experts expected, driven by inflation and tightening financial conditions stemming from interest rate hikes in June. Following the news of continued price increases, interest rates are expected to rise again later in July, likely leading to further slowing growth in consumer spending in the months ahead.