
Significant events over the last month include the CVSA Roadcheck, continued rising diesel costs and the start of the summer peak season.
The CVSA Roadcheck exposed some of the challenges carriers are facing. Parts shortages have impacted their ability to perform routine vehicle maintenance. Many who have been running with known violations opted to sit out the week to avoid being fined or taken off the road.
Shippers also deviated from normal trends, holding loads until the week after road checks to ensure greater access to capacity and mitigate cost volatility. This event certainly sparked some spot market activity and short-term capacity displacements but ultimately had a minimal long-term impact on the market. Contract tender rejections moved less than 0.5% in the week.
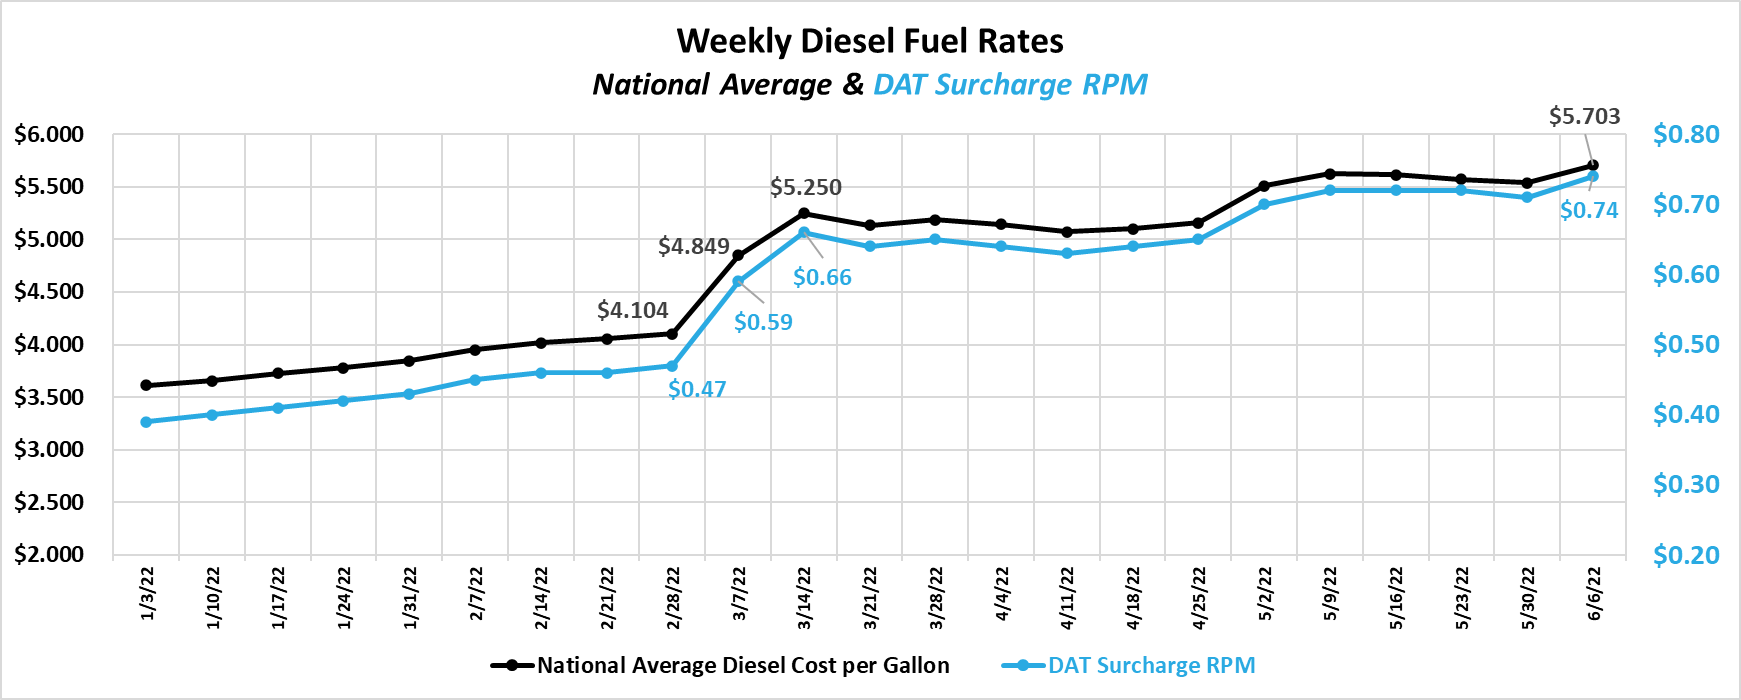
Diesel costs continue to set records, reaching new heights in early June. The national cost per gallon average as of June 6th was $5.703, a $1.60 per gallon increase since late February.
Referencing the DAT’s methodology for calculating fuel surcharge rates, the change has now amounted to $0.27 per mile since the initial rise associated with Russia’s invasion of Ukraine. In the May update, we outlined how the rise in fuel recovery pay on contract freight has led to improved contract compliance and deflationary conditions in the spot market. As fuel costs continue to rise, we believe we will continue to see high contract compliance levels, further starving the spot market of overflow opportunities.
The freight market is highly cyclical from year to year and season to season within any given year. Throughout 2020 and 2021, conditions often deviated from ‘normal’ seasonal trends. Over the past month, however, we have seen a relatively normal pattern for early in the summer peak season.
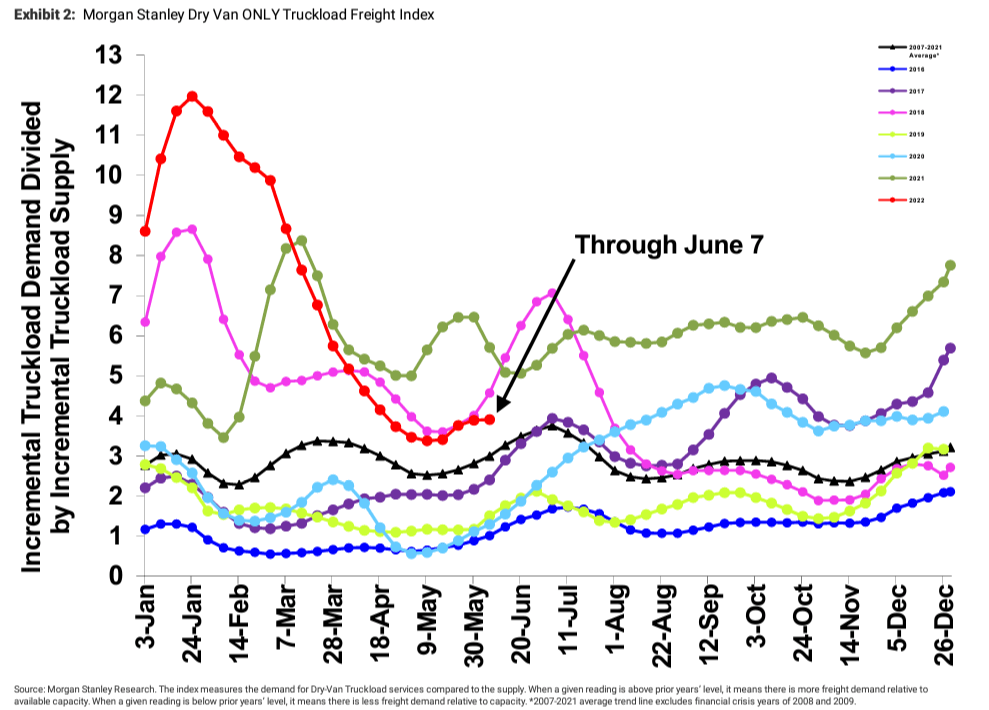
Historically, the period from mid-May through July 4th sees demand surges drive tighter freight market conditions. The black line with triangle markers on the Morgan Stanley Dry Van Freight Index chart provides a great view of the seasonal directional trends we typically see based on data dating back to 2007. This year we saw an uptick in spot market demand without any major impact to contract compliance, which is evidence that recent upward rate pressure is likely related to seasonal trends, rather than a shift in the fundamentals of the larger market.
We expect deflationary conditions to resume seasonal demand eases after Independence Day. Barring any unforeseen black swan capacity events, normal seasonal trends will likely continue for the remainder of the year.
DAT heatmaps further support the view of normal seasonal trends in early June, illustrating tightness concentrated in the Southeast, along the Southern border and in Central and Southern California. These regions are most often associated with produce season and other warm weather-related products.


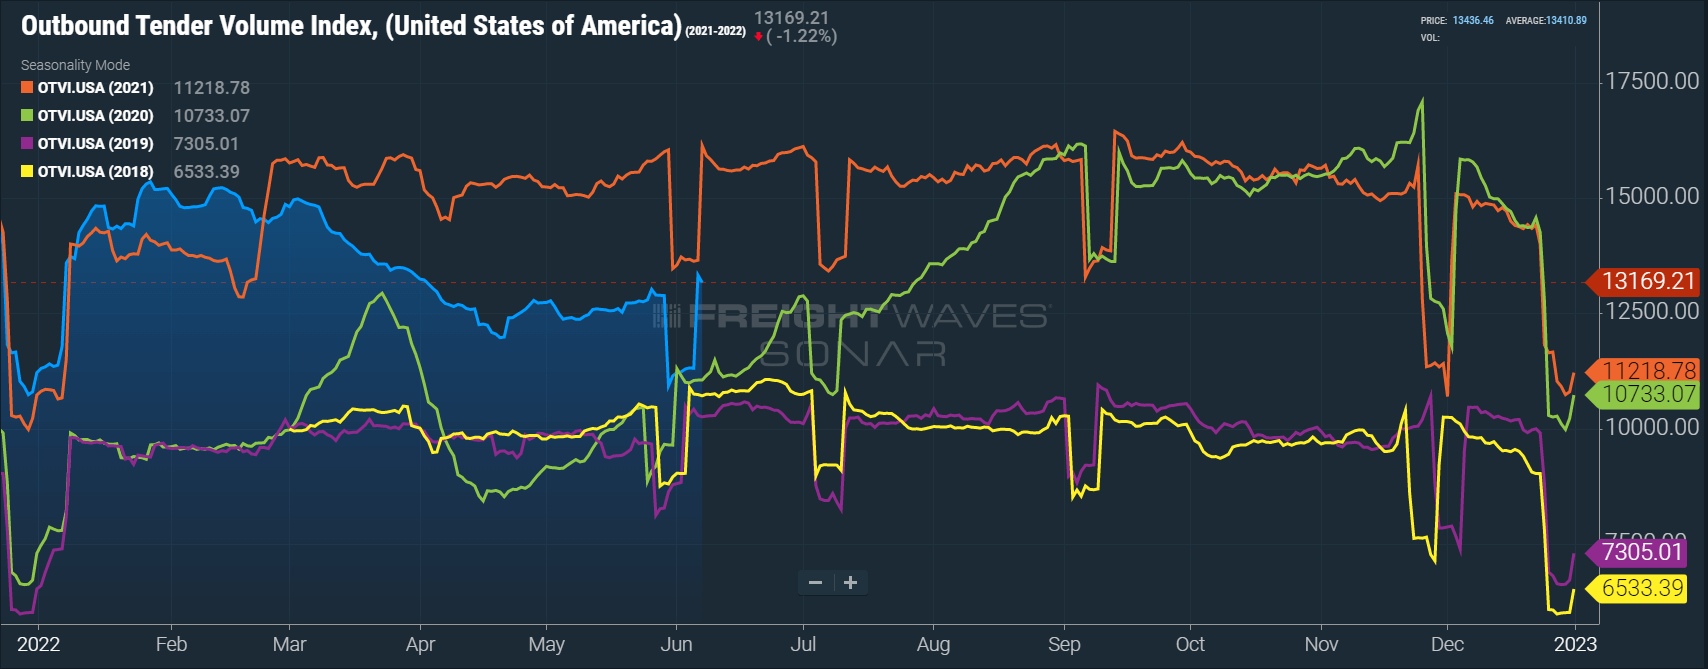
The FreightWaves SONAR Outbound Tender Volume Index (OTVI), which measures contract freight volumes across all modes, was down 18.4% year-over-year in early June. Of course, it is important to note that OTVI includes both accepted and rejected load tenders, so we must discount the index by the corresponding Outbound Tender Rejection Index (OTRI) to uncover the true measure of accepted tender volumes. The downward tender volume trend drops to just 2.1% below last year’s all-time high when applying this method to year-over-year OTVI values.
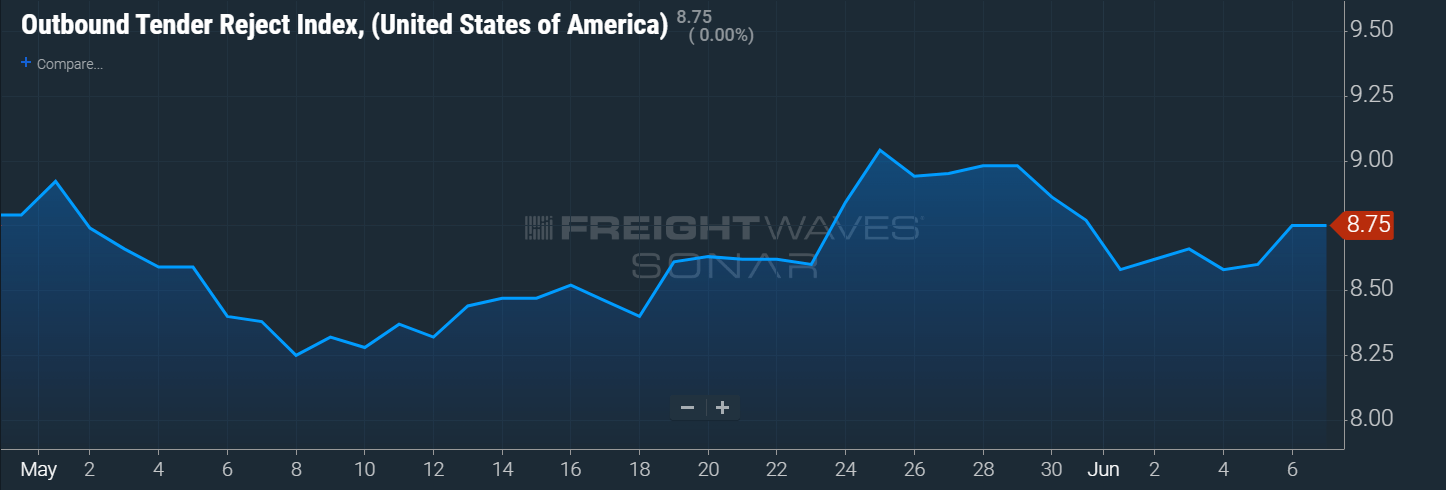
Tender rejections are down 63%, from 23.9% a year ago to 8.75% as of Tuesday, June 7th, which helps explain the accepted tender volume increase despite the significant decline in total tender volumes.
As for specific equipment types, the dry van tender volume index was down 19.1%, and the reefer tender volume index was down by 32.9%. This equates to a 2.1% year-over-year decrease and a 0.9% decrease in actual volumes for the two modes. As of June 7th, dry van tender rejections were down nearly 65% year-over-year. For reefer equipment, that number was nearly 77%.
DAT data indicates that year-over-year spot volumes were down by 12.7% in May; this is an improvement from the 20% year-over-year decline in April, but the second straight month of yearly declines indicates that spot demand has pulled back from historical highs. The 14% month-over-month increase is in line with normal seasonal trends and offers assurance that freight volumes are beginning to normalize towards pre-pandemic levels.
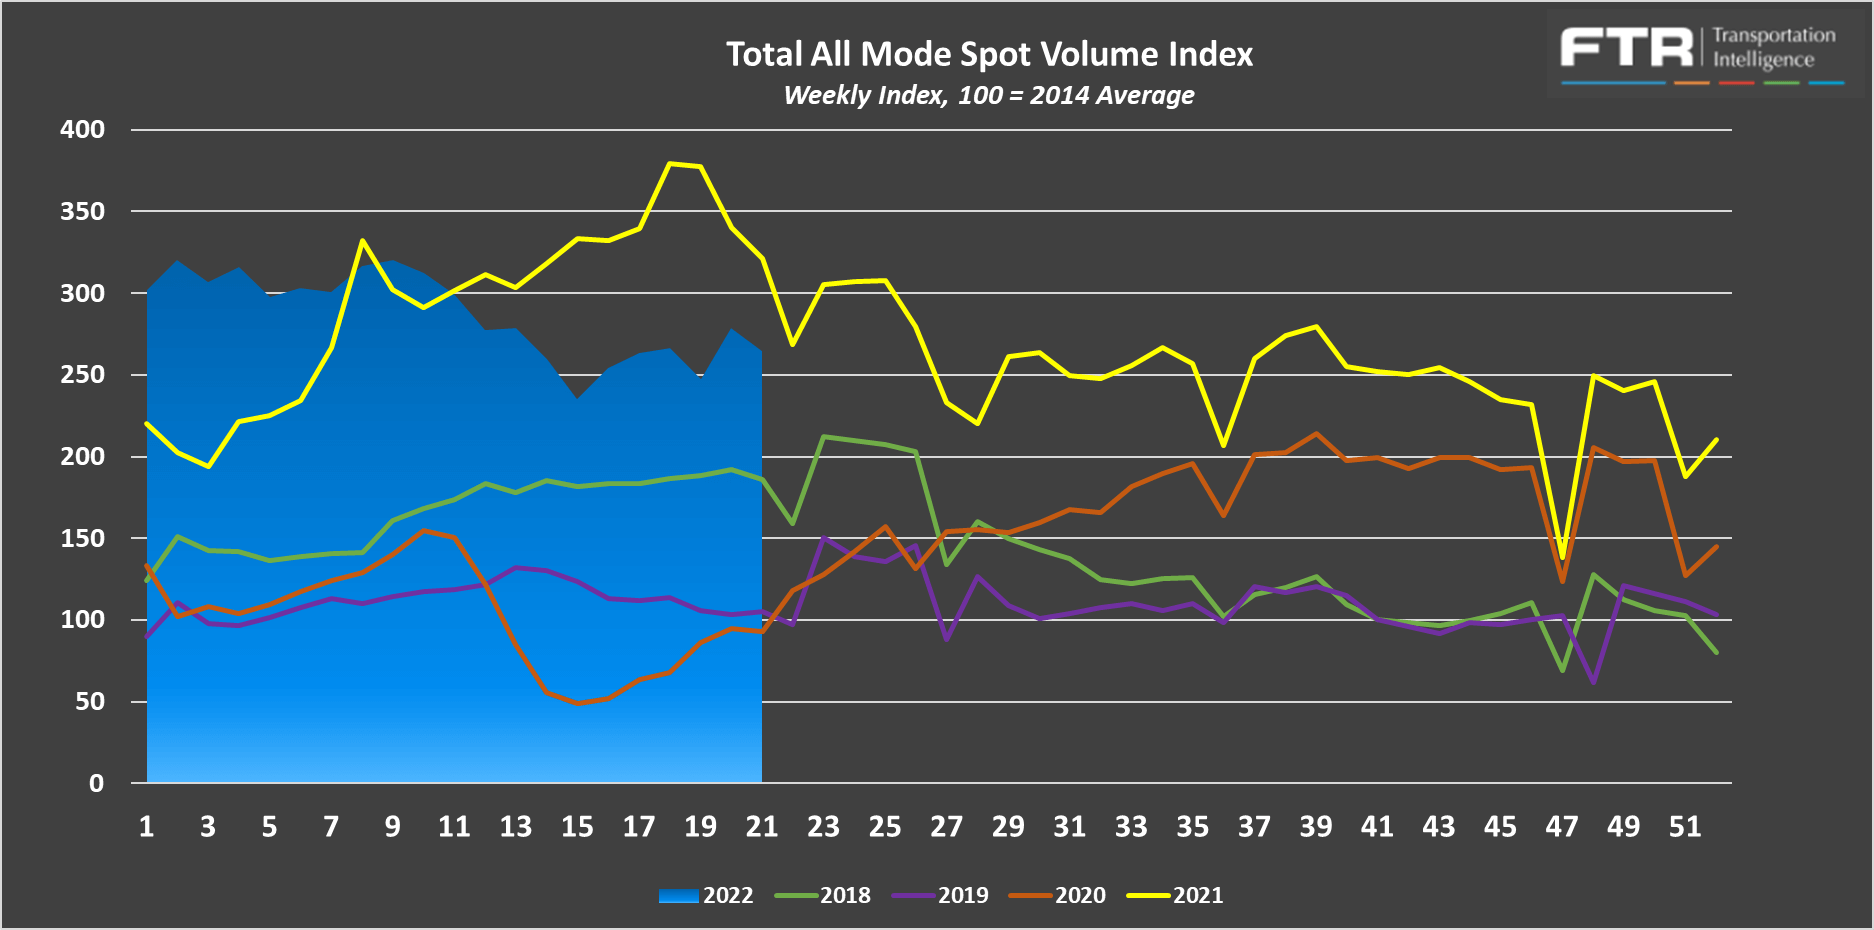
FTR and Truckstop’s Total All Mode Spot Volume Index helps illustrate that even though spot volumes are down from last year, they remain above previous historical highs. The All Mode index is now down 17.6% year-over-year but is up 152% from 2019.
The Sonar Outbound Tender Reject Index (OTRI) measures the rate at which carriers reject the freight they are contractually required to take. The current rate is 8.76% in early June, roughly the same as in early May; this stability after two months of rapid declines sheds some light on what to expect moving forward.
Seasonal demand surges and the gap between spot and contract rates acted as opposing forces throughout the month, with increased demand further slowing the decline driven by elevated contract rates. Assuming contract rates remain well above spot rates, we expect further marketing softening following Independence Day when the summer peak season winds down, approaching equilibrium levels of 5% or less. We saw this through much of 2019, the softest market in recent memory.
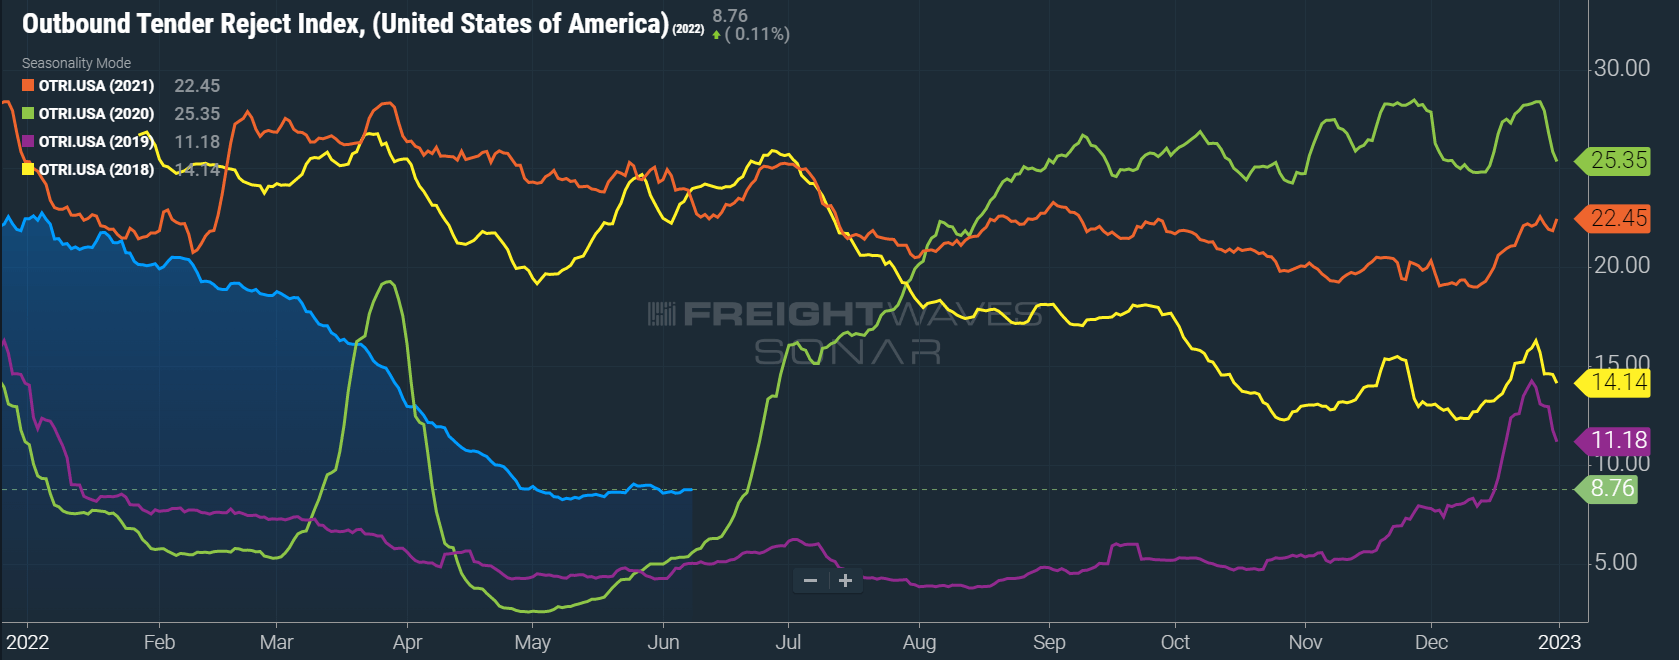
OTRI has declined rapidly throughout March and April, illustrating the immediate impact to contract routing guide compliance as fuel prices surged.
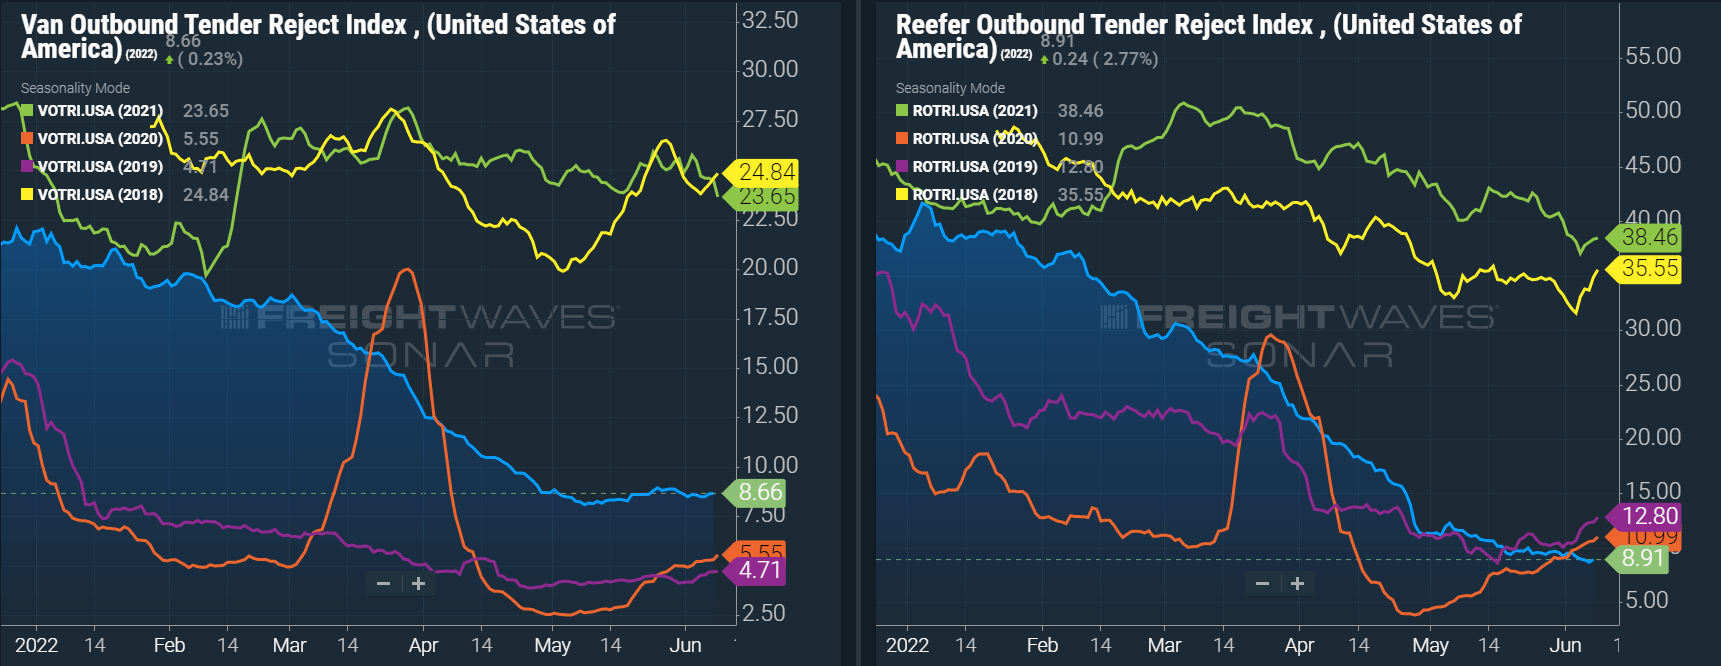
Dry van and Reefer tender rejections followed a similar trend to the all mode index, falling rapidly in alignment with the surge in diesel fuel prices.
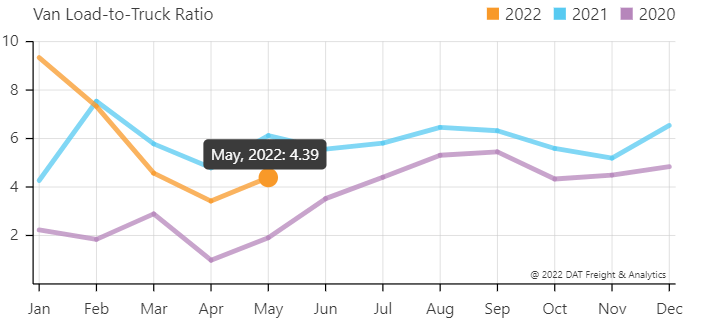
The DAT Load to Truck Ratio measures the total number of loads compared to the total number of trucks posted on their load board. In May, the Dry Van Load to Truck Ratio increased to 4.39, up 28% month-over-month but down 28% year-over-year.
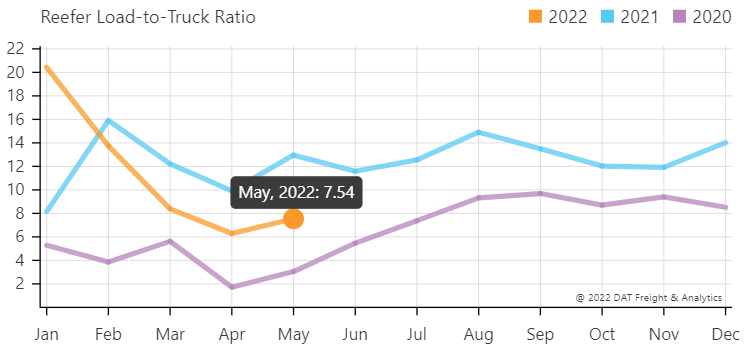
The Reefer Load to Truck Ratio increased to 7.54, up 20% month-over-month but down 42% year-over-year.
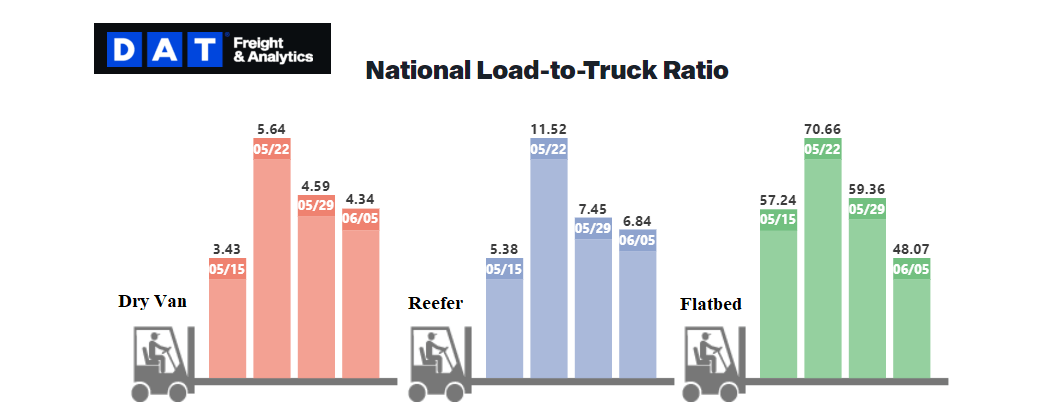
Weekly load to truck ratios tightened slightly in alignment with the CVSA Roadcheck but have trended down in the weeks following. Normal seasonality would point to tightening as summer peak season hits its stride in the weeks ahead.
Last month, conditions trended in line with DAT and Freightwaves SONAR data, easing rapidly through March and April after a more stable downward trend throughout February. The black line with triangle markers on the chart provides a great view of what directional trends would be in line with normal seasonality based on historical data dating back to 2007. This data would lead us to believe that conditions will tighten in mid-May. Given that Memorial Day through July 4th is typically peak season for the freight market, we expect the trends we see during this time will provide a relatively accurate forecast for how the rest of the year will unfold.

The unprecedented spot rate declines from January to May appear to be leveling off in early June for dry van and refrigerated equipment. Easing conditions in the spot market continued into early May, but in the back half of the month and early June, disruptions from the CVSA Roadcheck and summer peak season put enough upward pressure on rates to cause this shift.
Flatbed rates remain elevated as construction season continues, particularly in warmer regions. Normal seasonality would indicate that we should see ongoing upward pressure on van and reefer spot rates through early July. However, recent trends continue to signal that upward rate pressure may not be as significant this year.
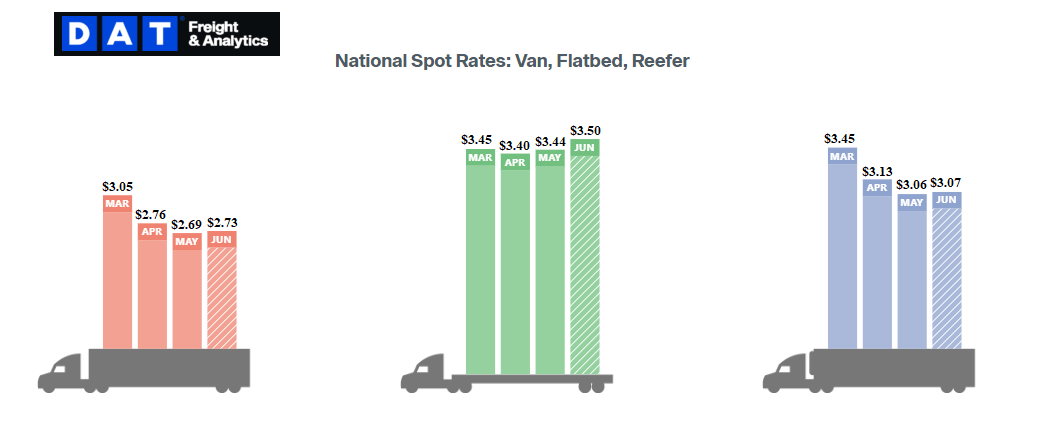
 Spot rates have trended down at a rapid pace and are on pace to finish the month down year-over-year for the first time since 2020.
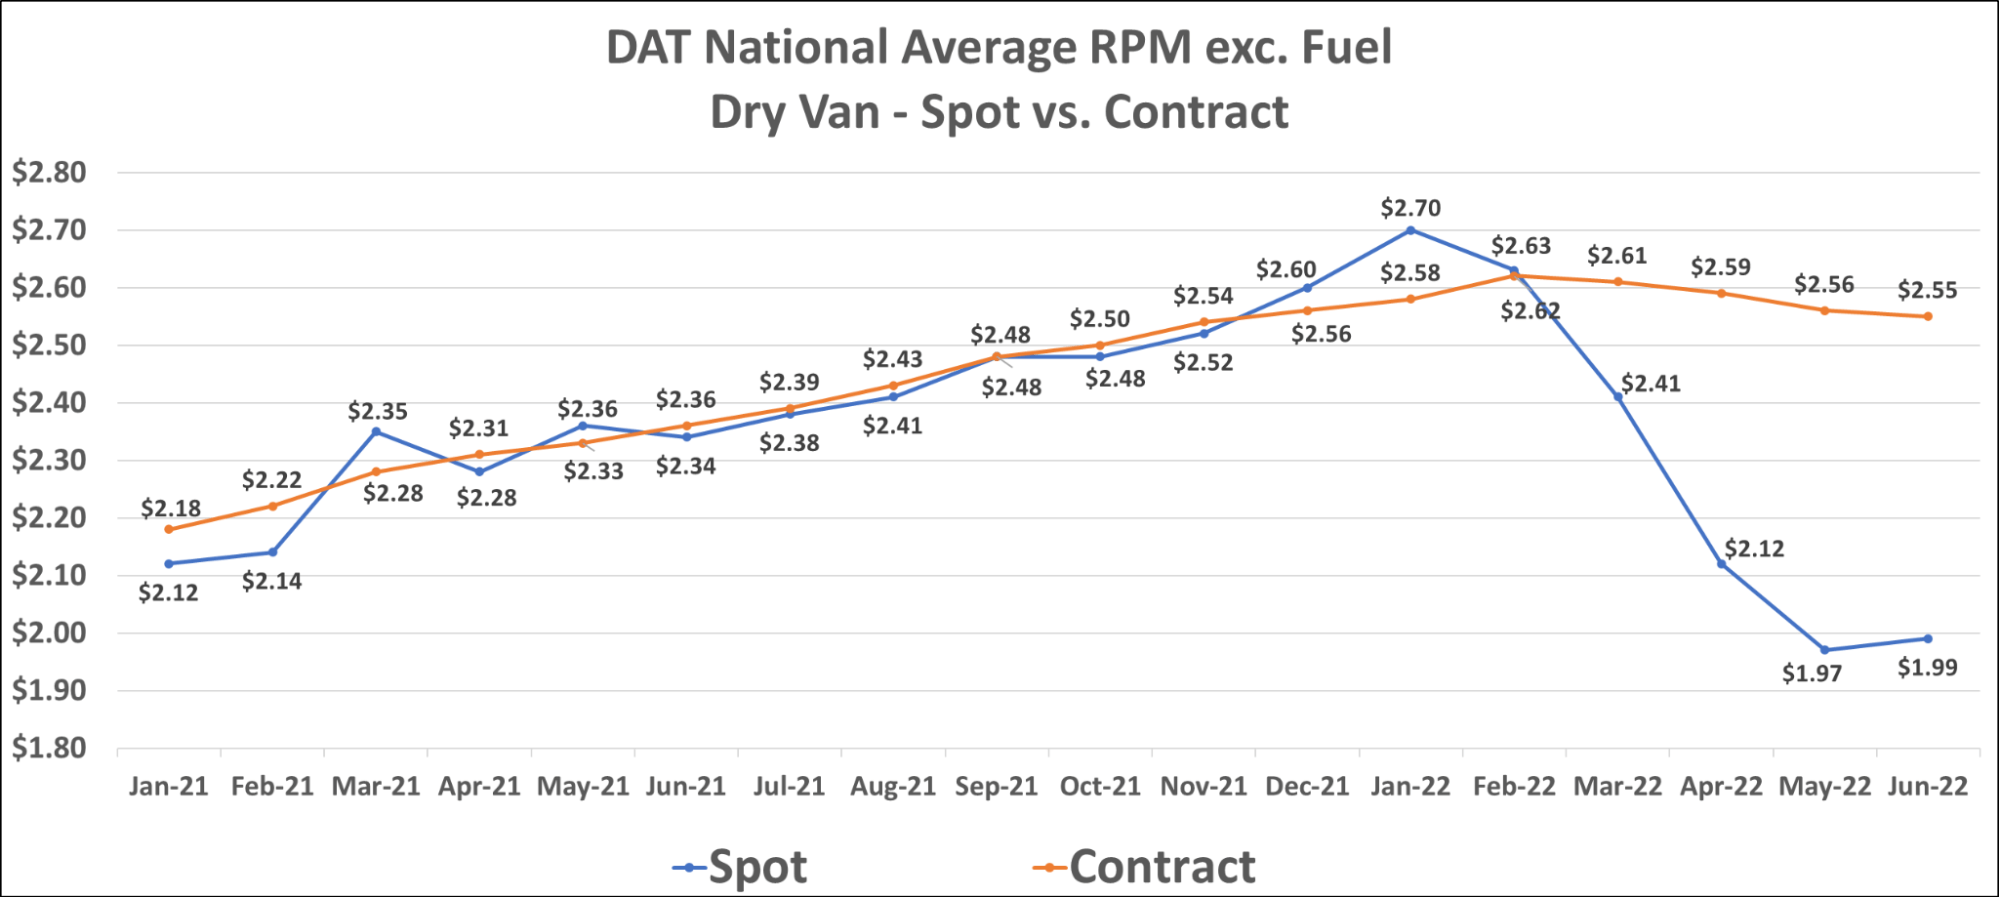
Dry van contract rates have continued to slide in early June as shippers move quickly to take advantage of updated pricing amid the recent pullback in spot rates. The current dry van contract rate is $2.55 per mile, excluding fuel.
The unfortunate situation for shippers is that rates, including fuel, remain flat, meaning any benefit they see from easing conditions is offset by rising fuel costs. Shippers that established their transportation budget in Q4 likely only accounted for around $0.40 per mile, so with average fuel surcharges hovering $0.70+, transportation costs remain a pain point.
Historically, when spot rates fall quickly amid deflationary market conditions, it takes a long time for contract rates to follow. In this market cycle, van contract rates have fallen by $0.08 in just four months; last market cycle, it took eight months for contract rates to fall at the same rate, with a peak in mid-2018.
Over the past two years, many shippers who wanted contractual coverage hosted pricing exercises and RFPs more frequently to maintain routing guides as rates climbed monthly. This practice of more frequent pricing is a primary driver of rates falling more quickly now. The gap between spot and contract rates is a significant contributor as well. With the national spot rate average sitting $0.55+ below the national average contract rate, shippers who do not make adjustments are leaving money on the table.
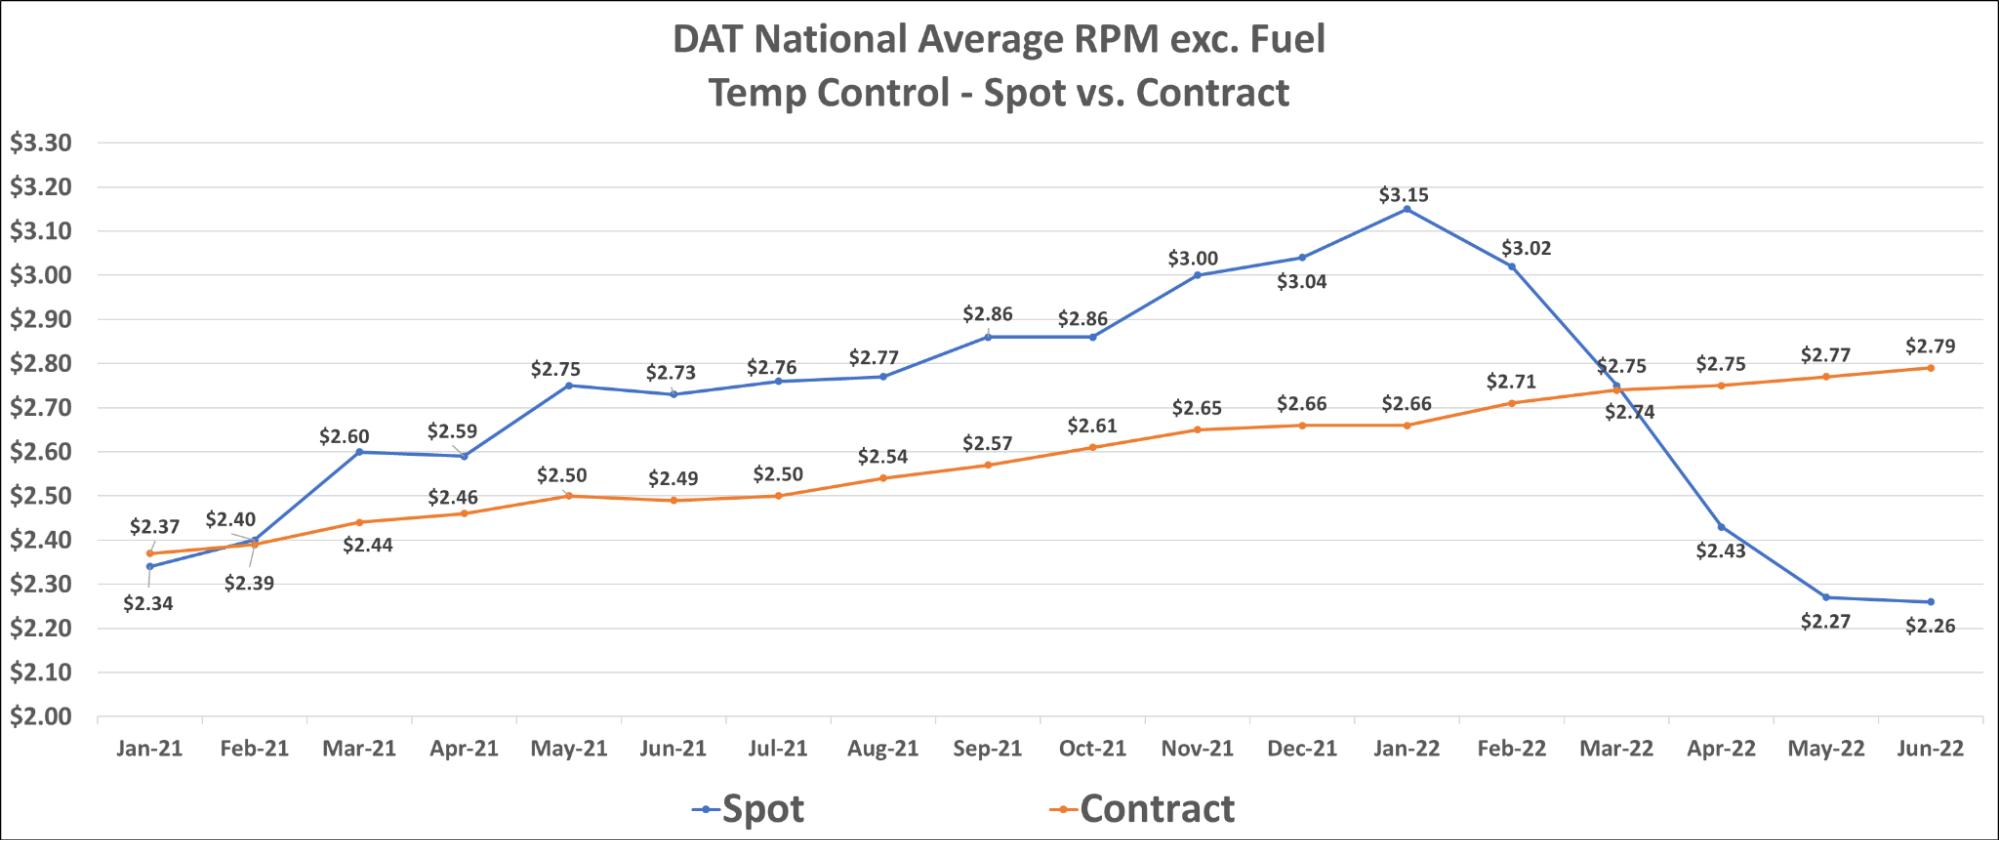
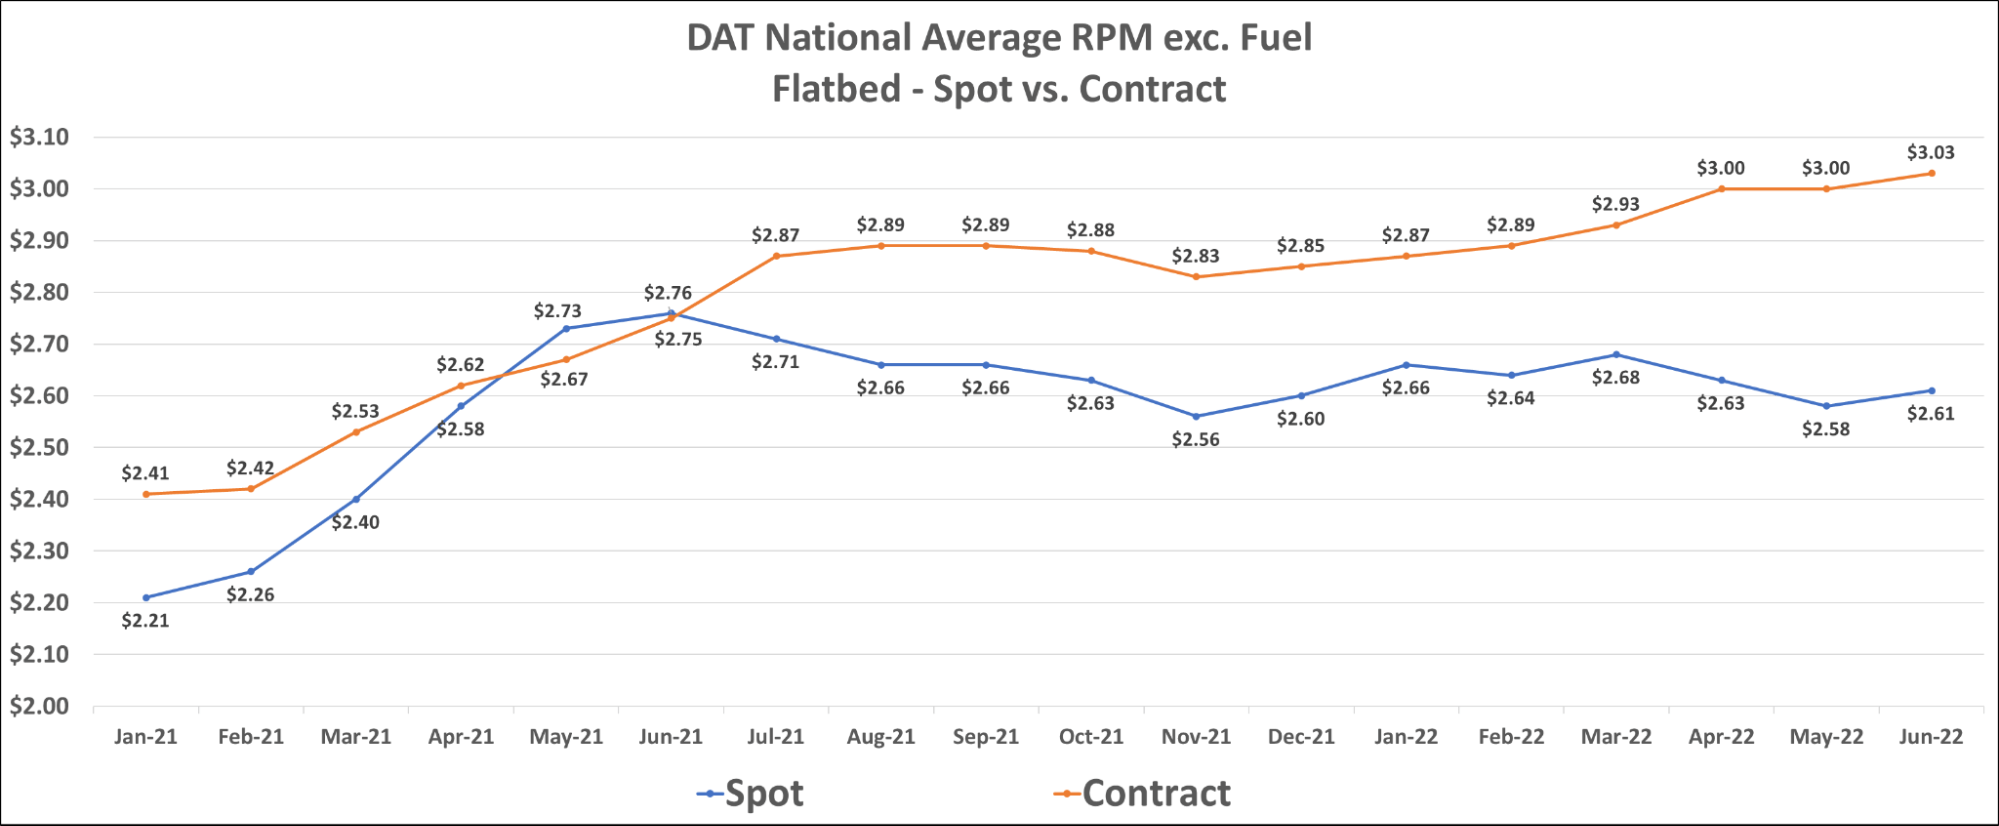
Despite significant declines in reefer spot rates throughout the first half of the year, reefer contract rates have continued to climb and currently sit at $2.79 per mile, excluding fuel. The flatbed market is seeing continued contract rate increases year-to-date; rates are now sitting at $3.03 per mile, excluding fuel.
Carriers have faced an abundance of challenges over the past two years. In addition to ongoing issues with driver retention, equipment and parts shortages, persistently high fuel costs have been the final straw for many. Carriers with fuel surcharge-protected contract freight have mitigated much of the impact, but those with high exposure to the spot market are seeing the profitable opportunities they’ve grown used to over the past two years dry up.
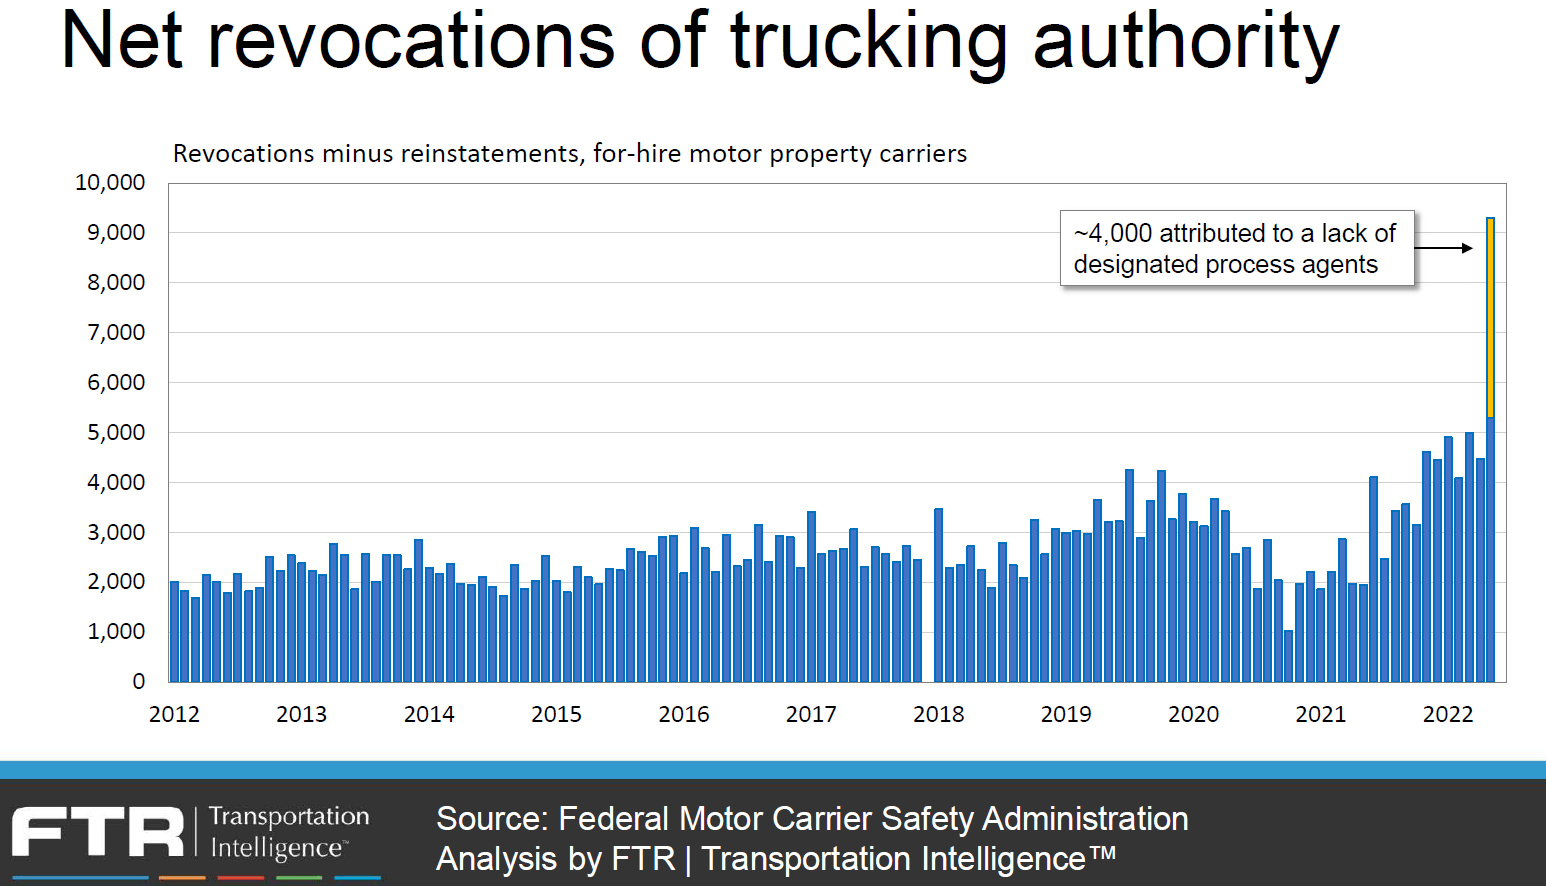
The carriers that have been most impacted by the recent market shift are the owner-operators and smaller fleets, many of whom just opened up shop during the past two years. According to FTR’s analysis of FMCSA data, since March 2020, there was a nearly 40% increase in capacity with carriers operating a fleet of 1-5 trucks. As the spot market opportunities they counted on have disappeared, these carriers have had to rethink their approach or close altogether. Net revocations of trucking authority, as calculated by FTR, surged to an all-time high in May. Some of this is equipment and drivers shifting to company jobs, but as spot demand continues to fall, we will see more carriers exit the market.
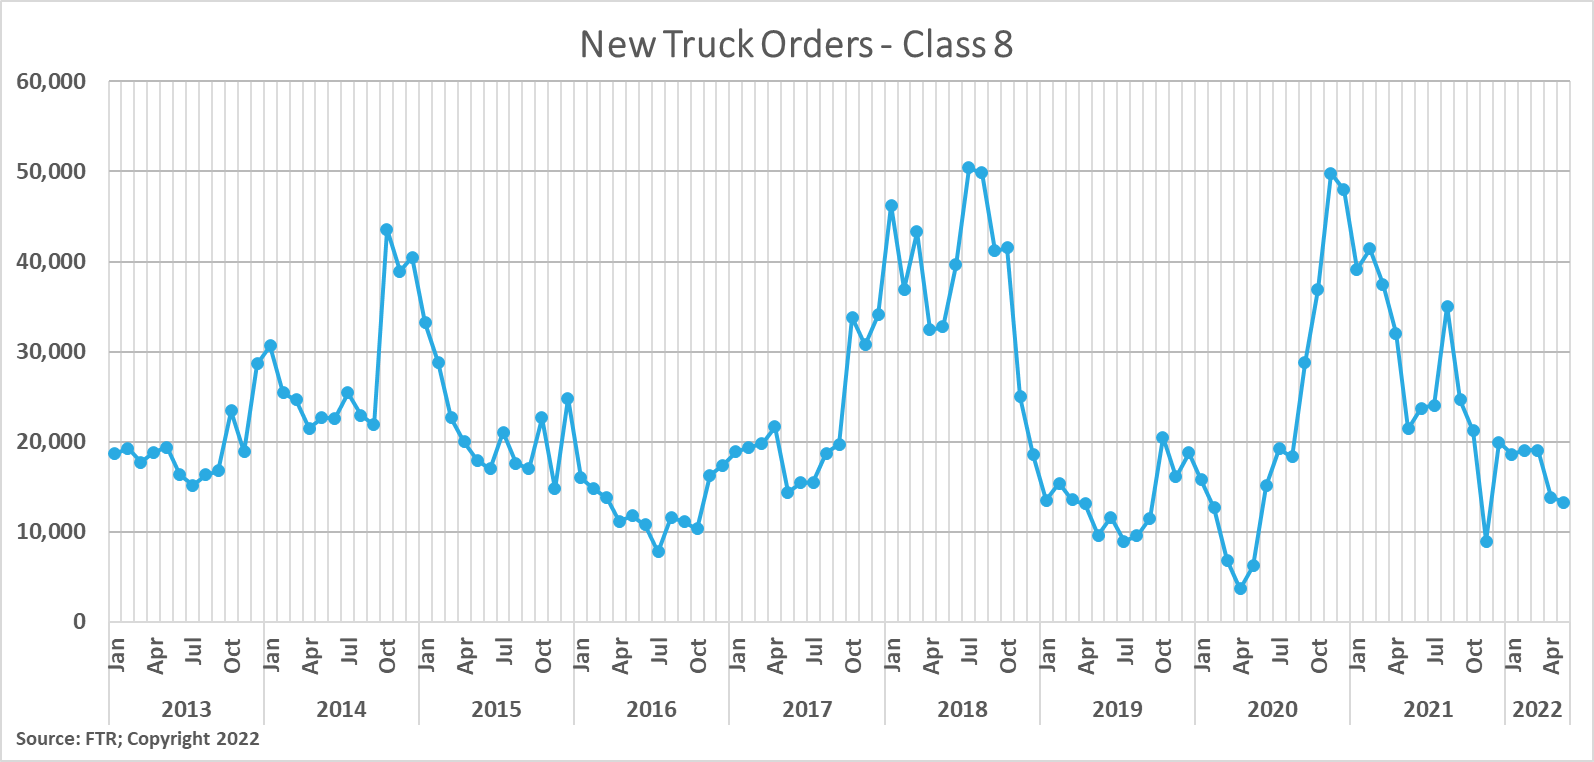
We have observed consecutive months of easing truck orders, and as capacity moves from the spot market to larger carriers in the form of leased assets, demand for new equipment will likely continue to wane. Additional equipment is still in demand, and production delays have not kept equipment manufacturers from making up ground on their backlogs. The average time from order to delivery actually increased slightly from 9.8 months in March to 10.5 months in April.
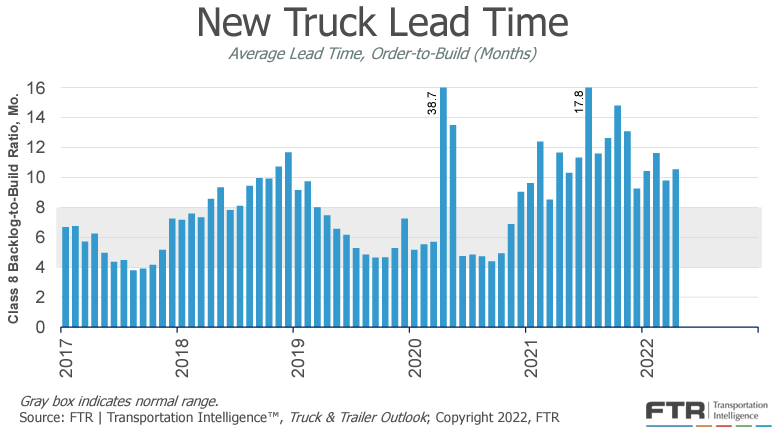 New truck lead time increased from 9.8 months in March to 10.5 months in April as production delays continued, despite pullbacks in new orders.
New trailer production levels fell by 5% in April, up from 8% growth in March, which is a sign that trailer OEM’s are also constrained due to global challenges. We expect this trend to last at least a few more months, even if trailer demand were to ease.
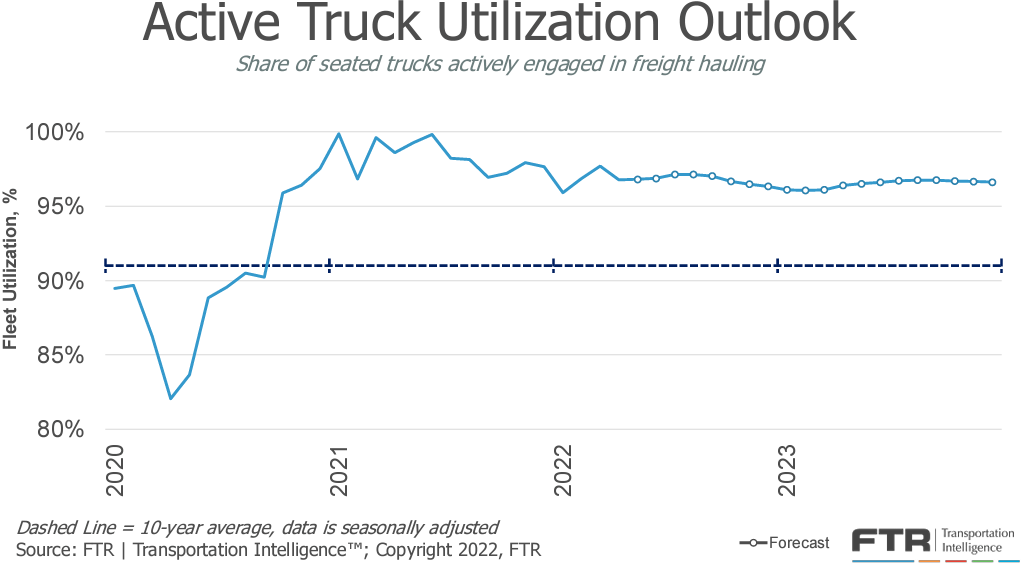
FTR’s forecast for truck utilization — the share of seated trucks actively engaged in freight hauling — is slightly weaker than last month. We expect it will remain close to but below 97% through 2023. Many risks to the downside remain.
The outlook for freight demand remains dominated by downside risks. American consumers are facing significant inflationary pressures, particularly on food and energy-related spending. Global conflict also wages on, fueling uncertainty as to when relief from recent inflationary pressure is coming. Lockdowns in China have left many guessing about what the future demand trends may look like. Some are optimistic that a wave of imports will begin to make their way to the U.S. as lockdowns are lifted. Still, recent headlines about major retailers reporting overstocked inventories are signs that the wave may never come.
That said, experts have not yet seen a meaningful impact on imports from the lockdowns in China. Their ports are open and freight is flowing. Inland factories have not experienced lockdowns and are still producing goods. Many shipments are being rerouted to other ports to avoid lockdowns en route to the U.S. It seems China is maintaining export levels and should be able to meet peak season demand once lockdowns are lifted. The big question is whether or not brands will cancel orders in light of current overstock issues. Last year, when retailers were short on inventory and experiencing unprecedented demand, their solution was over-ordering to avoid supply chain constraints and prepare for future demand. Now with demand slowing, retailers have been left holding excess inventory.
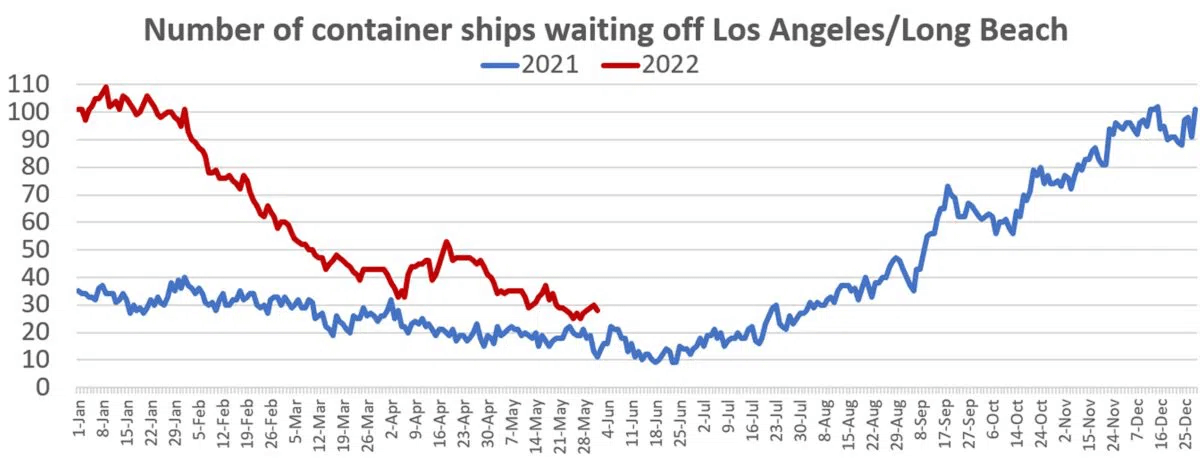
Shortages still exist, though, and consumer demand has not completely deteriorated, meaning we still expect to see healthy volumes above pre-pandemic levels. We believe the recent trends indicate a pullback from last year’s record-setting levels and are possibly moving towards historical numbers. In southern California, even more ships are waiting offshore than a year ago. Despite order cancellations, we expect to see imports pick up in July as back-to-school shopping, fall clothing and retail peak season goods all begin to hit the ports at the same time.
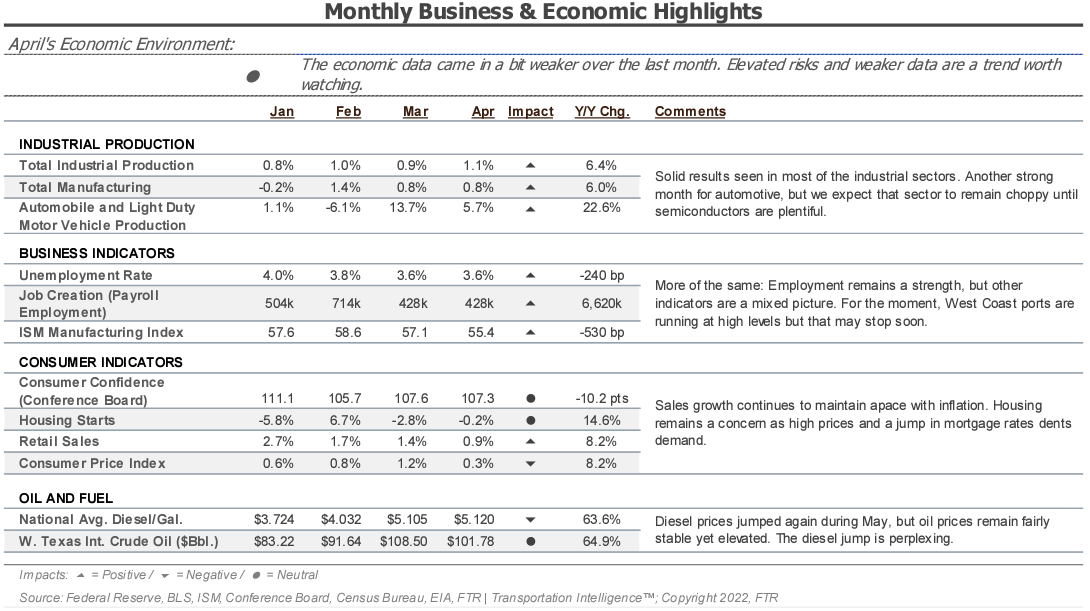
As supply chain and labor challenges ease, the manufacturing and industrial production backlog represents the potential for continued growth in related freight demand. However, the upside risks are slowly turning to the downside as economic uncertainty might mean decreased industrial and manufacturing demand. In April, however, industrial production continued to increase. The FTR reported a 1% increase in April, with a 3.9% gain in auto manufacturing driving a large portion of the overall growth.
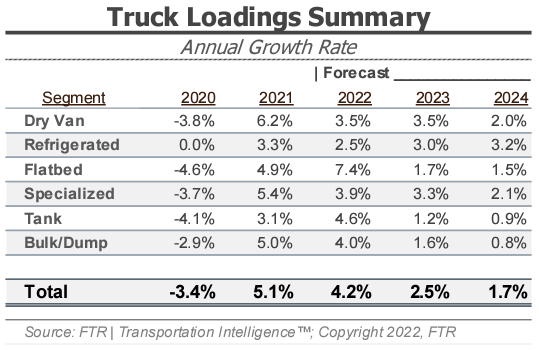
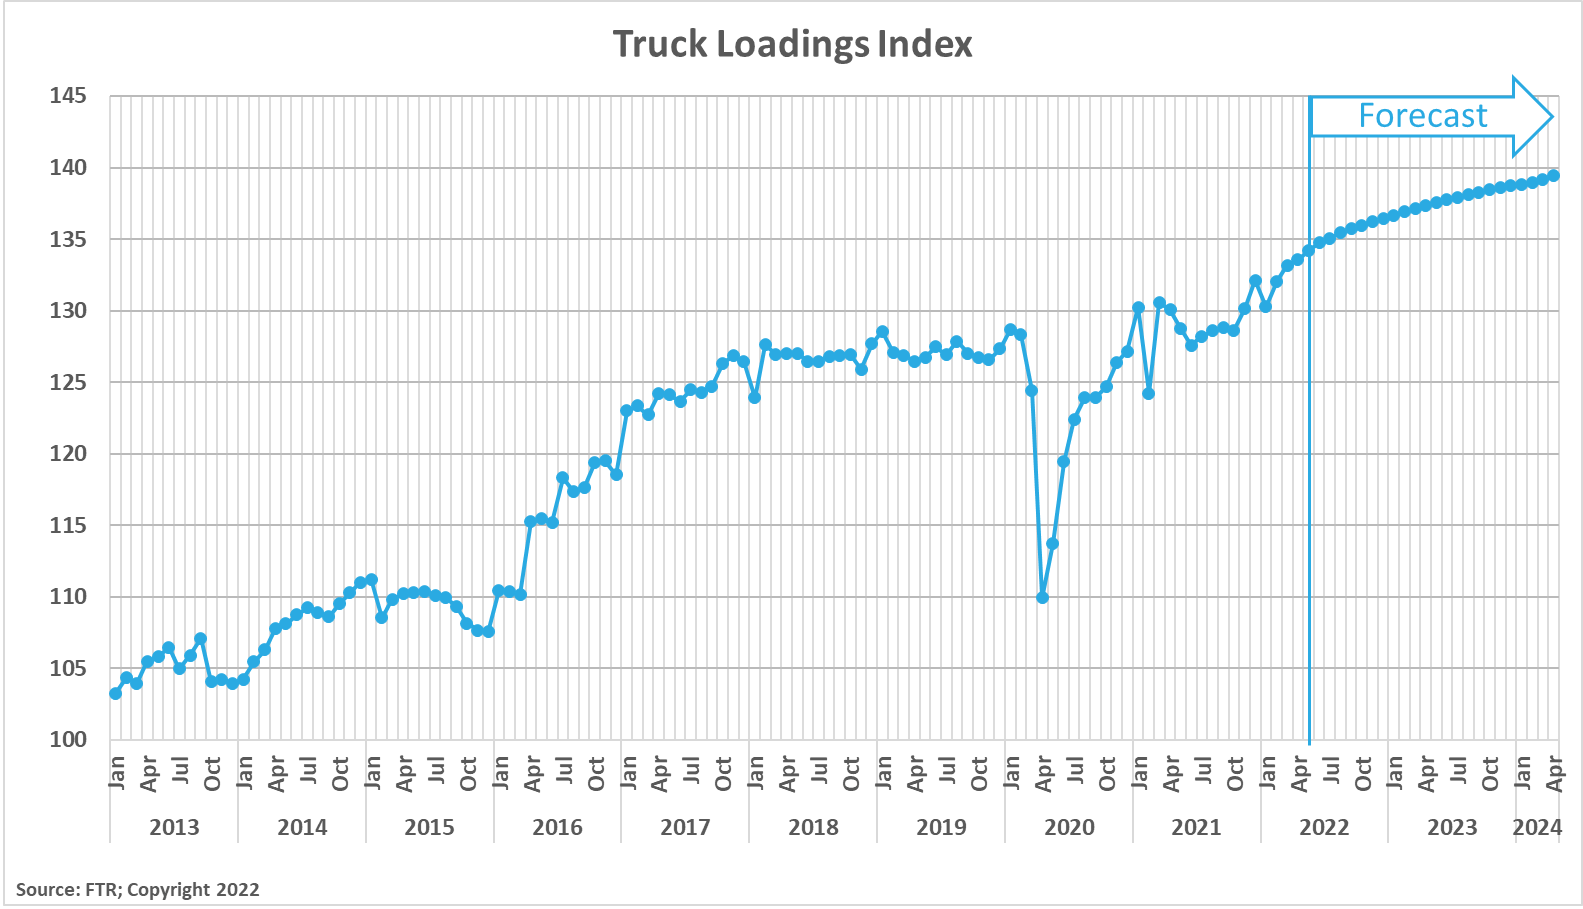
FTR’s latest truck loadings forecast is mostly unchanged, as gains in bulk aggregates and construction loadings offset weaker growth projections in other sectors. The 4.2% truck loading growth forecast held steady from the previous month and indicates growth for 2023. However, it fell from 3.0% to just 2.5% growth as downside risks pile up. It is also important to note that growth is still expected from 2022 through 2024, albeit at a slower rate. Time will tell if rising inflation and other downside risks to demand will impact the forecast. For now, though, all equipment segments should expect demand to remain strong for the foreseeable future.
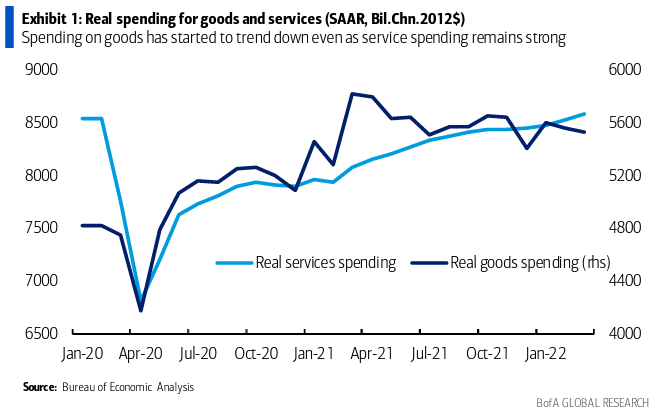
CPI data released in early June shows inflation remained highly elevated in May. Rising energy and food costs led the way as prices came in at 8.6% above a year earlier; 6.0% when excluding food and energy. This increase has forced consumers to make tough decisions. For example, Bank of America spending data illustrates buyers are still favoring services over goods. However, real goods spending remains high above pre-pandemic levels, so we don’t expect truckload demand to decline significantly.