
"*" indicates required fields
"*" indicates required fields
"*" indicates required fields

June 2021
The Arrive Monthly Market Update, created by Arrive Insights, is a report that analyzes data from multiple sources, including but not limited to FreightWaves SONAR, DAT, FTR Transportation Intelligence, Morgan Stanley Research, Bank of America Internal Data, Journal of Commerce, Stephens Research, National Retail Federation and FRED Economic Data from the past month as well as year-over-year.
We know that market data is vital to making real-time business decisions, and at Arrive Logistics, we are committed to giving you the data you need to better manage your freight.
(Click to scroll to section.)
Tender Volumes are representative of nationwide contract volumes and act as an indicator of Truckload Demand
Tender Rejectionsindicate the rate at which carriers reject loads they are contractually required to take and acts as an indicator of the balance between Truckload Supply and Demand
New Truck Orders is an indicator of the trucking industry’s health and carrier sentiment, as carriers typically invest in new trucks when demand and optimism are high.
Industrial Production measures the output of the industrial sector, including mining, manufacturing and utilities.
US Customs Maritime Import Shipments, China to the United States measures the total number of import shipments being cleared for entry to the U.S. from China.
Rate Spread measures the difference between the national average contract rate per mile and the national average spot rate per mile and is closely inversely correlated to movements in tender rejections and spot market volumes.
Weekly Jobless Claims are used as a barometer for the pace of layoffs in the general economy.
Unemployment Rate is the number of people who are unemployed that are actively seeking work.
"*" indicates required fields
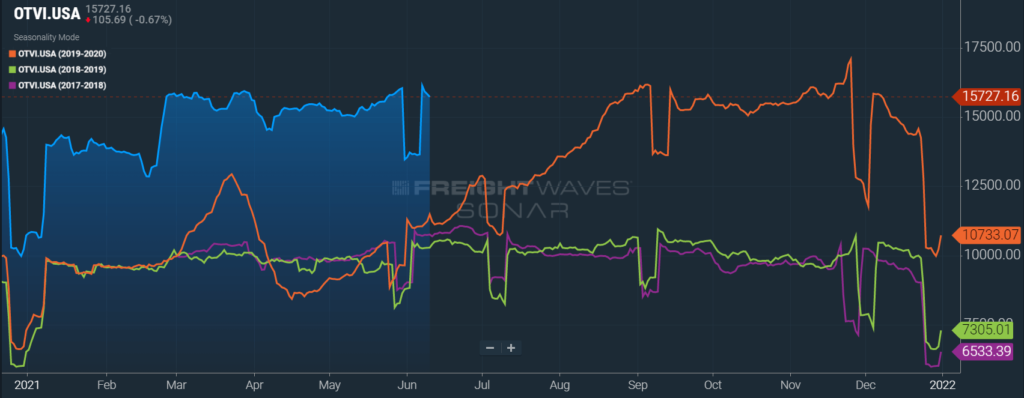
DAT reported that dry van spot load posts grew modestly in May, increasing by 3.4% month-over-month, but are up by 290% year-over-year when comparing volumes to the period of pandemic-related shutdowns in 2020. Week-over-week spot volume growth shows a decline of 18.5%, but this is due to there being one less business day than usual due to Memorial Day.

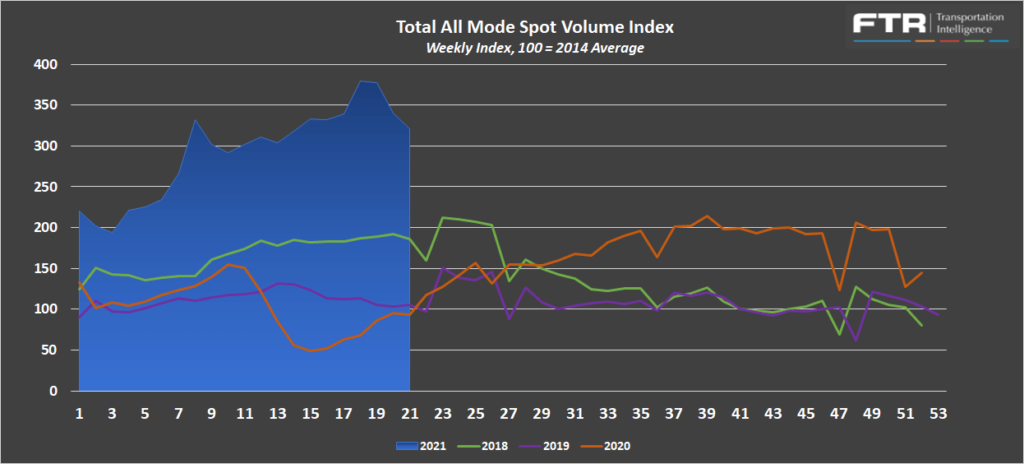
FTR and Truckstop’s Total All Mode Spot Volume Index is down 15.3% from the peak seen earlier in the month, indicating that overall spot activity has been on the decline in recent weeks. This trend has taken hold simultaneous to rising contract volumes, a reversal of the consistently increasing spot volumes we have seen throughout the year. Despite the recent declines, the index is up 245% year-over-year.
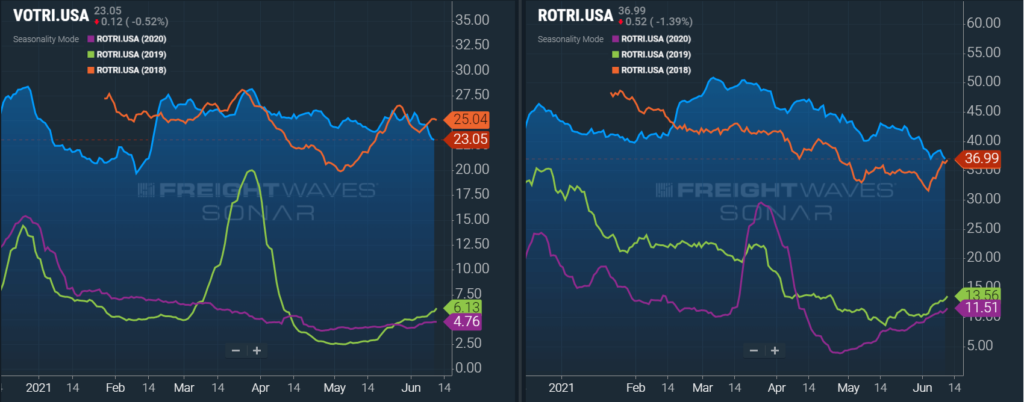
The Dry Van Spot Volume Index is down 16.6% from the high in early May and 170% year-over-year, while the Reefer Spot Volume Index is down 13.5% and up 226% over the same time periods.
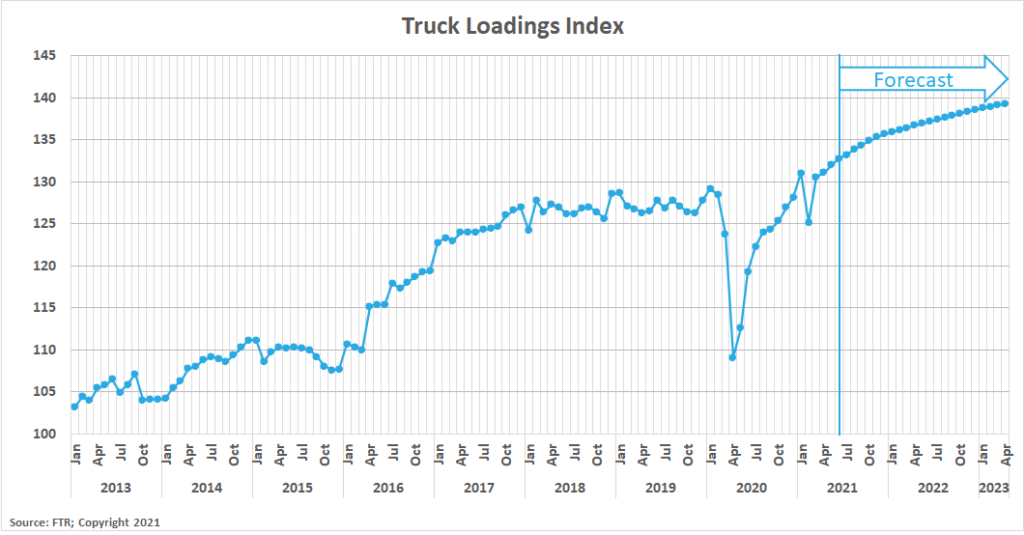
FTR’s Truck Loadings Index was up by more than 17% year-over-year in May after rising by 0.7% month-over-month from April. The pandemic lockdowns of 2020 are still resulting in favorable year-over-year comparisons, but the 0.7% month-over-month growth aligns with the other indices showing an increase in truckload demand in May. We are paying more attention to two-year growth trends in place of year-over-year comparisons due to the pandemic effect in 2020. May 2021 truck loadings were up 4.3% from May 2019 truck loadings, an increase from 3.8% in the two-year period beginning April 2019.

The DAT Load to Truck Ratio measures the total number of loads compared to the total number of trucks posted on their load board. In May, the Dry Van Load to Truck Ratio increased to 6.12, up 27.8% month-over-month and 220% year-over-year. The Reefer Load to Truck Ratio increased to 12.96, up 30.7% month-over-month and 324% year-over-year.
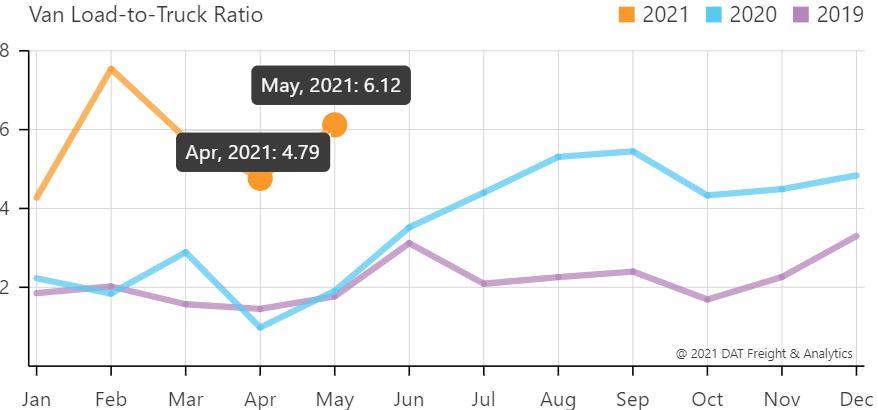
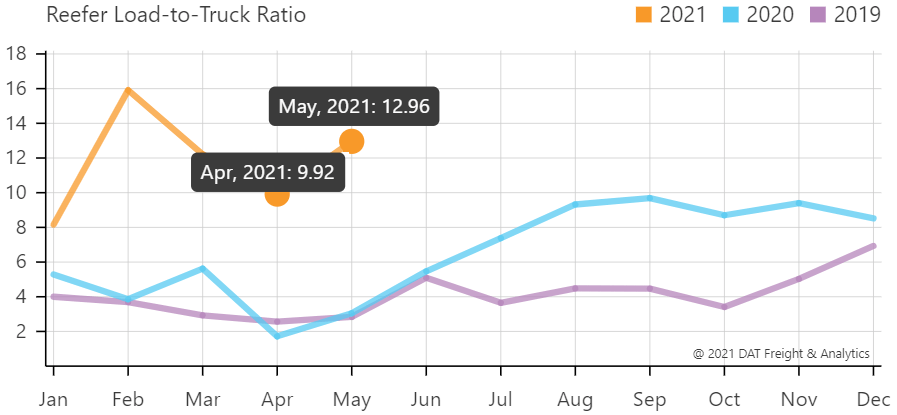
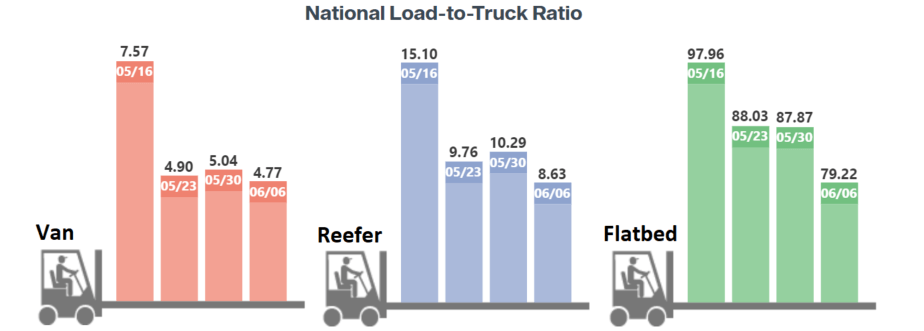
The weekly load to truck ratios show that conditions in the spot market were tighter earlier in the month but have moderated into early June across all three equipment types. The softening load to truck ratio aligns with the decline in contract tender rejections and the decline in spot volumes as the month progressed. We will be watching this trend closely, because it is a deviation from what we would expect at this time of year, especially given the current trends for both supply and demand.
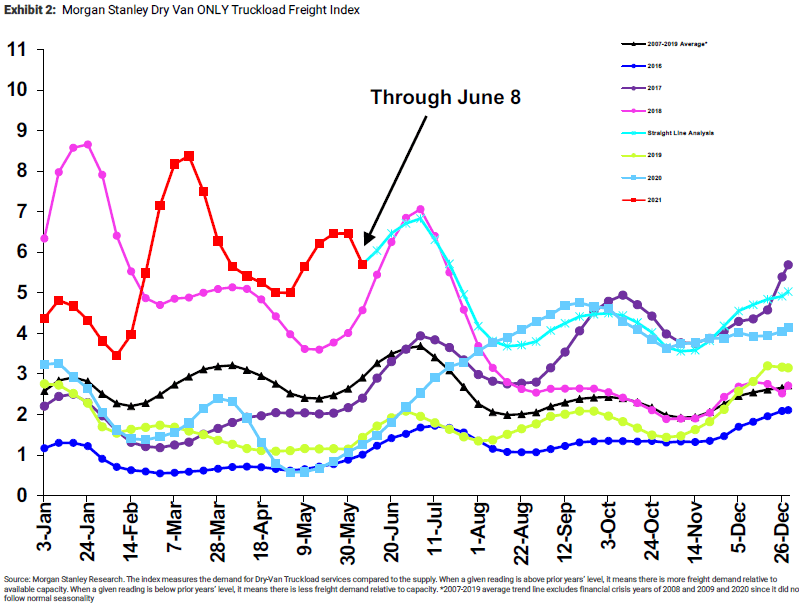
The Morgan Stanley Dry Van Freight Index is another measure of relative supply. The higher the index, the tighter the market conditions. According to the index, conditions have recently softened. This is unusual, as all other years in the chart indicate conditions have always tightened at this time of year. Morgan Stanley’s straight-line forecast suggests conditions will reverse their recent trend and tighten as we approach Independence Day before settling in the back half of the year.
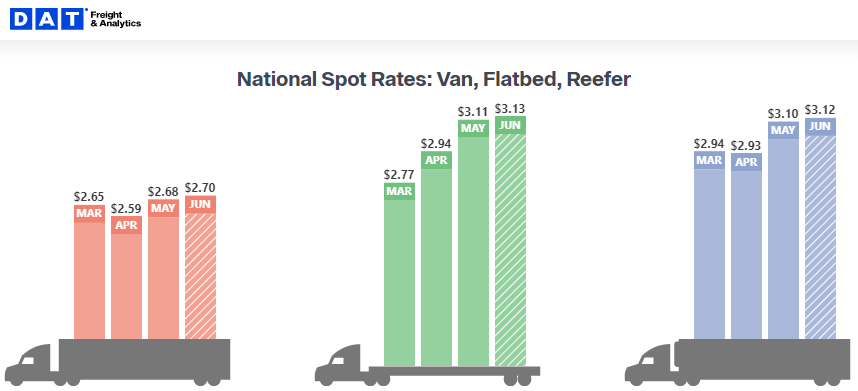

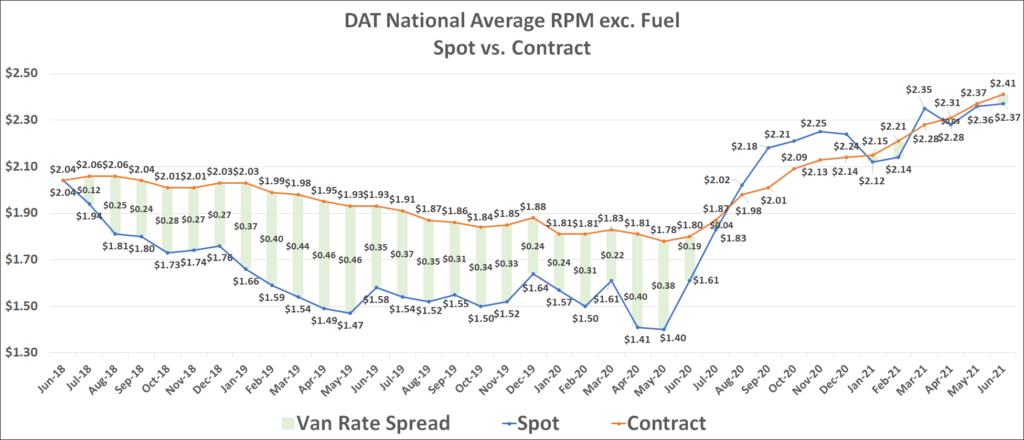
Contract rates have now increased for thirteen straight months. There is evidence that elevated contract rates are finally starting to provide some security for shippers with rates now at levels where carriers are willing to lock in to provide consistent contracted coverage. The recent trends are only a few weeks in the making, but increasing contract volumes and decreasing tender rejections are leading to lower overall spot volumes and a decreasing load to truck ratio. This is occurring at a time of year where we are used to seeing spot market activity pick up due to tighter capacity conditions. If this trend were to continue through Independence Day, it would be clear evidence that we will have passed the peak for rates associated with this inflationary cycle. Consistent, contracted capacity should be more readily available to shippers as carriers will look to lock in rates at current levels.
The one caveat to this forecast is that if another significant capacity event were to occur, such as a major hurricane making landfall, a large disruption could reignite the inflationary cycle and push rates even higher, just as we saw with the winter storms in mid-February. The balance between supply and demand may be improving, but weak capacity conditions will leave shippers exposed to potential routing guide failure if these major disruptive events were to take place.
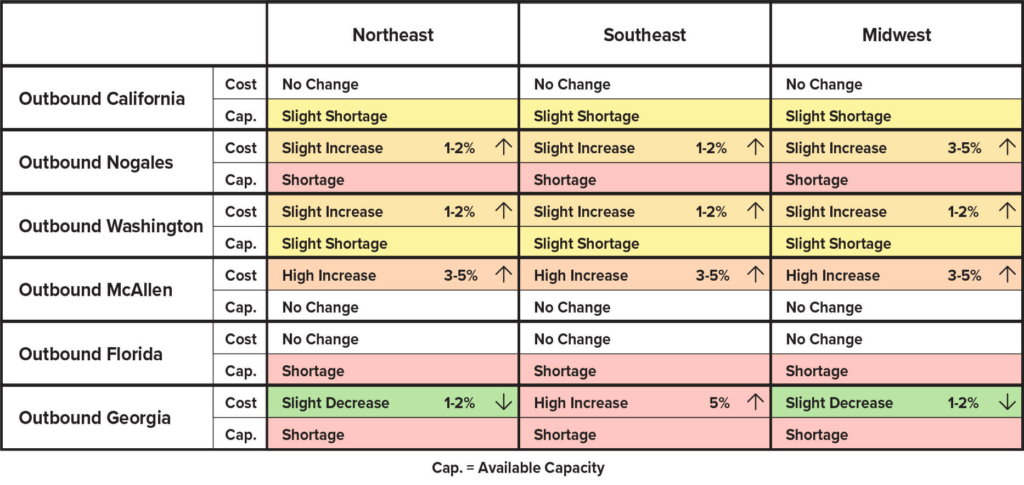
This month we wanted to illustrate the week over week changes in some of our highest volume produce regions. Though the majority of our customers are not specific to produce, the capacity constraints affect everyone in the area.
Information interpreted from ProducePay Freight Report and USDA Truck Rate Report:
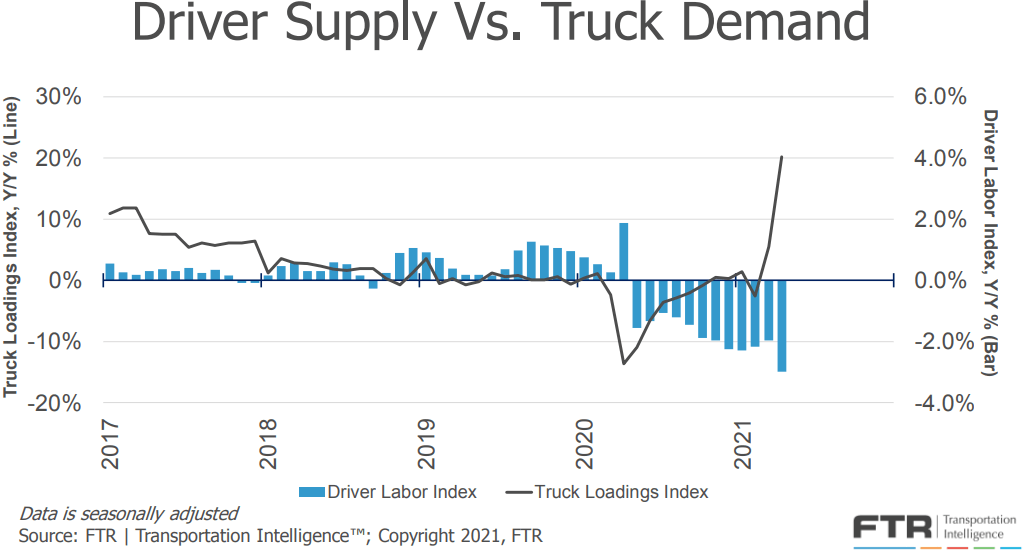
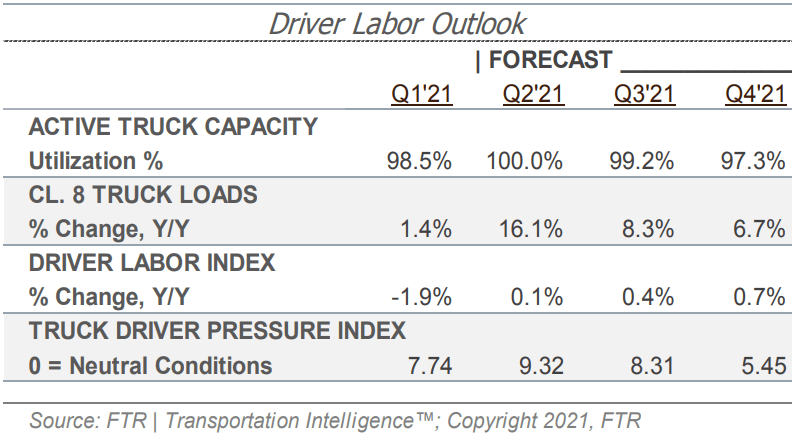
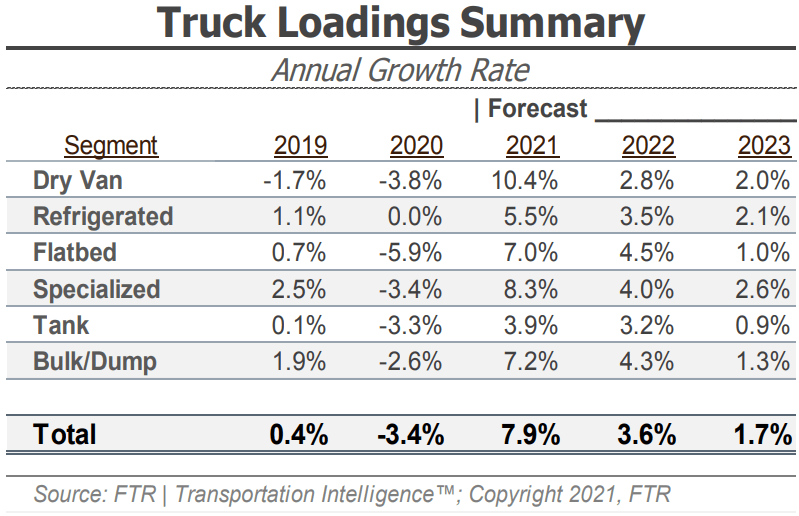
The chart above illustrates the growing imbalance between demand and supply. Truck loadings are up 4%, and driver availability is down 3% year-over-year, illustrating how volumes have continued to grow while driver supply falls.
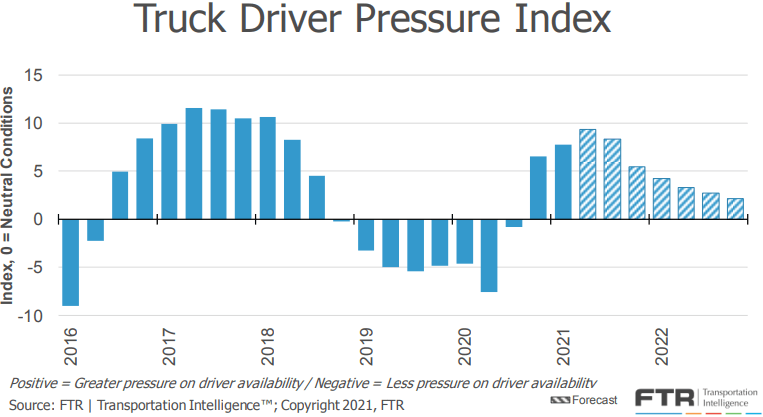
The chart below shows FTR’s forecast for truck driver pressure peaking in Q2-2021 and remaining elevated through 2022. This supports the outlook that capacity constraints will drive unpredictable rate environments as demand ebbs and flows. Despite contract rate increases, we are still advising shippers to secure dedicated capacity on their consistent, high-volume lanes to ensure capacity is available in the coming year.
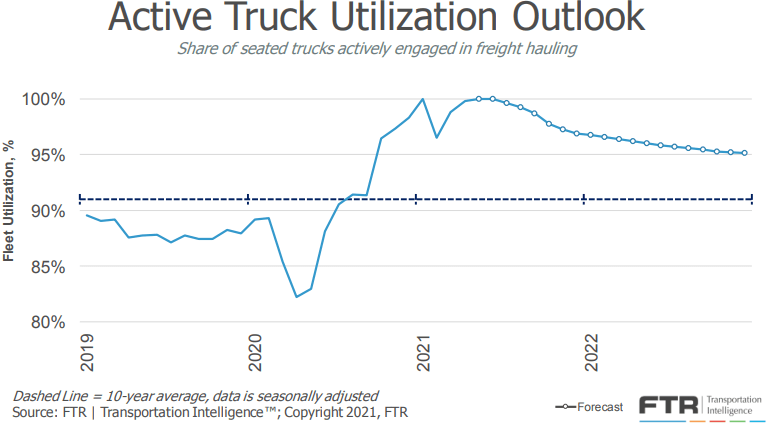
FTR’s forecast for truck utilization, the share of seated trucks actively engaged in freight hauling, is slightly stronger in the near term due to drivers returning to the market at a slower rate than expected. The updated forecast now shows active truck utilization maxing out at 100% in the second quarter, easing to only 99% in Q3 and 97% in Q4. FTR noted that the one risk to this forecast is that in the event that unemployment benefits are sharply reduced, higher rates of labor participation could mean capacity will return more quickly than expected.
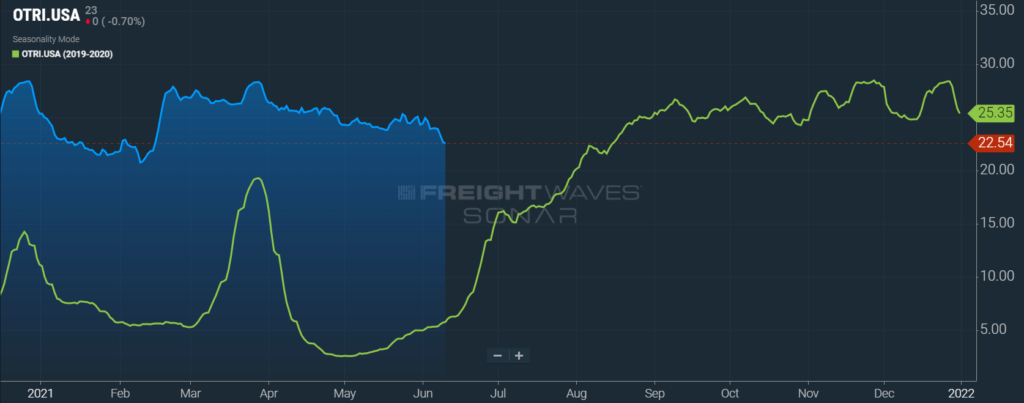
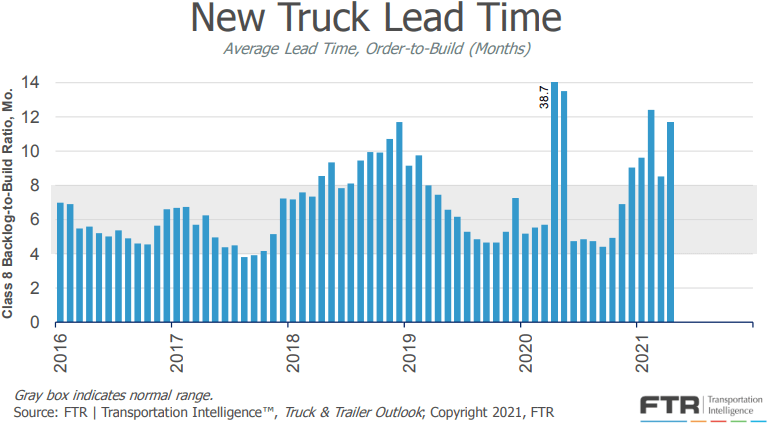
FTR reports that new truck orders pulled back in May, with preliminary results indicating 22,900 new Class 8 trucks were ordered in the month — a 28.5% decrease from 32,033 in April, but a 267% increase from 6,241 in May 2020. This is now the eighth straight month with new orders above the 20,000 units required to sustain current levels of capacity. The report indicated that the reduction in orders most likely occurred because backlogs for orders for the remainder of 2021 have already been filled, and carriers who are looking to order new equipment have most likely already done so.
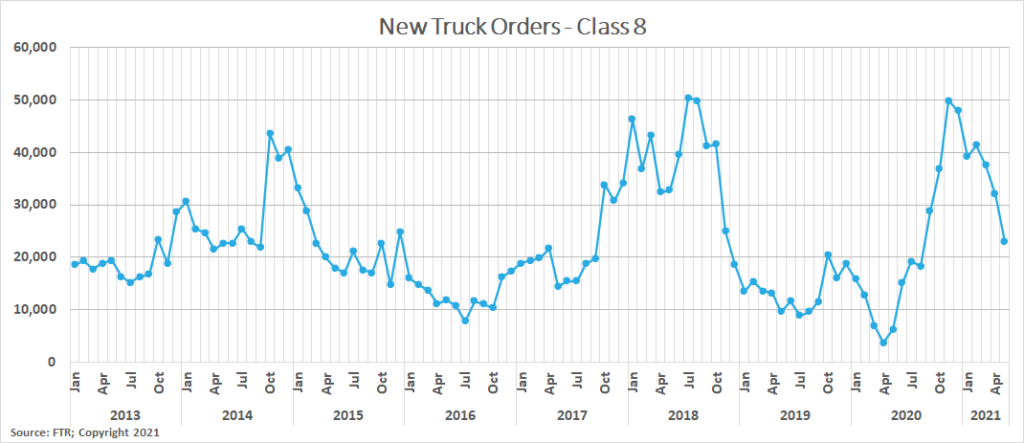
Supply chain bottlenecks associated with new truck production are expected to limit production. The average time from order to delivery jumped back to 11.7 months in April from 8.3 months in March as the shortage of semiconductors, and other components fell further behind
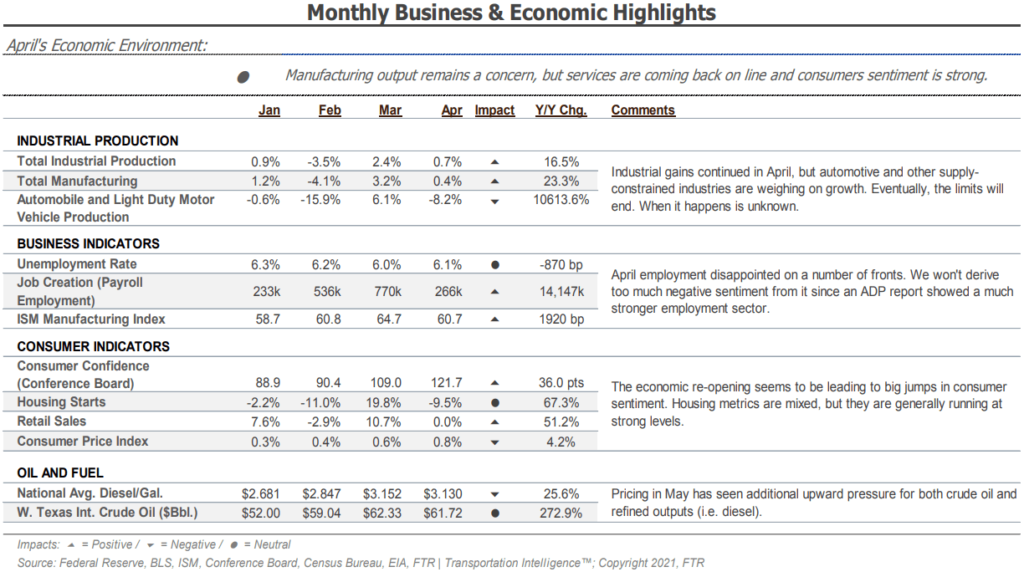
There are several indicators that the economy will maintain its strength over the next several months as the country continues to reopen. Housing activity remains up more than 67% year-over-year, industrial production and manufacturing are both up month-over-month and year-over-year, and retail sales are flat month-over-month and up 51% year-over-year.
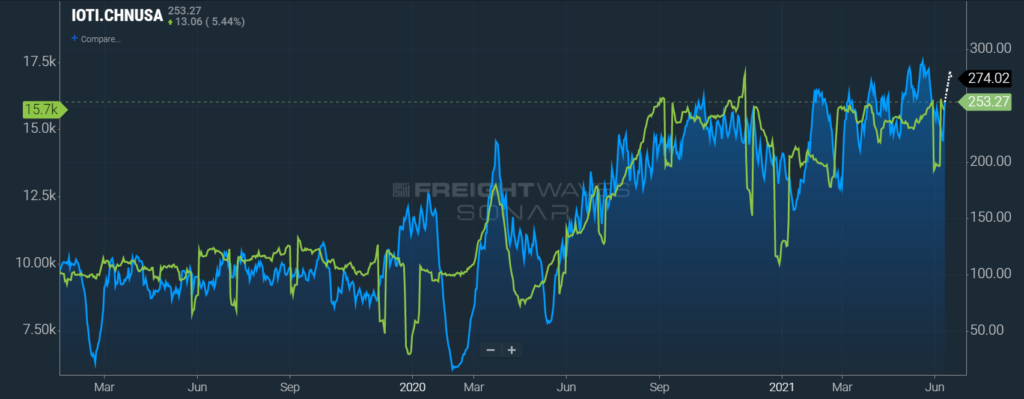
The chart below plots the total inbound ocean TEU volume on the lane from China to the U.S. (IOTI.CHNUSA) in blue, against the total outbound tender volume index for the U.S. (OTVI.USA) in green. The correlation between the volume of Chinese imports and corresponding domestic, over-the-road freight volumes is striking and supports the conclusion that as long as imports continue to flow in at the pace they are, total truckload demand should remain elevated. With retail inventories near an all-time low, we should expect to see inventory restocking drive strong freight volumes in the months ahead.
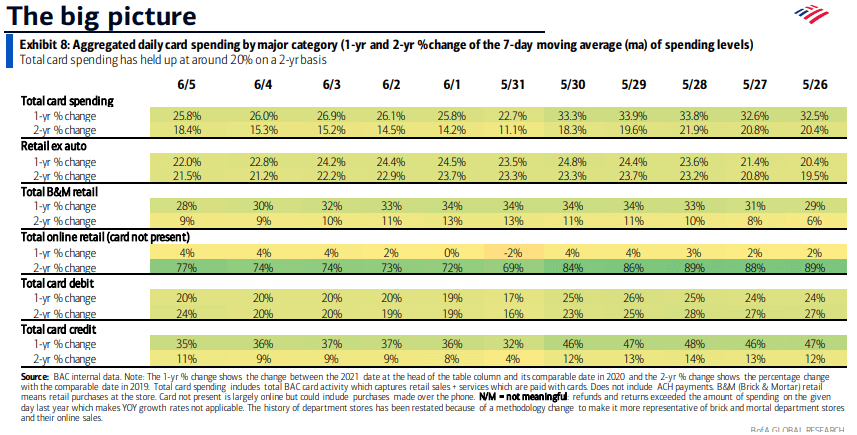
When looking at monthly card spending by major category, airlines and lodging increased the most sequentially in consumer spending month-over-month in May (Exhibit 6), but both remain down when considering the growth over the prior two years (Exhibit 5). This is evidence that as states continue to reopen, we should expect to see pent-up demand for travel and entertainment drive spending growth in new areas. This shift in consumer behavior and spending should impact truckload demand in such a way that requires capacity networks to adjust to new demand pressures, potentially causing an extension in the current market disruption.

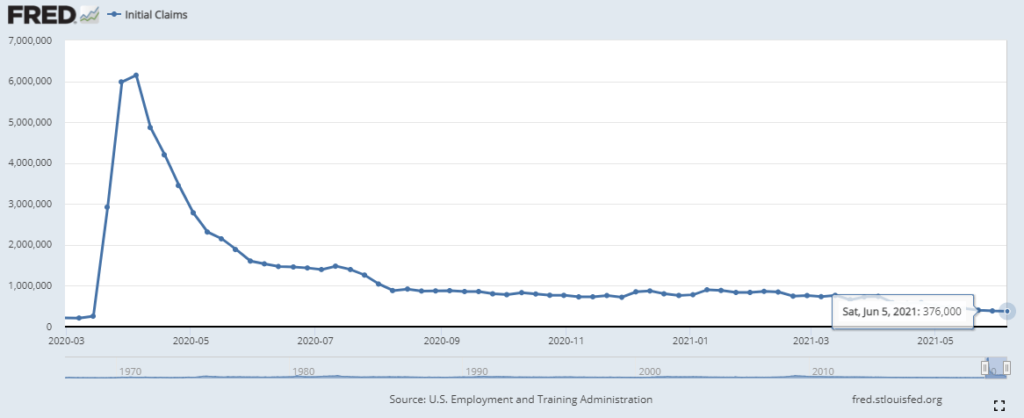
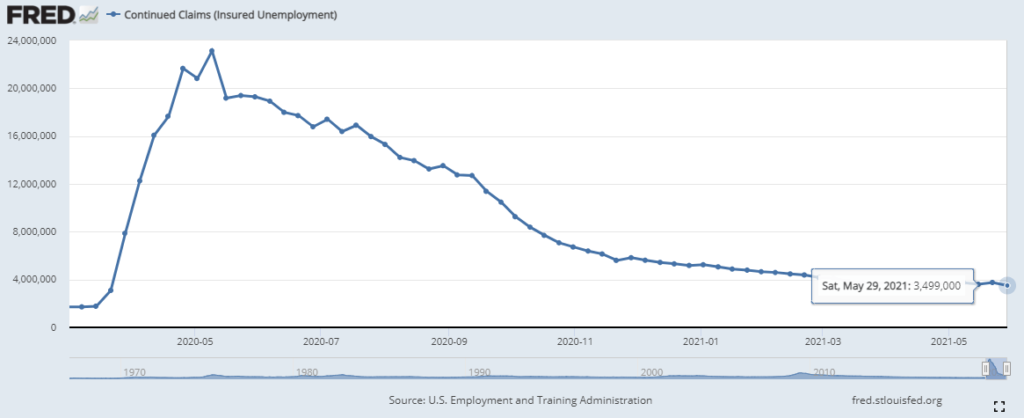
The unemployment trends appear to be improving slightly but still remain well above pre-pandemic levels. Initial claims in the most recent week came in at 376,000, down from more than 550,000 last month, and continued claims are relatively flat at 3.5 million on a weekly basis. Total payroll employment is on the rise, up 770,000 in March and 266,000 in April. The largest gains were seen in the leisure and hospitality sector, which added 331,000 new jobs in April, following 206,000 in March.
Carrier pricing power was on full display in March as contract rates climbed at an unprecedented rate throughout the month. The winter storms in mid February exposed just how insufficient supply is to support truckload demand, and carriers have responded by demanding a premium on their committed capacity.
Unfortunately for shippers, there does not appear to be much relief in sight. Our research indicates that there will continue to be greater upside risk to demand as we move into the second quarter. Spring produce season is just getting underway, the backlog at the port of Los Angeles and Long Beach should support healthy demand outbound from port cities on the East, Gulf and West Coast ports through at least the third quarter, and the third round of government stimulus is generating increased economic activity and consumer spending that will result in an additional boost to truckload demand.
On the supply side, there is no indication that carriers will be able to add capacity quickly enough to support the surge in demand in the near term. Both driver availability and delays in new truck delivery timelines remain the biggest challenges to carriers’ ability to do so. Driver availability should improve as the vaccine rollout enables driver schools to increase throughput, but the delays in new truck production will limit the rate that capacity is added.
As a result, our forecast for the remainder of the year remains consistent. Rates will likely remain at or near all-time highs through at least the second quarter, with the possibility of easing market conditions in the back half of the year as drivers and new equipment begin to enter the market.


