

"*" indicates required fields
"*" indicates required fields
"*" indicates required fields

Our research indicates an increased likelihood for an active spot market and high truck costs in the coming months due to an improved demand outlook and a declining outlook for capacity. The outlook for the back half of the year depends on carriers’ ability to add drivers and new equipment to levels sufficient enough to deal with volatile demand trends.
Severe winter weather resulted in volatile demand trends in February that exposed a significant undersupply of capacity in the domestic freight market.
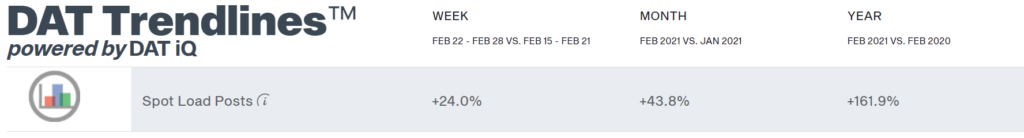
DAT reported 43.8% month-over-month and 161.9% year-over-year growth in spot volumes in February, a sign that this year’s trends deviated from normal seasonality.
In February, the DAT Dry Van Load to Truck Ratio increased to 7.54, an increase of 77% month-over-month, and 310% year-over-year. The Reefer Load to Truck Ratio also rose rapidly to 15.91, an increase of 95% month-over-month and 312% year-over-year.
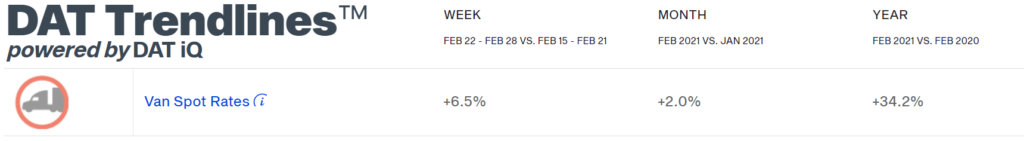
Elevated contract rates provided little to no protection against an extended disruption in the market. Spot rates, excluding fuel, climbed $0.27 per mile from Jan. to March.
The biggest obstacles for truckload supply recovery are semiconductor shortages causing delays in class 8 truck production and the continued driver availability issues.
Shippers that can secure dedicated capacity on consistent, high volume lanes, are going to have the greatest control over their transportation spend in the coming year.
An improving economy and normal seasonal trends such as produce and summer peak seasons should continue to support healthy demand trends in the coming months.
Post vaccine spending patterns indicate that pent up demand for travel and entertainment will lead to a shift in the consumer basket, and fluctuations in demand are likely to further disrupt the freight market late in the second quarter.
Tender Volumes are representative of nationwide contract volumes and act as an indicator of Truckload Demand
Tender Rejectionsindicate the rate at which carriers reject loads they are contractually required to take and acts as an indicator of the balance between Truckload Supply and Demand
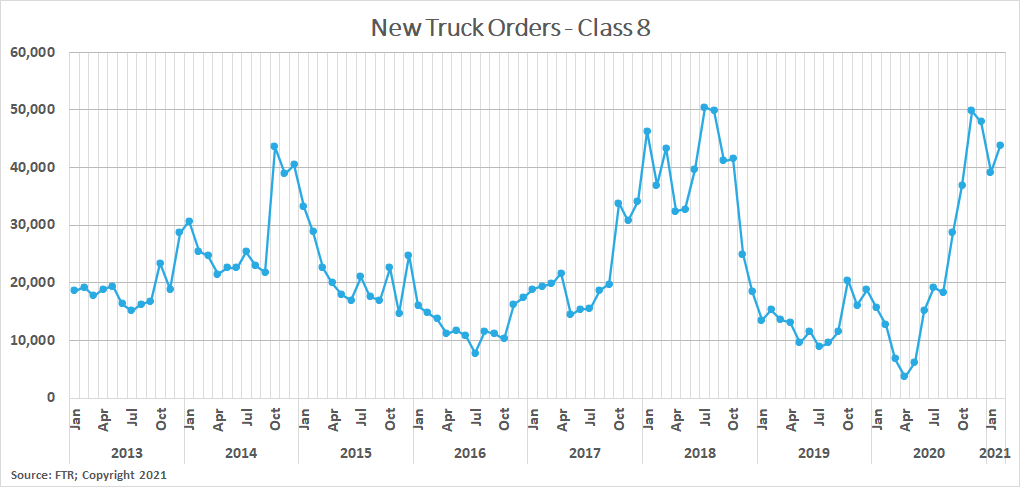
New Truck Orders is an indicator of the trucking industry’s health and carrier sentiment, as carriers typically invest in new trucks when demand and optimism are high.
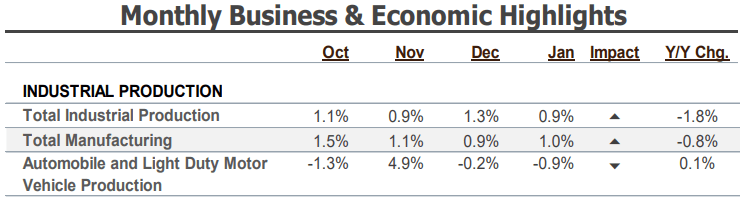
Industrial Production measures the output of the industrial sector, including mining, manufacturing and utilities.
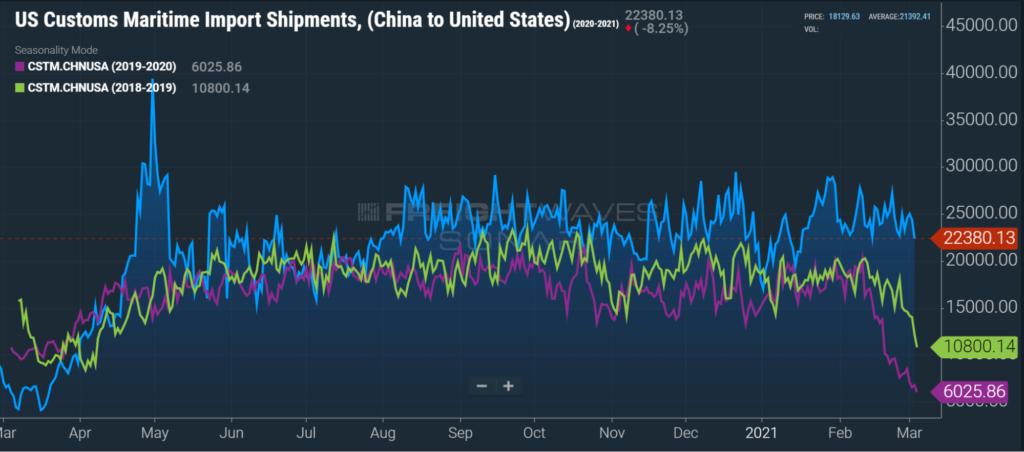
US Customs Maritime Import Shipments, China to the United States measures the total number of import shipments being cleared for entry to the U.S. from China.
Rate Spread measures the difference between the national average contract rate per mile and the national average spot rate per mile and is closely inversely correlated to movements in tender rejections and spot market volumes.
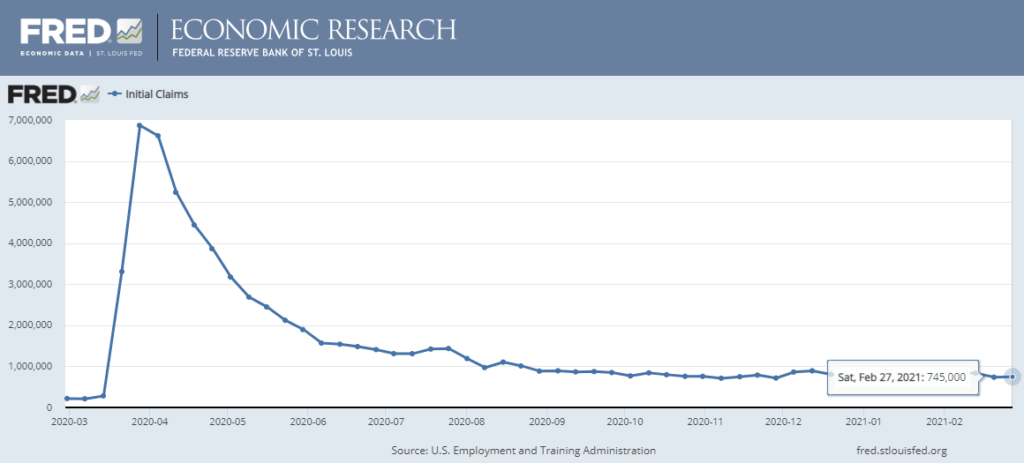
Weekly Jobless Claims are used as a barometer for the pace of layoffs in the general economy.
Unemployment Rate is the number of people who are unemployed that are actively seeking work.
"*" indicates required fields
Inconsistent demand trends continued to be the driving force behind the volatility in the freight market in February. The winter storms that wreaked havoc on southern states were a clear turning point from the deflationary conditions seen earlier in the year to the inflationary trends we have seen over the past several weeks. February is normally the slowest month of the year for freight, but several factors contributed to the unusual pattern seen this year. The backlog at the ports has provided a steady stream of volume in the form of imports, and the winter storms have sparked a surge of demand for the recovery efforts and replenishment of empty store shelves. There have been no signs of a slowdown throughout the first week of March, as surging demand continues to add stress to the already capacity constrained market.
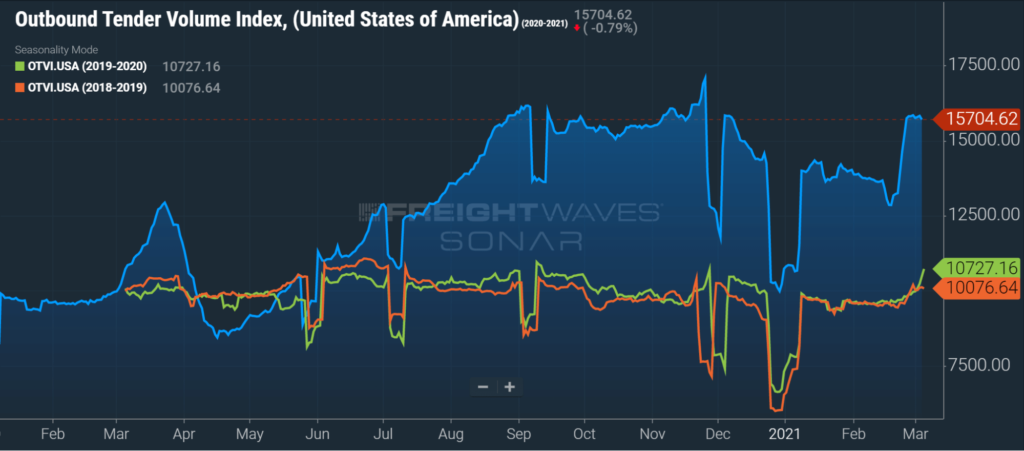
FreightWaves SONAR Outbound Tender Volume Index (OTVI), which measures contract freight volumes across all modes, was up nearly 60% year-over-year on February 28th. It is important to note that OTVI includes both accepted and rejected load tenders, so we must discount the index by the corresponding Outbound Tender Rejection Index (OTRI) to uncover the true measure of accepted tender volumes. If we were to apply this method to the year-over-year OTVI values, the increase in volume drops to 22.9%. This was a huge increase from just ten days earlier, when the OTRI adjusted volume index was only up 3.9% year-over-year when volumes dipped due to the storm related shut downs. The Dry Van and Reefer Tender Volume Indices were also up more than 59% and 84% year-over-year at the end of the month, which only equated to 23.1% and 8.5% increases in actual volumes for the two modes, respectively. Tender volumes for both Dry Van and Reefer remain elevated in early March after going through similar fluctuations in February.
DAT reported that dry van spot load posts increased significantly in February, increasing by 43.8% month-over-month and climbing to a 162% year-over-year. Spot volumes continued to climb throughout the month as the market tightened, culminating in a 24% increase in the final week of the month as demand surged following the slowdowns associated with the storms.
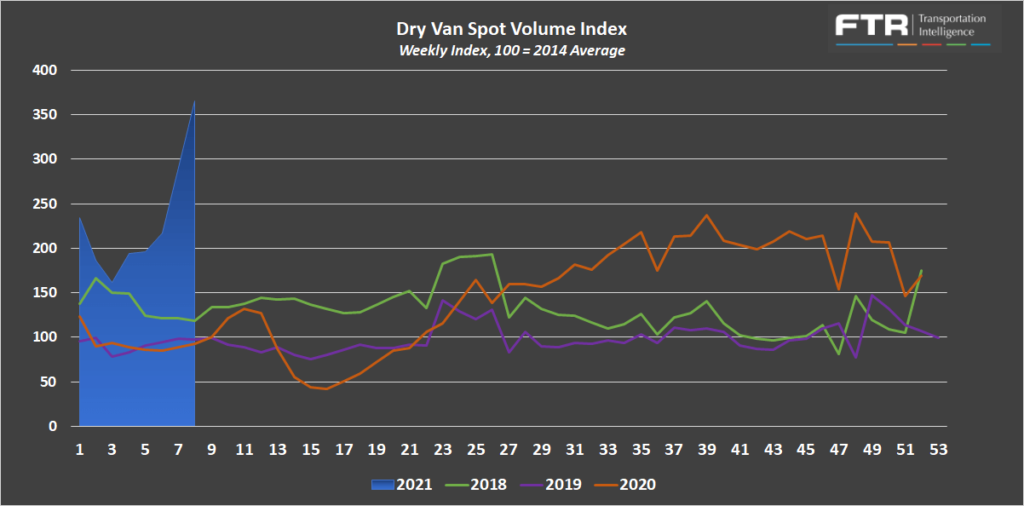
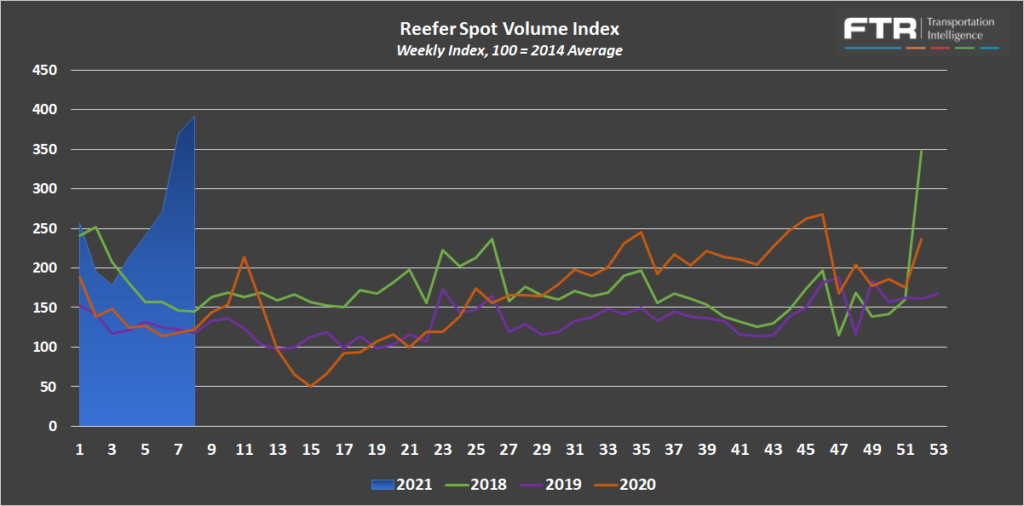
FTR and Truckstop’s Total All Mode Spot Volume Index is up 50.0% from the high in January and 157% year-over-year. The index grew exponentially, climbing by 2%, 4%, 14% and 25% in weeks one through four, respectively. This type of growth is more significant than the increase associated with the pandemic in 2020. The pattern is consistent with the trends seen in DAT’s February spot data and provides further evidence of the impact seen in the last week of the month. The Dry Van Spot Volume Index is up 88% month-over-month and 296% year-over-year, and the Reefer Spot Volume Index is up 83% month-over-month and 218% year-over-year in February.
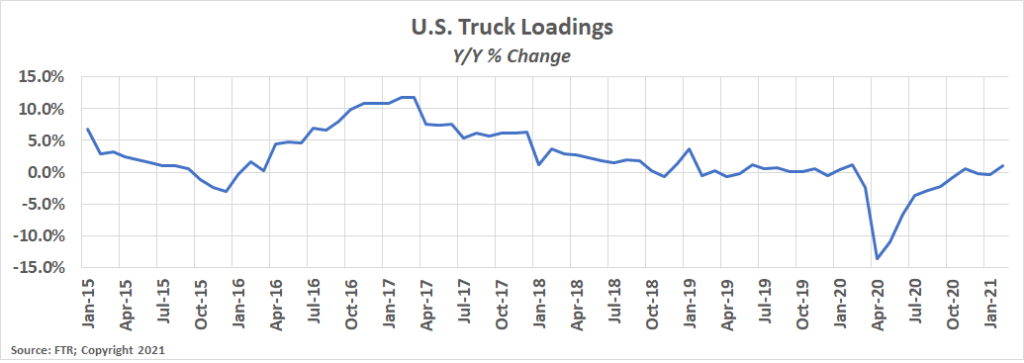
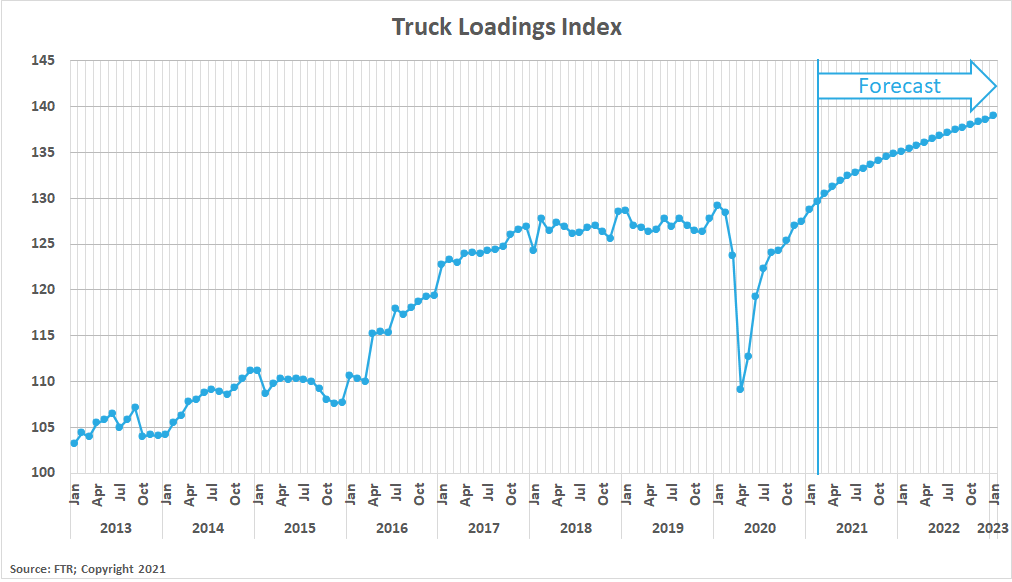
FTR’s Truck Loadings Index was up by just 1.0% year-over-year in February after rising by 0.7% month-over-month from January. In 2020, the Truck Loadings Index fell by -0.6% month-over-month in the same time period, a sign that this year’s trends deviated from normal seasonality.
Truckload supply became extremely constrained in February. Fluctuations in demand created surges in spot volume activity as capacity networks were thrown out of balance by the winter storms. Inbound volumes to some of the areas hit hardest in TX, LA, AR and Memphis, TN have all increased relative to the volumes outbound from these locations. This trend is resulting in more trucks building up in these areas than there are loads to get them out. This is similar to the volume disparity seen across different shipper industries as the pandemic lockdowns took hold. In a market where capacity is in delicate balance, a disruption of this magnitude can really shake things up.
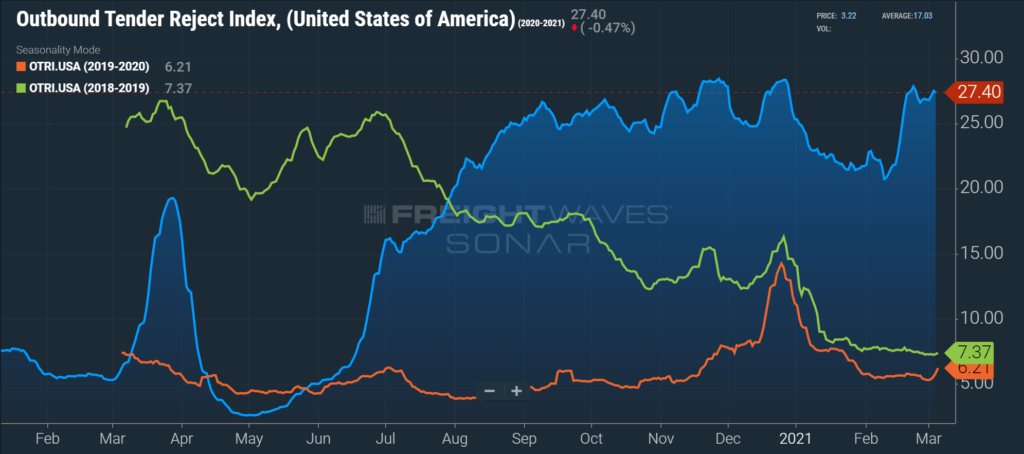
Sonar Outbound Tender Reject Index (OTRI) measures the rate at which carriers are rejecting the freight that they are contractually required to take. This index tends to follow the changes of spot freight activity — the higher the tender rejections, the higher the spot volumes. The trends seen in February are consistent with the fluctuations seen in spot volumes reported by the DAT and Truckstop, spiking in back half of the month. Tender rejections were as low as 20.75% on February 9th but climbed to a peak of 27.87% by February 22nd.The index currently sits at 27.40%, an increase of more than 370% year-over-year.
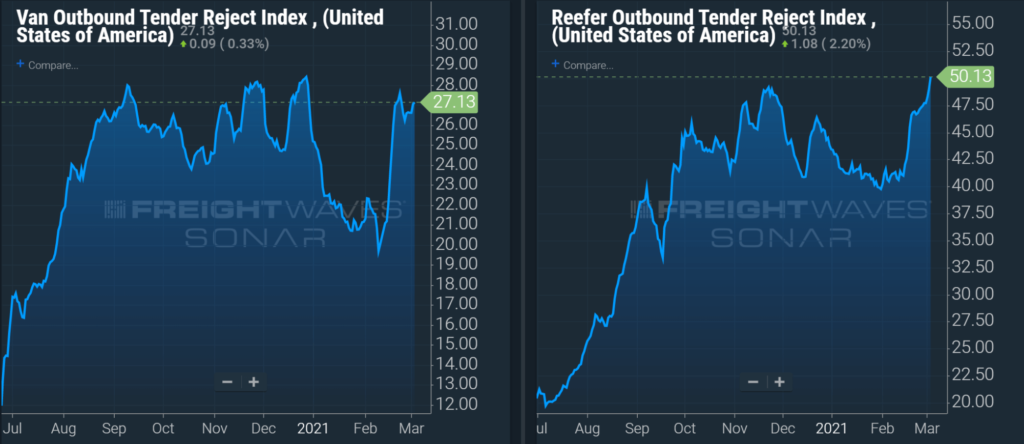
The trends were consistent across the different equipment types. Dry van tender rejections currently sit at 27.13%, up about 375% year-over-year. Reefer tender rejections currently sit at 47.71%, an increase of 328% year-over-year.
The DAT Load to Truck Ratio measures the total number of loads posted compared to the total number of trucks posted on their loadboard. In February, the Dry Van Load to Truck Ratio increased rapidly to 7.54, an increase of 77% month-over-month, and an increase of 310% year-over-year. The Reefer Load to Truck Ratio also rose rapidly to 15.91 in February, an increase of 95% month-over-month and 312% year-over-year.
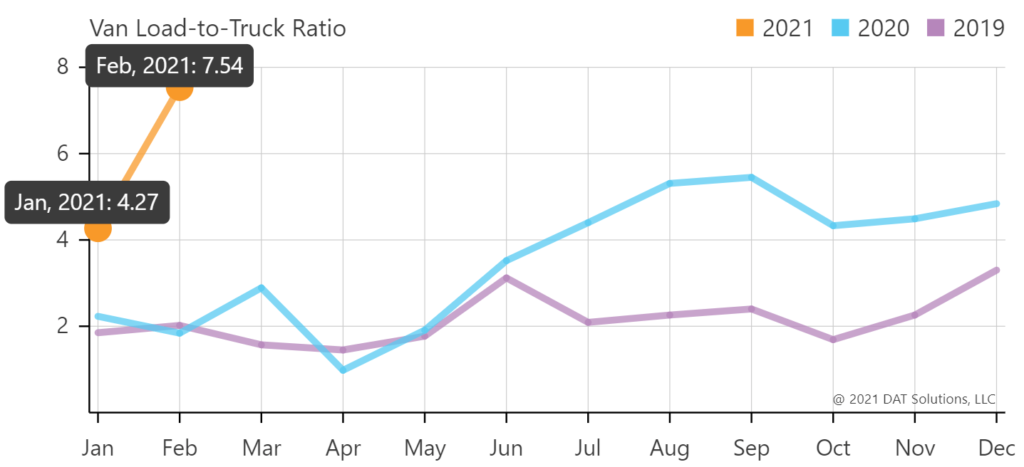
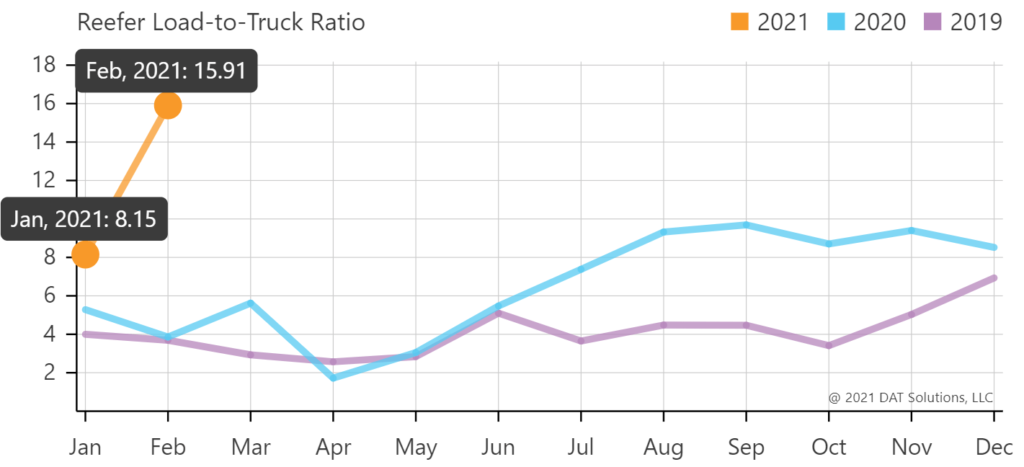
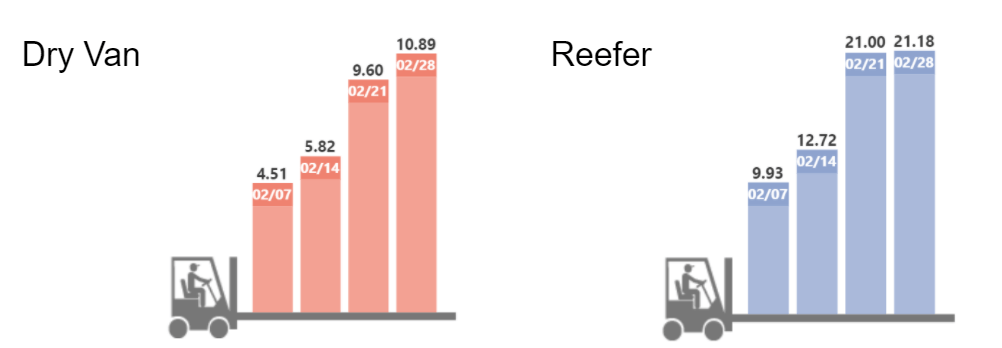
The weekly load to truck ratios increased throughout the month, providing further evidence of increased spot market tightness due to the severe winter storms as the month came to a close. Not only is it abnormal for load to truck ratios to rise in February, but these ratios are elevated higher than at any point in 2018. All indications are pointing to this trend continuing into March. Demand is expected to continue to trend at a high level, putting continuous pressure on the available capacity in the marketplace.
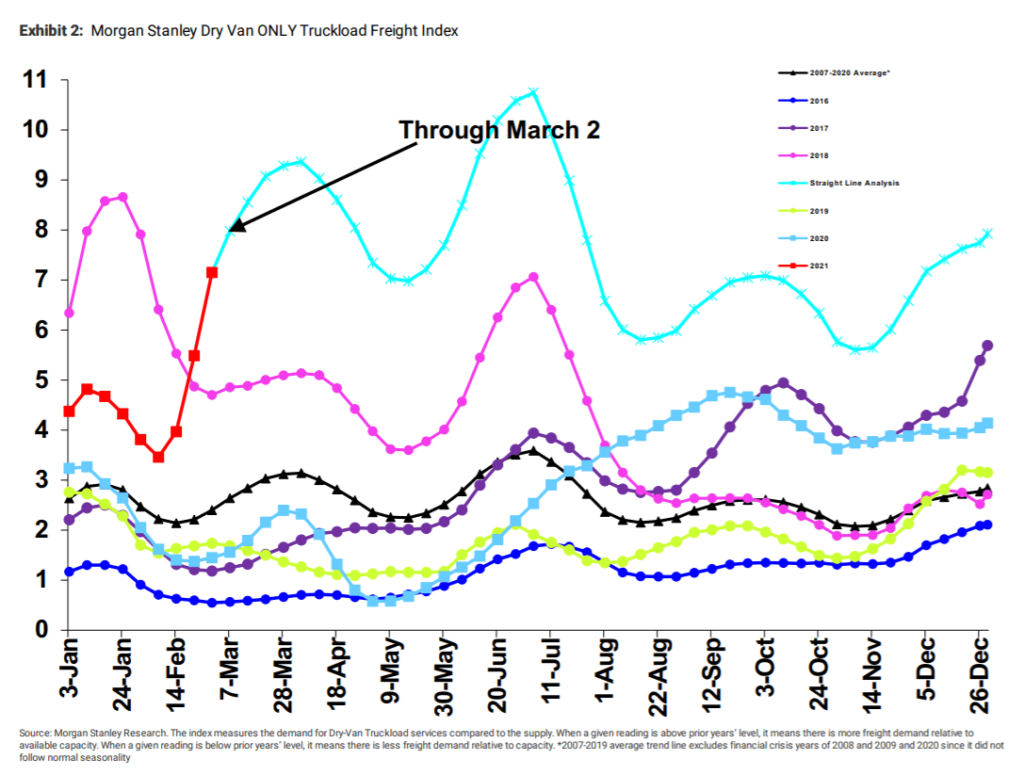
The Morgan Stanley Dry Van Freight Index is another measure of relative supply. The higher the index, the tighter the market conditions. The index indicates dramatic tightening of capacity in February, climbing to the highest level seen since January of 2018 when the ELD mandate went into effect. Their forecast indicates that the market will reach peak tightness in June before cooling off later in the year. This forecast is bullish and seems to indicate relatively flat growth between now and the end of the year, after undergoing volatile swings in conditions throughout.
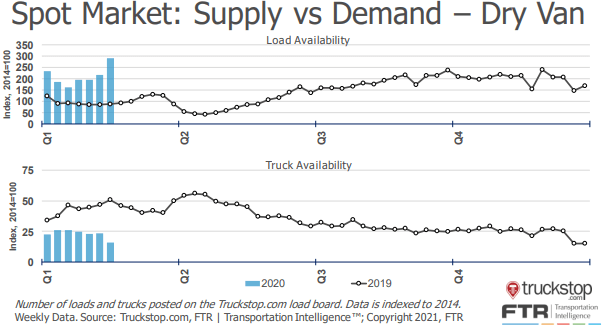
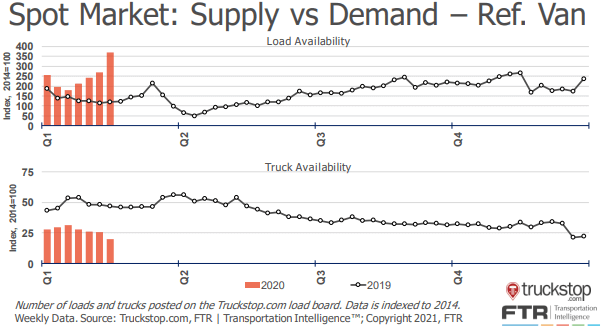
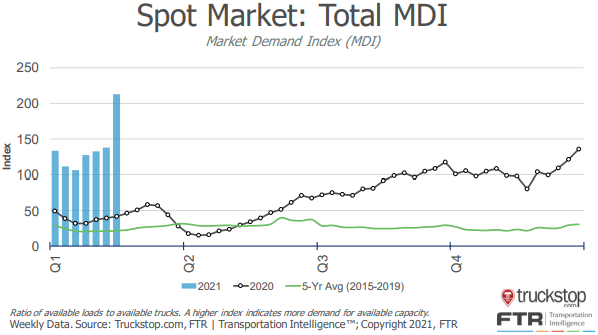
The Truckstop/FTR Market Demand Index measures the ratio of available loads to available trucks. In the first two sets of charts below, load and truck availability are plotted separately for both dry van and reefer freight. Load availability increased, remaining up year-over-year, while truck availability decreased and remained down year-over-year for both equipment types. This imbalance is indicative of further tightening market conditions as demand has remained elevated above supply. The total Market Demand Index was up 66% month-over-month and 376% year-over-year.
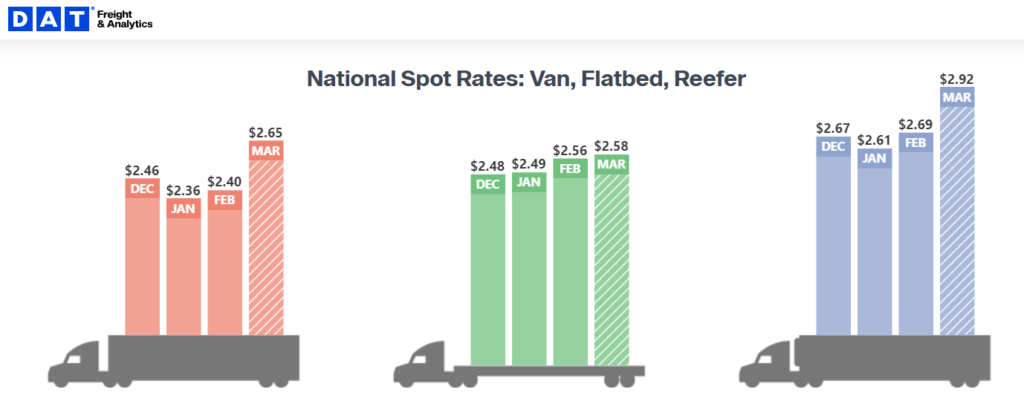
Van and reefer spot rates increased rapidly in January as tender rejections and spot activity picked up late in the month. Dry van spot rates increased by 1.7% from $2.36 per mile in January to $2.40 in February. This is misleading as rates are up more than 12%, or $0.33 per mile, from January to the first week in March, a sign of just how fast rates climbed late in the month. Contract rates have continued to climb as well, growing by another $0.18 per mile since January, which brings the total increase to 30% from $1.97 to $2.56 since May 2020.
The dry van linehaul rate per mile of $2.69 for the first week of March is up by 44% year-over-year. This is an all-time high for truckload rates, $0.23 per mile higher than the previous all time high of $2.46 in December 2020.
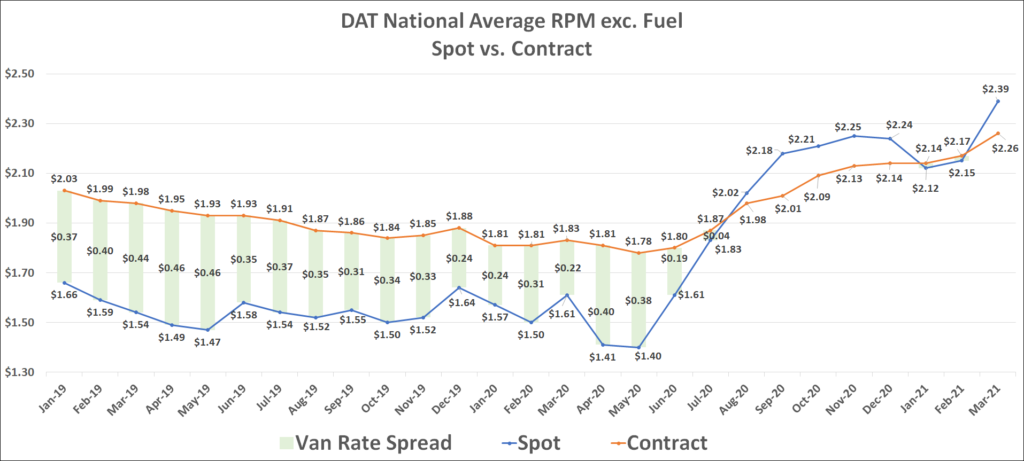
Elevated contract rates provided little to no protection against an extended disruption in the market. Spot rates soared, pushing contract rates even higher as it has become abundantly clear that capacity just isn’t sufficient to support the surges and volatility in demand. This is a direct result of the winter storm disruption and has proven just how sensitive the balance between supply and demand really is.
Capacity is the key to tilting the market back in the shippers’ favor. It has become clear that even with contract rates at an all-time high, demand continues to drive the ebbs and flows in the spot market. Challenges in class 8 truck production and the continued driver availability issues remain the biggest obstacles to a recovery in truckload supply. Until these issues are resolved, we expect to see demand volatility result in highly unstable market conditions.
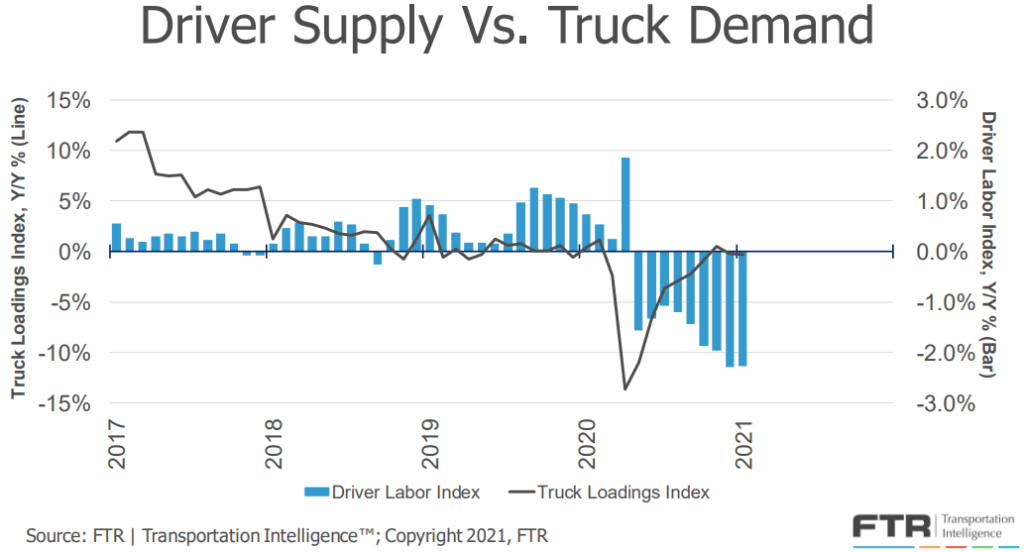
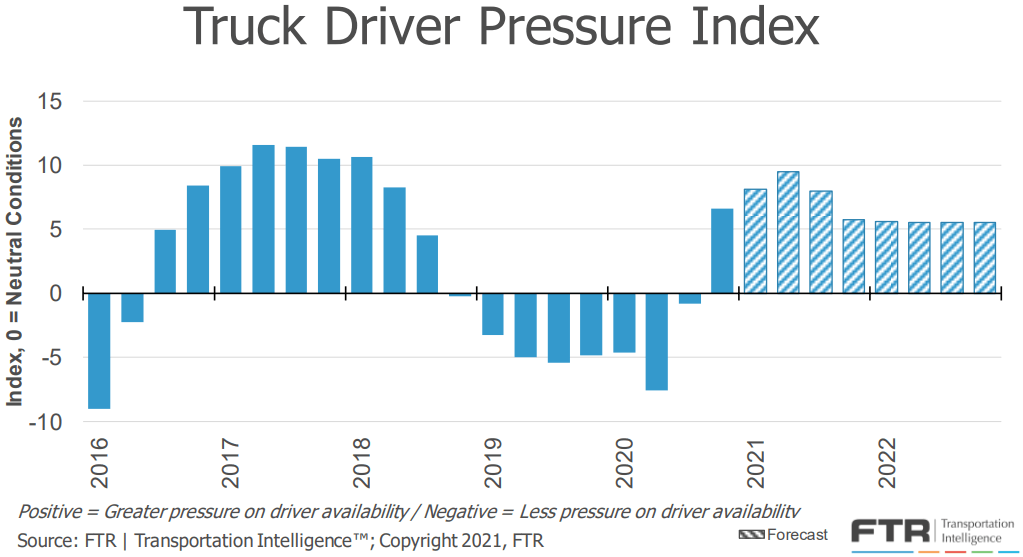
The growing disparity between driver supply and truckload demand resulted in increasing pressure on driver availability. The chart below shows FTR’s forecast for truck driver pressure peaking in Q2-2021 and remaining elevated through 2022. This supports the outlook that capacity constraints will continue to drive unpredictable rate environments. Shippers that have the ability to secure dedicated capacity on consistent, high volume lanes, are going to have the greatest control over their transportation spend in the coming year.
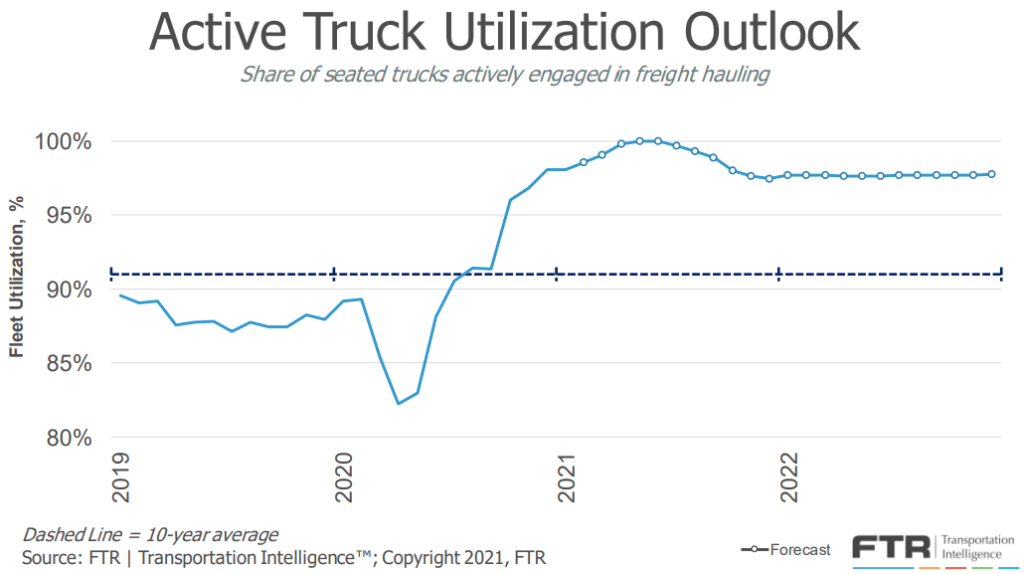
Active truck utilization, the share of seated trucks actively engaged in freight hauling, is now forecast to max out at 100% in June and July, holding at 98% through Q3, before declining back to a respectable 97% through 2022. This forecast has strengthened based on an improved expectation for freight volumes to remain strong and only minimal relief from tight driver capacity.
FTR is reporting that new truck orders increased to 43,800 units in February, up 11.9% month-over-month and 245% year-over-year. This would be the sixth straight month with new orders coming in above the 20,000 units required to sustain current levels of capacity. Typically, this would be a strong indicator that capacity was making a recovery, but shortages in the semiconductors needed to produce the microchips required to operate a truck are leading to delays in the delivery of new units. Delivery estimates are now being pushed out to 2022 for many models.
The outlook for demand remains strong. Normal seasonal trends should result in increasing demand as spring produce season gets underway. Housing starts are at the highest levels seen since 2006, which should mean healthy volumes for building materials and goods related to housing construction. Longer term, pent up demand could give the economy a strong boost as vaccinations continue to allow for the return to normal life.
Industrial production continues to see modest gains, but remains down 1.8% year-over-year. Despite small improvements, there is still room for growth as virus related lockdowns and labor shortages are relieved with the distribution of the vaccine in the coming months.
FTR’s latest truck loadings forecast shows stronger outlooks in most major commodity groups, resulting in a significantly stronger 2021 freight outlook. The forecast shows a continued increase in monthly truck loadings resulting in a total increase of 7.8% for the full year, up from 6.2% a month ago.
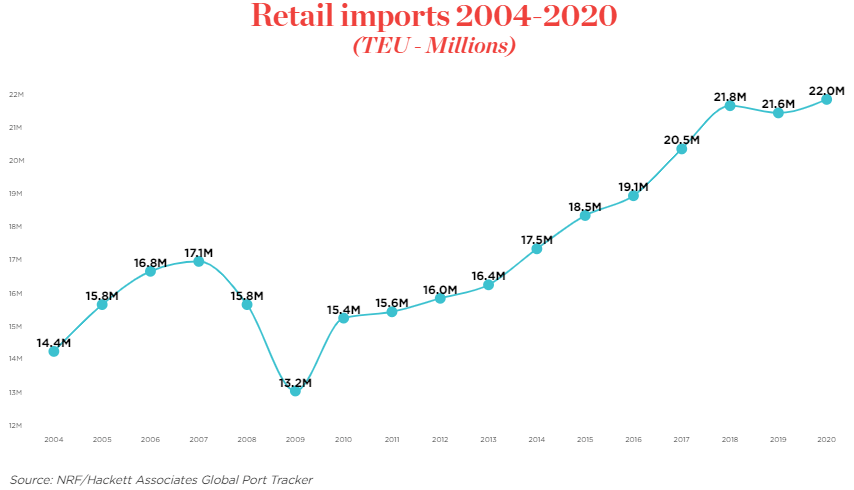
Inventory restocking is expected to be a major contributor to truckload demand in 2021. More than 22 million twenty foot equivalent units of retail imports in 2020 set a new annual record, and with the current backlog of ships at the ports, we expect imports to remain strong well into the third quarter or longer. Shippers who rely on imported raw materials for production or imports to replenish inventories should look for ways to make adjustments. Taking steps to simplify product offerings, building more lead time into ordering patterns, or even looking for alternatives near-shore or on-shore are all options to combat congestion at the ports.
The impact from Chinese New Year (CNY) was minimal this year as any slowdowns in production were masked due to the backlog and limited throughput at the ports. Imports typically fall off in late February but have remained consistent, providing a steady stream of inbound freight. This should support healthy outbound Los Angeles volumes through the end of 2021.
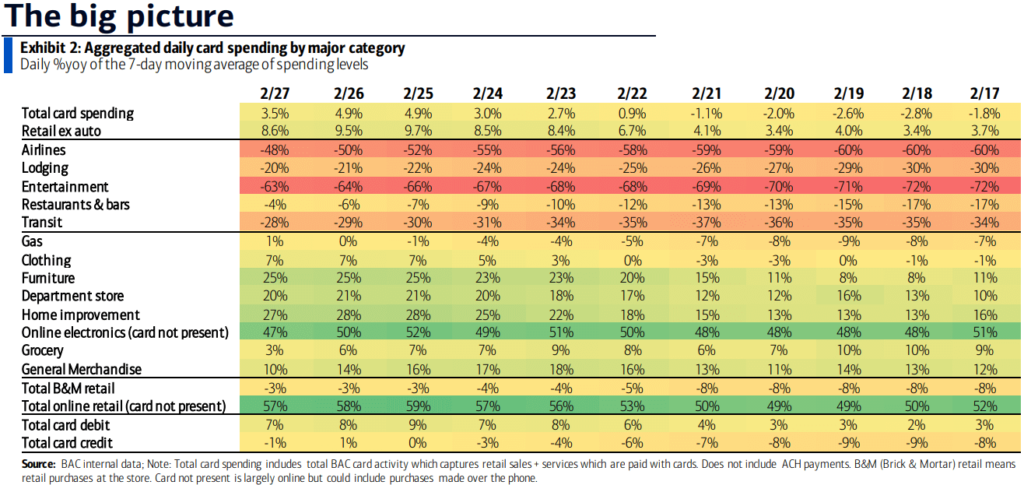
The Bank of America (BofA) consumer spending data provides visibility into the changing consumer behaviors and spending patterns. There were several stories that emerged in the spending data in February.
At a high level, consumer spending continued to trend at positive year-over-year growth throughout February. Total card spending is up 7% year-over-year for the 7-day period ending February 27th. We continue to see strong year-over-year growth in spending on durable goods and online retail and reduced spending on services such as travel, entertainment and spending at brick and mortar stores. If spending continues to see year-over-year growth, that would support continued economic growth and healthy truckload demand.
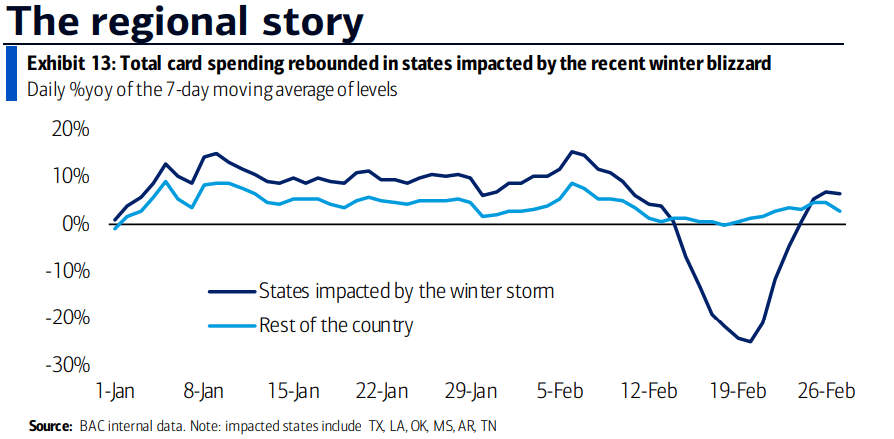
The impact from the winter storms is leading to elevated spending in the areas most impacted. Total spending in TX, LA, OK, MS, AR and TN fell to -25% year-over-year before increasing to +6.5% by the end of the month and remains elevated above states that were not impacted. Elevated spending in these states is resulting in an increase in inbound truckload demand to these areas. If spending remains elevated in these areas due to a prolonged recovery, it could be enough to keep supply and demand imbalanced, leading to sustained capacity constraints and an active spot market.
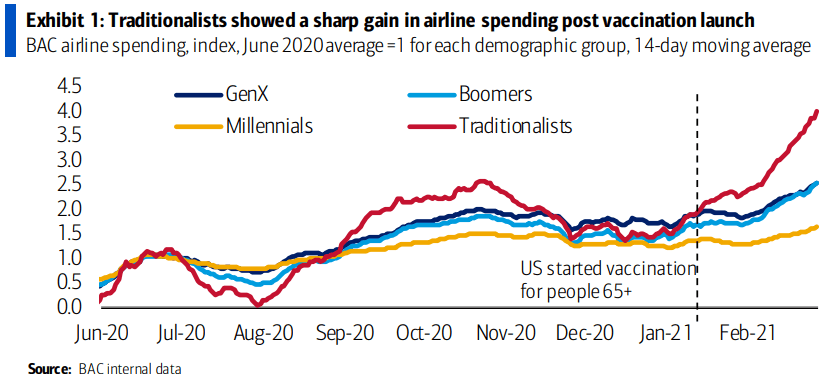
Lastly, we have begun to get an idea of what post-vaccine spending behaviors could look like. Spending trends among traditionalists, which are aged 73-92, have increased from the time U.S. vaccinations began on those above the age of 65. Spending on airfare, in particular, surged for this group. This provides some evidence that once vaccinations become more widespread, we could see another shift in the consumer basket. It is unknown whether this would have a positive or negative effect on truckload demand, but as we have seen with other trends over the past year, any meaningful change in demand is likely to have a tightening effect on capacity. We believe that the pent up demand for travel and entertainment will result in further capacity disruptions, even if total demand remains consistent, as carrier networks will be forced to rebalance themselves again.
Although a federal stimulus bill is being negotiated in Congress, there is no real update on when that bill might go into effect. Time is of the essence, however, as an estimated 11.4 million workers will lose their unemployment benefits between mid-March and mid-April if no new bill is passed. We will be watching this closely, as any major stimulus would likely have a positive effect on truckload demand.
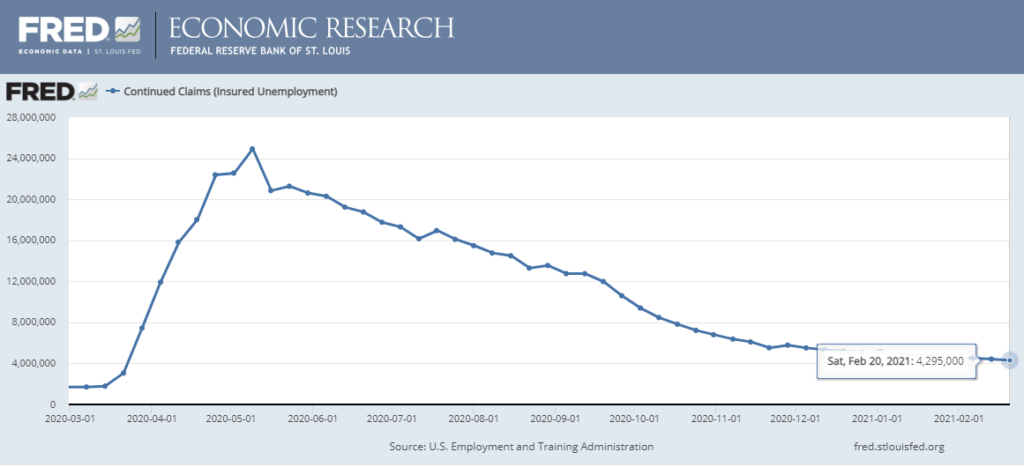
The unemployment trends continue to be concerning, improving only slightly throughout February and continuing on their flat trend over the past few quarters. Initial claims in the most recent week came in at 745,000, and continued claims are more than 4.2 million on a weekly basis.
Carrier pricing power was on full display in March as contract rates climbed at an unprecedented rate throughout the month. The winter storms in mid February exposed just how insufficient supply is to support truckload demand, and carriers have responded by demanding a premium on their committed capacity.
Unfortunately for shippers, there does not appear to be much relief in sight. Our research indicates that there will continue to be greater upside risk to demand as we move into the second quarter. Spring produce season is just getting underway, the backlog at the port of Los Angeles and Long Beach should support healthy demand outbound from port cities on the East, Gulf and West Coast ports through at least the third quarter, and the third round of government stimulus is generating increased economic activity and consumer spending that will result in an additional boost to truckload demand.
On the supply side, there is no indication that carriers will be able to add capacity quickly enough to support the surge in demand in the near term. Both driver availability and delays in new truck delivery timelines remain the biggest challenges to carriers’ ability to do so. Driver availability should improve as the vaccine rollout enables driver schools to increase throughput, but the delays in new truck production will limit the rate that capacity is added.
As a result, our forecast for the remainder of the year remains consistent. Rates will likely remain at or near all-time highs through at least the second quarter, with the possibility of easing market conditions in the back half of the year as drivers and new equipment begin to enter the market.
"*" indicates required fields

Matt Pyatt is the Chief Executive Officer of Arrive Logistics. He co-founded Arrive with President Eric Dunigan in 2014 after building his career at Command Transportation. As CEO, he is responsible for overseeing the company’s financial health, strategic vision and culture, as well as building a scalable leadership team to support Arrive’s growth.
"*" indicates required fields
"*" indicates required fields
Please have the following info ready to complete registration
Fraud Prevention
Freight fraud continues to impact our industry. We encourage shippers and carriers to reach out to Arrive immediately if there is ever a shipment in question that may be subject to fraud (including fictitious actors and websites). Arrive will not ask you to pay upfront for any dedicated lane or committed capacity program. If the offer you are receiving sounds too good to be true or unrealistic, it may be fraud. Arrive Logistics recommends verifying all communications come from our registered email domain is @arrivelogistics.com and notes that access via VPN or Proxy is prohibited on Arrive systems. Our 24/7 phone number is 888-861-0650 and our leadership team can also be reached at feedback@arrivelogistics.
Use of Cookies
We use cookies to enhance your browsing experience, serve personalized ads or content, and analyze site traffic. By continuing to use this website, you acknowledge and consent to our use of cookies as detailed in our privacy policy.
If you’re not an Arrive customer, please join our network to access the portal.
"*" indicates required fields

Scott Sandager is the Chief Administrative Officer at Arrive Logistics. He joined Arrive in 2018, bringing over 14 years of logistics and brokerage experience, with expertise in project and change management, organizational design, talent development and customer satisfaction. Scott previously held many diverse roles of increasing responsibility with AFN, a Chicago-based freight brokerage.

Eric Dunigan is the President of Arrive Logistics. He began his career at Command Transportation before co-founding Arrive with Matt Pyatt in 2014. As president, he is responsible for driving revenue and growth, as well as leading the Strategic Partnerships team — a veteran group of supply chain experts who work with Arrive’s customers to reimagine their shipping strategy.
"*" indicates required fields

David Spencer is the Vice President of Market Intelligence at Arrive Logistics. David joined Arrive in 2017 after spending six years at AFN focused on business intelligence. His department provides critical market data and expert analysis to internal teams and publishes monthly market updates for shippers and carriers under the Arrive Insights banner.

Andrew Clarke is Board Chairman for Global Critical and DCLI, Inc., and a board member for Arrive Logistics and Element Fleet Management Corp. His 20 years of global transportation and logistics experience include time as CFO of C.H. Robinson, CEO of Panther Expedited Services, Inc. and SVP and CFO roles at Forward Air Corporation.

Dean Croke is a Market Analyst at DAT Solutions, where he focuses on freight market intelligence and data analytics. His 35 years of experience with data analytics, transportation, supply chain management, mining and insurance risk management include time as co-founder of FleetRisk Advisors and in a number of other high-level roles with FreightWaves, Spireon, Lancer Insurance, Omnitracs Analytics (formerly Qualcomm) and more.

Asanka Jayasuriya is the CTO at 8VC. He is an accomplished engineering and product leader with 20+ years of experience in the cloud. He has a strong background in enterprise SaaS, PLG products, infrastructure, and security. Notably, he served as CTO and SVP of Engineering at SailPoint, leading their successful transition to the cloud and successful exit event. He also held senior leadership roles at InVision, Atlassian, and Amazon, driving growth, operational excellence, and innovation. At 8VC, Asanka works with the entrepreneurs and leaders in our portfolio as a virtual CTO supporting their growth.

Chad Eichelberger is the President of Reliance Partners. Since 2015, he’s leveraged his extensive experience in risk management, compliance, best practices and contracts to lead the company’s logistics and truck insurance strategy and operations. Chad was previously the President of Access America Transport, where he led the company from $8M to over $600M in revenue.

Barry Conlon is the CEO and founder of Overhaul, the global leader in active supply chain risk management and intelligence. With a remarkable career spanning over 30 years in supply chain security, he is widely regarded as a trailblazer in modern-day supply chain security standards and best practices.

As VP and Senior Analyst at ACT Research, Tim analyzes commercial vehicle demand and alternative powertrain development (i.e. electrification), and authors the ACT Freight Forecast, U.S. Rate and Volume Outlook. He previously spent fifteen years in equity research focused primarily on the transportation, machinery, and automotive industries, and co-founded leading equity research firm Wolfe Research.
"*" indicates required fields
