


Shippers have been thrilled to see spot rates tumbling at an unprecedented rate over the past several months, but what’s causing this sudden shift in conditions?
We have no clear indication that demand has declined, and it’s hard to believe that the capacity constraint challenges of the last two years have suddenly resolved. Thus, we believe the shift was triggered by the sudden spike in diesel fuel prices and exacerbated by a historic seasonal demand slowdown.
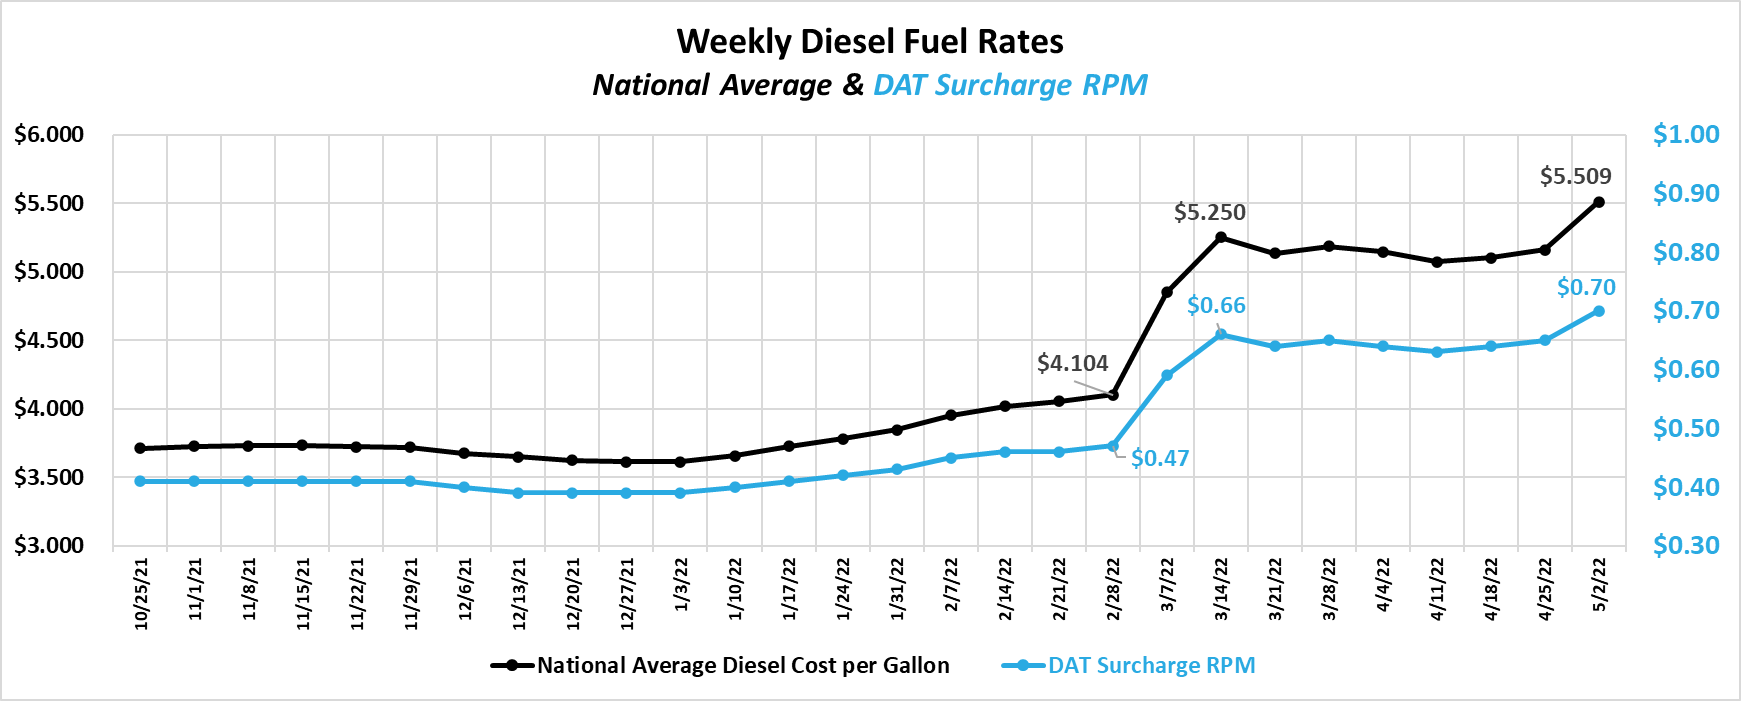
At the onset of the conflict in Ukraine, fuel prices surged for back-to-back weeks, sparking a sudden rise in fuel recovery rates. Referencing the DAT’s methodology for calculating fuel surcharge rates, the change amounted to $0.19 per mile in those two weeks. As of today, the total increase is $0.23 per mile, resulting in a significant rise in carrier pay. For example, for a 1,000-mile run, carriers are now earning an extra $230 in fuel recovery alone.
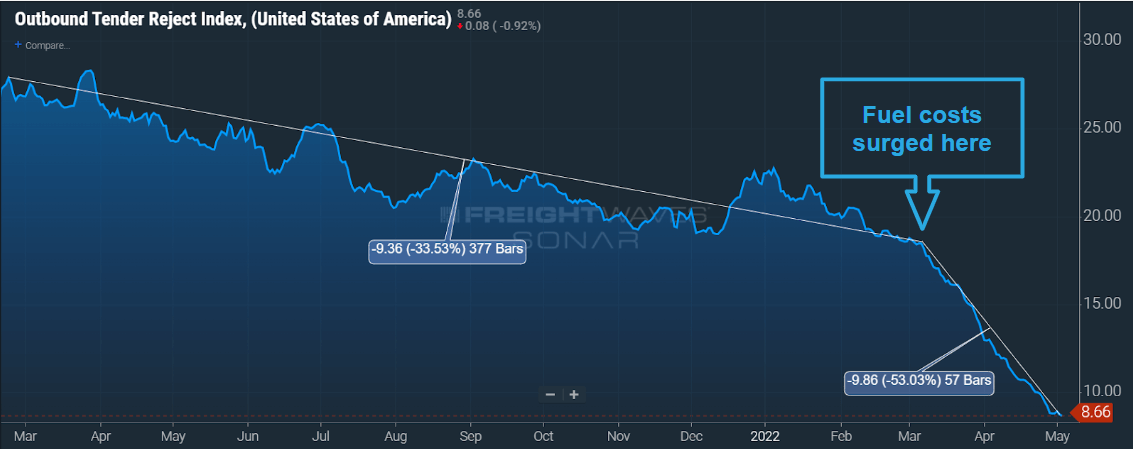
Considering fuel surcharge agreements are almost exclusively associated with contract freight, carriers have been accepting more contract loads instead of turning to the spot market. The sudden shift in acceptance rates is evident in the tender rejection data — after falling roughly 33% over the prior year, the rejection rate decreased by an additional 53%.
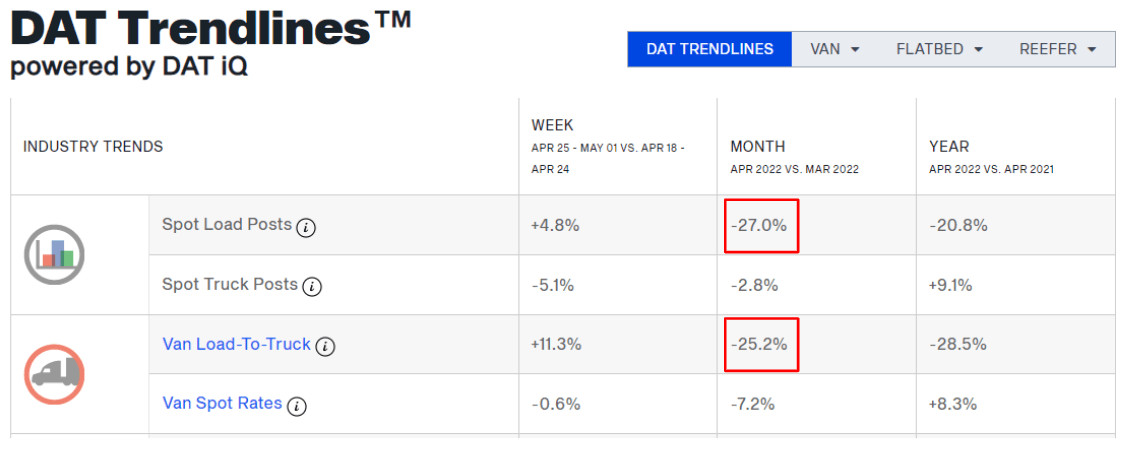
When tender rejections decline, less overflow freight falls to the spot market. We observed a 27% decline in spot load posts from March to April, clear evidence of declining spot market demand. Thus, carriers who entered the spot market over the past two years to cash in on high rates are seeing spot opportunities dry up, to the tune of a 25% spot load-to-truck ratio decline for the month. As spot rates continue plummeting and carriers compete more fiercely for every load, contracted carriers are enjoying record-high rates in the wake of the shift.
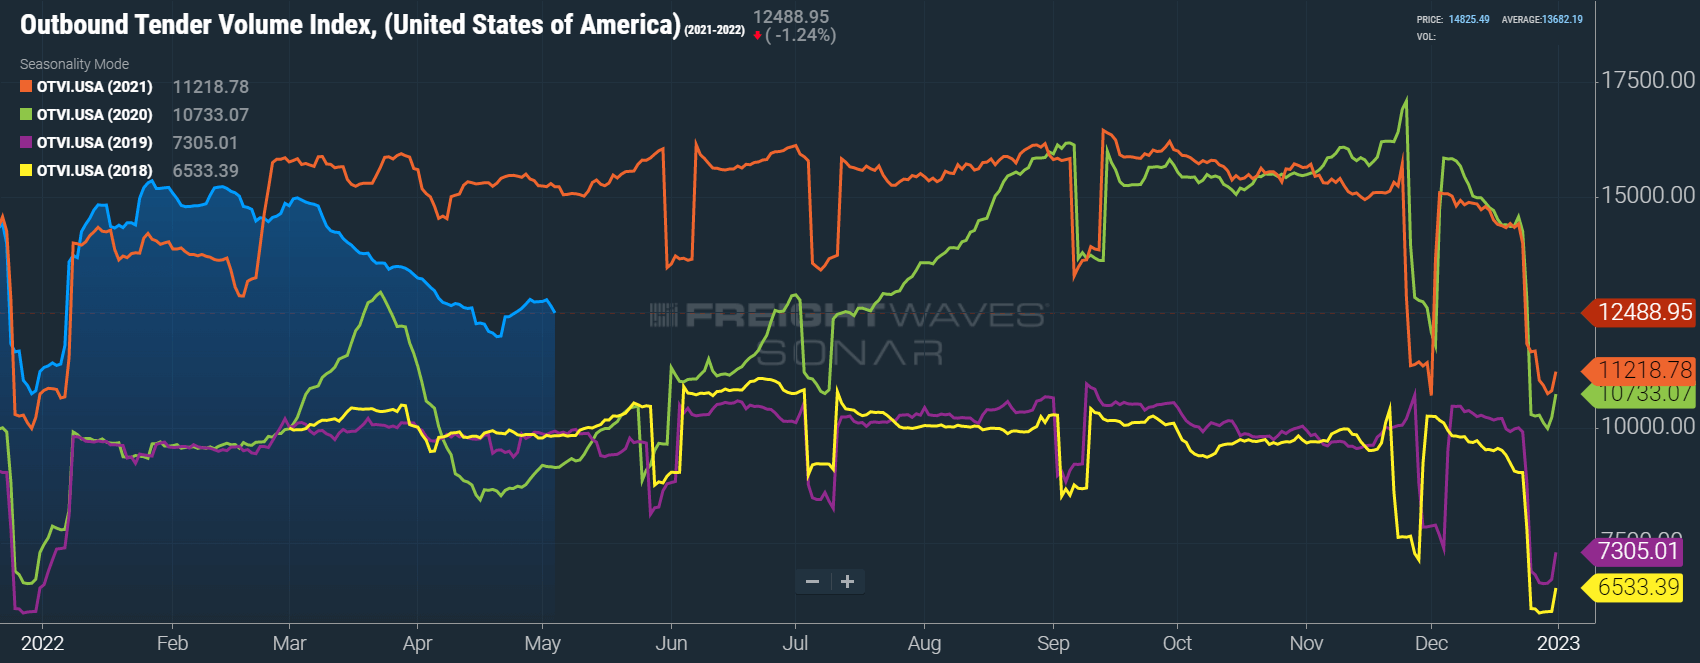
Typically, this shift might indicate that freight demand is declining, but that doesn’t appear to be the case. Spot market opportunities and rates are indeed dropping; however, because consumer demand remains strong, we saw a massive uptick in contract rate compliance leading to increased volumes moving on primary carriers. OTRI adjusted tender volumes (accepted tenders) have also increased year-over-year despite total tender volumes declining by more than 16% as of early May. Over time, larger economic forces may impact truckload demand more significantly. For now, though, we believe these trends indicate a demand shift rather than a decline.
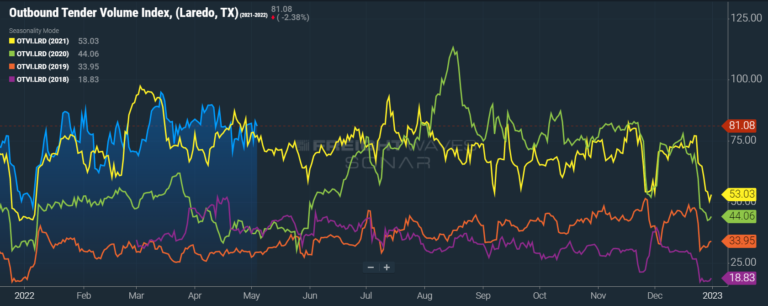
The FreightWaves SONAR Outbound Tender Volume Index (OTVI), which measures contract freight volumes across all modes, was down 16.1% year-over-year in early May.
Of course, it is important to note that OTVI includes both accepted and rejected load tenders, so we must discount the index by the corresponding Outbound Tender Rejection Index (OTRI) to uncover the true measure of accepted tender volumes. Applying this method to the year-over-year OTVI values, the downward growth trend in tender volumes flips to an increase of 1.1%. Tender rejections are also down 64% from 24.25% a year ago to 8.74% as of this Monday, May 2nd, helping to explain the increase in accepted tender volumes, despite the large decline in total tender volumes.
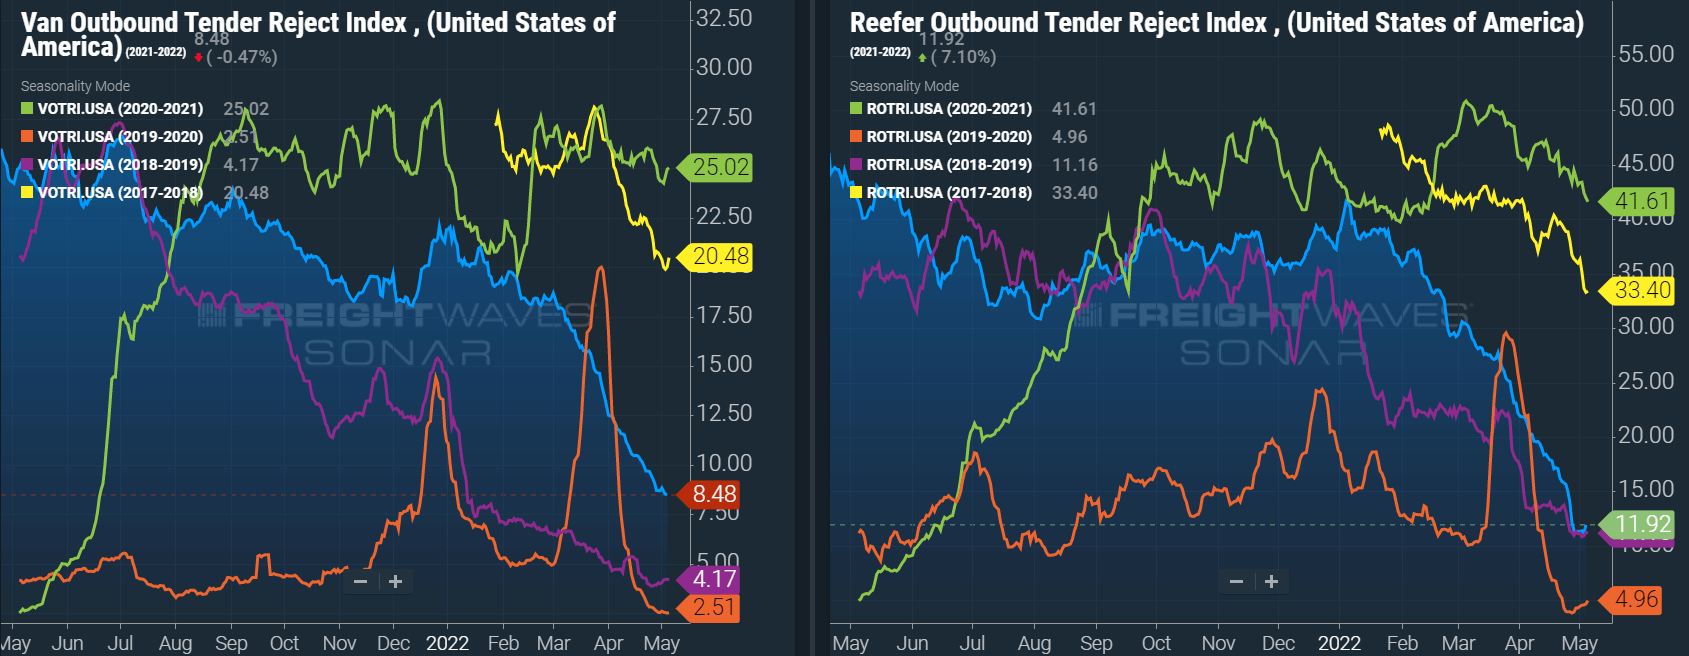
Let’s look next at trends for specific equipment types. The dry van tender volume index was down 16.2%, and the reefer tender volume index was down by 36.9%. This equates to a 1.0% year-over-year increase and a 1.1% decrease in actual volumes for the two modes, respectively. As of May 1, dry van tender rejections were down by more than 64% year-over-year. For refer equipment, that number was 73%. This resulted in a flip to favorable dry van growth rates and only a slight decline in reefer rates when considering actual accepted tender volumes.
DAT data indicates that year-over-year spot volumes were down by more than 20% in April, down from more than 100% growth in January, 24% in February and 3.7% in March. This trend helps showcase the slowing increase in demand, which is still trending at historically high levels.
The sharp decline in spot volume growth is in line with the decline in tender rejections, as fewer loads are landing on spot boards. The 4.8% week-over-week increase in the first week of May indicates that the decline in spot demand might be leveling off; this is in line with expected seasonal tightening in mid to late May when produce season and peak summer conditions begin ramping up.
FTR and Truckstop’s Total All Mode Spot Volume Index helps illustrate that while spot volumes may be down from last year and the early part of this year, they remain above where they were anytime before last year. The All Mode index is now down 22.4% year-over-year, but up 135% from 2019. Recent spot volumes have also trended up in early May.

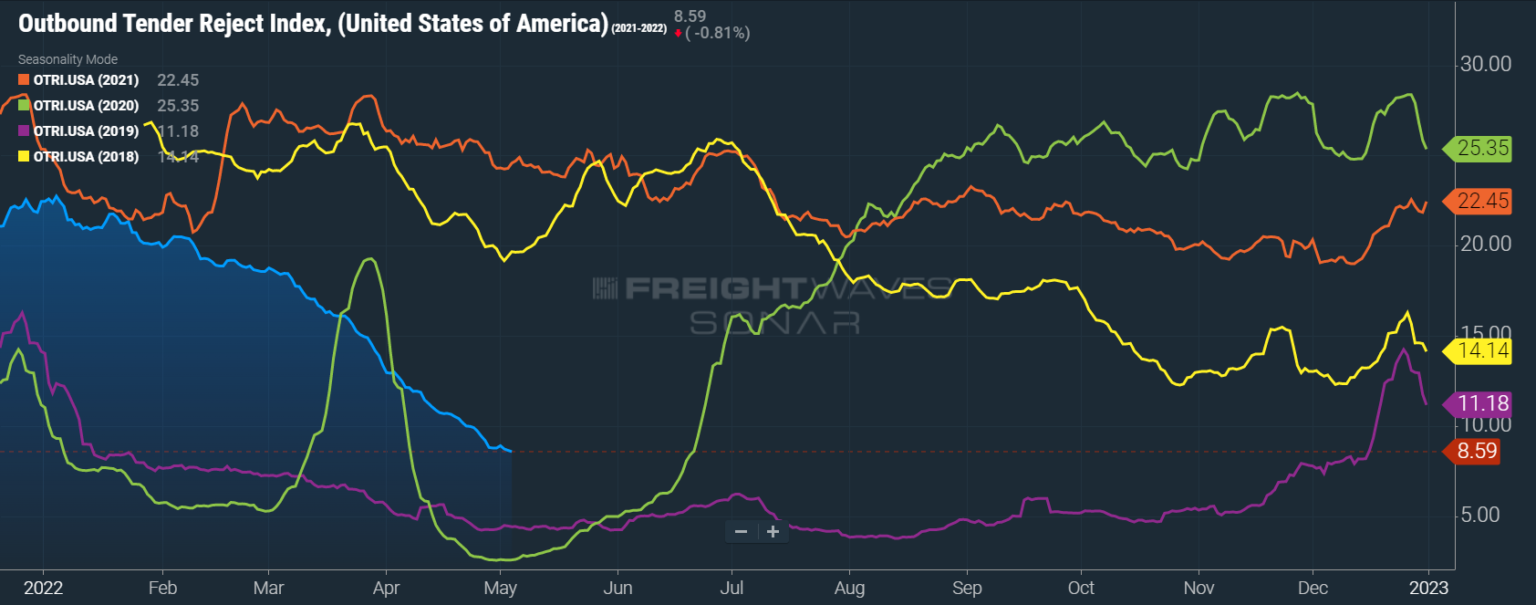
The Sonar Outbound Tender Reject Index (OTRI) measures the rate at which carriers reject the freight they are contractually required to take. The current rate is 8.59% in early May, following rapid declines over the past two months from 18.77% in early March.
Just how low rejection rates will go remains unknown, but the next four to six weeks will be very telling. If they continue falling through the upcoming CVSA Roadcheck and peak season surge between Memorial Day and July 4th, it might indicate that these conditions are here to stay. At that point, rates would likely approach equilibrium levels of 5% or less. We last saw this through much of 2019, the softest market in recent memory.
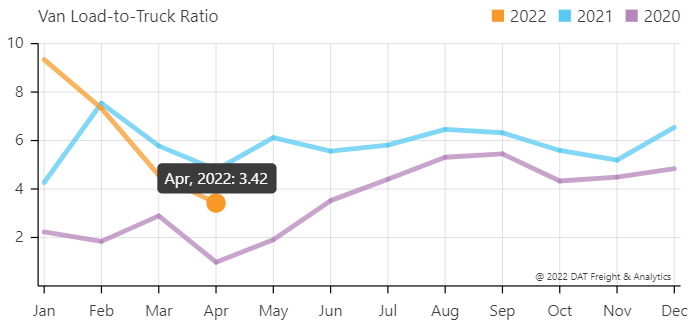
The DAT Load to Truck Ratio measures the total number of loads compared to the total number of trucks posted on their load board.
In April, the Dry Van Load to Truck Ratio decreased to 3.42, down 25.2% month-over-month and 28.5% year-over-year.


The Reefer Load to Truck Ratio also fell to 6.28, down 25.0% month-over-month and 36.6% year-over-year.
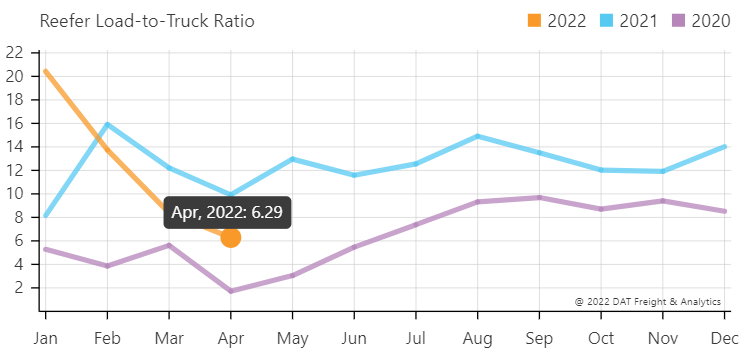
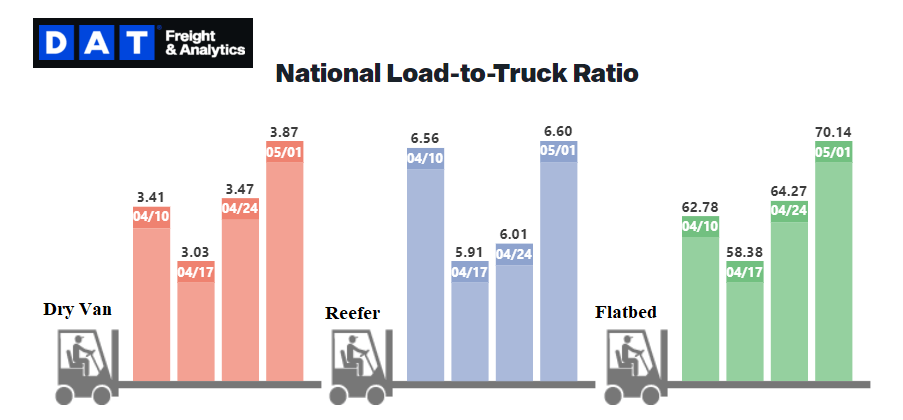
The weekly load to truck ratios showed a slight tightening at the end of the month; this is typical as May begins and indicates that the recent rate slide could settle as we enter peak season. As with OTRI measures, Load to Truck ratios for van and reefer equipment are approaching levels we would expect to see in equilibrium markets.

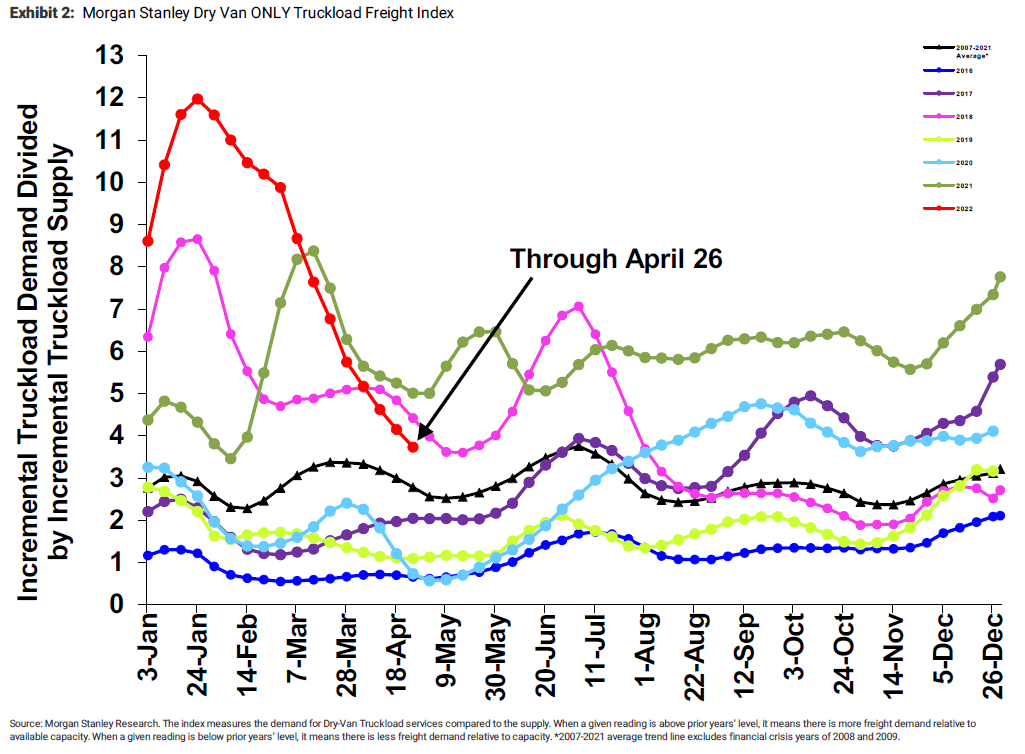
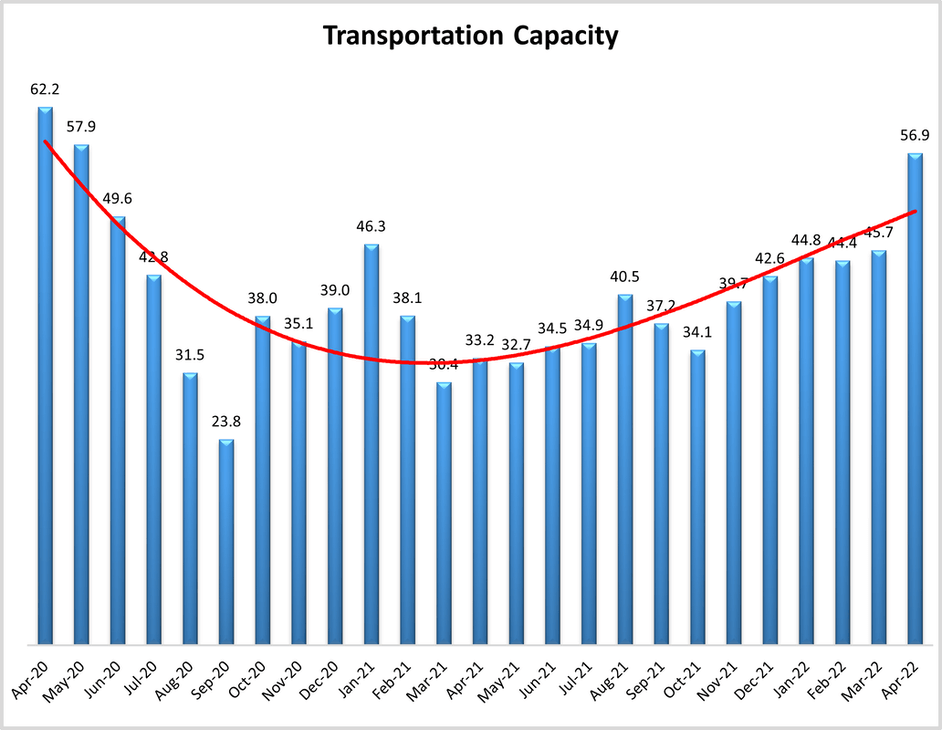
The Morgan Stanley Dry Van Freight Index is another measure of relative supply. The higher the index, the tighter the market conditions.
Last month, conditions trended in line with DAT and Freightwaves SONAR data, easing rapidly through March and April after a more stable downward trend throughout February. The black line with triangle markers on the chart provides a great view of what directional trends would be in line with normal seasonality based on historical data dating back to 2007. This data would lead us to believe that conditions will tighten in mid-May. Given that Memorial Day to July 4th is typically peak season for the freight market, we expect the trends we see during this will provide a relatively accurate forecast for how the rest of the year will unfold.
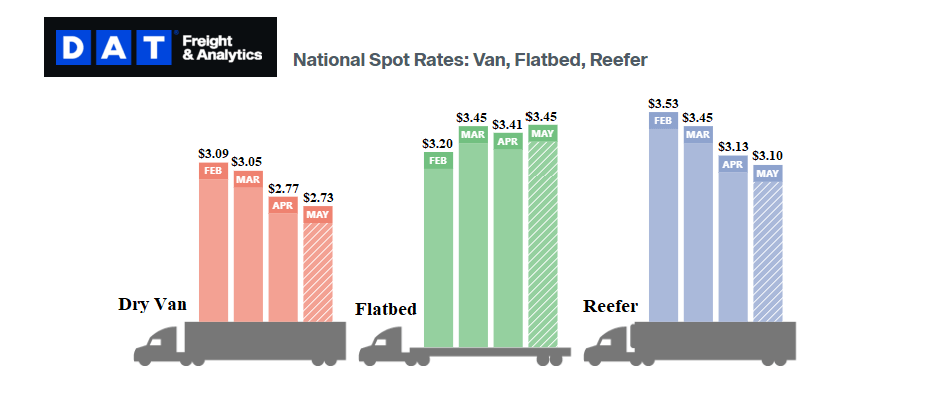 Rate declines due to easing conditions in the spot market and typical seasonal slowdowns continued throughout April and into early May for dry van and reefer equipment. Since March, flatbed rates have remained elevated as construction season has been active, particularly in warmer regions. Normal seasonality would indicate that we should expect to see some upward pressure on spot rates starting in mid-May when summer peak season begins, although recent trends are signaling that upward rate pressure may not be as signifcant this year.
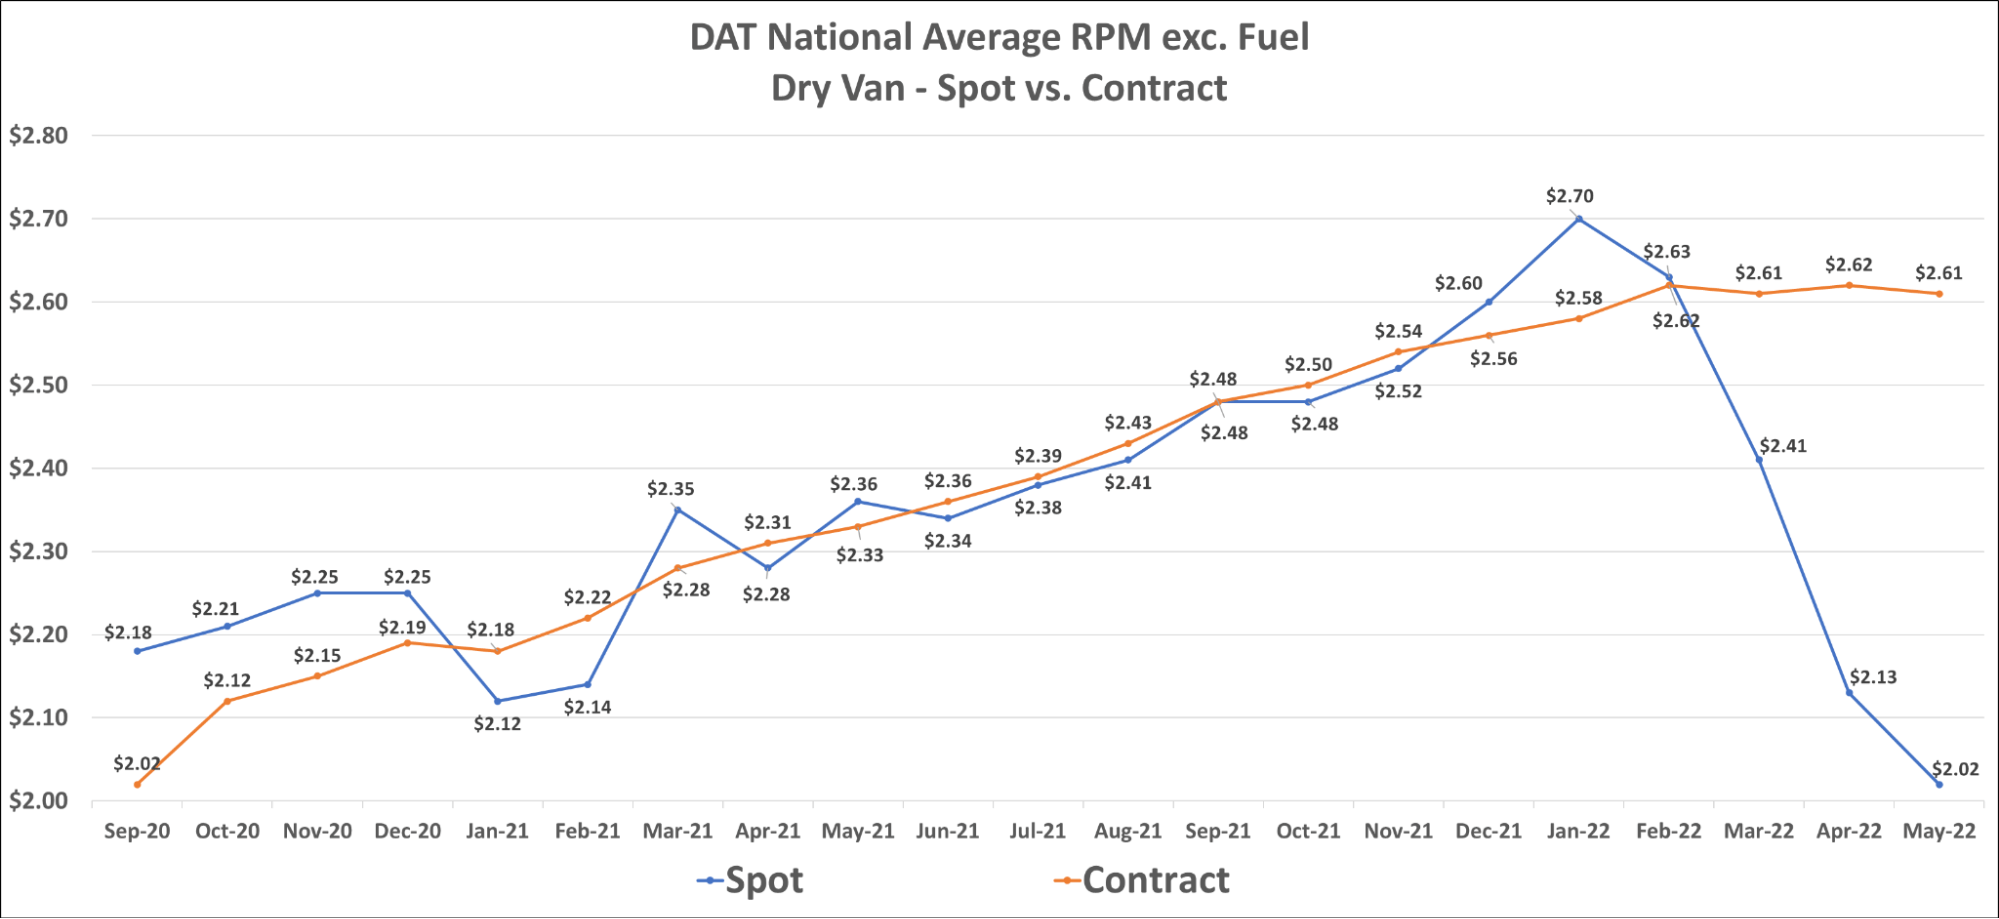
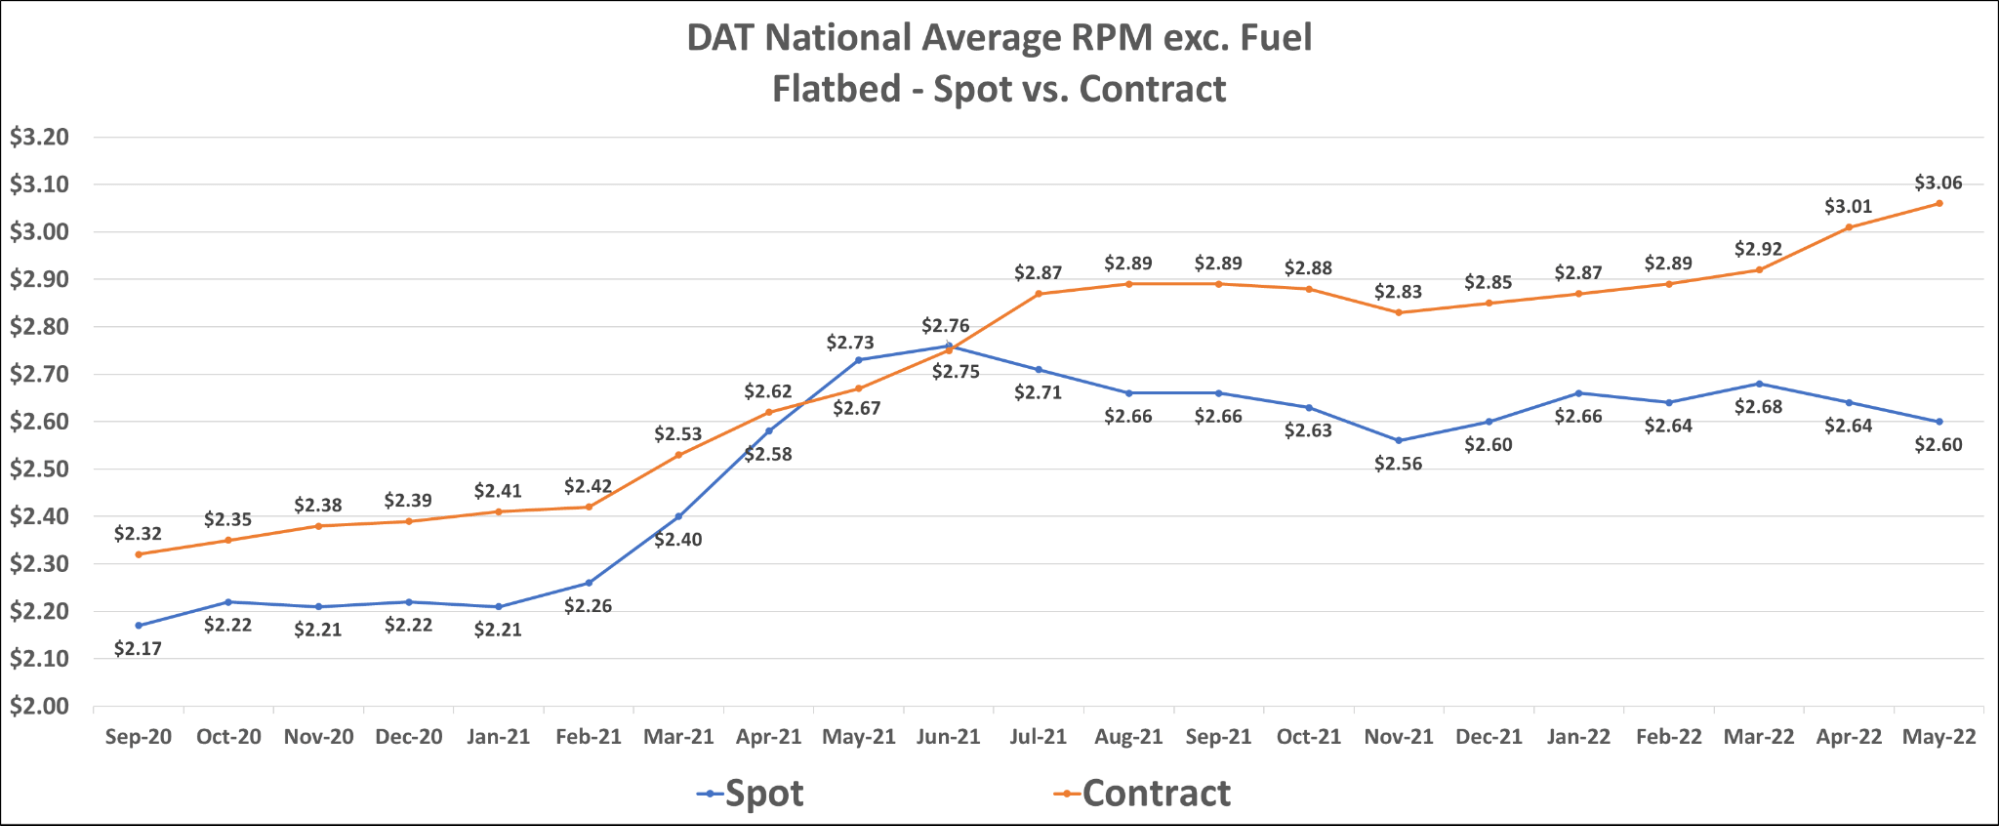
Dry van contract rates remained strong and currently sit at $2.61 per mile, excluding fuel. Historically, when spot rates fall quickly as deflationary market conditions set in, it takes a long time for contract rates to follow. Over the past two years, many shippers who wanted contractual coverage opted to host pricing exercises and RFPs more frequently to maintain routing guides as rates climbed month after month.
We believe many shippers will execute this same approach now that rates have fallen so they can capitalize on lower costs. With the national average spot rate sitting nearly $0.60 below the national average contract rate, shippers who do not make adjustments are leaving money on the table.
For the second straight month, reefer contract rates are down and currently sit at $2.66 per mile, excluding fuel. The contract rate declines are not nearly as rapid as reefer spot rates, which have collapsed nearly as quickly as dry van spot rates. The flatbed market is seeing continued contract rate increases year-to-date, currently sitting at $3.06 per mile, excluding fuel.


 Current freight market trends point to capacity being better equipped to handle demand than it has been, which has generated improved tender acceptance rates from contractual carriers and sparked deflationary pressures in the spot market. Shippers welcome this change, but they could motivate a shift in carrier strategy. The gold rush that was the spot market over the past two years is coming to an end, and carriers who play in the spot market are seeing the higher-paying opportunities they’ve grown used to dry up.
We believe this trend will make drivers and equipment more available to the larger fleets who have access to contractual freight. Transport Topics reported that J.B. Hunt sold off some of their equipment in the first quarter but more than made up for the loss of capacity as its fleet of independent contractors increased from 918 to 1,527 tractors in just one year. This trend is driving capacity out of the spot market and making it more accessible to larger shippers, which is a big reason for tender acceptance strength.

As capacity moves from the spot market to larger carriers in the form of leased assets, demand for new equipment will likely continue to wane. This was seen in the most recent month, as new truck orders fell significantly. Additional equipment is still in demand, but the slowing of orders has eased backlogs and driven down the average time from order to delivery from 11.6 months in February to 9.8 months in March, despite production rates still being heavily restricted by semiconductor shortages.


New trailer production levels improved by 8% in March, up from 2% growth in February, which is a sign that trailer OEM’s are continuing to make progress in overcoming supply chain challenges.
FTR’s forecast for truck utilization — the share of seated trucks actively engaged in freight hauling — is slightly stronger than last month, with the expectation that it is now to remain at or above 97% through 2023. However, risks remain mainly to the downside.

 The outlook for freight demand remains dominated by downside risks. Inflation is at a 40-year high, global energy prices brought about by the ongoing conflict in Europe are approaching crisis levels and lockdowns in China are sparking uncertainty for the future availability of goods. Suprisingly, we have not yet seen these factors weigh heavily on freight demand, however, they do present greater risk to future volumes.
Experts have not yet seen a meaningful impact from the lockdowns in China. The ports are open and freight is flowing. Factories inland have not seen lockdowns and are still producing goods. In many cases, these goods are being rerouted to other ports to avoid the lockdowns and still set sail to the U.S. via other ports. Should factories inland see COVID issues, the concerns may increase, but as of now, the belief is that China is working hard to maintain export levels and should be able to recover quickly from any slowdowns as soon as lockdowns are lifted. In southern California, we are seeing even more ships waiting offshore than we were a year ago; this backlog, in addition to continued elevated inventory levels at U.S. warehouses, should continue to support healthy domestic freight volumes.

The backlog in manufacturing and industrial production represents the potential for continued growth in related freight demand as supply chain and labor challenges ease. These backlogs do not provide any guarantees, as demand would fall if the economy faces headwinds. However, at this point, at least a few months worth of normal production levels would be needed to replace worn-out or obsolete equipment or restore depleted inventories in the automotive sector.

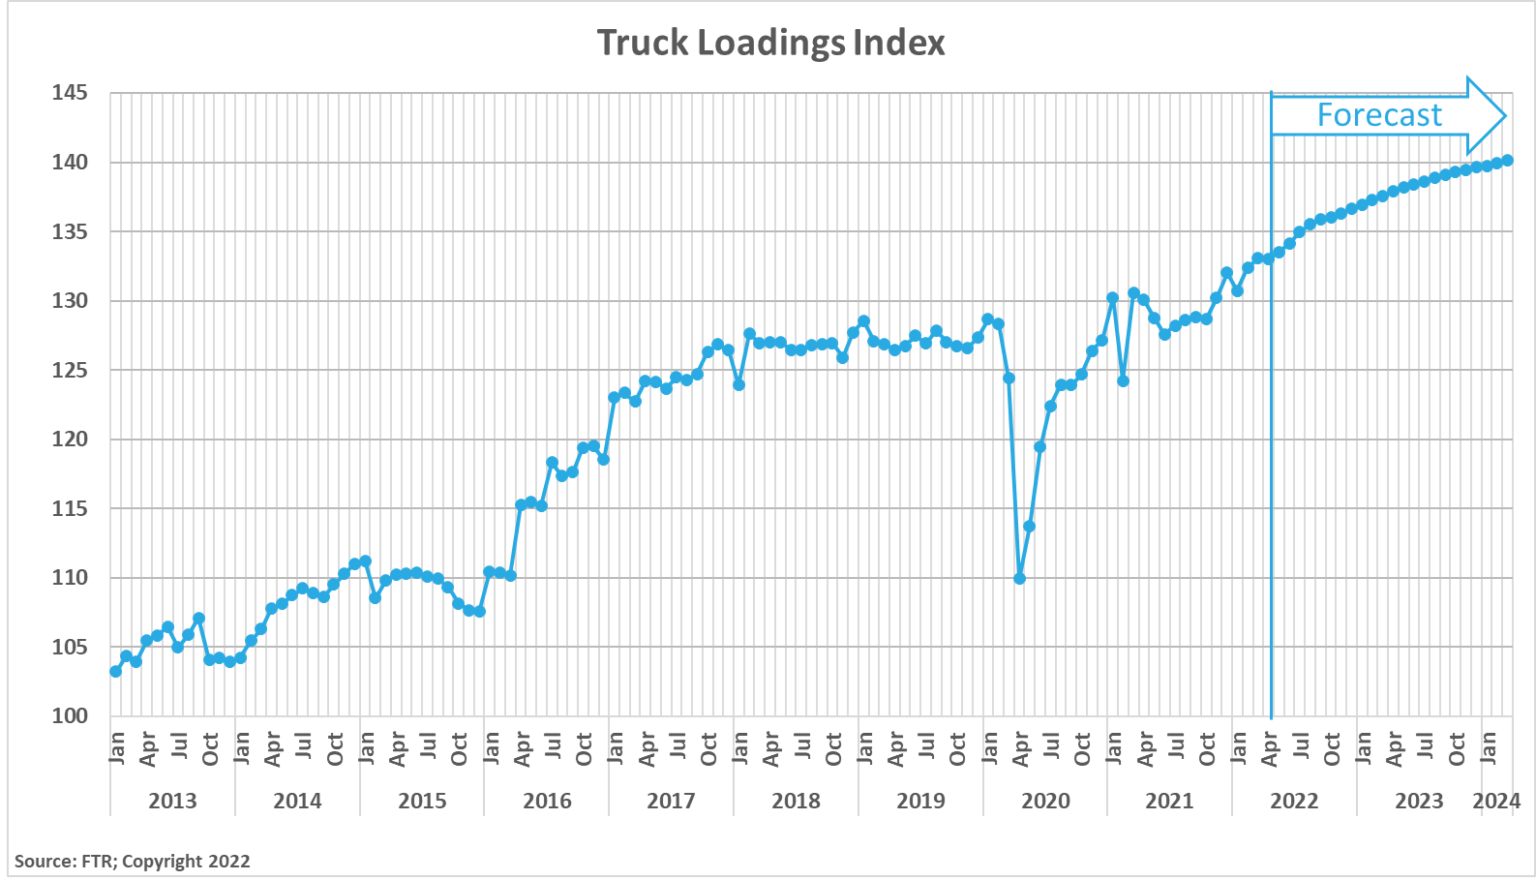
FTR’s latest truck loadings forecast shows a slight increase in the estimate for the growth rate in 2022, forecasting truck loadings for the year to grow by 4.2%, up from 4.1% as of last month. The forecast indicates growth for each of the three years from 2022 through 2024. That growth is projected to continue at a slowing rate, but grow, nonetheless. Time will tell if rising inflation and other downside risks to demand will impact their forecast, but for now, all equipment segments should expect to see demand strength for the foreseeable future.


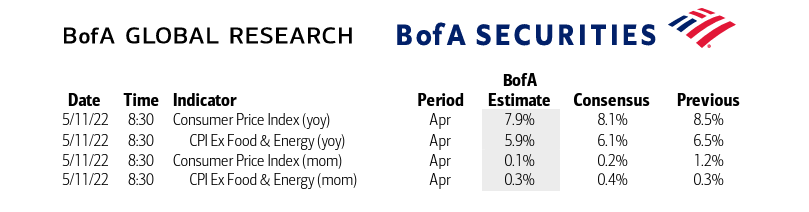 Although April CPI results are yet to be published, estimates indicate continued but slowing growth. In March, prices peaked at 8.5% above a year earlier; 6.5% when excluding food and energy. In April, Bank of America expects those numbers to fall to 7.9% for total CPI and 5.9% excluding food and energy despite month-over-month increases.
The Bank of America (BofA) consumer spending data provides visibility into changing consumer behaviors and spending patterns. Total card spending is up 13% year-over-year and 24% compared to 2019 in April. These numbers indicate consumer spending has maintained strength despite surging prices at the pump and inflationary pressures. The spending growth was driven by sharp spending increases in travel and entertainment. Spending rose across all income brackets in the month, but spending for lower income levels appeared to flatten out as the month progressed..