

"*" indicates required fields
"*" indicates required fields
"*" indicates required fields

May 2021
The Arrive Monthly Market Update, created by Arrive Insights, is a report that analyzes data from multiple sources including but not limited to FreightWaves SONAR, DAT, FTR Transportation Intelligence, Morgan Stanley Research, Bank of America Internal Data, Journal of Commerce, Stephens Research, National Retail Federation and FRED Economic Data from the past month as well as year-over-year.
We know that market data is vital to making real-time business decisions, and at Arrive Logistics, we are committed to giving you the data you need to better manage your freight.
Listen to this month’s Market Update!
Capacity conditions are expected to deteriorate further as the second quarter progresses, driven by a strong outlook for demand and continued challenges for carriers looking to add capacity quickly. This will lead to a continuation of the active spot market and increasing truck costs in the coming months. The forecast for the back half of the year depends on carriers’ ability to add drivers and new equipment to levels sufficient enough to support volatile demand trends.
• Freight volumes have remained steady throughout April and are expected to rise as the summer peak shipping season gets underway in mid to late May.
• As we enter the summer peak season, shippers with the ability to enter into short-term contracts can take advantage of consistent, reliable capacity on high volume lanes, while also limiting risk of rates falling later in the year.
• Truckload supply has remained highly constrained in April, a month that typically sees some softening driven by normal seasonality.
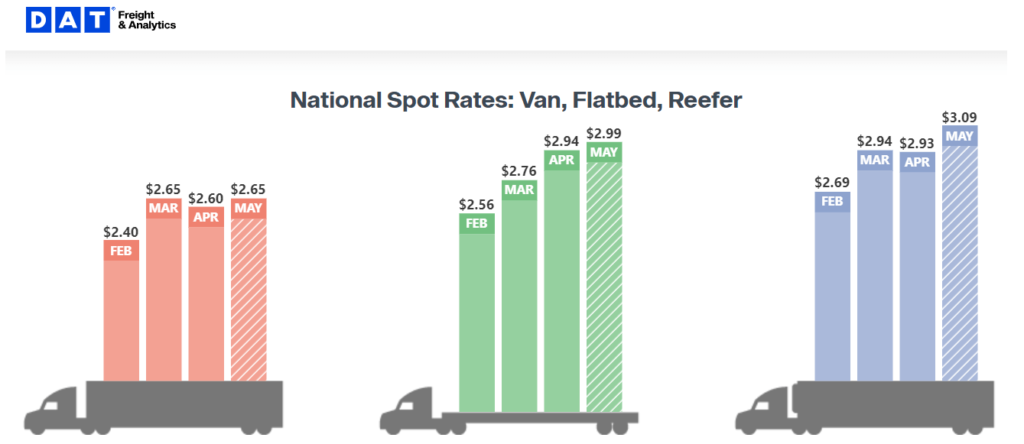
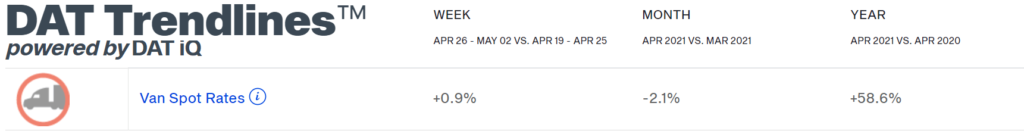
• Dry van spot rates fell slightly in April but have already returned to an all-time high of $2.65 per mile, previously only seen in March 2021.
• Carriers are demanding a growing premium on their committed capacity, resulting in contract rate increases for the twelfth straight month. The YTD national average contract rate, excluding fuel, has increased 13% from $2.39 per mile in January to $2.69 in May.
• The biggest obstacles for truckload supply recovery continue to be semiconductor shortages, causing delays in new truck production and ongoing driver availability issues.
• An improving economy, restocking of depleted inventories and normal seasonal trends such as produce and summer peak seasons should support healthy demand trends in the coming months.
Tender Volumes are representative of nationwide contract volumes and act as an indicator of Truckload Demand
Tender Rejectionsindicate the rate at which carriers reject loads they are contractually required to take and acts as an indicator of the balance between Truckload Supply and Demand
New Truck Orders is an indicator of the trucking industry’s health and carrier sentiment, as carriers typically invest in new trucks when demand and optimism are high.
Industrial Production measures the output of the industrial sector, including mining, manufacturing and utilities.
US Customs Maritime Import Shipments, China to the United States measures the total number of import shipments being cleared for entry to the U.S. from China.
Rate Spread measures the difference between the national average contract rate per mile and the national average spot rate per mile and is closely inversely correlated to movements in tender rejections and spot market volumes.
Weekly Jobless Claims are used as a barometer for the pace of layoffs in the general economy.
Unemployment Rate is the number of people who are unemployed that are actively seeking work.
"*" indicates required fields
Freight volumes remained near all-time highs in April. The surge of activity that kicked off after the winter storms did not let up as produce season ramped up; port activity remained at an all-time high; and the economy continued its rapid recovery. Shippers struggled to maintain their routing guides, which kept spot volumes high throughout the month. Freight volumes have remained elevated in early May and are expected to increase as we approach Memorial Day, which is traditionally when the summer peak shipping season gets underway. Many shippers have also taken a cautious approach and have limited freight volumes this week to try and avoid the capacity crunch associated with CVSA International Roadcheck. This could result in a larger than expected increase in demand next week as shippers look to make up lost ground.
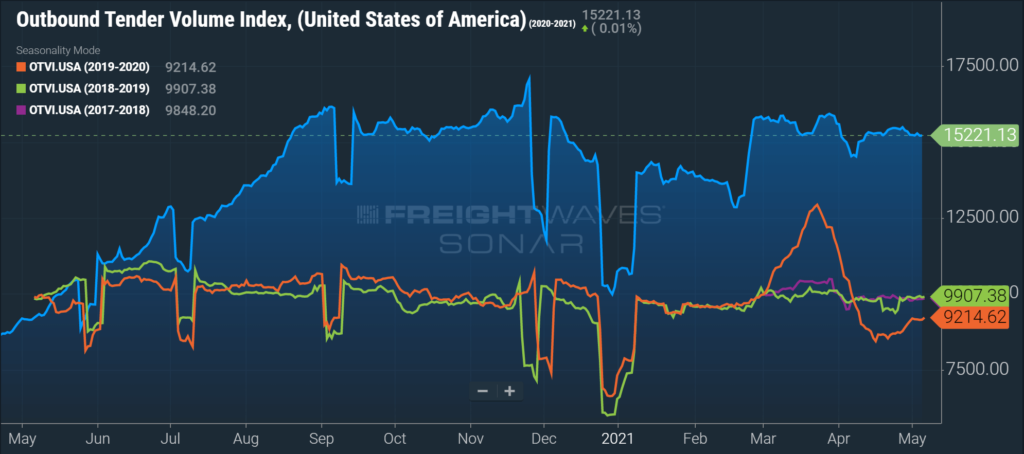
FreightWaves SONAR Outbound Tender Volume Index (OTVI), which measures contract freight volumes across all modes, was up by 68% year-over-year on April 30th. It is important to note that OTVI includes both accepted and rejected load tenders, so we must discount the index by the corresponding Outbound Tender Rejection Index (OTRI) to uncover the true measure of accepted tender volumes. If we were to apply this method to the year-over-year OTVI values, the increase in volume drops to 30%, which is still an impressive number. The dry van and reefer tender volume indices were also up 70% and 59% year-over-year at the end of the month, which equated to a 32% increase and a -6% decrease in actual volumes for the two modes, respectively.
DAT reported that dry van spot load posts moderated slightly in April, falling by 4.3% month-over-month, but have grown by 577.3% year-over-year due to pandemic-related shutdowns in 2020. Spot volume growth slowed recently with only a 0.3% increase since last week, following the last full week of the quarter.

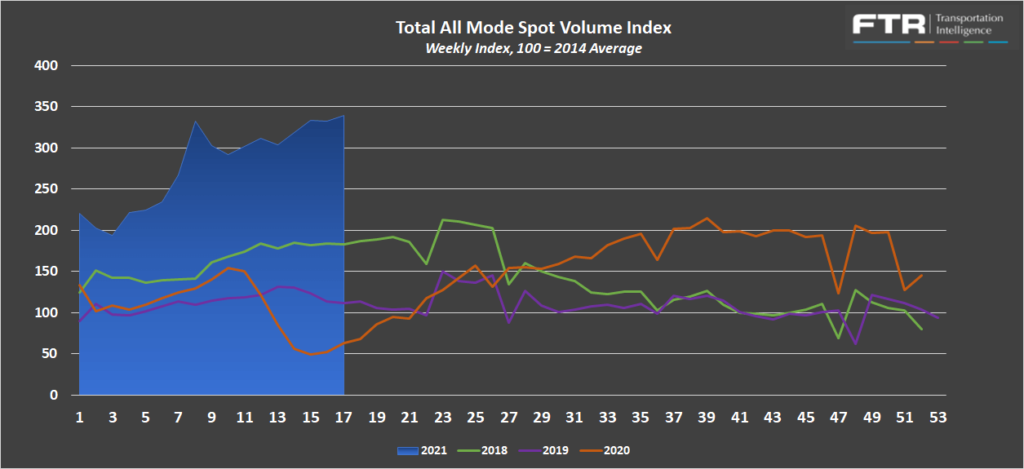
FTR and Truckstop’s Total All Mode Spot Volume Index is up 11.5% since late March and is up 435% year-over-year. The index climbed throughout the entire month, an indication of just how active the spot market has been as of late.
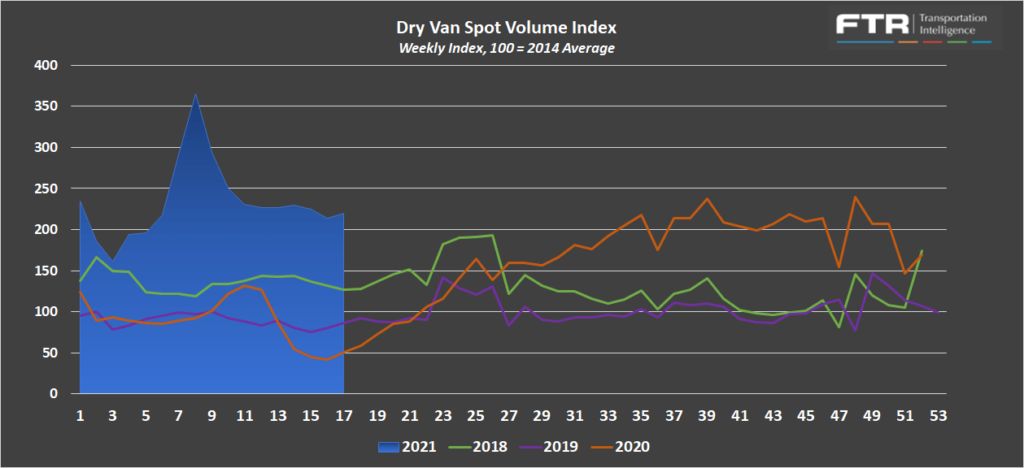
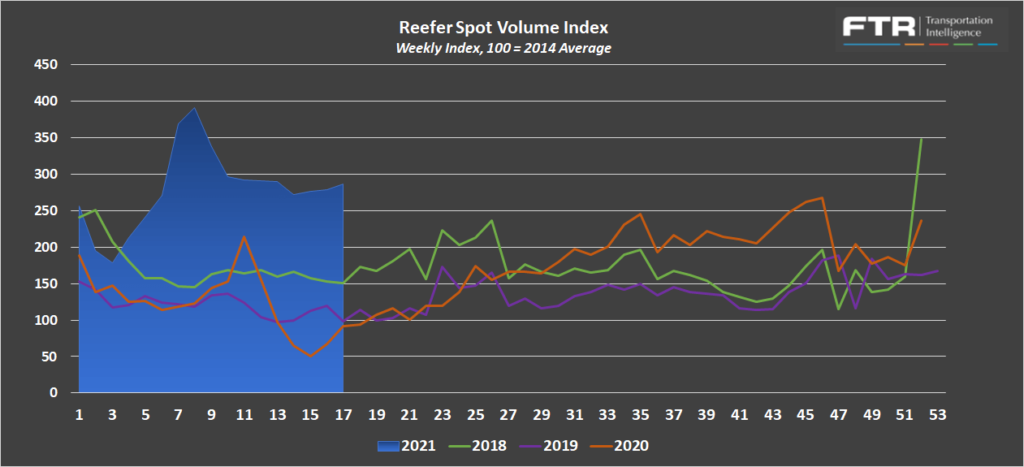
The Dry Van Spot Volume Index is down -3.1% from the high in late March but up 337% year-over-year, and the Reefer Spot Volume Index is down -1.3% and up 211% over the same time period.
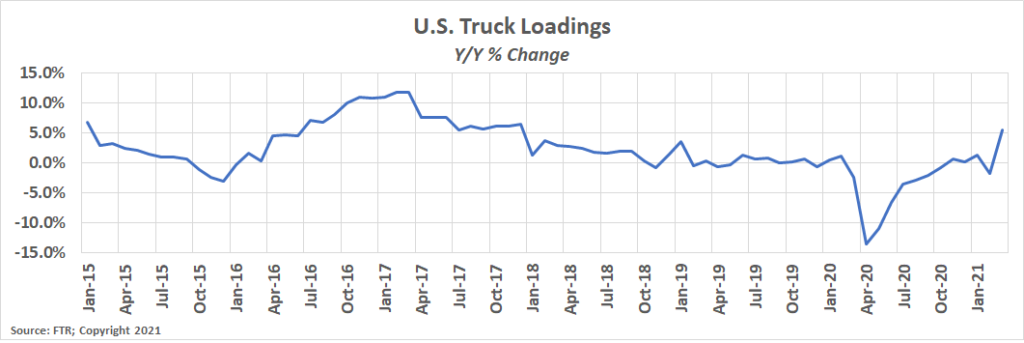
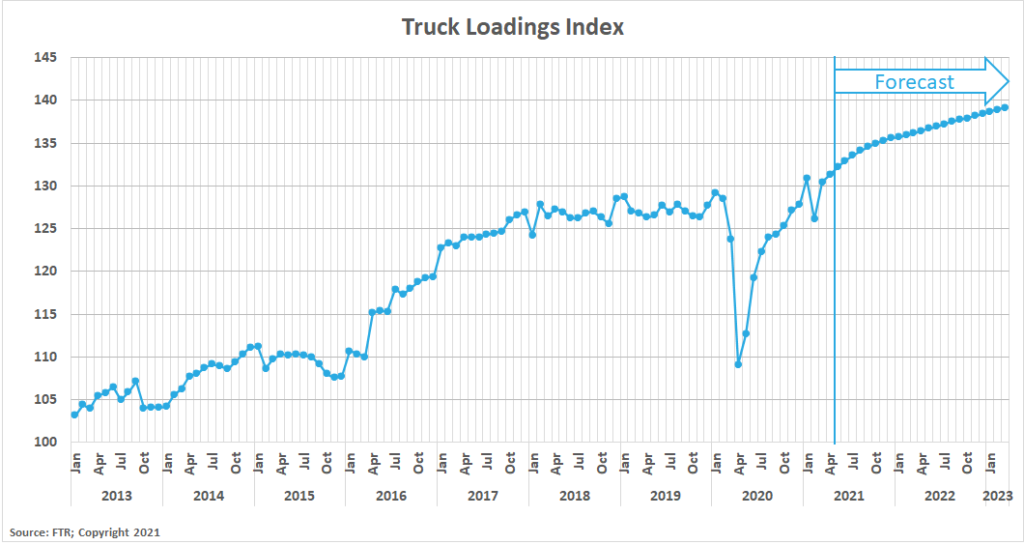
FTR’s Truck Loadings Index was up by more than 20% year-over-year in April after rising by 2.9% month-over-month from March. The pandemic lockdowns of 2020 provide favorable year-over-year comparisons, but the 2.9% month-over-month growth is the strongest since January 2020, indicating that truck loadings are on the rise. Moving forward in 2021, year-over-year comparisons will continue to be mostly irrelevant, but the two year trend should give us a better indication of monthly growth. April 2021 truck loadings were up 3.9% from April 2019 truck loadings, an increase from 2.9% in the two year period beginning March 2019.
Truckload supply remained extremely constrained in April, a month that typically sees some softening driven by normal seasonality. There was a slight improvement late in the month, but the CVSA roadcheck this week resulted in an increase in challenges for shippers, particularly those who have to rely on the spot market to source capacity.
Sonar Outbound Tender Reject Index (OTRI) measures the rate at which carriers are rejecting the freight that they are contractually required to take. This index tends to follow the changes of spot freight activity — the higher the tender rejections, the higher the spot volumes. After peaking at more than 28% on March 28th, tender rejections fell gradually throughout April. The index currently sits at 24.7% after a recent increase in the first week of May. These trends align with normal seasonality, which would indicate things are about to tighten up as we enter the summer peak shipping season. With truckload demand holding at a strong pace, available capacity will deteriorate quickly throughout the month. Shippers who can build proper lead time into their supply chain should benefit from less volatile transportation costs. Last-minute trucks are going to be costly, if available at all.
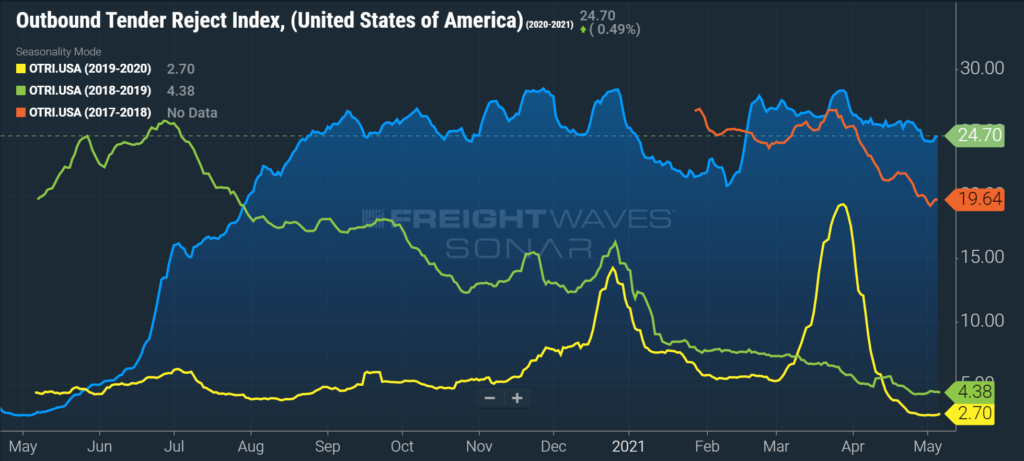
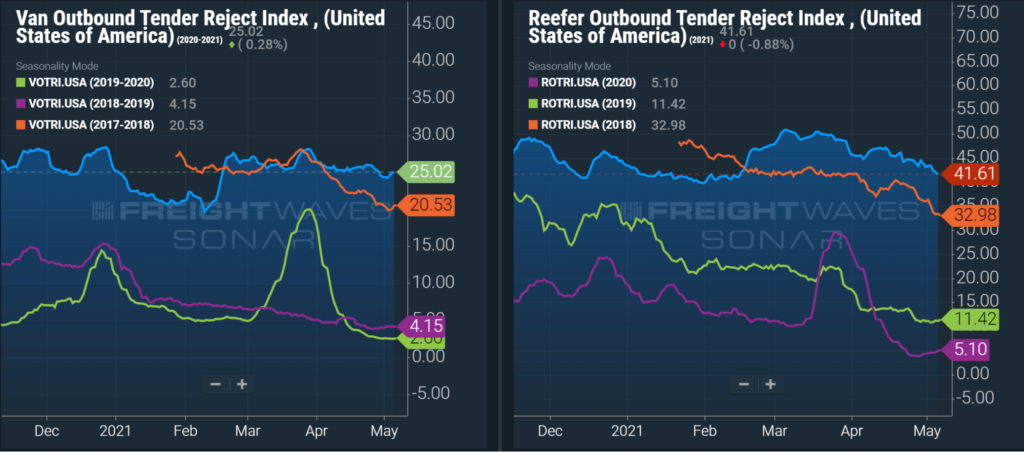
Dry van tender rejections followed a similar trend to the all-mode OTRI and currently sit at 25.02%. Reefer tender rejections, on the other hand, have continued their downward trend from their all-time high and currently sit at 41.61%. Demand for reefer equipment surged following the winter storms. Even though reefer capacity remains extremely tight, spring produce season has not increased tender rejections.
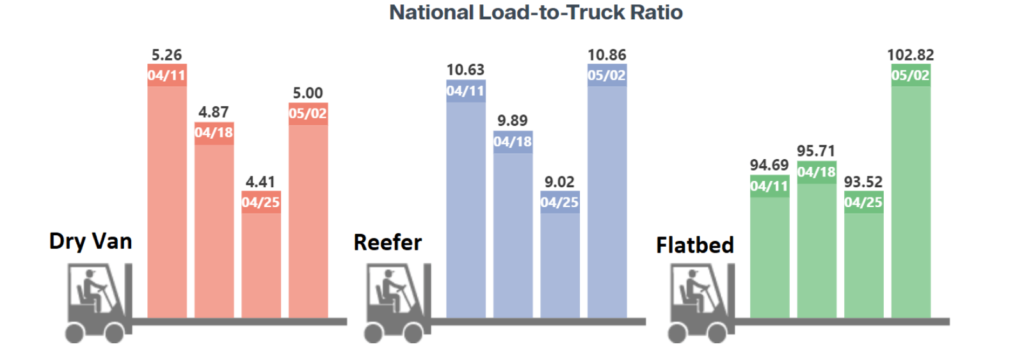
The DAT Load to Truck Ratio measures the total number of loads posted compared to the total number of trucks posted on their loadboard. In April, the Dry Van Load to Truck Ratio fell to 4.79, a decrease of 17.2% month-over-month and an increase of 386% year-over-year. The Reefer Load to Truck Ratio fell 9.92 in April, a decrease of 18.8% month-over-month and an increase of 475% year-over-year.
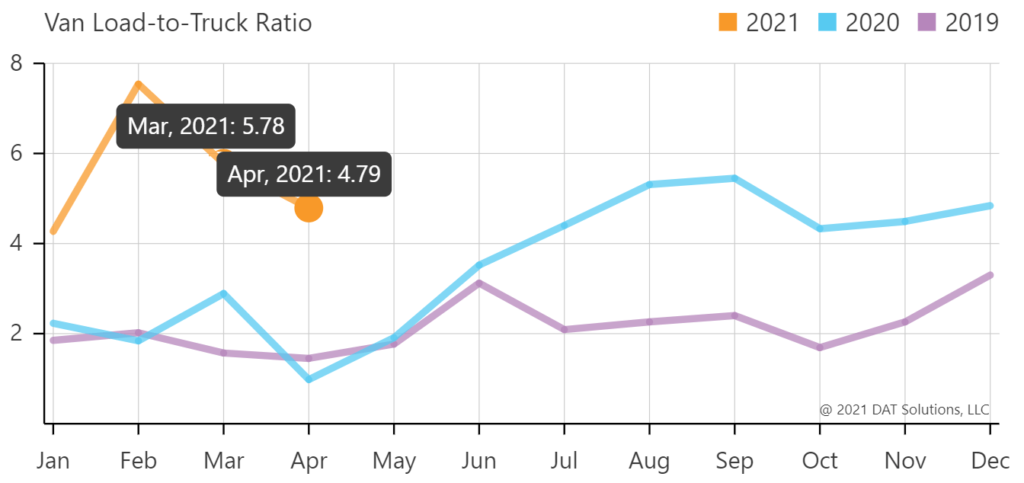
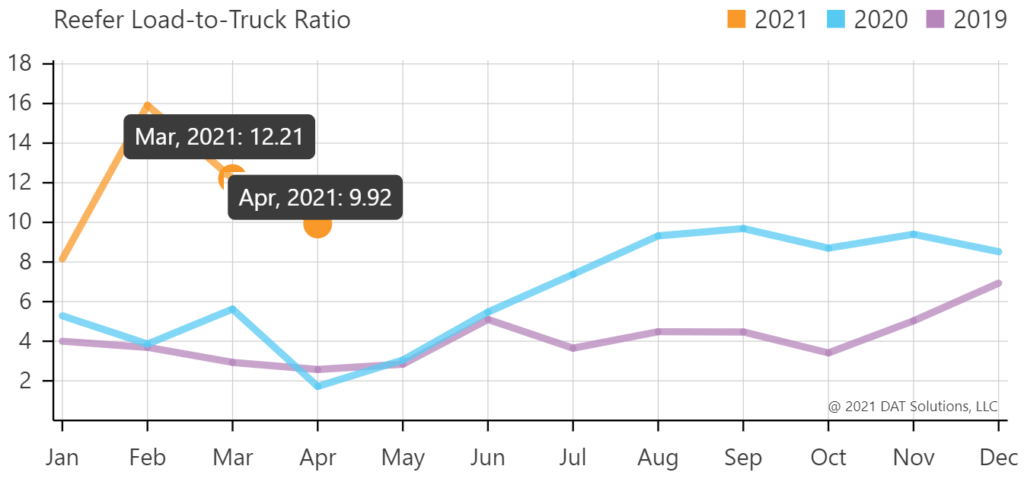
The weekly load to truck ratios show a slight uptick in tightness at the end of the month across all three modes. The recent tightening is similar to the trend seen in tender rejections and is in line with normal seasonality as May commences. This trend will likely persist throughout the rest of the quarter. Demand will remain elevated which should result in upward pressure on load to truck ratios, resulting in tighter capacity in the marketplace.
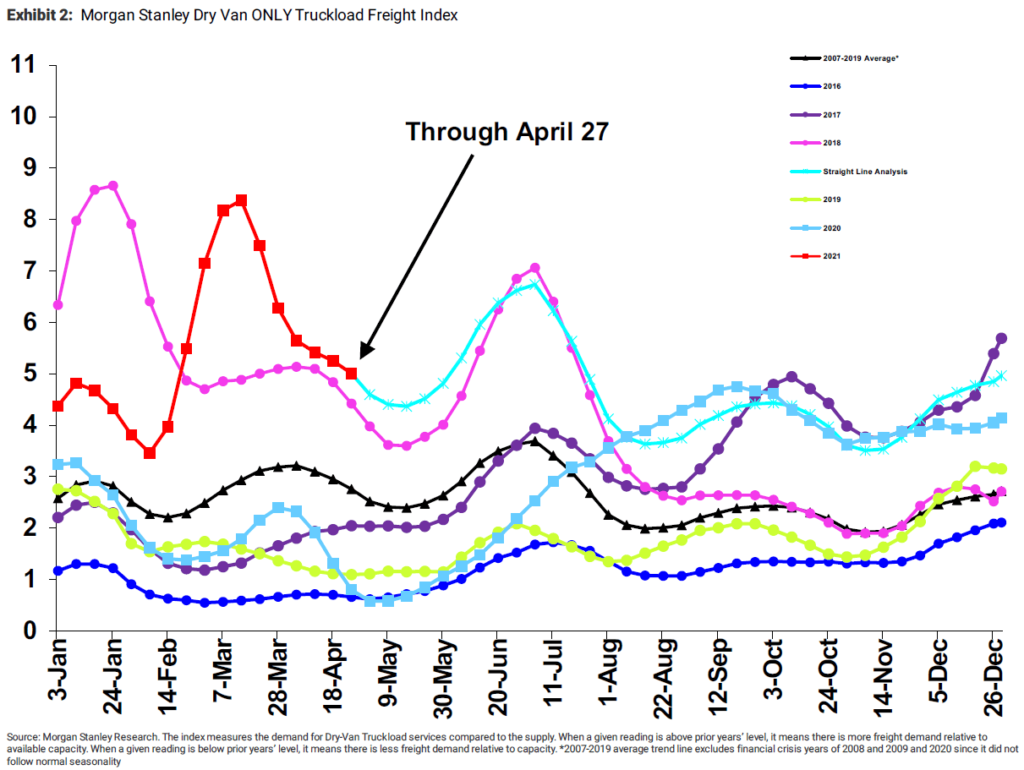
The Morgan Stanley Dry Van Freight Index is another measure of relative supply. The higher the index, the tighter the market conditions. According to the index, conditions have softened following the dramatic tightening of capacity seen in February. The forecast suggests that the second quarter should play out similar to 2018, with conditions tightening in early May before peaking below the high point seen in the first quarter.
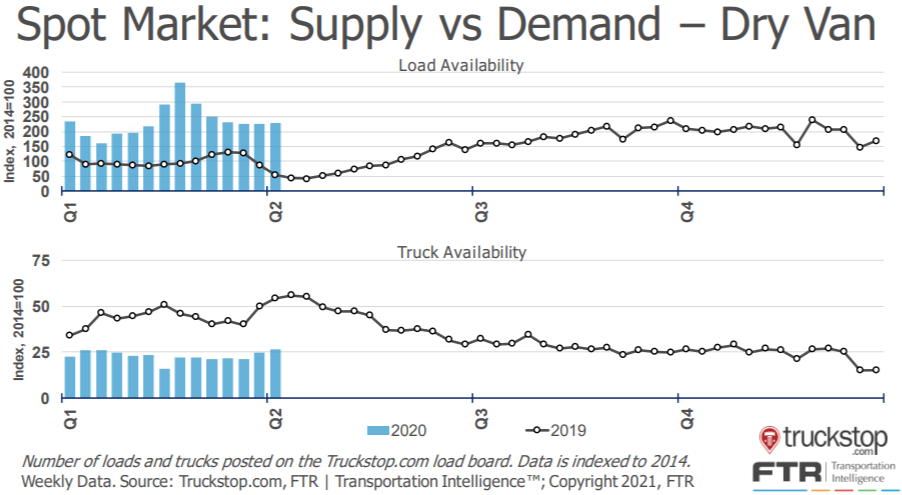
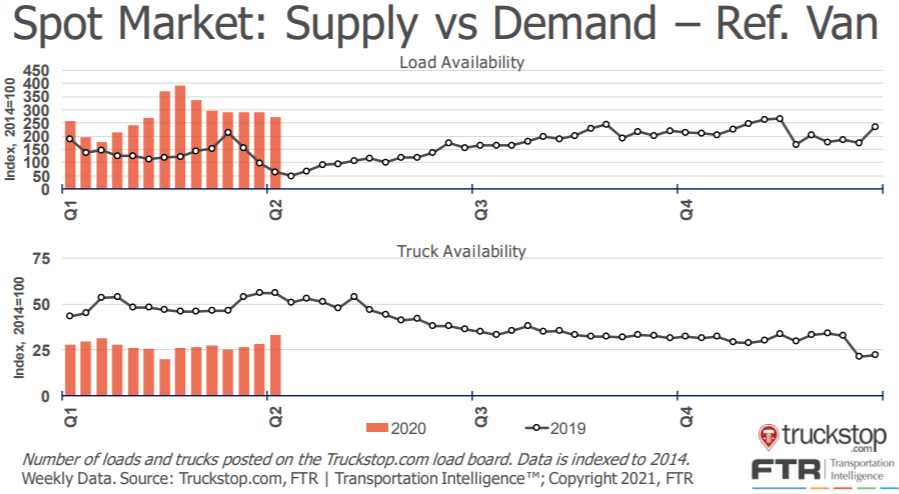
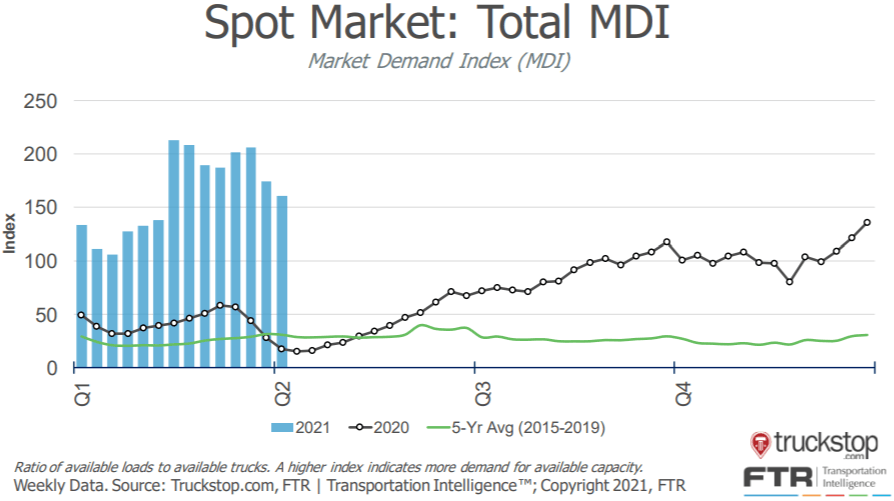
The Truckstop/FTR Market Demand Index measures the ratio of available loads to available trucks. In the first two sets of charts below, load and truck availability are plotted separately for both dry van and reefer freight. Load availability has remained relatively flat while truck availability has trended up, resulting in declining Market Demand Index in April. On a year-over-year basis, the Market Demand Index is up significantly as a result of increased lead availability and decreased truck availability. The total Market Demand Index is down -9% from the high last month but up 771% year-over-year and 477% from 2019.
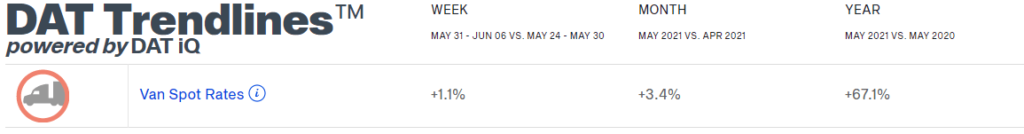
Capacity has not improved since the winter storms hit, and the spot rates reflect that. Dry van spot rates fell slightly in April but have already returned to an all-time high of $2.65 per mile seen in March. Reefer spot rates followed a similar pattern, falling $0.01 per mile in April, but have already climbed to an all-time high of $3.09 per mile, $0.15 higher than the previous high seen in March. Flatbed rates have continued to rise, currently sitting at $2.99 per mile, month-to-date in May. Year-over-year comparisons are hard to comprehend. Dry van spot rates, excluding fuel, are up $0.96 per mile in May 2021 compared to $1.40 in May 2020. This is an increase of 68.5% year-over-year. Contract rates are up significantly as well, coming in at $2.37. $0.59 per mile is 33% above where contract rates sat a year ago.
Contract rates have now increased for twelve straight months. Shippers remain at the disadvantage to carriers as demand continues to outpace supply. Although it is uncertain whether or not conditions will settle down in the second half of the year, it is almost certain that rates will not fall at any point in the second quarter. We are entering a period where normal seasonal surges in demand will drive rates up further. Shippers looking for reliable capacity at predictable costs should look to lock in contract rates with carriers who have proven they will honor their commitments before capacity conditions deteriorate further. Those that have the capability to award shorter-term contracts can limit their risk of overpaying in the event that rates fall later in the year.
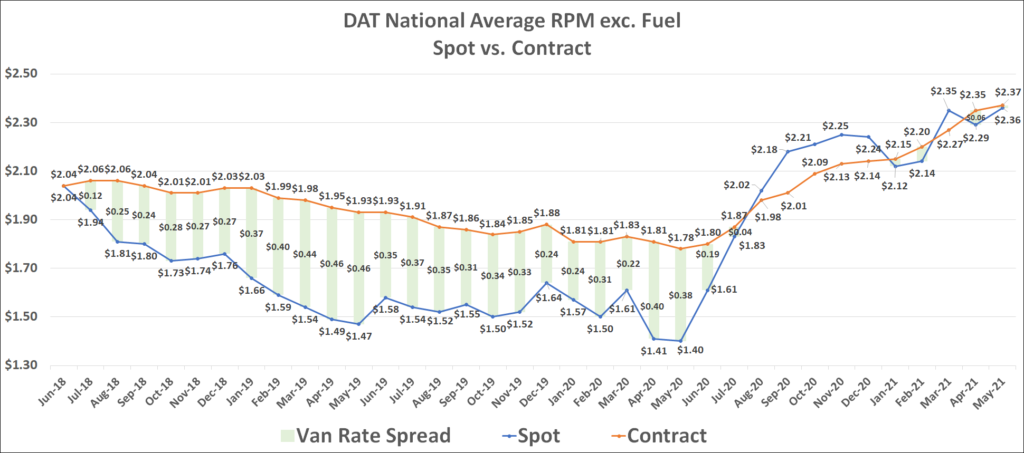
The USDA Fruit and Vegetable Truck Rate Report provides weekly insights into the availability of trucks to support the produce demand at various locations around the country. Currently, capacity is adequate, at best, with most regions experiencing a shortage or slight shortage of capacity. This trend is consistent with the capacity tightness seen in other modes and illustrates an upward pressure on produce transportation costs across the country.
We have officially started shipping full force in the Salinas, CA market. Yields are expected to be strong, resulting in increased demand for trucks. In Stockton, CA, cherry season has officially begun. Though the season is short, demand will peak leading up to Memorial Day. Collectively, these two markets should result in continued challenges for produce shippers out of central and northern California for the immediate future.
Yakima, WA region is another market where conditions have remained tight, and we never experienced the typical rate relief in Q1 and Q2. With stone fruit set to harvest in June, already extremely high transportation costs will undergo even more of a rate crunch. In WA, capacity is available, but costs have remained elevated.
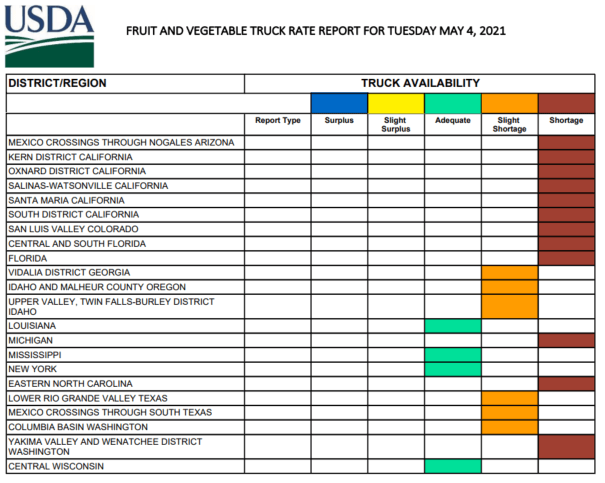
As the outlook for demand continues to improve, the ability for capacity to keep up becomes more difficult. Although slightly improved, class 8 truck production and driver availability remain the biggest obstacles to a recovery in truckload supply. Until these issues are resolved, demand volatility will continue to result in highly unstable market conditions.
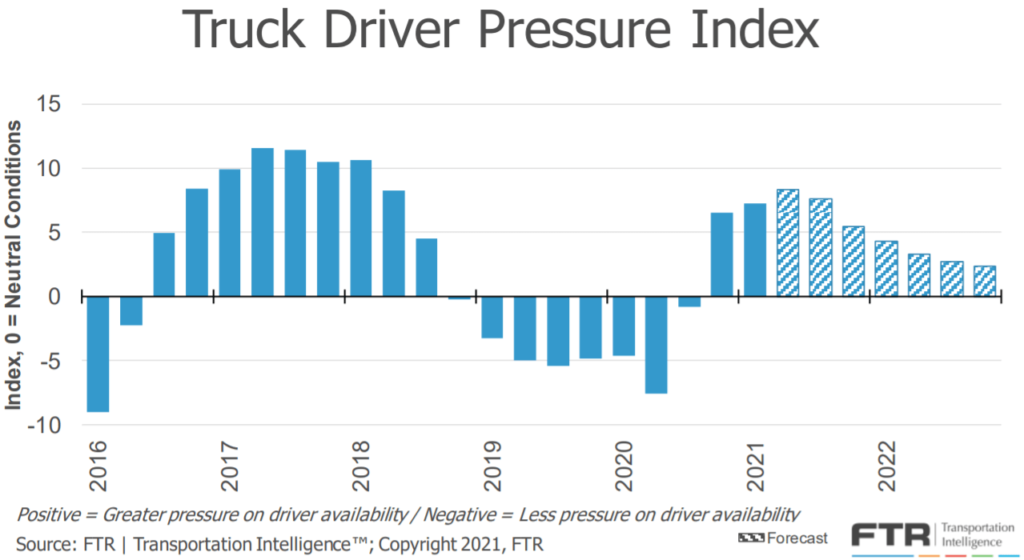
The chart above illustrates the growing imbalance between demand and supply. Truck loadings are up 5%, and driver availability down 2% year-over-year, illustrating how volumes have continued to grow while driver supply falls.
The chart below shows FTR’s forecast for truck driver pressure peaking in Q2-2021 and remaining elevated through 2022. This supports the outlook that capacity constraints will drive unpredictable rate environments as demand ebbs and flows. Despite contract rate increases, we are still advising shippers to secure dedicated capacity on their consistent, high-volume lanes to maintain control over their transportation spend in the coming year.
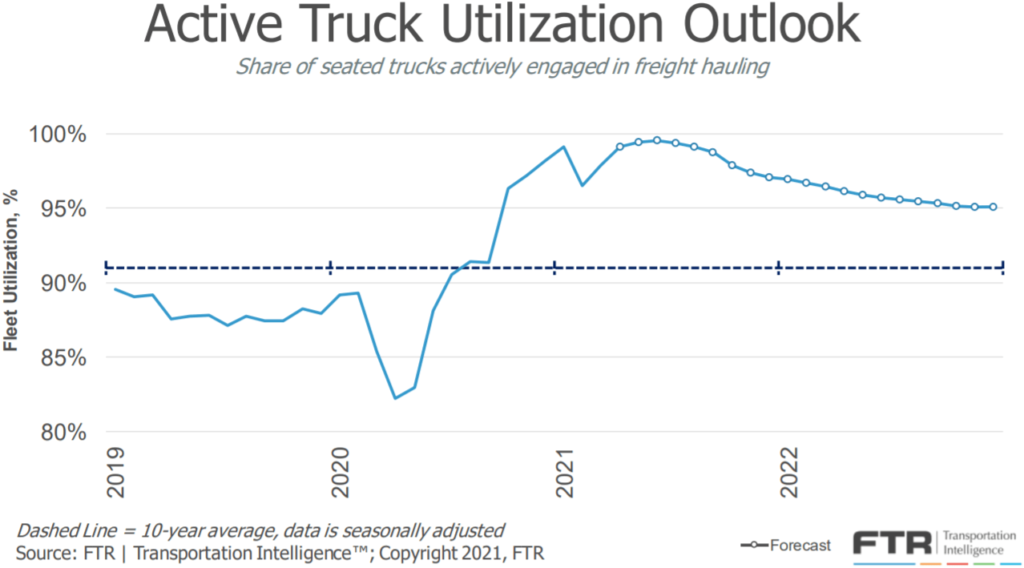
FTR has revised their forecast for active truck utilization, the share of seated trucks actively engaged in freight hauling, due to slightly lower truck loadings forecast. The prior forecast showed active truck utilization maxing out at 100% for several months in 2021. The new forecast still anticipates utilization to max out at 99%, a number that hasn’t been seen since the summer of 2018.
FTR reports that new truck orders continued their strong pace in April, with preliminary results indicating 34,600 new class 8 trucks were ordered in the month — a 7.7% decrease from 37,496 in March but an 838% increase from 3,688 in April 2020. This is now the eighth straight month with new orders above the 20,000 units required to sustain current levels of capacity.
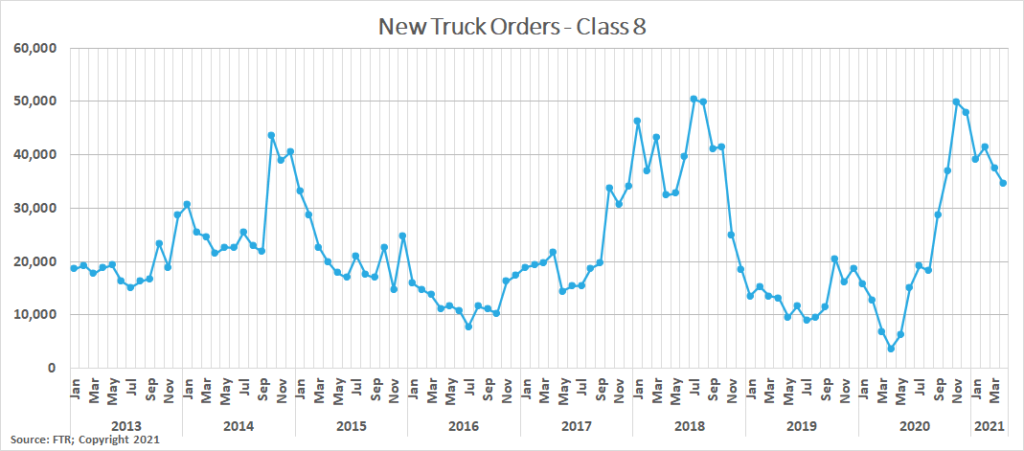
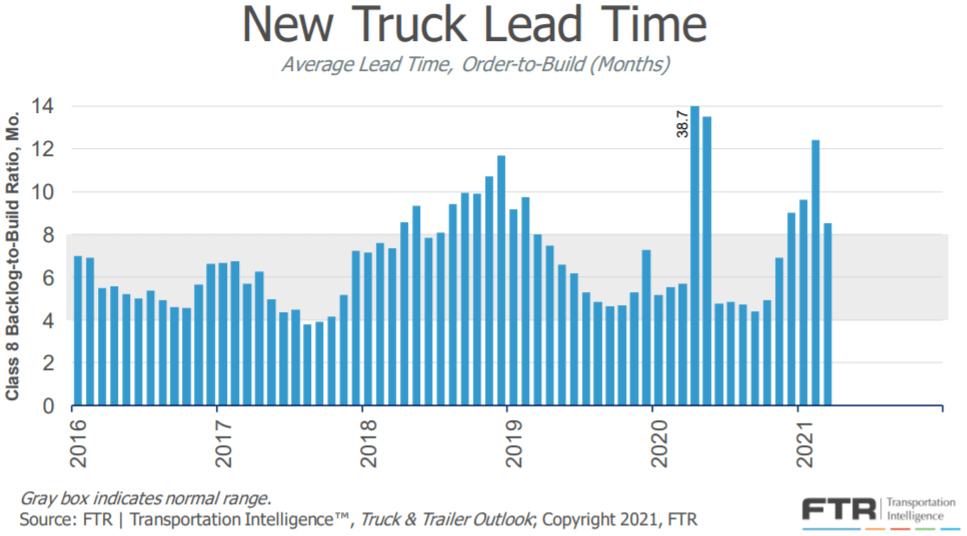
Leading up to March, semiconductor shortages have created difficulties for OEM production of new class 8 units. However, production soared in March, increasing by 32% per day, and helped lower the average time from order to delivery from 11.3 months in February to 8.3 months for those ordered in March. There is still a long way to go for capacity to catch up to demand, but this is a step in the right direction.
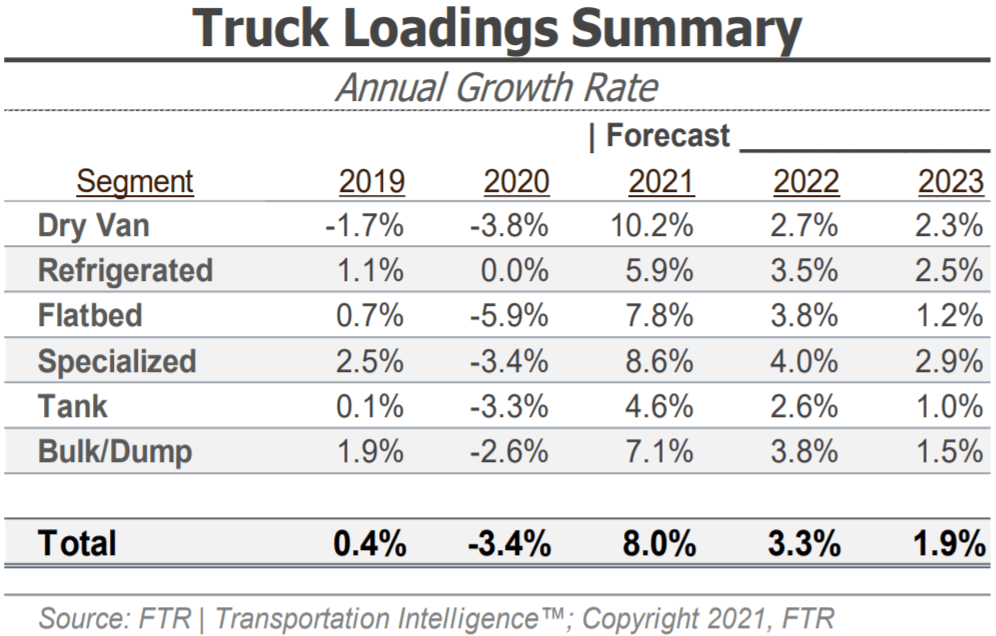
Coming off of a record month for spot volumes in April, demand seems poised to continue its incredible run as normal seasonal trends should result in increasing demand as the summer peak season gets underway. Increasing freight volumes are expected through 2023. FTR’s latest truck loadings forecast shows a slightly weaker outlook based on weaker expectations for chemicals and food truck loadings, even though expectations for automotive truck loadings increased. In the dry van sector, the forecast shows an increase in monthly truck loadings resulting in a total increase of 10.2% for the full year, up from 10.1% a month ago. Refrigerated and flatbed loadings are still expected to see 5.9% and 7.8% increases in truck loadings in 2021, but those values were lower than 7.7% and 9.2% last month.
There are many positive indicators that the economy will experience continued growth over the next several months as the country continues to reopen. Housing activity remains elevated, with new housing starts up 19.4% month-over-month and up 37% year-over-year. Industrial production and manufacturing are on the rebound, both up month-over-month and year-over-year. Lastly, retail sales are growing at near-record levels, up 9.8% month-over-month and up 27.7% year-over-year.
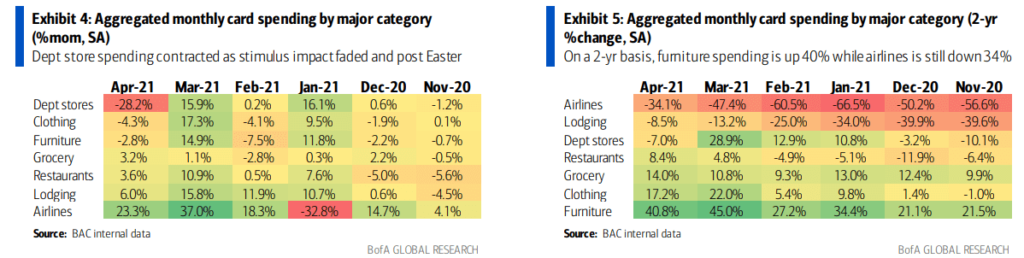
The Bank of America (BofA) consumer spending data provides visibility into the changing consumer behaviors and spending patterns. We must note that beginning in March, the two-year change is more representative of the underlying trend due to the impact from the pandemic lockdowns a year ago. For example, total card spending is up 37.9% year-over-year but just 13.6% compared to 2019, for the 7-day period ending May 1st.
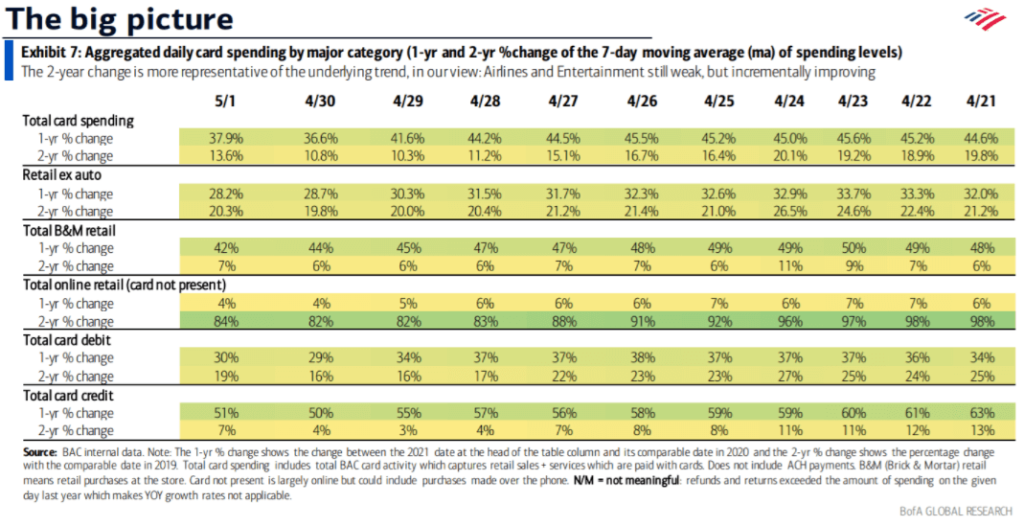
When looking at monthly card spending by major category, airlines and lodging increased the most sequentially in consumer spending month-over-month in April, but both remain down when considering the growth over the prior two years. This is evidence that as states continue to reopen, we should expect to see pent-up demand for travel and entertainment drive spending growth in new areas. This shift in consumer behavior and spending should impact truckload demand requiring capacity networks to adjust to new demand pressures, potentially causing an extension in the current market disruption.
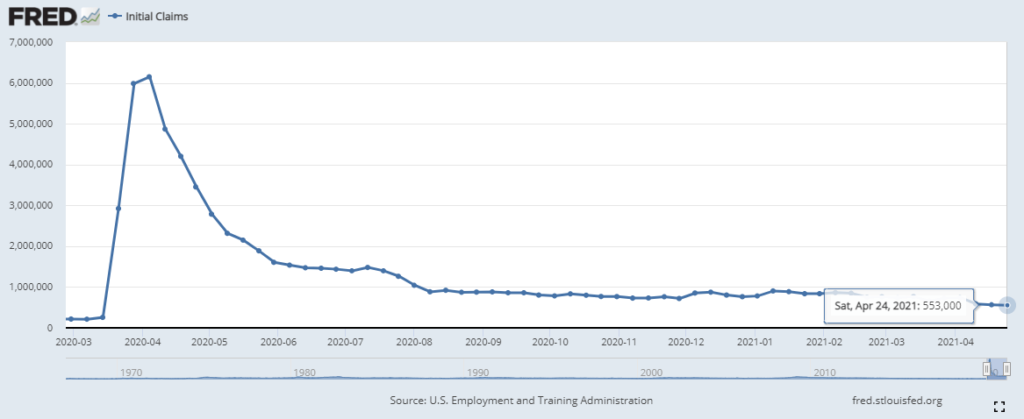
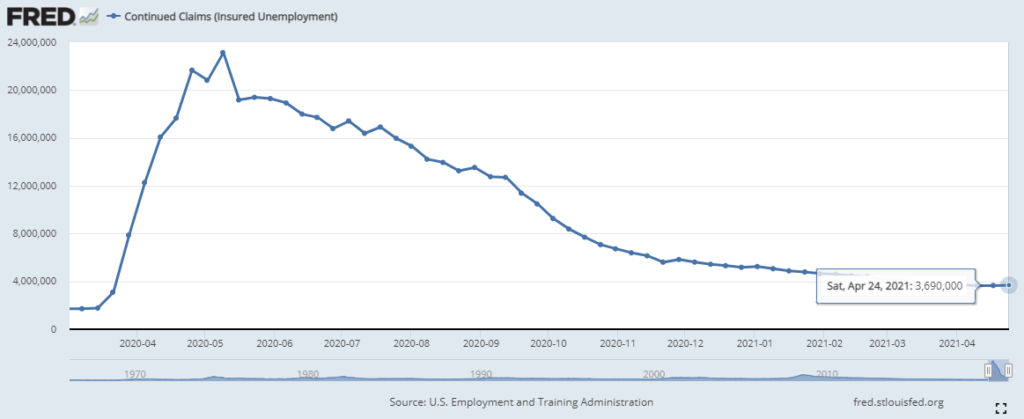
The unemployment trends appear to be improving slightly but still remain well above pre-pandemic levels. Initial claims in the most recent week came in at 553,000, down from more than 700,000 last month, and continued claims are relatively flat at 3.7 million on a weekly basis. Total payroll employment is on the rise, up 379,000 in February and 916,000 in March. The largest gains were seen in the leisure and hospitality sector, which added 280,000 new jobs, two-thirds of which were in food services and bars. Transportation and warehousing also added 48,000 jobs. Collectively the unemployment rate improved from 6.2% to 6.0%, but the total number of unemployed remains 4 million more than in February 2020 before the pandemic began.
Carrier pricing power was on full display in March as contract rates climbed at an unprecedented rate throughout the month. The winter storms in mid February exposed just how insufficient supply is to support truckload demand, and carriers have responded by demanding a premium on their committed capacity.
Unfortunately for shippers, there does not appear to be much relief in sight. Our research indicates that there will continue to be greater upside risk to demand as we move into the second quarter. Spring produce season is just getting underway, the backlog at the port of Los Angeles and Long Beach should support healthy demand outbound from port cities on the East, Gulf and West Coast ports through at least the third quarter, and the third round of government stimulus is generating increased economic activity and consumer spending that will result in an additional boost to truckload demand.
On the supply side, there is no indication that carriers will be able to add capacity quickly enough to support the surge in demand in the near term. Both driver availability and delays in new truck delivery timelines remain the biggest challenges to carriers’ ability to do so. Driver availability should improve as the vaccine rollout enables driver schools to increase throughput, but the delays in new truck production will limit the rate that capacity is added.
As a result, our forecast for the remainder of the year remains consistent. Rates will likely remain at or near all-time highs through at least the second quarter, with the possibility of easing market conditions in the back half of the year as drivers and new equipment begin to enter the market.
"*" indicates required fields

Matt Pyatt is the Chief Executive Officer of Arrive Logistics. He co-founded Arrive with President Eric Dunigan in 2014 after building his career at Command Transportation. As CEO, he is responsible for overseeing the company’s financial health, strategic vision and culture, as well as building a scalable leadership team to support Arrive’s growth.
"*" indicates required fields
"*" indicates required fields
Please have the following info ready to complete registration
Fraud Prevention
Freight fraud continues to impact our industry. We encourage shippers and carriers to reach out to Arrive immediately if there is ever a shipment in question that may be subject to fraud (including fictitious actors and websites). Arrive will not ask you to pay upfront for any dedicated lane or committed capacity program. If the offer you are receiving sounds too good to be true or unrealistic, it may be fraud. Arrive Logistics recommends verifying all communications come from our registered email domain is @arrivelogistics.com and notes that access via VPN or Proxy is prohibited on Arrive systems. Our 24/7 phone number is 888-861-0650 and our leadership team can also be reached at feedback@arrivelogistics.
Use of Cookies
We use cookies to enhance your browsing experience, serve personalized ads or content, and analyze site traffic. By continuing to use this website, you acknowledge and consent to our use of cookies as detailed in our privacy policy.
If you’re not an Arrive customer, please join our network to access the portal.
"*" indicates required fields

Scott Sandager is the Chief Administrative Officer at Arrive Logistics. He joined Arrive in 2018, bringing over 14 years of logistics and brokerage experience, with expertise in project and change management, organizational design, talent development and customer satisfaction. Scott previously held many diverse roles of increasing responsibility with AFN, a Chicago-based freight brokerage.

Eric Dunigan is the President of Arrive Logistics. He began his career at Command Transportation before co-founding Arrive with Matt Pyatt in 2014. As president, he is responsible for driving revenue and growth, as well as leading the Strategic Partnerships team — a veteran group of supply chain experts who work with Arrive’s customers to reimagine their shipping strategy.
"*" indicates required fields

David Spencer is the Vice President of Market Intelligence at Arrive Logistics. David joined Arrive in 2017 after spending six years at AFN focused on business intelligence. His department provides critical market data and expert analysis to internal teams and publishes monthly market updates for shippers and carriers under the Arrive Insights banner.

Andrew Clarke is Board Chairman for Global Critical and DCLI, Inc., and a board member for Arrive Logistics and Element Fleet Management Corp. His 20 years of global transportation and logistics experience include time as CFO of C.H. Robinson, CEO of Panther Expedited Services, Inc. and SVP and CFO roles at Forward Air Corporation.

Dean Croke is a Market Analyst at DAT Solutions, where he focuses on freight market intelligence and data analytics. His 35 years of experience with data analytics, transportation, supply chain management, mining and insurance risk management include time as co-founder of FleetRisk Advisors and in a number of other high-level roles with FreightWaves, Spireon, Lancer Insurance, Omnitracs Analytics (formerly Qualcomm) and more.

Asanka Jayasuriya is the CTO at 8VC. He is an accomplished engineering and product leader with 20+ years of experience in the cloud. He has a strong background in enterprise SaaS, PLG products, infrastructure, and security. Notably, he served as CTO and SVP of Engineering at SailPoint, leading their successful transition to the cloud and successful exit event. He also held senior leadership roles at InVision, Atlassian, and Amazon, driving growth, operational excellence, and innovation. At 8VC, Asanka works with the entrepreneurs and leaders in our portfolio as a virtual CTO supporting their growth.

Chad Eichelberger is the President of Reliance Partners. Since 2015, he’s leveraged his extensive experience in risk management, compliance, best practices and contracts to lead the company’s logistics and truck insurance strategy and operations. Chad was previously the President of Access America Transport, where he led the company from $8M to over $600M in revenue.

Barry Conlon is the CEO and founder of Overhaul, the global leader in active supply chain risk management and intelligence. With a remarkable career spanning over 30 years in supply chain security, he is widely regarded as a trailblazer in modern-day supply chain security standards and best practices.

As VP and Senior Analyst at ACT Research, Tim analyzes commercial vehicle demand and alternative powertrain development (i.e. electrification), and authors the ACT Freight Forecast, U.S. Rate and Volume Outlook. He previously spent fifteen years in equity research focused primarily on the transportation, machinery, and automotive industries, and co-founded leading equity research firm Wolfe Research.
"*" indicates required fields
