
October truckload demand reports varied from source to source, primarily due to opposing spot and contract rate trends. Indices focused on spot volume trends continue to show significant declines in activity, while contract indices display a bit more stability. Our takeaway is that overall, demand remains healthy but continues to see large allocations moving via primary contract carriers.
The FreightWaves SONAR Outbound Tender Volume Index (OTVI), which measures contract tender volumes across all modes, was down 28% year-over-year as of November 1st, or 13.9% when measuring accepted volumes after the significant decline in tender rejection rates. This year-over-year contract volume decline is inconsistent with other sources. Although unconfirmed by FreightWaves, some experts believe that the SONAR tender data has a higher proportion of retail freight than the overall market, which would explain the significant drop in tender volumes as retail demand has moderated substantially since Q4 2021.
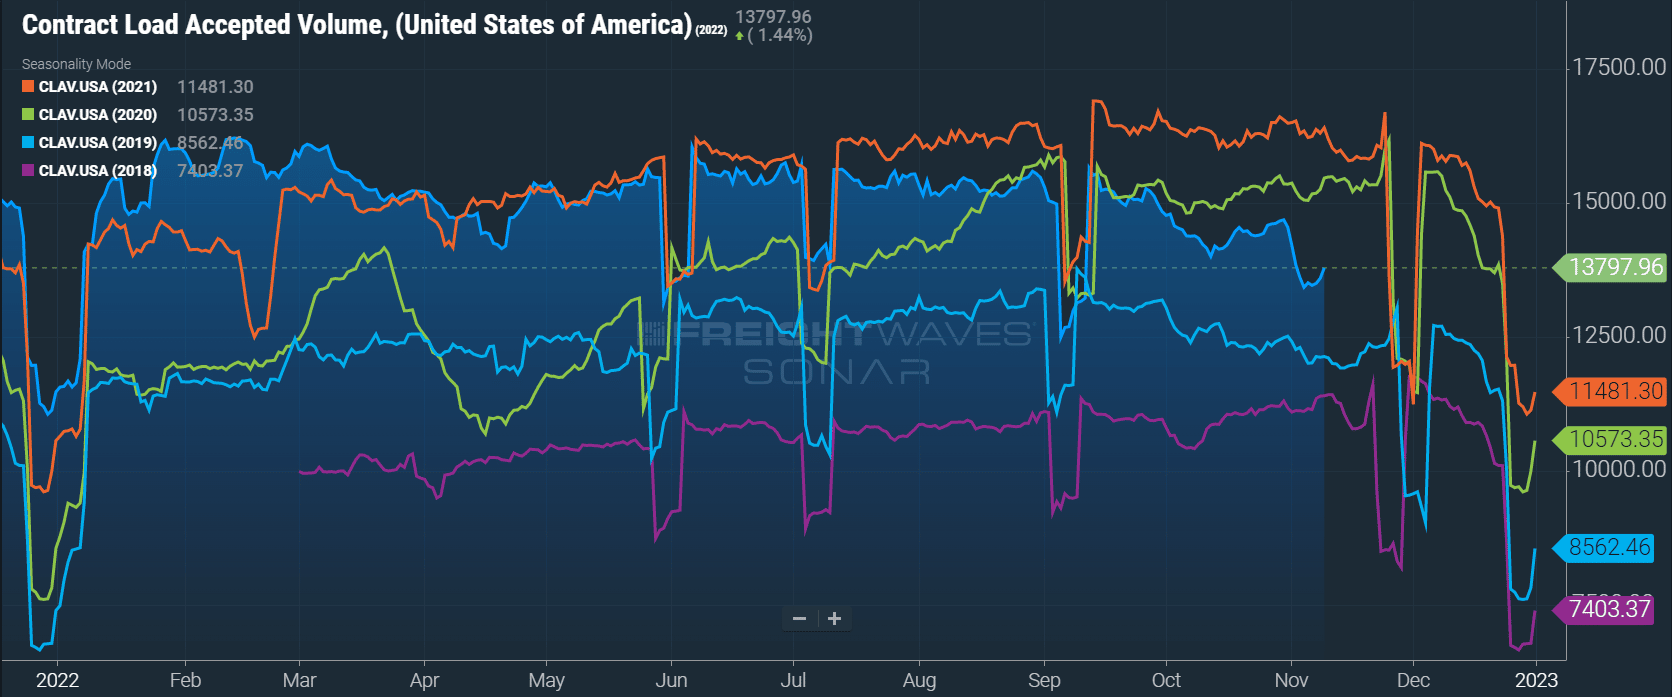 Accepted contract volumes are down 13.9% y/y in early November but remain above historical pre-pandemic levels.
The latest ATA and Cass reports indicated volumes were up by around 5% year-over-year in September. This is one month behind the above FreightWaves data; however, referencing our analysis from last month’s report, SONAR data as of October first indicated accepted contract volumes were down by more than 10%.
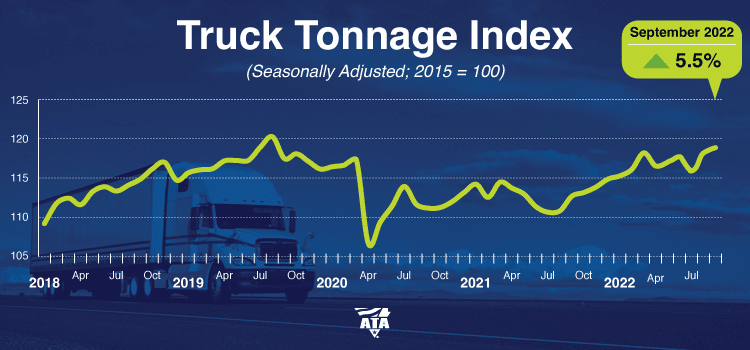 The ATA reported that truck tonnage was up by 5.5% compared to September 2021, the thirteenth straight year-over-year gain and the third highest level on record.
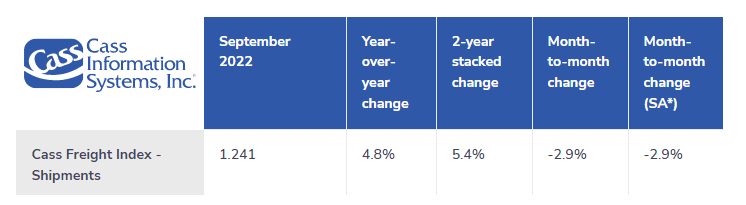 The Cass Freight Index indicated year-over-year volumes were up 4.8% in September, but growth is expected to slow in coming months due to tougher comps in Q4.
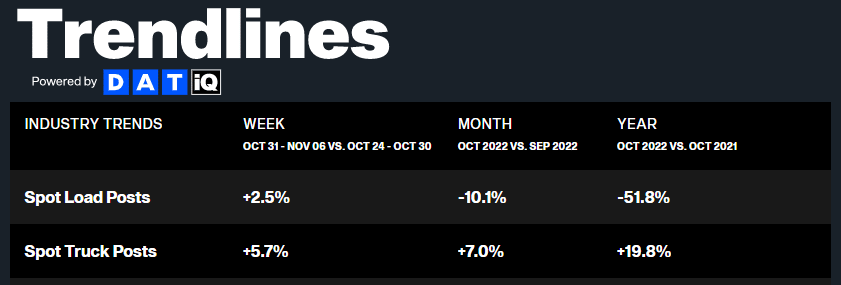
Spot volumes continue to suffer as shippers experience more strong routing guide compliance. DAT data indicates that year-over-year spot volumes were down by 51.8% in October after falling 10% month-over-month from September.
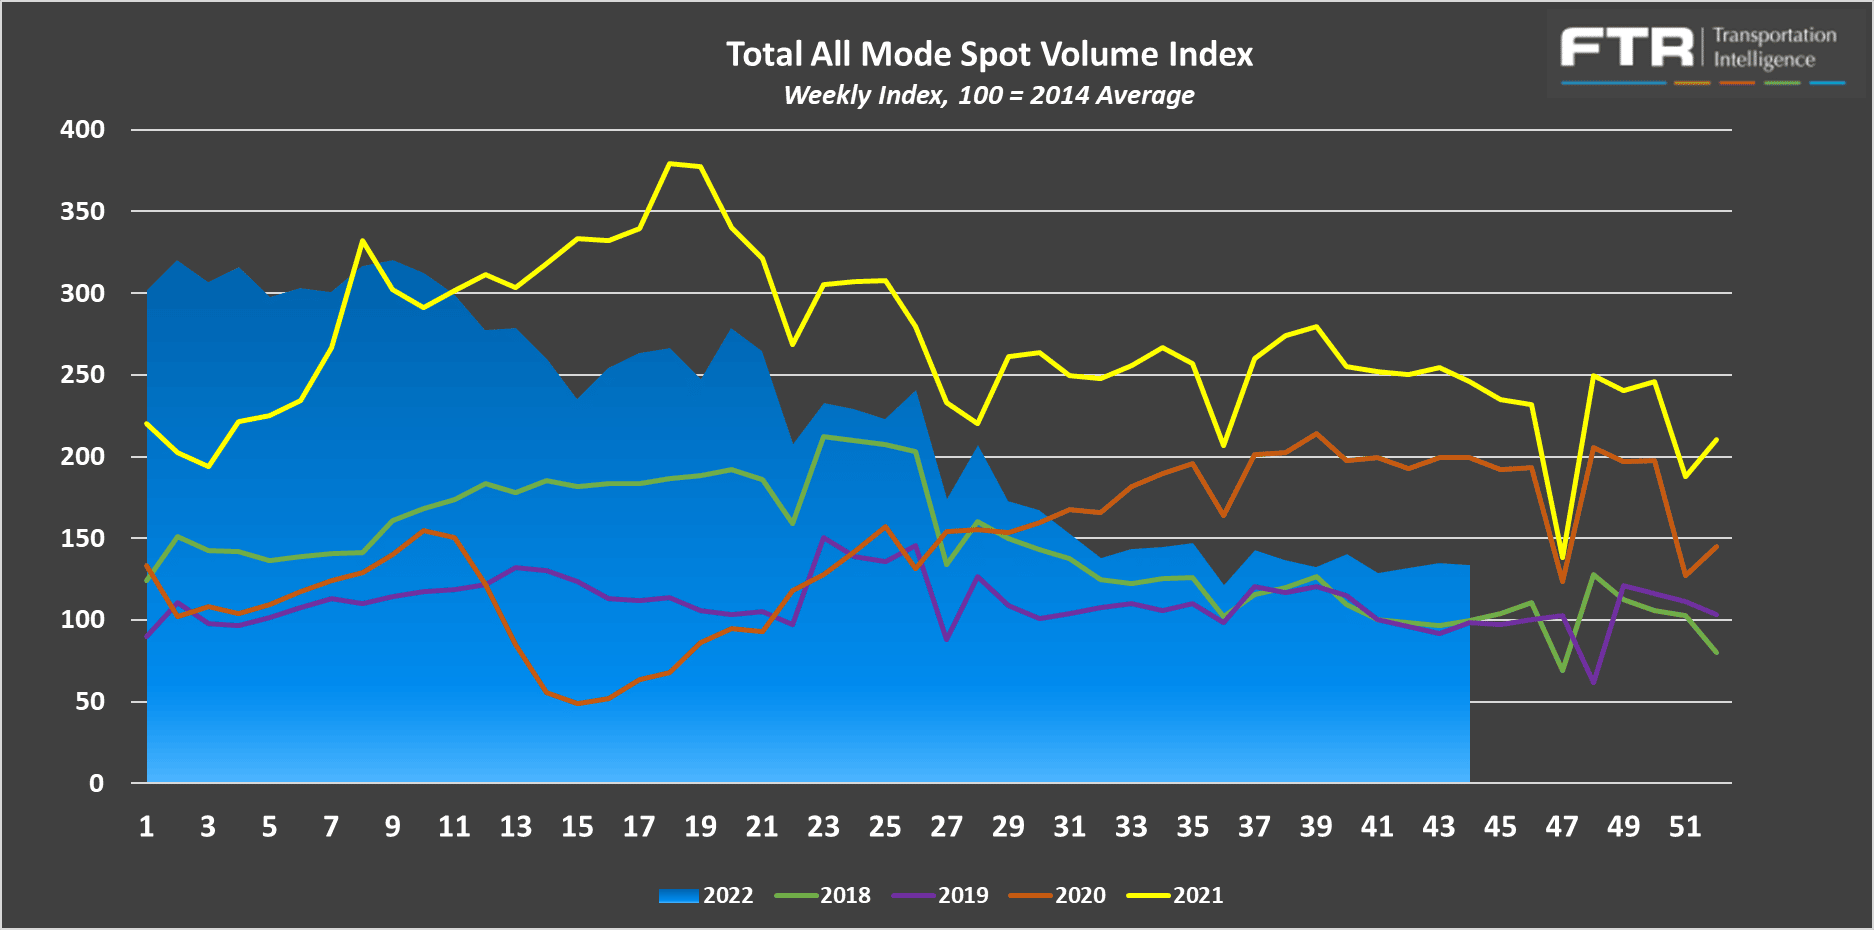
FTR and Truckstop’s Total All Mode Spot Volume Index helps illustrate that even though spot volumes are down from last year, they remain in line with pre-pandemic levels, further supporting that demand remains healthy. The All Mode Index is now down 46% year-over-year but remains up 36% from 2019, a sign of relative strength compared to historical norms.
There have been no significant month-over-month changes in our evaluation of truckload supply as conditions have remained relatively stable. On a year-over-year basis, however, the differences are unprecedented, with shippers seeing significant improvements in truck availability.
The Sonar Outbound Tender Reject Index (OTRI) measures the rate at which carriers reject the freight they are contractually required to take. The current rate is 4.19% — an almost negligible improvement from the 5.05% rejection rate at the beginning of October — indicating shippers are seeing extremely high routing guide compliance on contractual freight. However, this is the lowest rejection rate we have ever experienced this time of year.
As peak retail season ramps up, we see no signs that shippers should be concerned about routing guide compliance. Consistency through seasonal demand surges all year gives us confidence that carriers are taking a longer-term view of freight acceptance and meeting shipper service requirements.
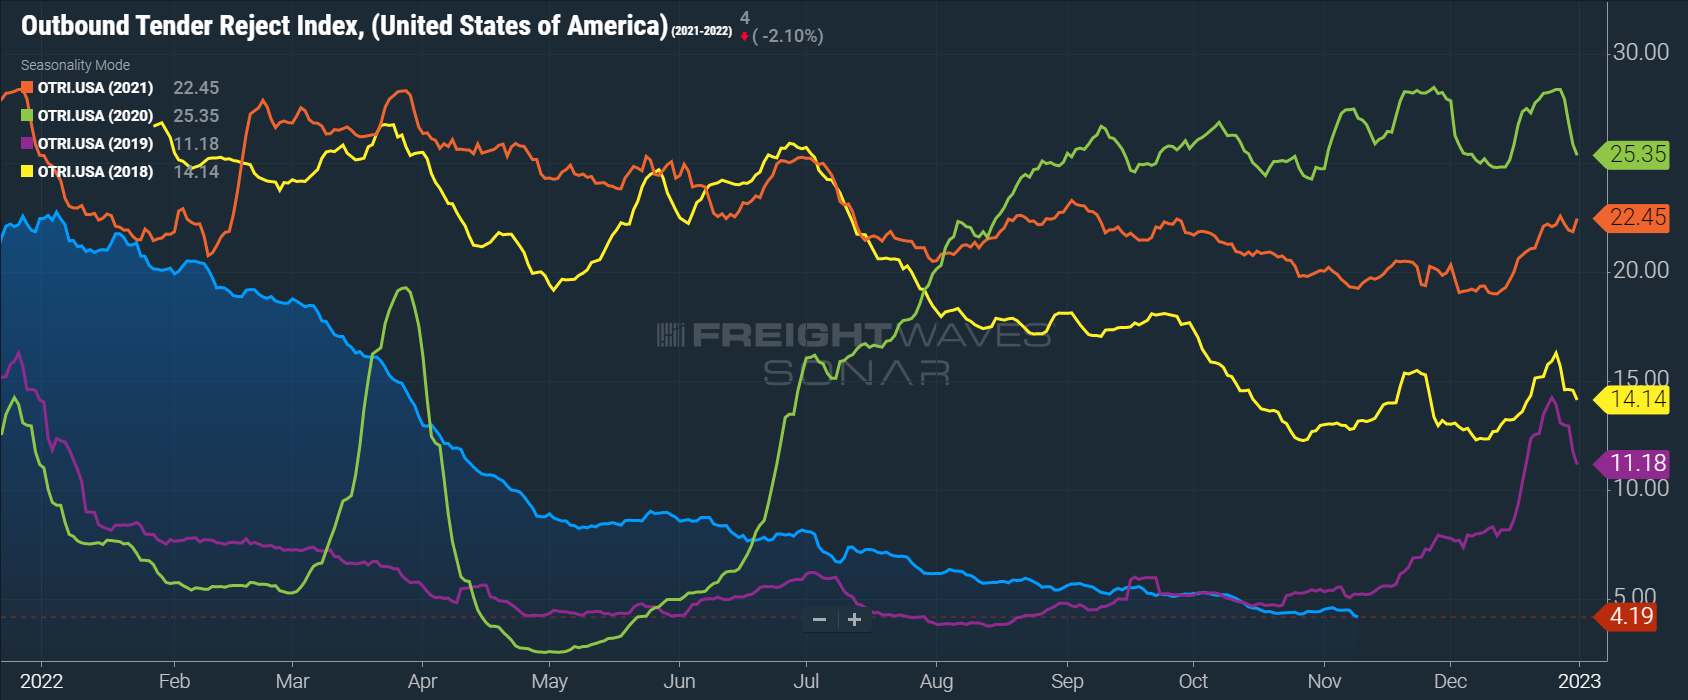 OTRI continued its gradual decline to equilibrium levels throughout October and early November, falling to 4.19%.
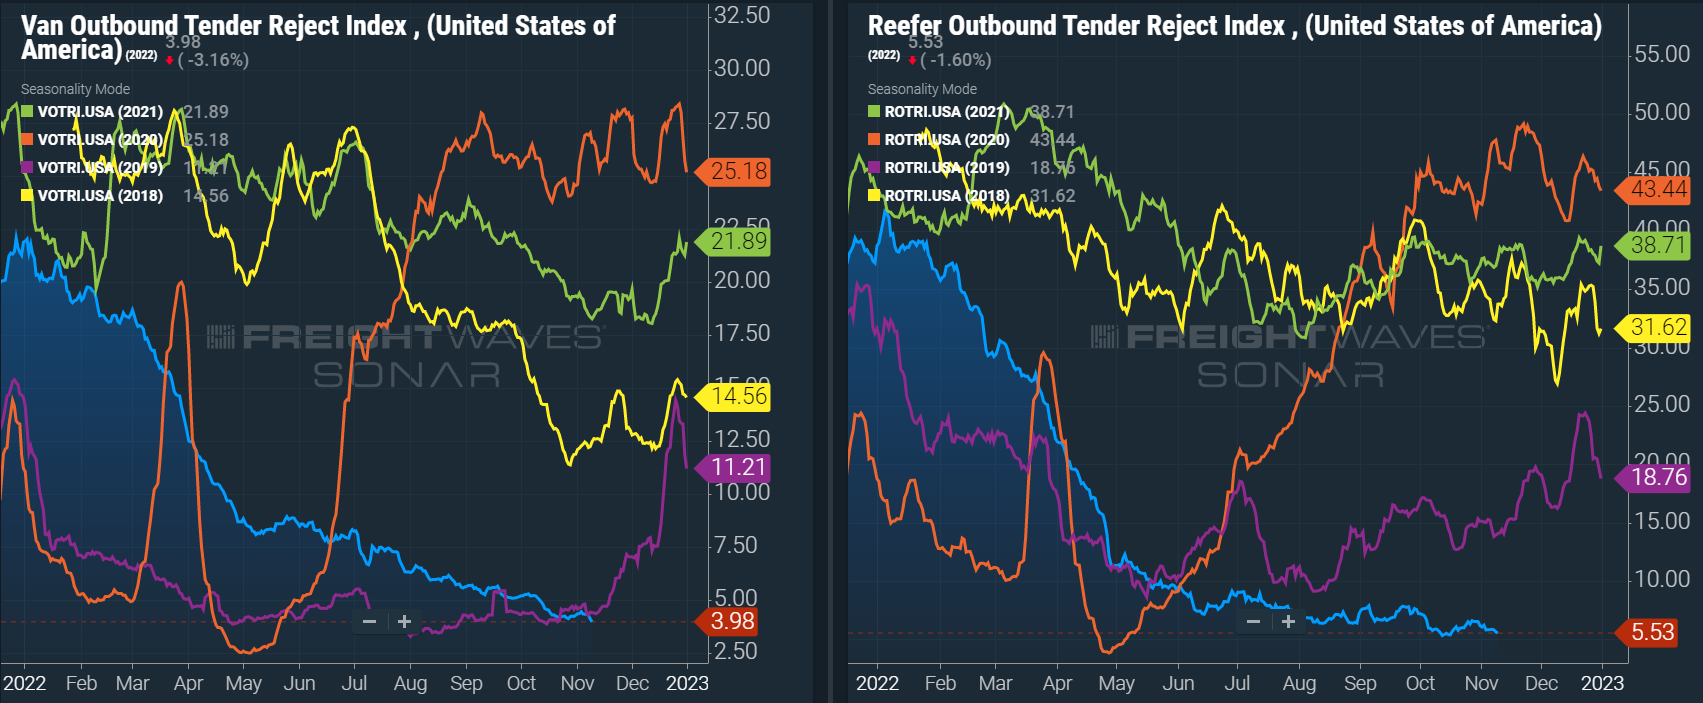 Dry van and reefer tender rejections are trending at all-time lows for this time of year, with dry van rejection rates coming in below 4%, and reefer rejections currently at 5.53%.
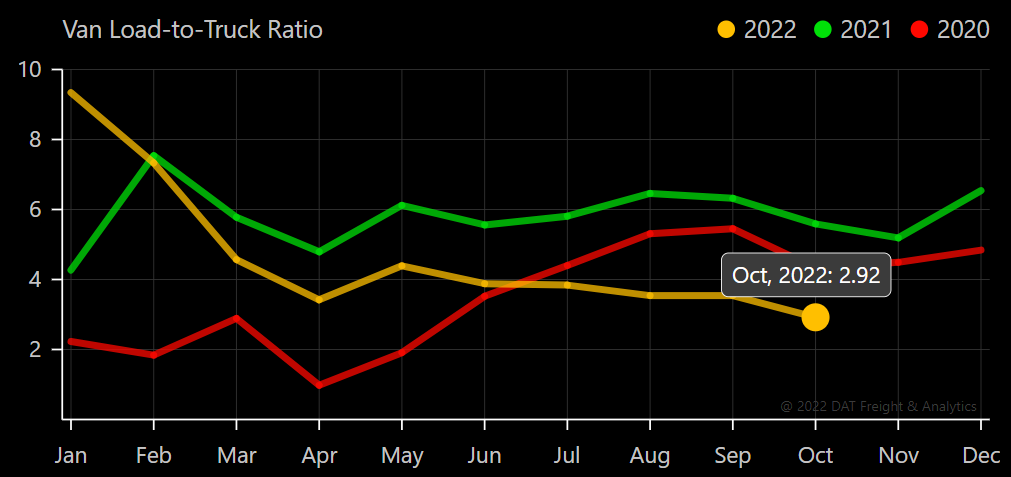
The DAT Load to Truck Ratio measures the total number of loads compared to the total number of trucks posted on their spot load board. In October, the Dry Van Load to Truck Ratio fell by 17.6% month-over-month and 47.7% year-over-year to 2.92 loads per truck. As previously noted, a ratio in this range is typical of equilibrium market conditions where supply is sufficient to meet demand.
The Reefer Load to Truck Ratio fell to 5.11, down 19.2% month-over-month and 57.5% year-over-year.
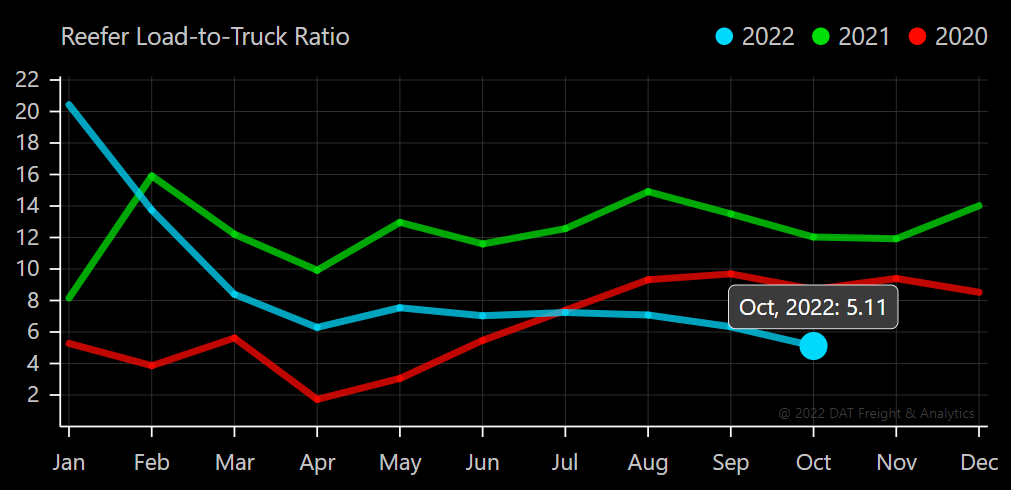
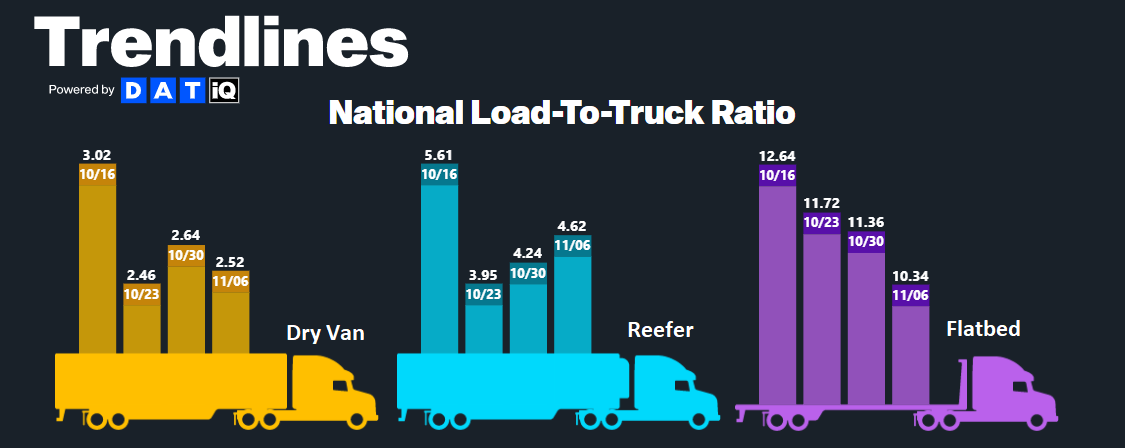
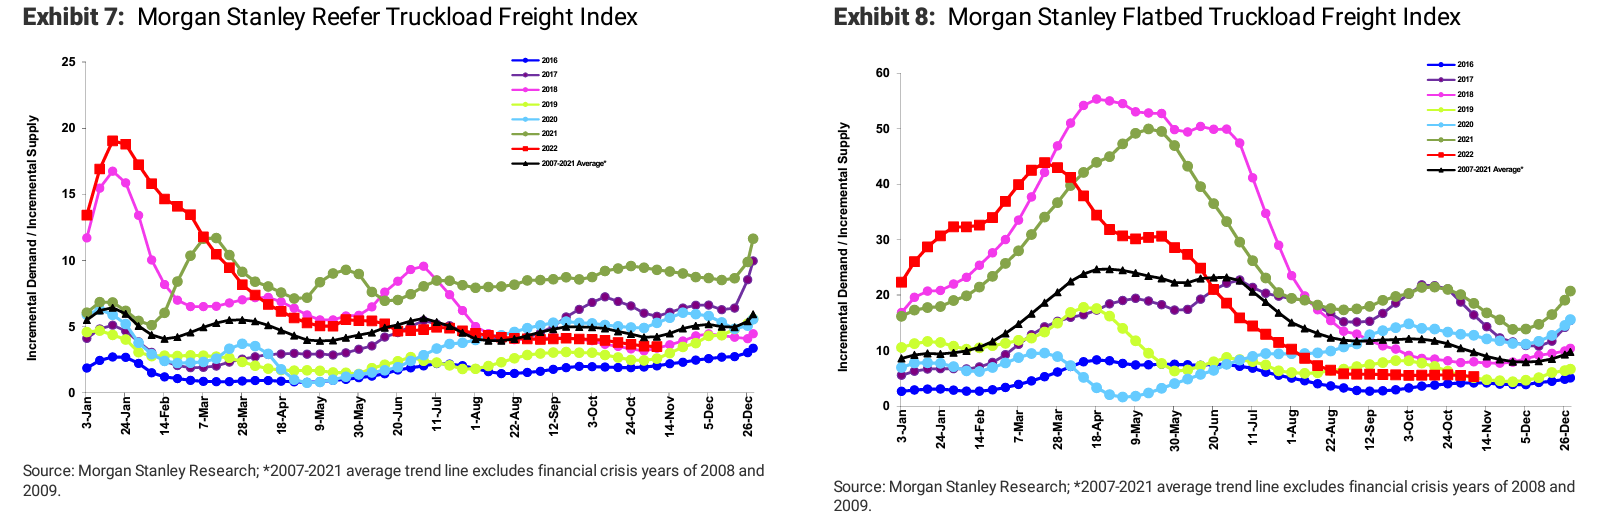
Recently, weekly load-to-truck ratios for van and reefer equipment have shown some volatility, but overall conditions remain stable. Meanwhile, we have seen three straight weeks of decreasing tightness in the flatbed sector.
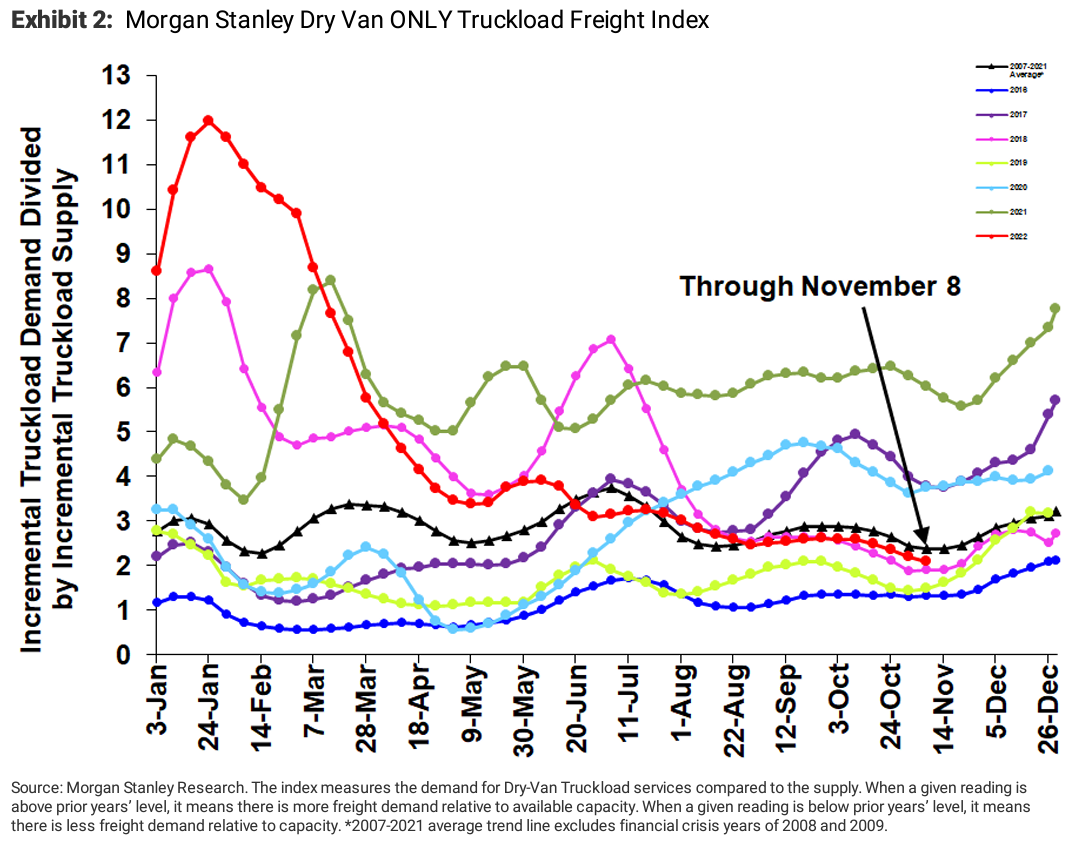
The Morgan Stanley Dry Van Freight Index is another measure of relative supply. The higher the index, the tighter the market conditions.
Data from October showed conditions outpaced typical seasonal trends, softening more than usual throughout the month. The black line with triangle markers on the chart provides a great view of what directional trends would be in line with normal seasonality based on historical data dating back to 2007; all prior years saw increased tightness from mid-November through the end of the year.
Although we do not expect any significant tightness through the end of the year, short-lived volatility is possible in some areas as seasonal demand increases and carriers take time off around the holidays.
Elevated fuel costs continued to have an impact on rates in October. In previous updates, we discussed the outcome of deflationary rate pressures caused by high fuel costs: Shippers often become motivated to find savings in other areas as fuel surcharges increase. Typically spot rates are negotiated as an all-in rate with fuel included, so it becomes more difficult for carriers to see rate increases that offset the rising fuel expense entirely. As fuel prices are forecasted to remain elevated for the foreseeable future, we may begin to see inflationary pressures materialize. At the very least, elevated fuel prices will help establish a floor for and prevent further deterioration of spot rates, even if truckload demand falls off a cliff. Should rates fall below the breakeven point, carriers will either park their truck and wait for conditions to improve or take a company job.
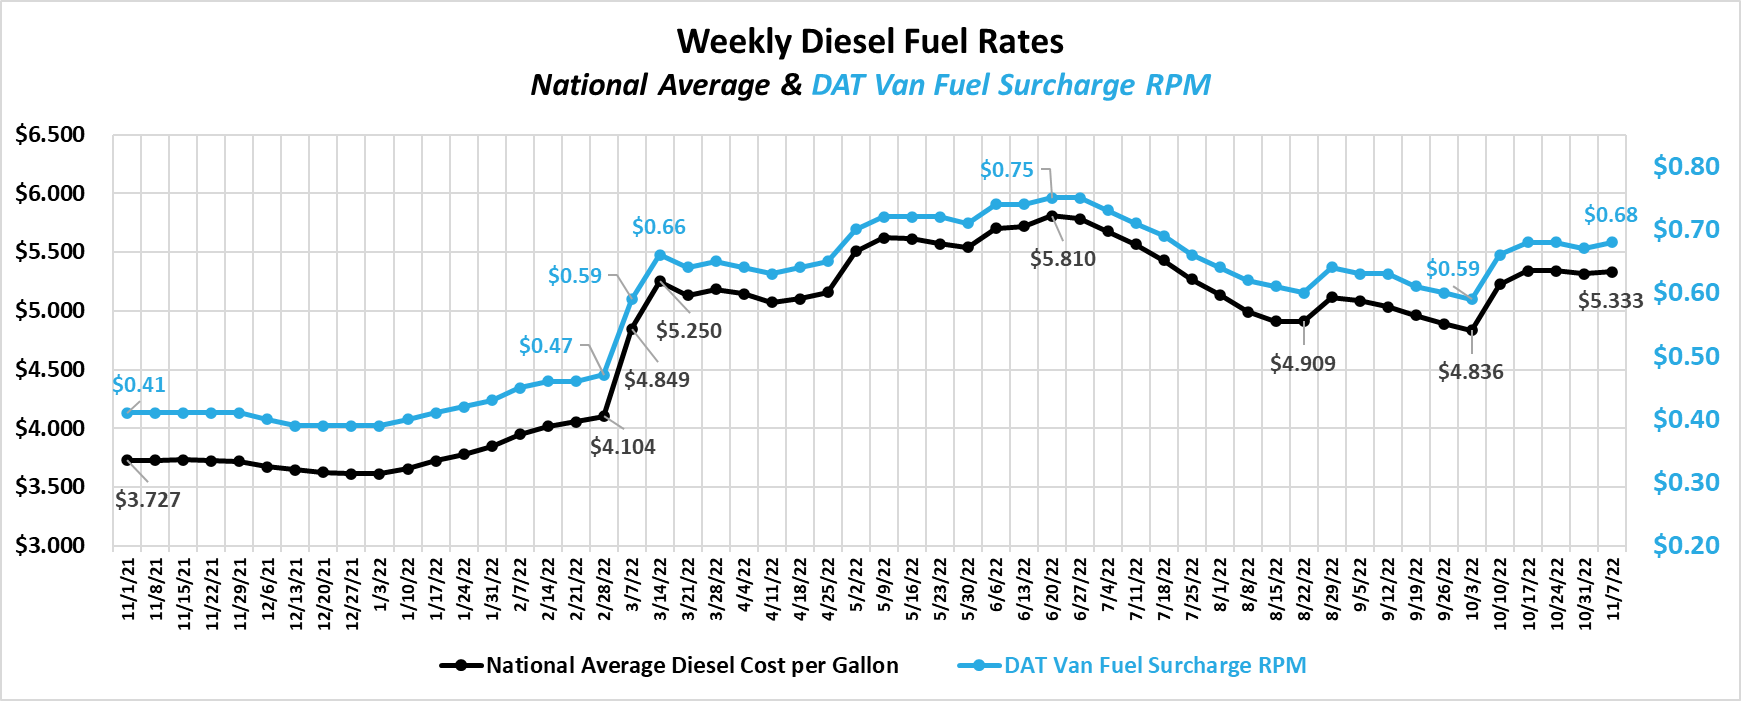 The national average increased by more than $1.60 over the past year, translating to an increase in the fuel surcharge from $0.41 to $0.68 per mile or $270 more over a 1,000-mile run.
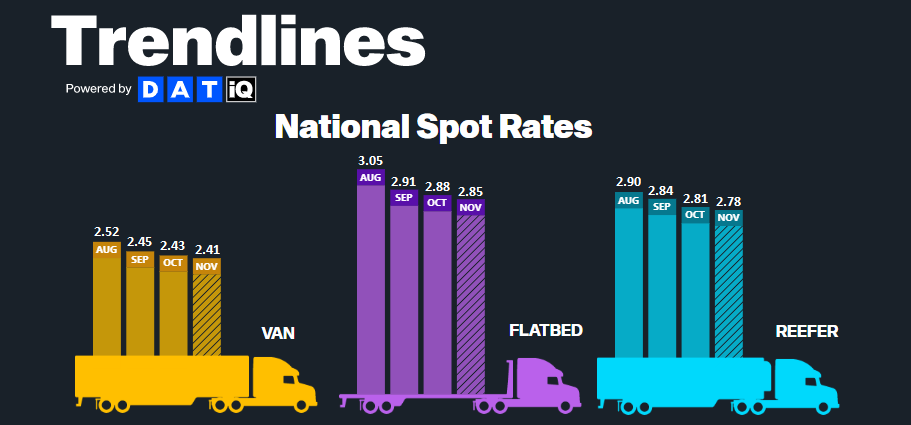
Trends for all-in spot rates, including linehaul and fuel costs, again showed sequential month-over-month declines in October. With the monthly average fuel cost up from October to early November, these declines result from decreases in the linehaul component of the rate. For example, all-in dry van spot rates have fallen by $0.02 month-over-month, down from $2.43 per mile in October to $2.41 in early November. Meanwhile, the average fuel surcharge has increased by $0.02 per mile over that same period, indicating linehaul rates are down $0.04 per mile.
While spot rates appear to be trending towards a floor soon, contract rates have not slowed as quickly as anticipated. We expected downward pressure on contract rates to help close the gap between the two, but it has only grown in recent months.
Two main factors are slowing contract rate declines. The first is how the lag time between final pricing and the freight moving at the new rate impacts the national average. The second is that some shippers would rather wait until spot rates truly bottom out before locking in new contract rates to minimize money left on the table. As a result, it could be some time before we see contract rates hit the floor.
The current dry van contract rate is $2.41 per mile, excluding fuel — a decrease of 5.1% from $2.548 per mile in November 2021. Although linehaul rates are down year-over-year, all-in rates remain up by 4.7% due to increased fuel costs. We have seen an 8% decline from the February peak of contract rates (excluding fuel), with no signs of reaching a floor in the near term.
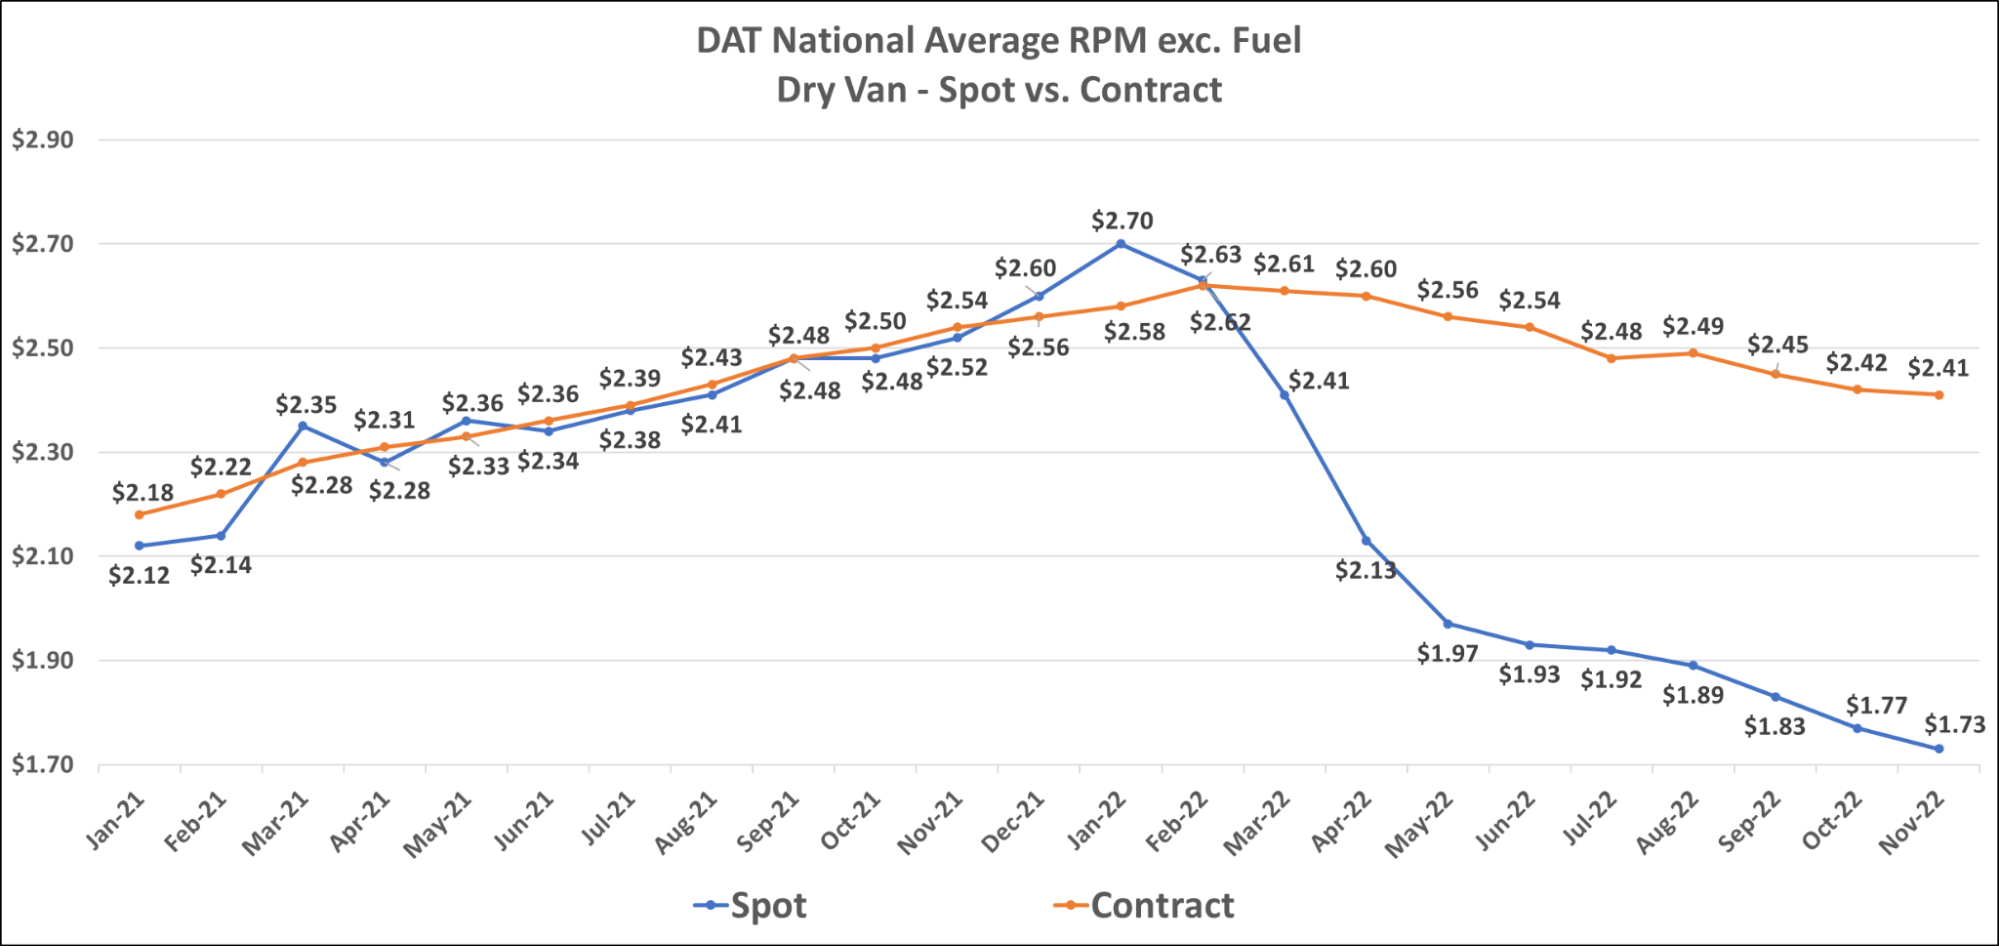 Van spot and contract rates trended down into early November. Spot rates could firm up if we see any peak season demand materialize, but we expect contract rates to decline further.
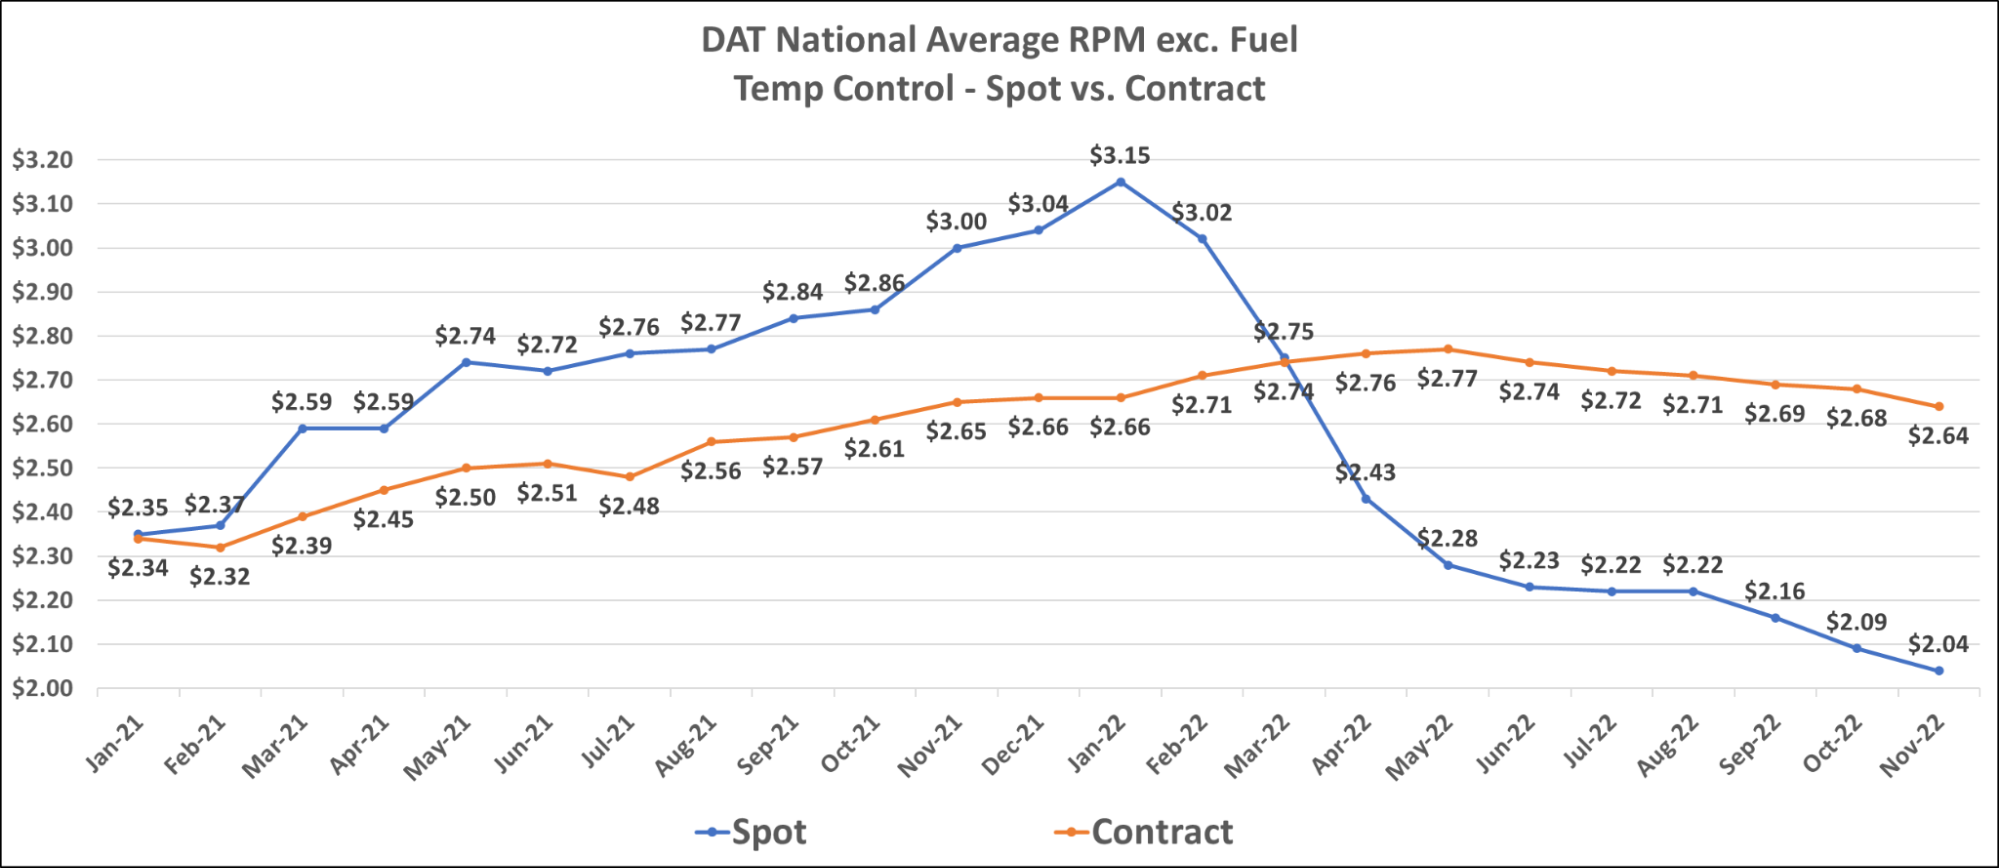
Reefer spot and contract rates have followed a similar trajectory to van rates, trending down early in the month. The current reefer contract rate is $2.64 per mile, excluding fuel, making this the sixth straight monthly decline. The current reefer spot rate is $2.04 per mile, excluding fuel, a 32% decrease from $3.00 per mile in November 2021. Contract rates are now down by $0.01 per mile, excluding fuel, over the same period.
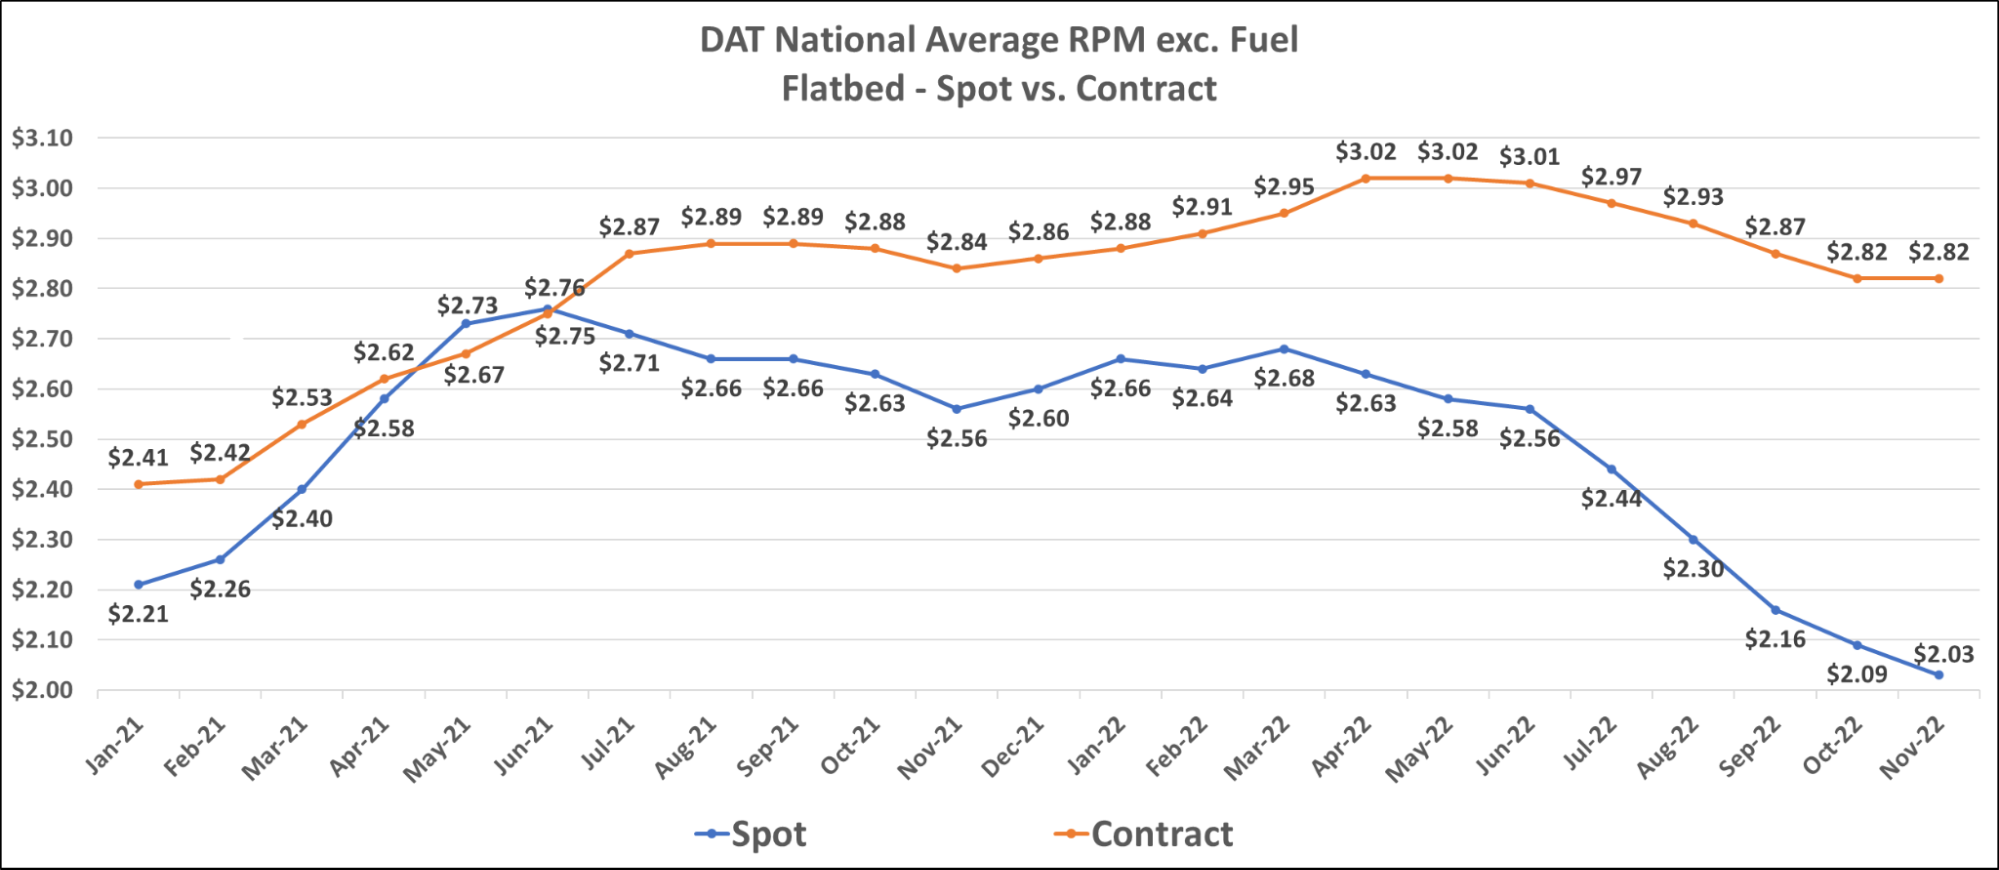
The flatbed market continues to experience spot rate declines. The current flatbed spot rate is $2.03 per mile, excluding fuel, a 21% decrease from $2.56 per mile in November 2021. Flatbed contract rates leveled off in early November. The current flatbed contract rate at $2.82 per mile, excluding fuel. Flatbed contract rates are now down by just $0.02 from $2.84 per mile, excluding fuel, in November 2021.
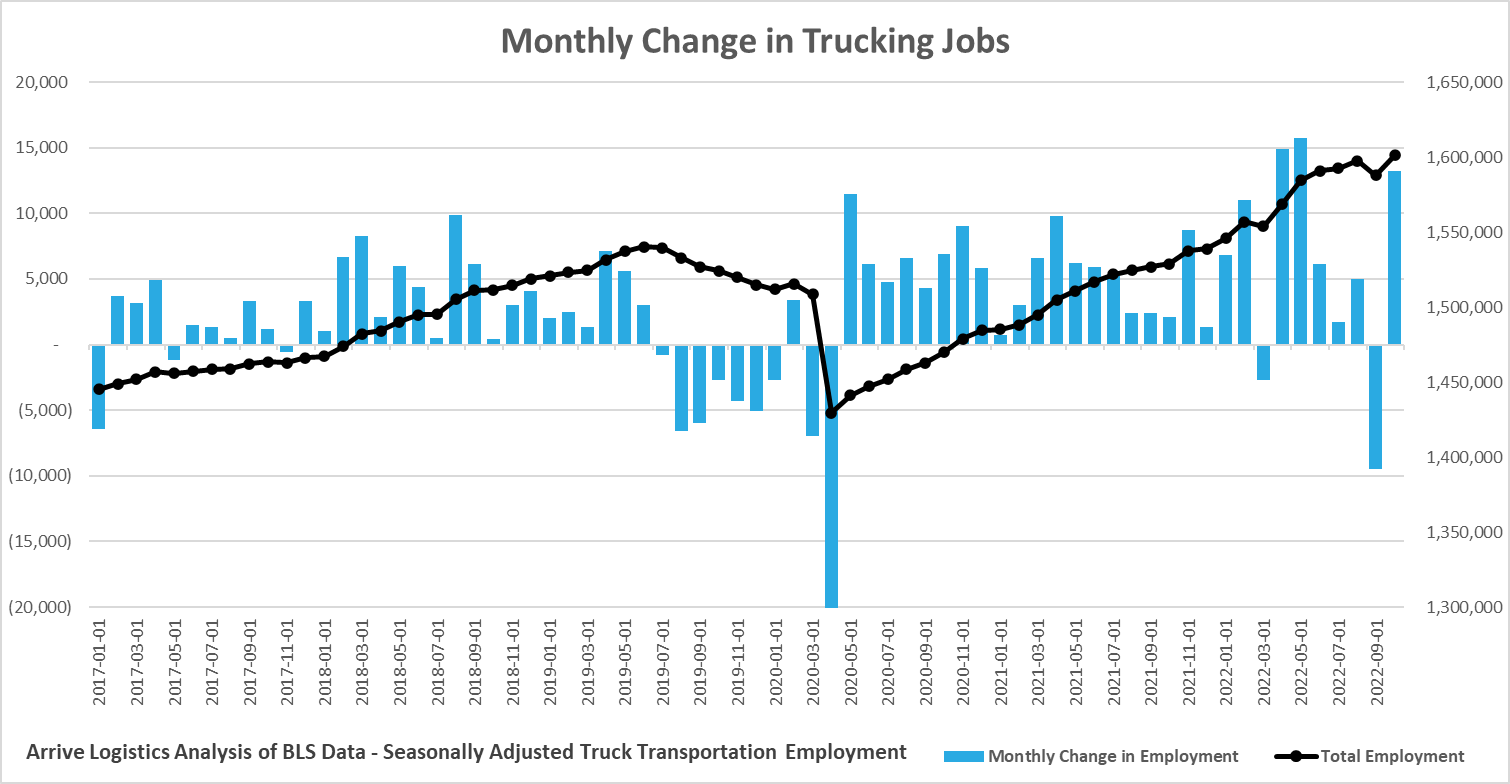
Today, the most prominent capacity trend is owner-operators taking company jobs with larger asset carriers. As calculated by the FTR, net revocations of trucking authority hit yet another all-time high in October, supporting the theory that smaller fleets are throwing in the towel. Declining rates and rising operational costs remain the primary reason for this trend.
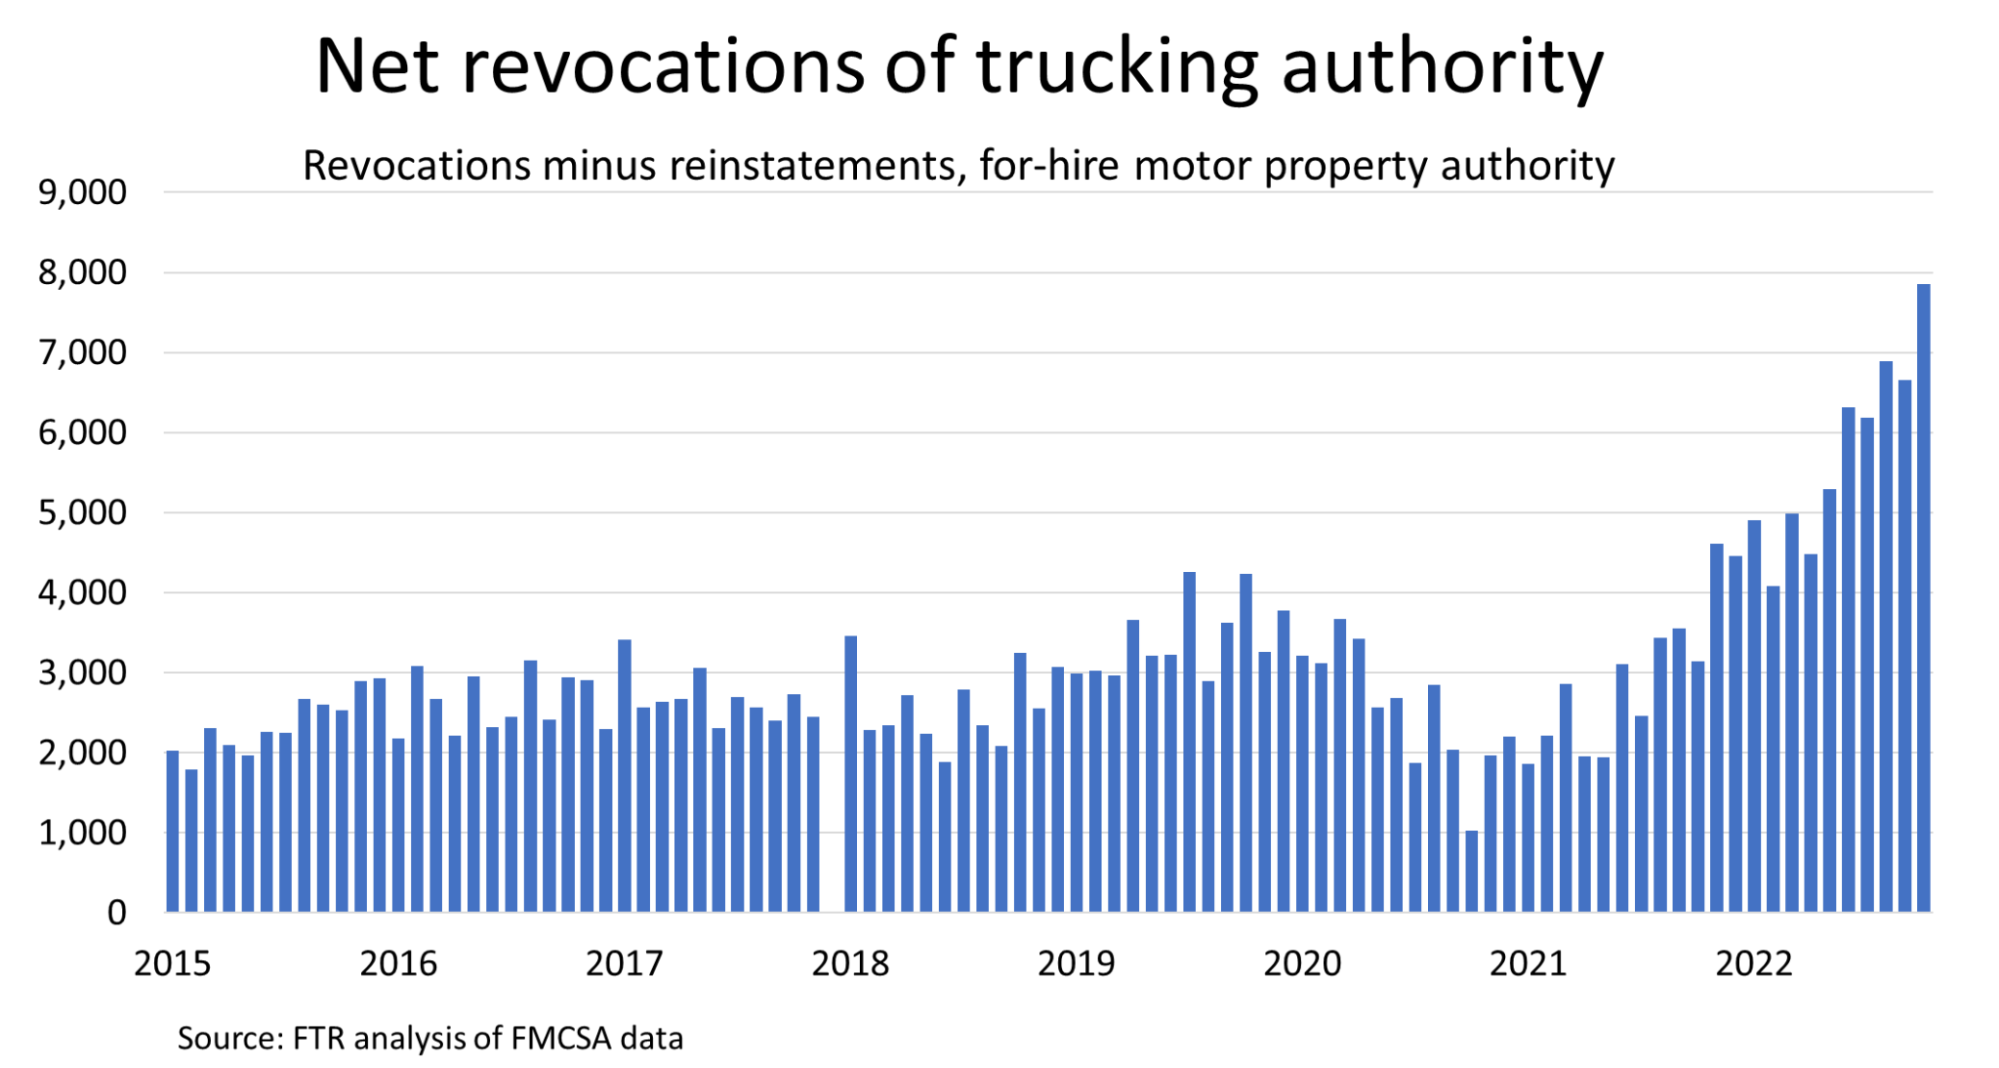
Despite rising trucking authority revocations, the period from April to October has seen strong trucking job growth. This trend further supports our theory that trucking employment numbers are increasing as fleets give up operating authority and drivers take company jobs with larger asset carriers.
Additionally, because employment data excludes owner-operators, it is becoming clear that far more drivers entered the market in the past few years than we could quantify.
We expect larger carriers to slow their hiring efforts if demand falls in the new year. In turn, employment will trend in the opposite direction, leaving a depleted workforce vulnerable to future demand surges.
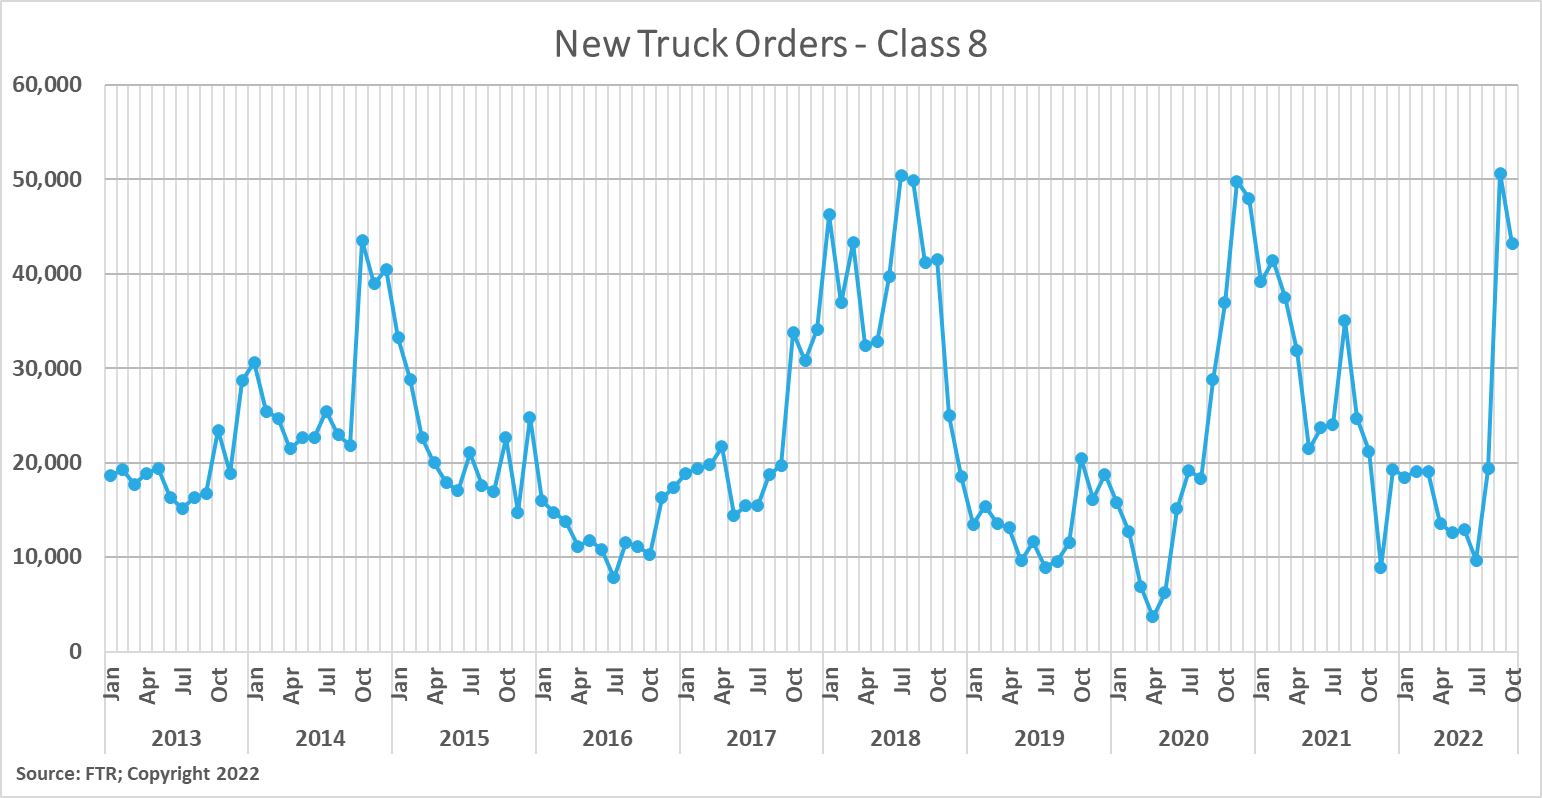
According to FTR, New Class 8 truck orders experienced another strong month, driven by pent-up demand due to several years of limited production that has stopped many fleets from replacing aged equipment; therefore, we do not consider new truck orders a strong indicator of carrier sentiment about future demand. Growing backlogs have increased the average time from order to delivery from 6.9 to 7.5 months.
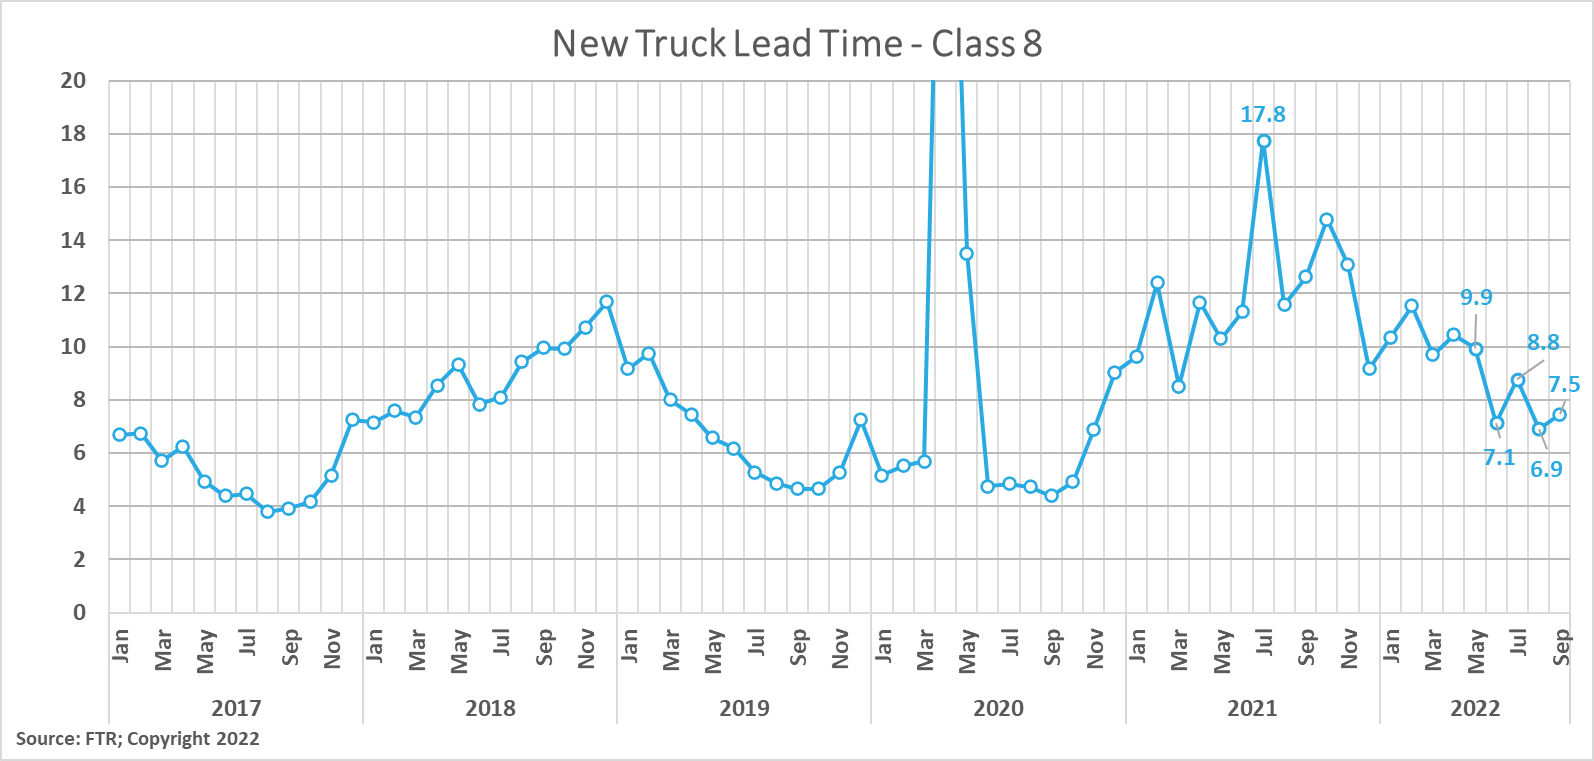 New truck lead time increased from 6.9 months in August to 7.5 months in September.
Shippers in Arrive’s network continue to note the value of drop trailers in creating efficiencies at warehouses amid capacity and labor shortages. The ability to manage surplusses has limited unnecessary dwell times and detention payments to carriers. Additionally, carriers find efficiency gains in drop trailers, getting increased asset utilization on tractors when limited time is spent waiting for loads to be loaded or unloaded. We expect this trend to continue as retail inventories remain elevated throughout the year. As a result, trailer orders jumped 38%, filling build slots through the first quarter of 2023.
At least in the near term, future demand indicators point to consistently strong volume. Even those that could cause concern point to gradual declines as normalization continues to be the theme of our forecast.
Still, several factors are working against future demand, namely persistently high inflation and increasing interest rates, which will eventually lead to declining volumes. However, we are not seeing nor are we expecting to see volumes fall off a cliff — the pullback is more likely to remain gradual.
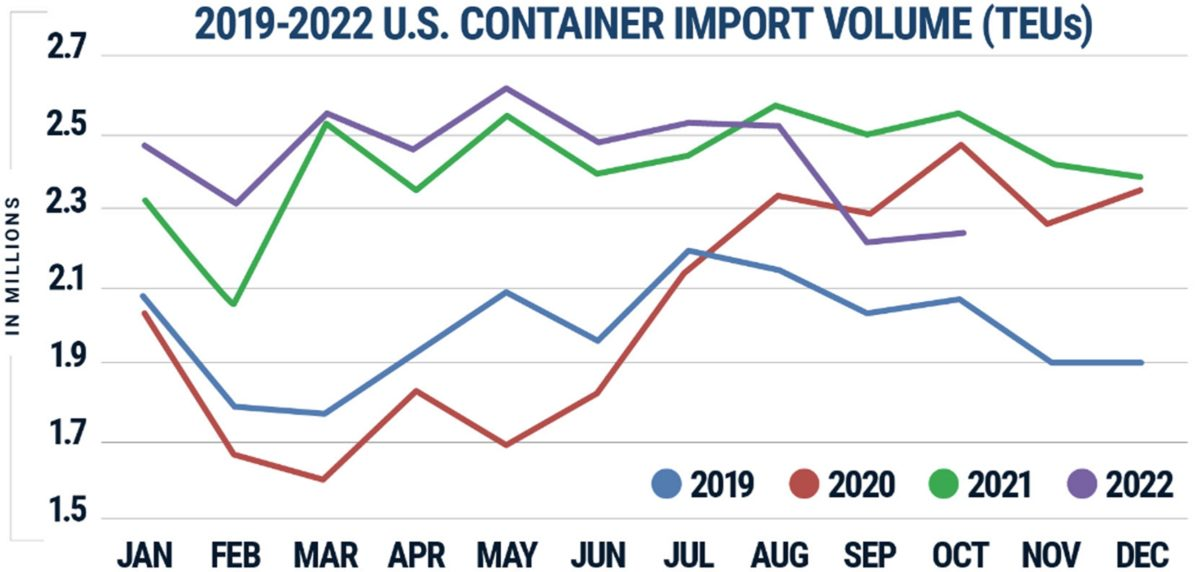
Import levels, a key contributor to overall truckload demand, are showing some stability month-over-month in October following a significant decline in September. U.S. ports handled 2.2 million TEUs in October; that number was down 13% compared to October 2021 but still up 7.2% compared to October 2019. Elevated retail sector inventory levels are at least partially to blame for the annual decline, as warehouse surpluses forced pullbacks in new shipments from overseas. If consumer spending power continues to be impacted by worsening economic conditions in 2023, we expect imports, particularly retail, to trend back toward pre-pandemic levels.
FreightWaves reports that just 87 container ships were waiting offshore of North American ports as of early November, 86% of which are at East and Gulf Coast ports where average unloading wait times remained at over ten days.
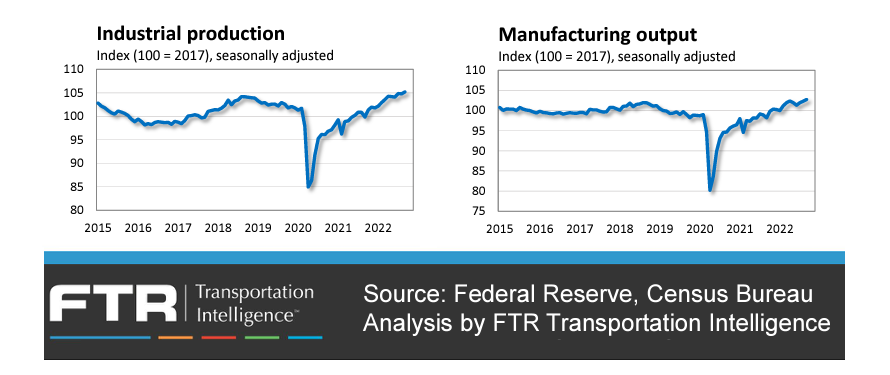
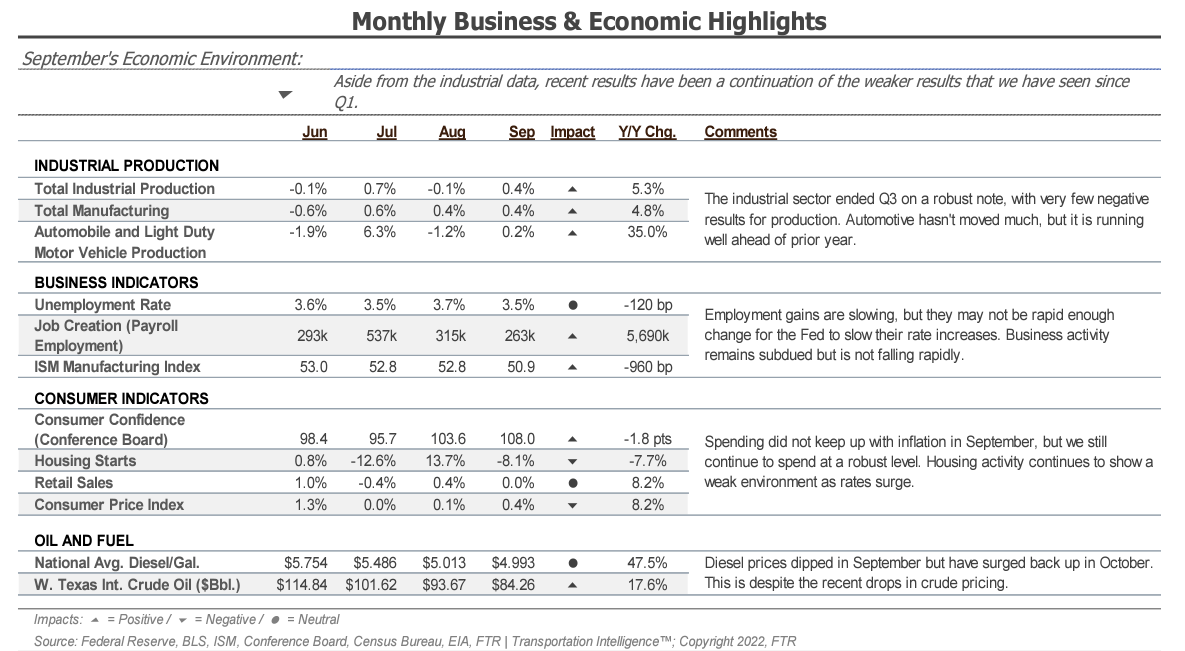
Industrial production and manufacturing output growth continued to be supported by backlogs built up over the last two years and remain well above pre-pandemic levels. These sectors heavily influence freight volumes and, if recent trends continue, should help support healthy demand well into 2023.
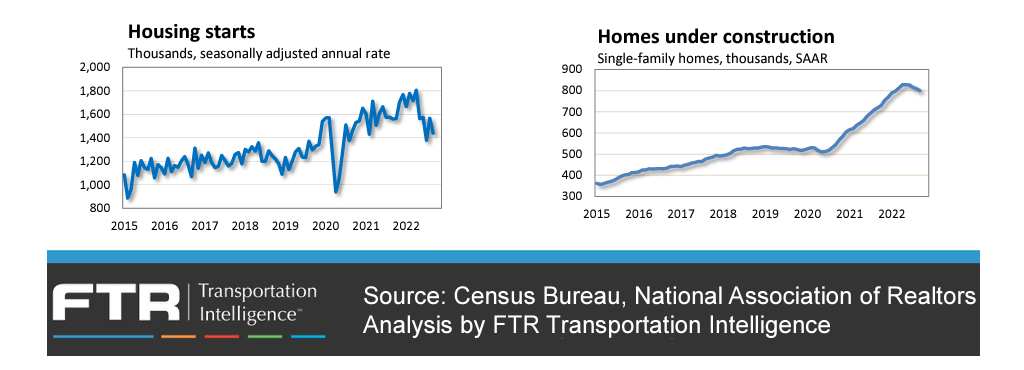
The housing sector is the most significant cause for concern, as rising interest rates have substantially slowed both new constructions and home sales since the start of the year. However, it is important to note that new builds remain historically high; nearly twice as many homes are under construction as before the pandemic. So, even if the housing sector continues to decline overall, the number of homes currently under construction will support a more gradual decline in freight volumes.
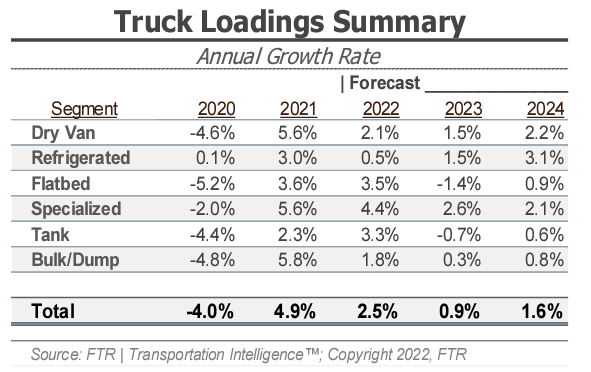
FTR’s latest truck loadings forecast showed a 2.5% year-over-year increase in 2022, up slightly from 2.4% last month. The 2023 forecast continues to show increasing downside risk; the latest update projected 0.9% growth, down from 1.2% and 2.0% projected in previous reports.
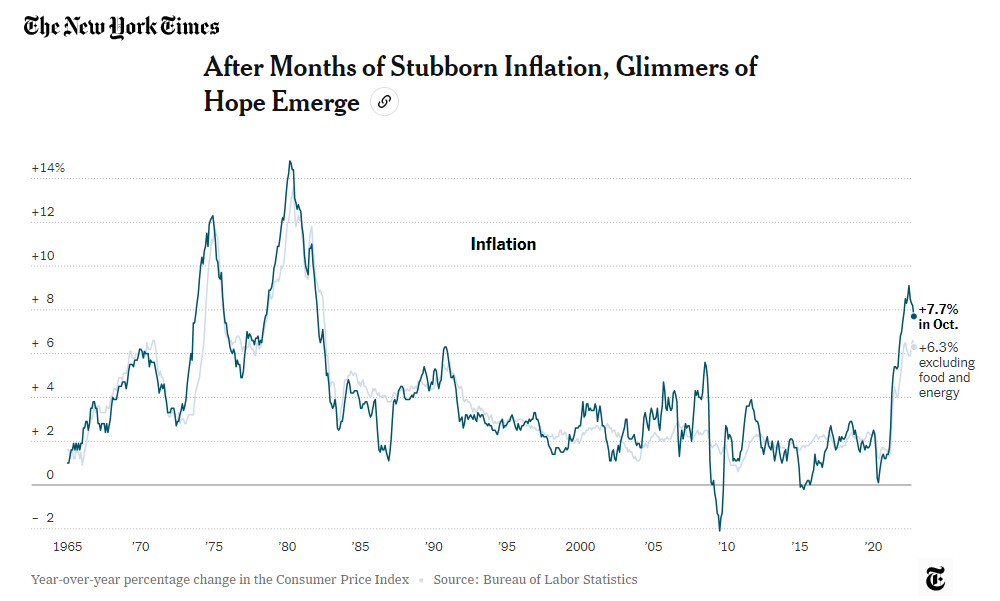
CPI data released in early November shows inflation cooled off more than expected in October, with year-over-year growth falling from 8.2% to 7.7% (6.6% to 6.3% when excluding food and energy). This decline could encourage the FED to ease off raising interest rates, but with inflation still well above the 2% annual growth target, increases are likely to continue for now.
Slowing price increases are a positive sign for consumers. The same goes for businesses, which should see supply-side constraints ease as demand declines. If a soft landing occurs, truckload demand may remain above pre-pandemic levels, even if a mild recession takes effect over the next year.
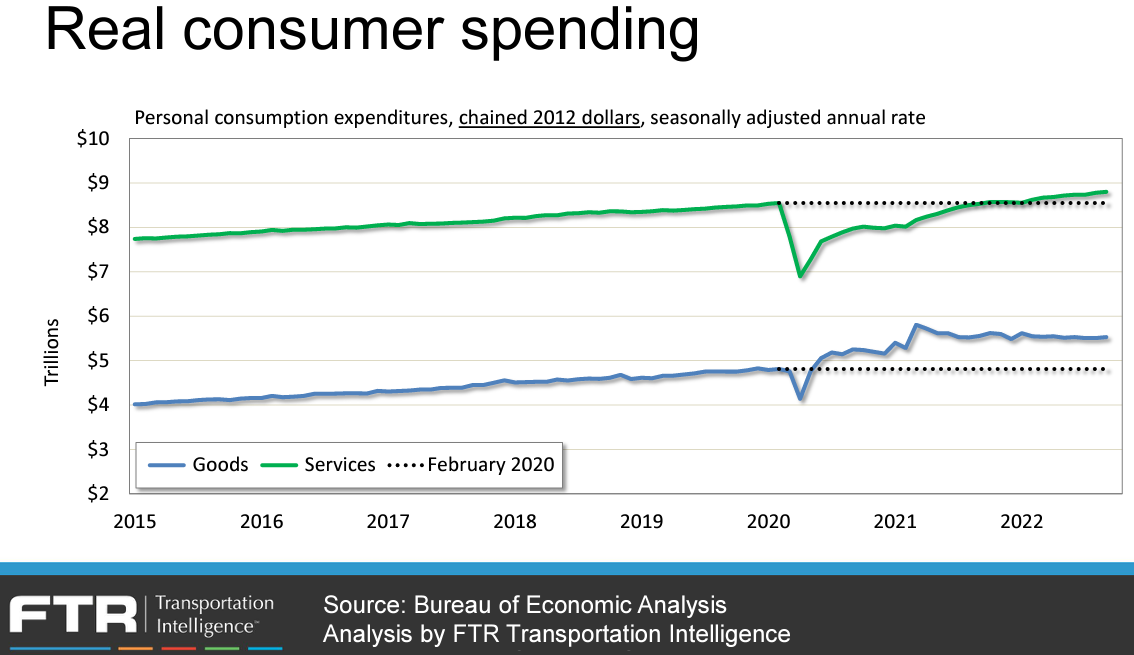
Consumer spending trends remained relatively stable overall, up 3.1% year-over-year and 0.5% month-over-month, on a seasonally adjusted basis. Rising fuel costs and restaurant spending had the most growth, while Amazon’s October edition of Prime Day led to a jump in online retail sales.
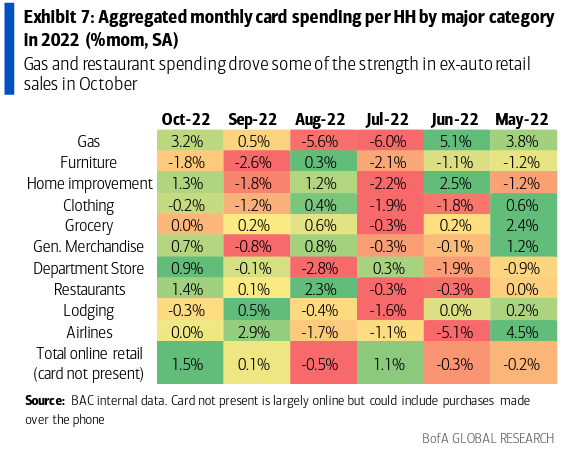
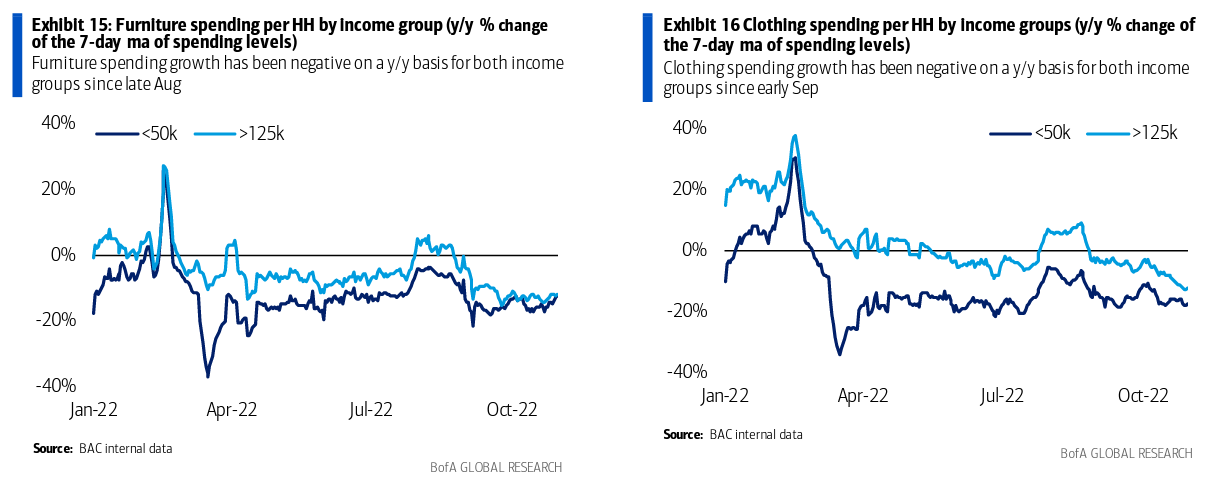
Consumer durable goods spending remains above the historical trendline but has plateaued as consumers continue dumping dollars into service-related expenses. Furniture and clothing spending slowdowns across all income groups are a significant reason for declining durable goods growth and overall import levels.