
Truckload demand has again shown no real signs of slowing down early in the fourth quarter. As a result of record import levels to support maintaining inventories amid a consumer spending boom, port congestion continues to be the biggest driver of these trends. Some improved contract compliance rates resulted in a slight pullback in spot volumes, but overall demand remains as robust as ever.
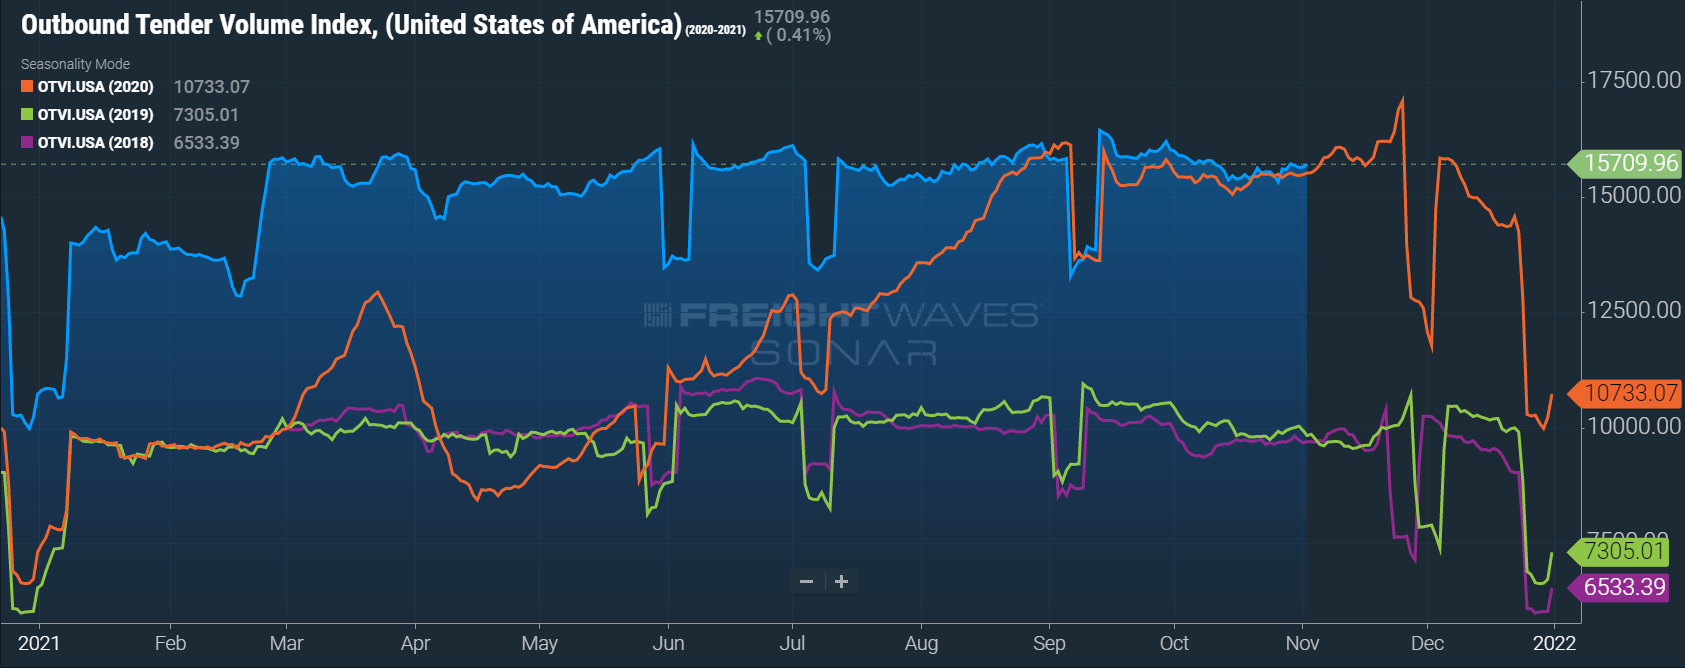
FreightWaves SONAR Outbound Tender Volume Index (OTVI), which measures contract freight volumes across all modes, was up 1% year-over-year at the end of October. It is important to note that OTVI includes both accepted and rejected load tenders, so we must discount the index by the corresponding Outbound Tender Rejection Index (OTRI) to uncover the true measure of accepted tender volumes. If we apply this method to the year-over-year OTVI values, the growth in volume increases to 7%. Tender rejections are now lower than a year ago by nearly 20%, contributing to the OTRI adjusted measure’s higher growth in actual freight volumes.
When drilling down to specific equipment types, the dry van tender volume index was flat, and the reefer tender volume index were both down 1%, year-over-year. This equated to a 6% increase and an 8% increase in actual volumes for the two modes, respectively. Tender rejections are lower for both equipment types year-over-year, resulting in improved growth rates when considering actual volumes.
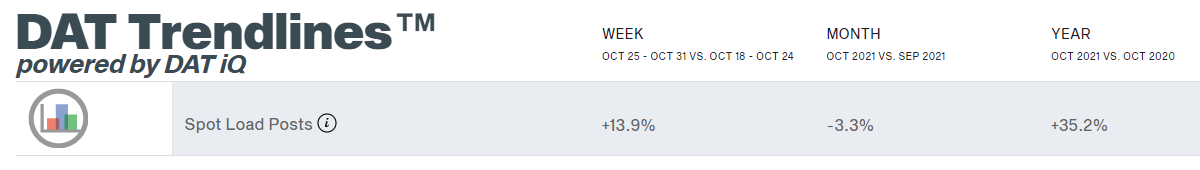
The improved contract tender acceptance rates meant less volume went to the spot market. DAT reported dry van spot load posts fell by 3.3% month-over-month but are still up more than 35% year-over-year in October. This is a slight uptick from September, where year-over-year spot load posts were up 31.5%.
It is normal to see activity pick up as November commences. Shippers are running out of time to get products in position for the start of the holiday shopping season. This was apparent in the 13.9% increase in spot load posts in the month’s final week compared to the prior week.
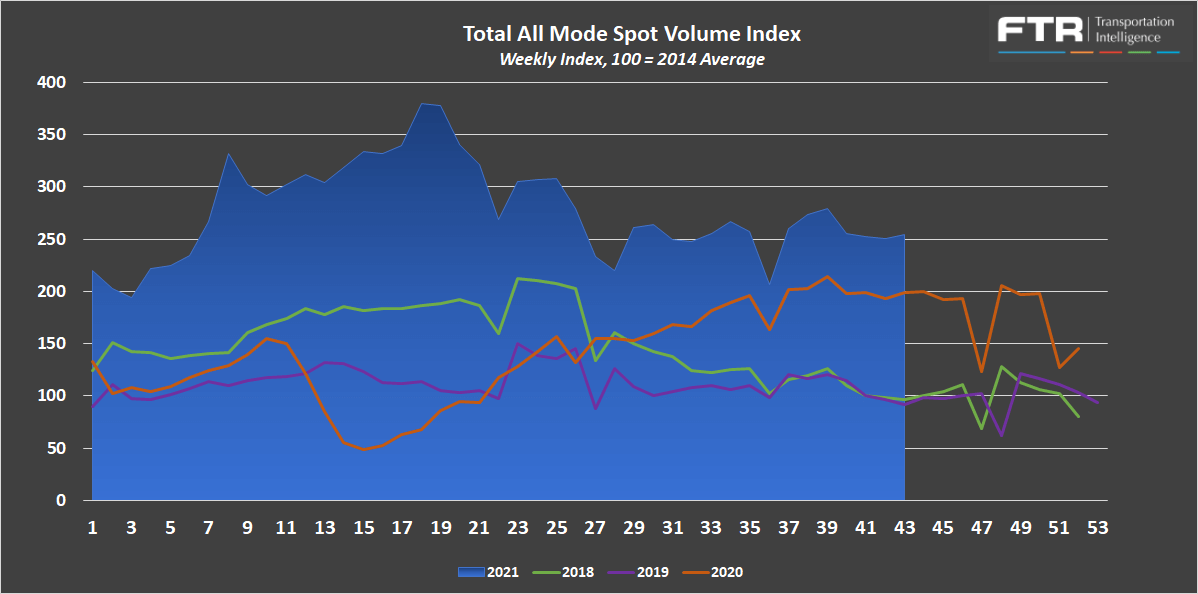
FTR and Truckstop’s Total All-Mode Spot Volume Index finished October down 9% from the last week in September. The all-mode index remains up 28% year-over-year, down from 112% year-over-year at the end of June, 66% at the end of July, 41% at the end of August, and 30% at the end of September. This month-over-month decline is consistent with what we have seen in the monthly year-over-year DAT spot volume trends.
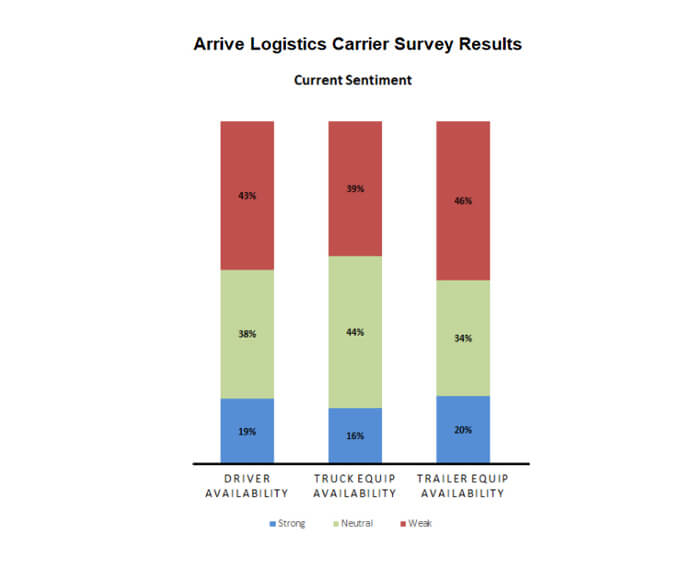
Despite all the talk about supply chain issues and challenging market conditions, we saw capacity conditions ease slightly throughout October. This is likely the calm before the storm and not unusual this time of year after the push at the end of the third quarter dies down and before the retail peak season really gets underway. Conditions were still very tight, and it was not easy or cheap for shippers to move their freight. Although we did see tender rejection rates dip below 20% for the first time since July 2020. Carriers continue to point to truck and trailer shortage challenges and driver availability issues, all contributing to their inability to keep up with demand.
Sonar Outbound Tender Reject Index (OTRI) measures the rate at which carriers are rejecting the freight they are contractually required to take. The index is currently at 20.22%, down from 21.78% at the end of September, but up slightly from the low of 19.8% seen near the end of the month. We believe that elevated contract rates, which have been on the rise over the past year, are finally leading to some improved tender acceptance rates. Particularly during the brief periods of seasonal easing of demand pressures. The fact that rejection rates are still north of 20%, however, indicates we are not out of the woods yet, especially with the expected demand surge in the coming months.
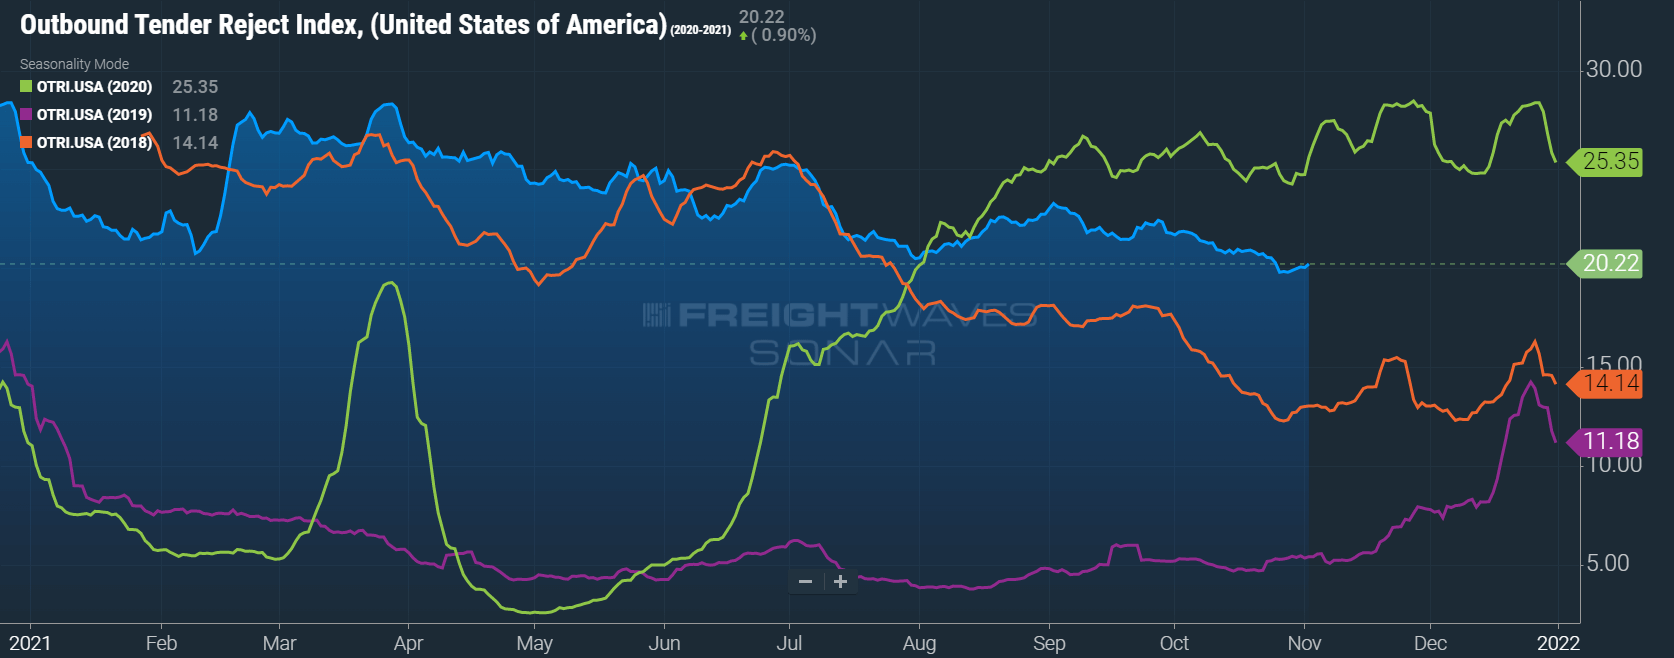 OTRI dropped below 20% for the first time since July 2020 but quickly rebounded and currently sits at 20.22% early in November.
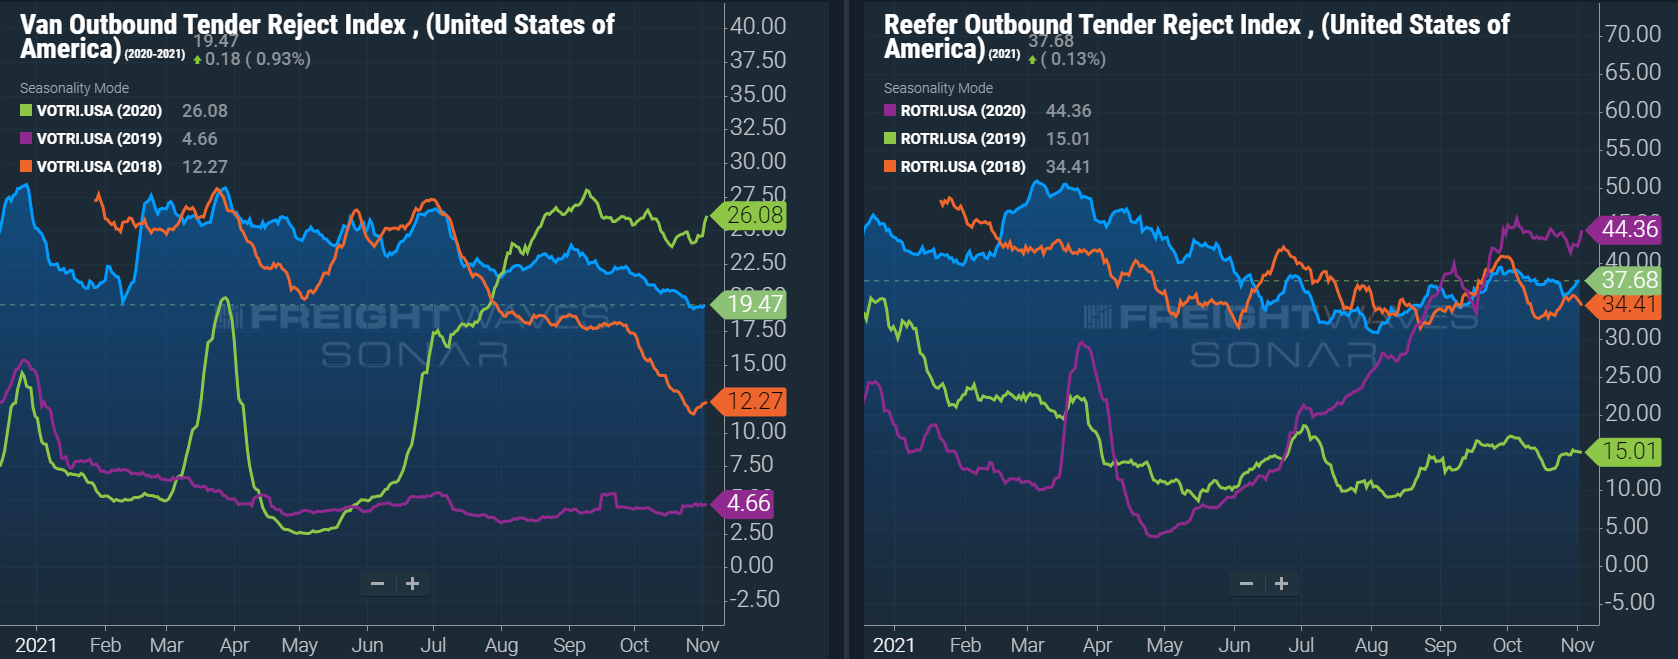 Dry van rejections followed a similar trend to the all mode index, falling throughout the month. Reefer rejections dipped late in the month but remain highly constrained at 37.68%.
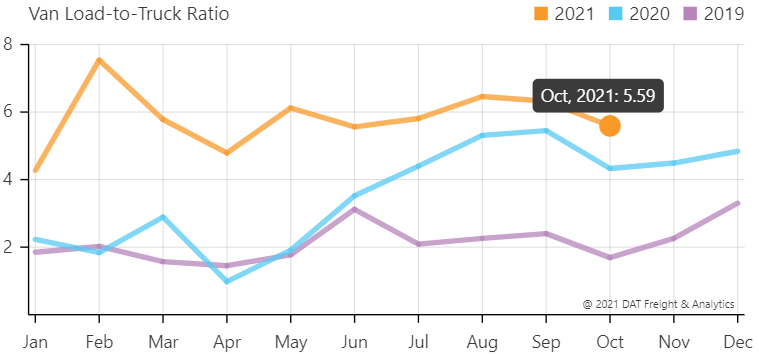
The DAT Load to Truck Ratio measures the total number of loads compared to the total number of trucks posted on their load board. In October, the Dry Van Load to Truck Ratio decreased to 5.59, down 11.6% month-over-month but up 28.9% year-over-year. The 11.6% month-over-month decline was less than the 20.6% decline seen from September to October in 2020 and the 29.6% decline seen in 2019, which provides support to the idea that it is normal to see slightly softer conditions in October, but that this year capacity constraints resulted in a lower overall decline.
The Reefer Load to Truck Ratio decreased to 12.03, down 10.9% month-over-month, but up 38.3% year-over-year. The Reefer Load to Truck Ratio decreased by 10.2% in October 2020, and 23.7% in October 2019, indicating similar resistance to easing pressure this year as seen in the Dry Van sector.
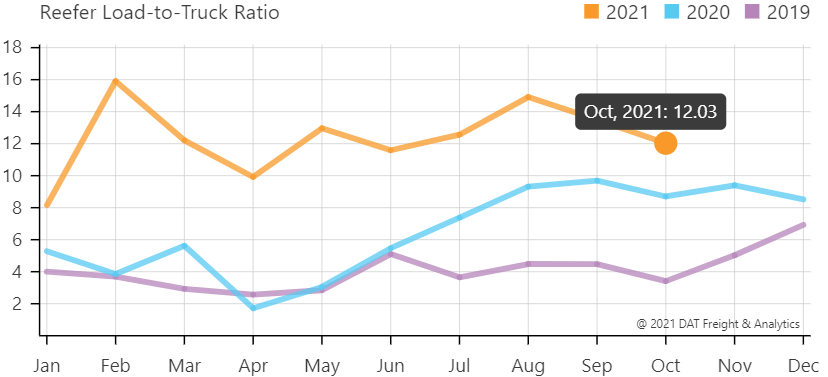
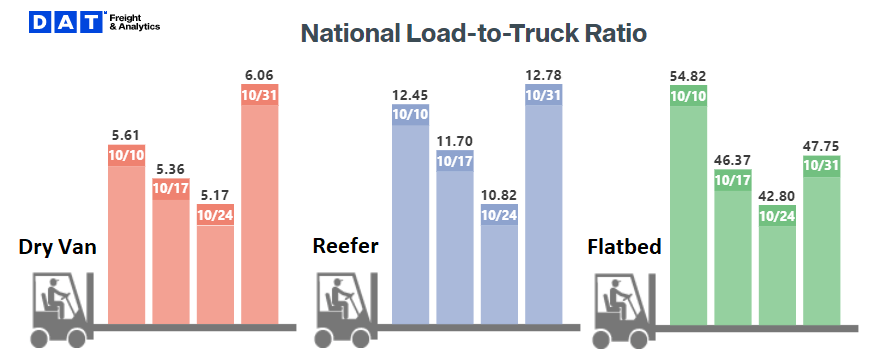
The weekly load to truck ratios show conditions tightened in the last week of the month after several straight weeks of moderation. This is in line with trends seen in tender rejections and the end-of-month tightness coincides with the increasing sense of urgency shippers are feeling as November gets underway.
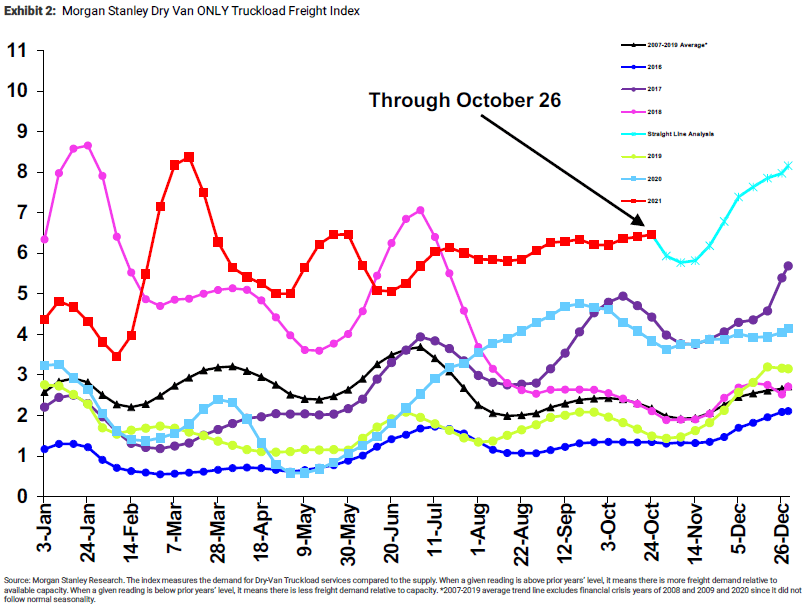
The Morgan Stanley Dry Van Freight Index is another measure of relative supply. The higher the index, the tighter the market conditions. According to the index, conditions remained mostly flat but saw some tightening as of late. Looking forward, normal seasonality indicates easing conditions leading up until just before Thanksgiving, where we would expect to see tightening conditions throughout the remainder of the year in line with retail peak shipping season. Their straight-line forecast indicates we will see conditions finish the year well above any other year on the chart, with conditions tighter than at any point this year except in the immediate aftermath of the February winter storms.
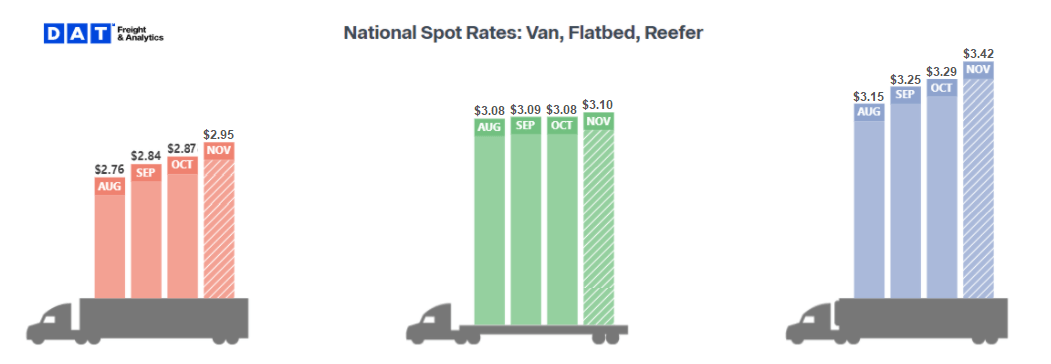
Dry van spot rates reached a new all-time high of $2.87 per mile, including fuel, in October. Early November results show dry van spot rates have already trended up rather quickly and currently sit at $2.95 per mile. Reefer spot rates climbed $0.04 to $3.29 per mile in October and have also risen quickly, to $3.42 per mile, in early November. In both cases, we expect the full month of November to illustrate additional rate increases as a result of surging demand in the back half of the month. Flatbed rates, including fuel, which have been relatively stable over the last few months, showed a $0.01 decline to $3.08 in October and a slight increase to $3.10 in early November.
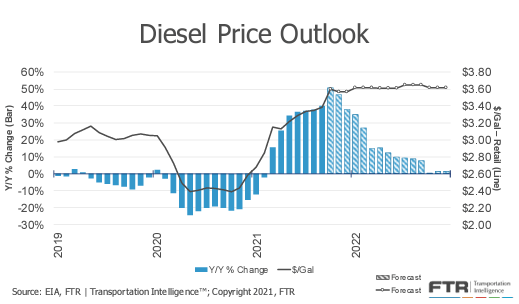
The story around rate trends looks slightly different when you exclude the fuel surcharge and isolate linehaul rate only. Diesel fuel prices are up 53% from last November to $3.73 per gallon, the highest price since 2014. This increase has resulted in dry fuel surcharge increases of $0.03 per mile in October and an additional $0.02 per mile in early November. The fuel surcharge increase wiped out the gains in dry van rate increases, bringing the growth to flat month-over-month in October.
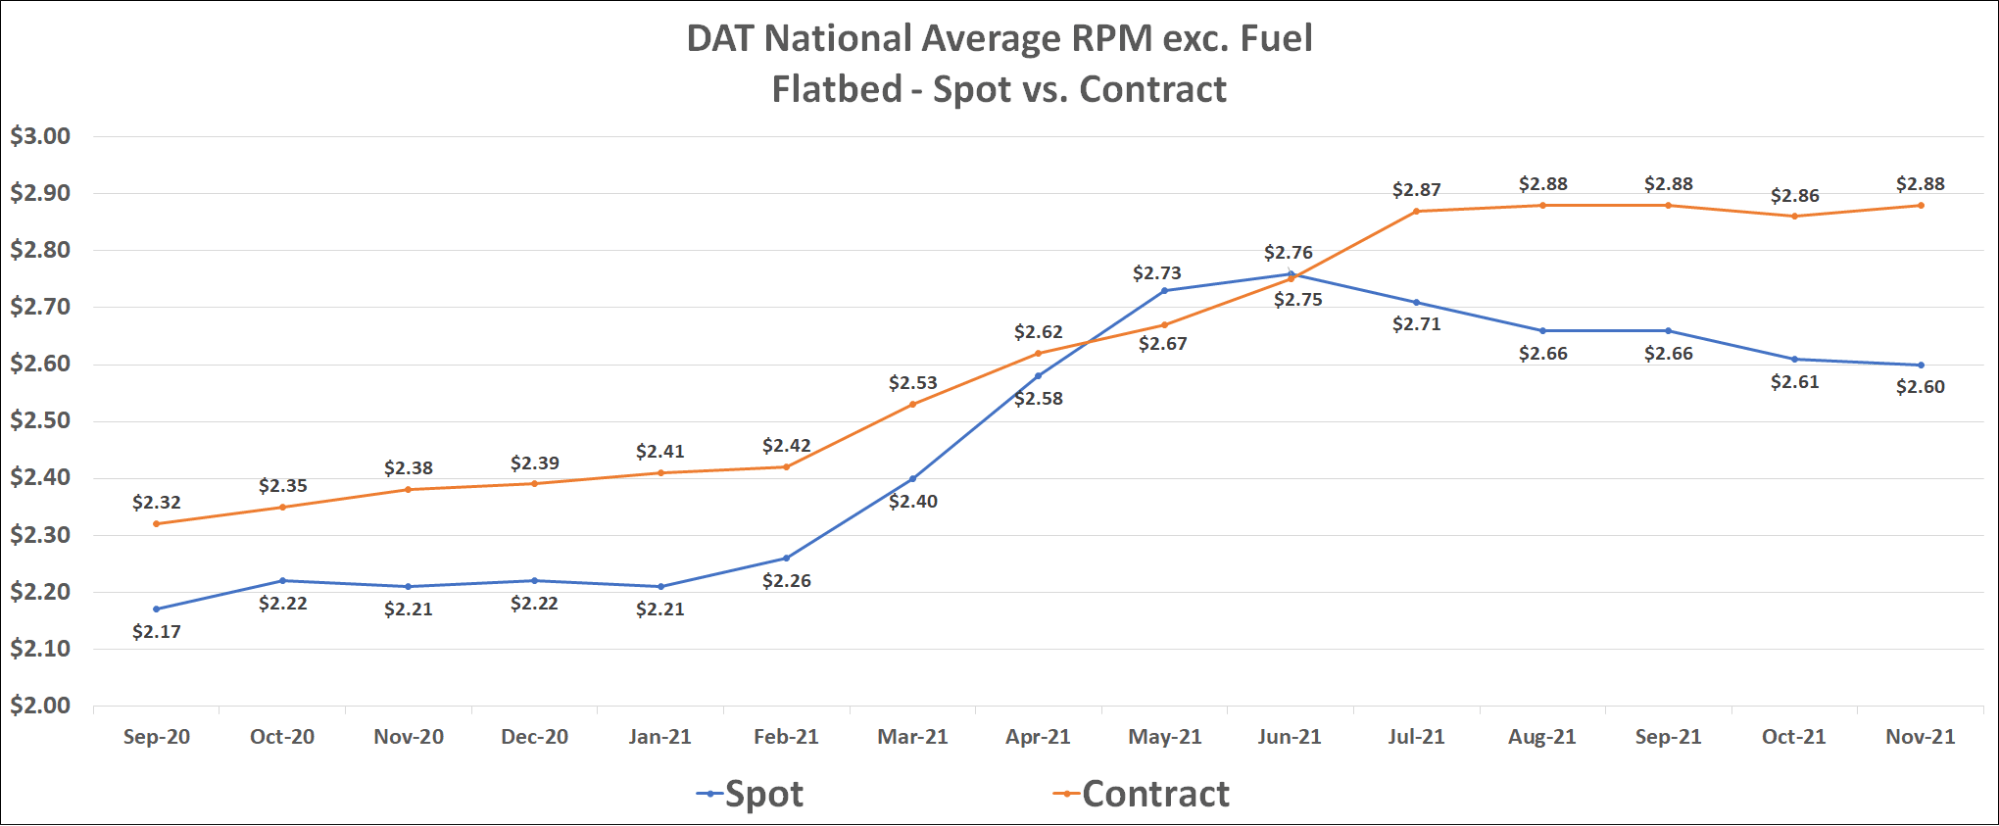
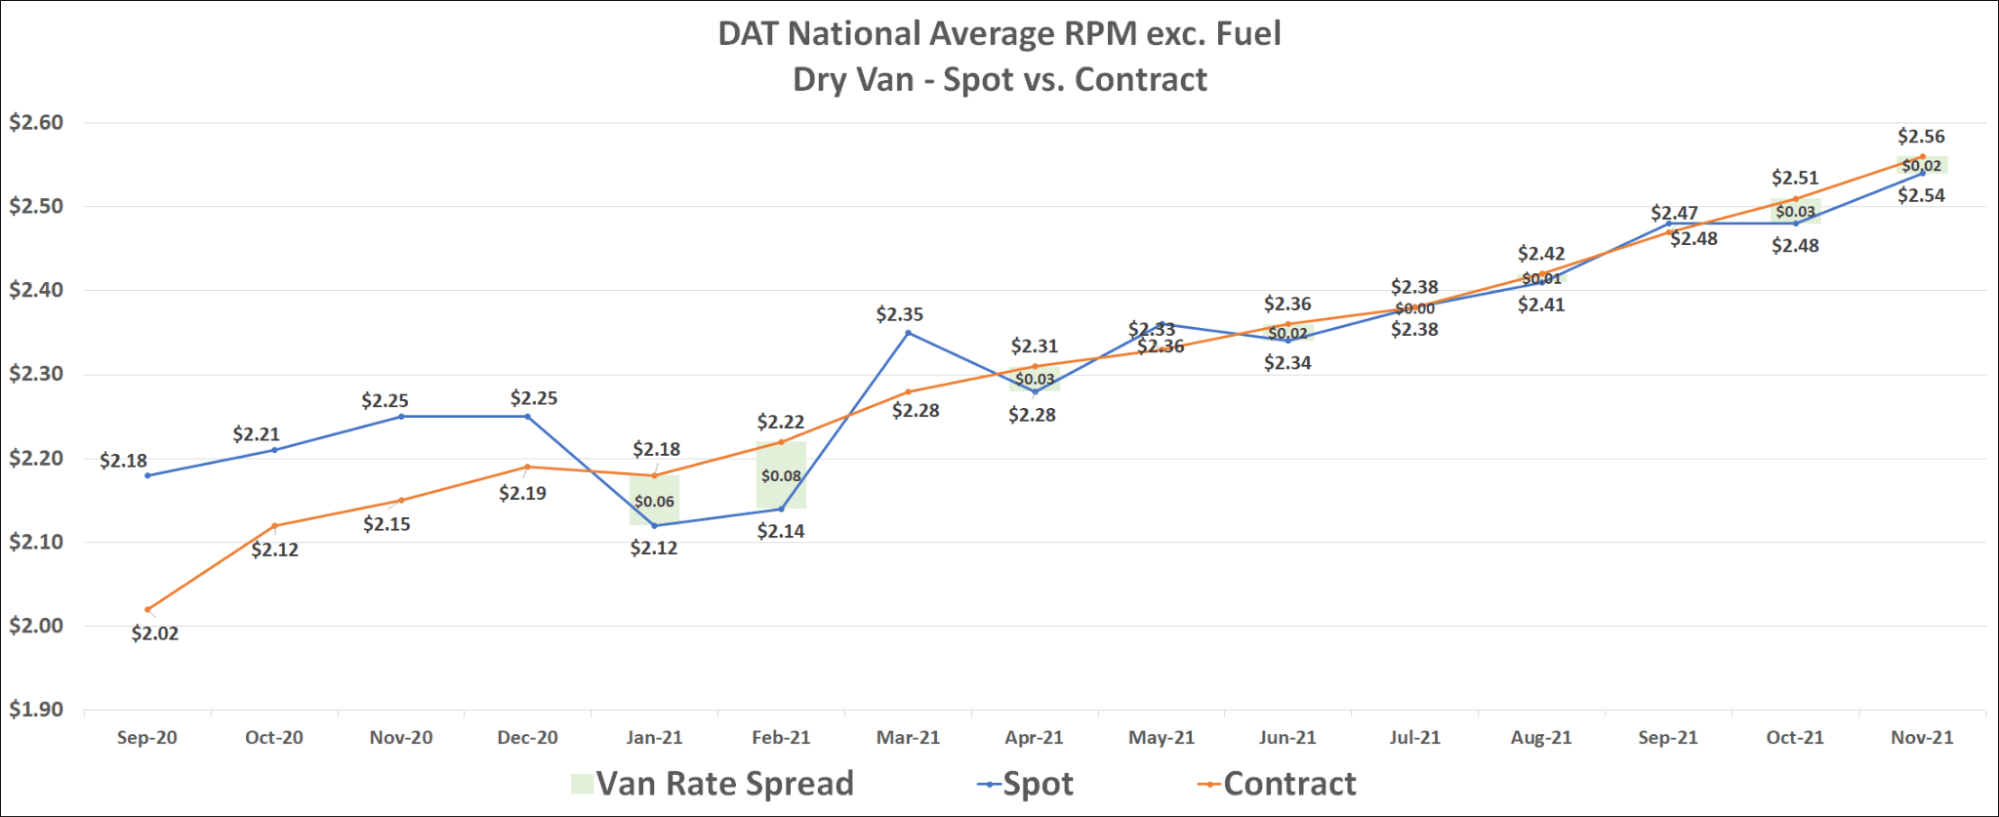 The Contract and Spot Van Rates continue to climb in unison to new records. Until we see rate stability, the fine line between spot and contract rate agreements will remain blurred.
Dry van contract rates, which have not declined month-over-month since May 2020, reached a new all-time high in early November at $2.56 per mile, excluding fuel. Contract rates also remain elevated above spot rates in the Flatbed market, where current contract rates moved in line with previous record highs, excluding fuel, of $2.88 per mile in early November.
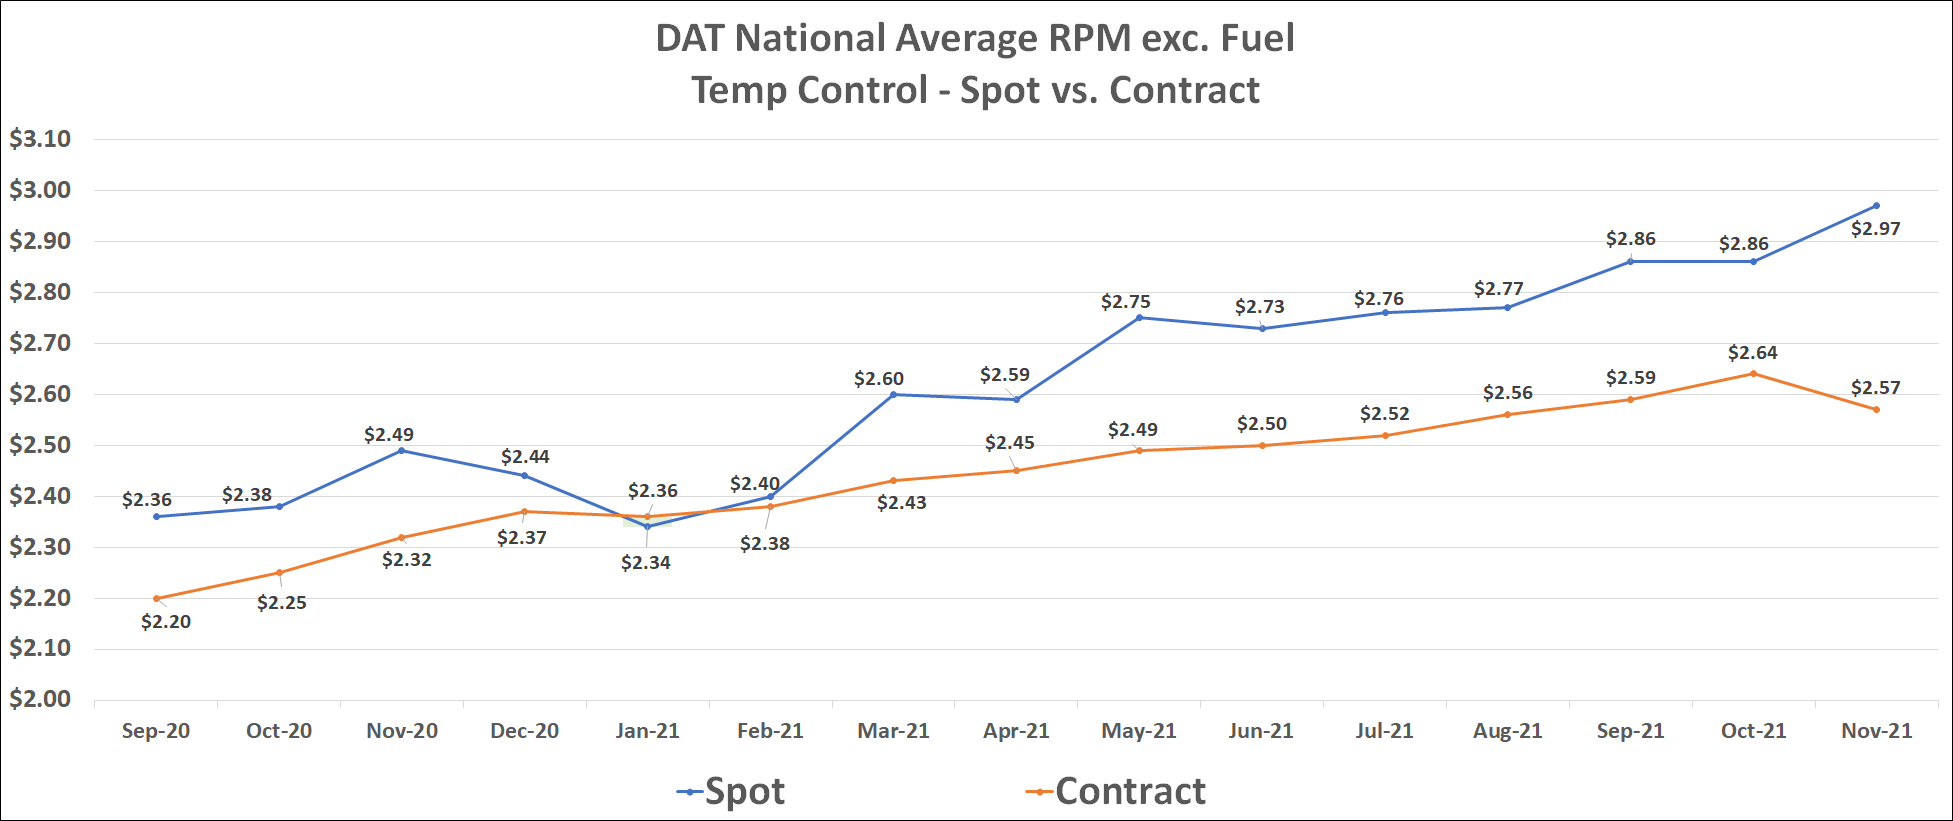
Temp control, on the other hand, has deviated from recent trends, with contract rates crashing $0.07 per mile month to date in early November. This decline is a deviation from normal and opposite the trends seen in the spot market as reefer demand typically surges in advance of the holidays.
FTR’s Driver Labor Index decreased by 0.1% in September based on just 2,500 payroll jobs added on a seasonally adjusted basis in the month. This increase, which was down from 6,000 jobs added in August, leaves total payroll employment at 21,900 jobs, or 1.4%, below February 2020, down slightly from 1.7% a month ago.
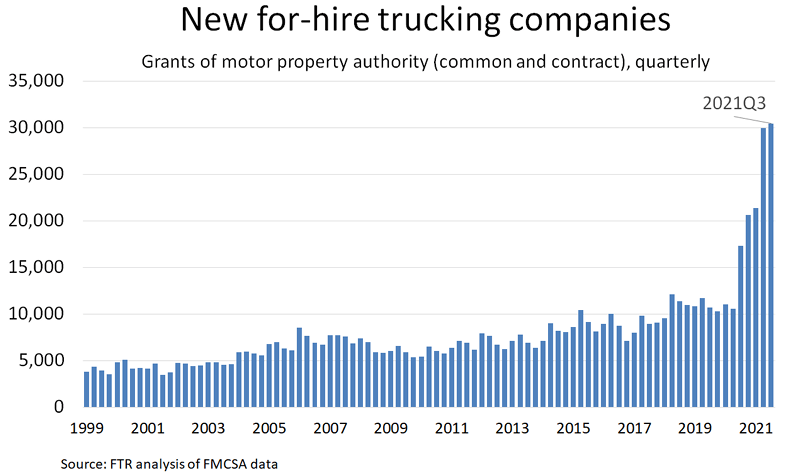
We continue to note the growth in capacity realized on smaller fleets. Since July of 2020, the Federal Motor Carrier Safety Administration (FMCSA) has authorized more than 95,000 new for-hire carriers that were still in business as of September 2021. These carriers comprise just 185,000 drivers, indicating a large portion of the new fleets are just one truck. Last month we reported that between March 2020 and September 2021, the number of one-truck operations holding authority has increased by 52%, and the number of carriers with two to five trucks rose by 29%. We also noted that carriers with 100+ power units saw their total market share of trucks on the road decrease from 52% to 49%.
Luckily for shippers, the vaccine mandate that was rolled out this week will include an exemption for employees who work exclusively outdoors or remotely and have minimal contact with others indoors. This means solo truck drivers will be exempt from the mandate. This is a huge relief for the industry as preliminary estimates by the ATA indicated that as much as 13% of drivers would be forced out of the industry if the mandate did not exclude truck drivers. In an already constrained environment, an additional 13% decline in capacity on the road would have been devastating and caused rates to continue to soar.
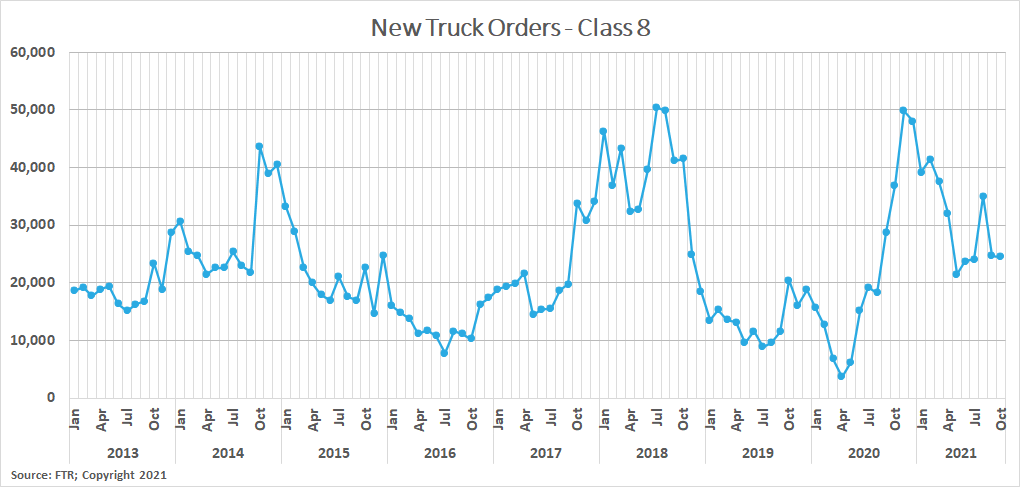
The equipment side of the equation saw no improvements month over month, as Class 8 truck production fell 3% in September. Parts shortages were mostly to blame as OEMs continue to forecast limited production levels until semiconductor and other supply shortages are resolved. This decline in production levels led to a slight increase in the average time from order to delivery from 11.6 months in August to 12.5 months in September.
New trailer production levels increased in September, as OEMs produced 4% more units on a per-day basis. FTR continues to indicate that the industry is in a holding pattern until the supply chain issues impacting availability for truck parts and trailer production are resolved. In the meantime, it will be difficult for fleets to acquire new trucks or trailers.
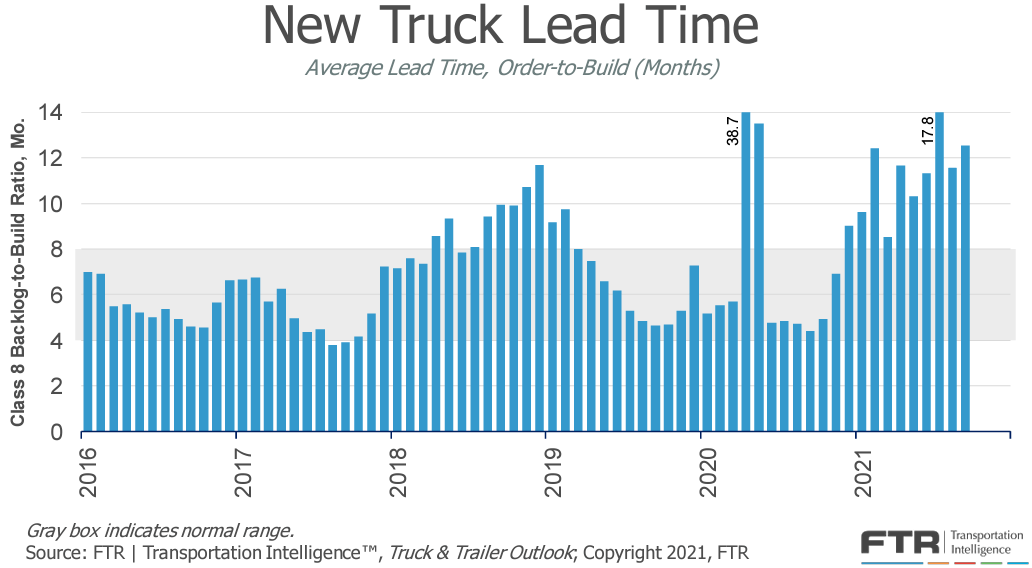 New truck lead time increased from 11.3 months in June to 17.8 months in July.
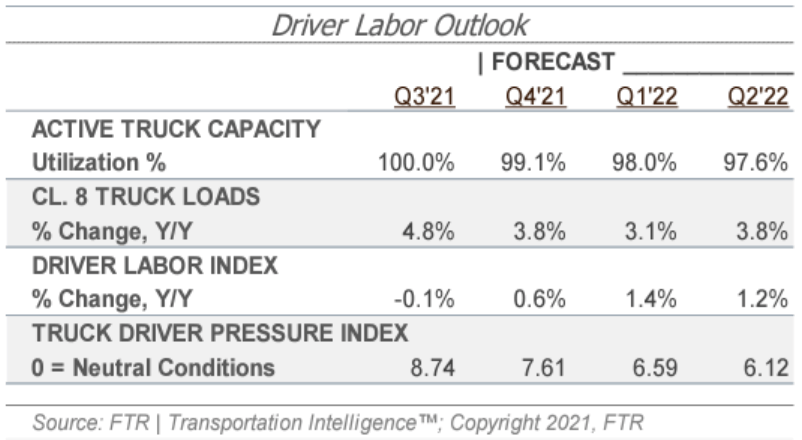
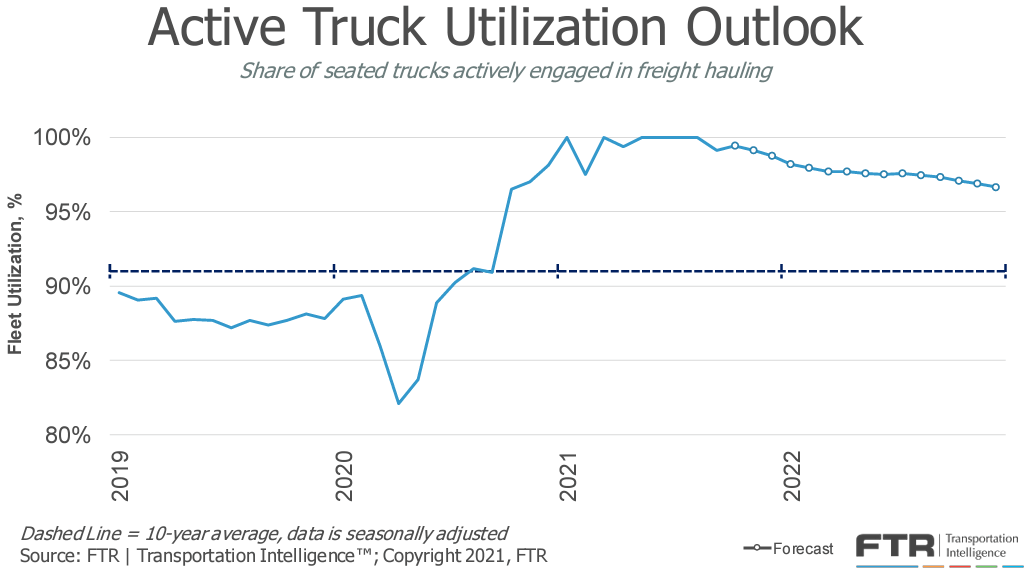
FTR’s forecast for truck utilization, the share of seated trucks actively engaged in freight hauling, strengthened in the most recent month. Utilization is now expected to reach 99% by year-end and remain above 97% through the end of next year. FTR noted that the slope downward is expected to be far shallower than in late 2018 and 2019 when the market began to cool. They cite depressed U.S. labor participation, robust labor competition from other sectors, and the drug and alcohol clearinghouse, which has flagged 90,000 drivers with violations since January 2020, as headwinds to restoring capacity levels. This supports the theory that the return to equilibrium will include more gradual rate declines than what was seen in prior market cycles.
As retail peak season gets underway, conditions throughout the remainder of the year seem unlikely to change. Strong import volumes are expected to continue supplying much needed raw materials to support manufacturing and industrial production, as well as finished goods to fulfill backlogged customer orders which will hopefully be arriving in time for the holidays. In early November, there were nearly 80 ships at anchor off the coast at the ports of Los Angeles and Long Beach, about the same compared to the 75 we indicated in our last report. Backups and congestion are also seen at the East coast ports as ships are attempting to bypass the congestion in Southern California when it makes sense. The ports are doing everything they can to improve the situation, but it is unlikely that significant relief will be felt before early 2022 once the backlogs can be worked through. This will require collaboration from the ports, shippers and both intermodal and over-the-road carriers, who all play an important role in keeping the freight moving.
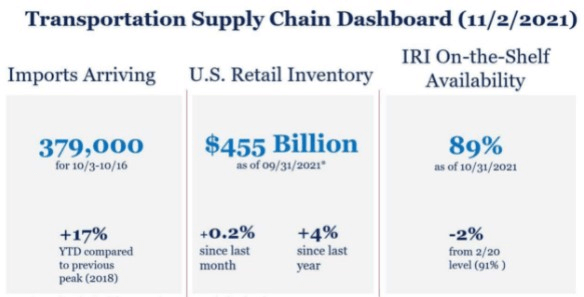 New White House dashboard illustrates the surging demand for imports, up 17% from the prior peak in 2018, and slightly lower on-the-shelf availability of products, down 2% from pre-pandemic levels.
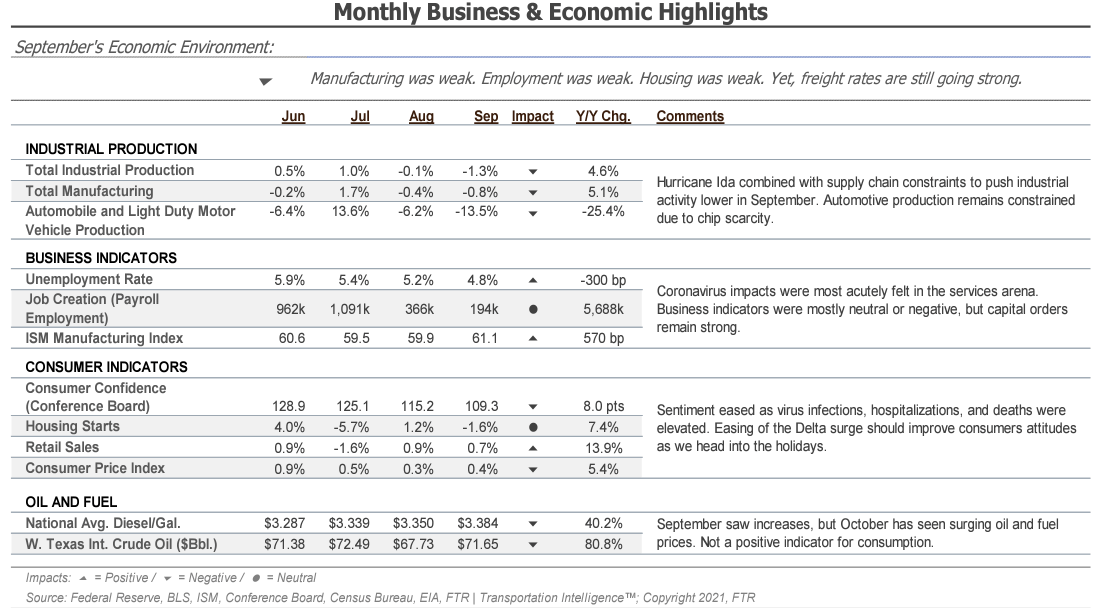
Manufacturing and industrial production continue to be bottlenecked severely by supply chain issues. The outlook for both sectors remains high due to low inventories and consistent demand. However, both manufacturing and industrial production levels fell in September as commodity and parts shortages, as well as impacts from Hurricane Ida limited output. New orders remained unchanged month-over-month, meaning backlogs are continuing to grow. As we look to forecast freight volumes in 2022, these backlogs are likely to be a key component driving our expectation for demand to continue to buck seasonal trends and remain strong through typical, seasonal slowdowns in the first quarter.
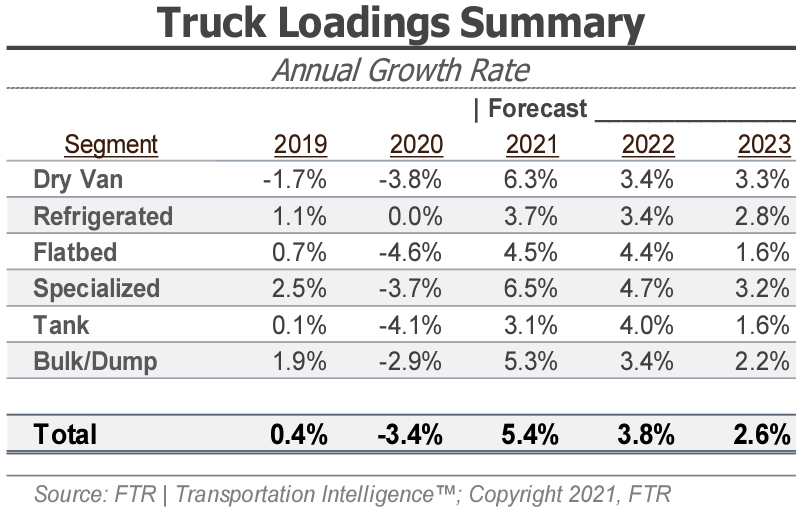
FTR’s latest truck loadings forecast shows a slightly weaker outlook for 2021 than last month’s forecast coming in at 5.4% for the full year, down from 5.8% last month. The 2022 forecast is also slightly weaker at an increase of 3.8% year-over-year, down from 4.2% a month ago. In the dry van sector, the forecast shows an increase in expected total truck loadings of 6.3% for the full year, down slightly from 6.4% a month ago. Declines were seen month-over-month across all equipment types for the full year 2022 forecast. Dry Van and Refrigerated loadings are expected to see 3.4% increases, down from 3.7% and 3.8%, respectively. Flatbed loadings are expected to climb 4.4% for the full year of 2022, down from 4.9% last month. Regardless of the slightly weaker outlook, volumes are expected to continue to grow into next year. This anticipated growth in demand will continue to stress carrier networks and provide upward pressure on rates until capacity can be added to the road.
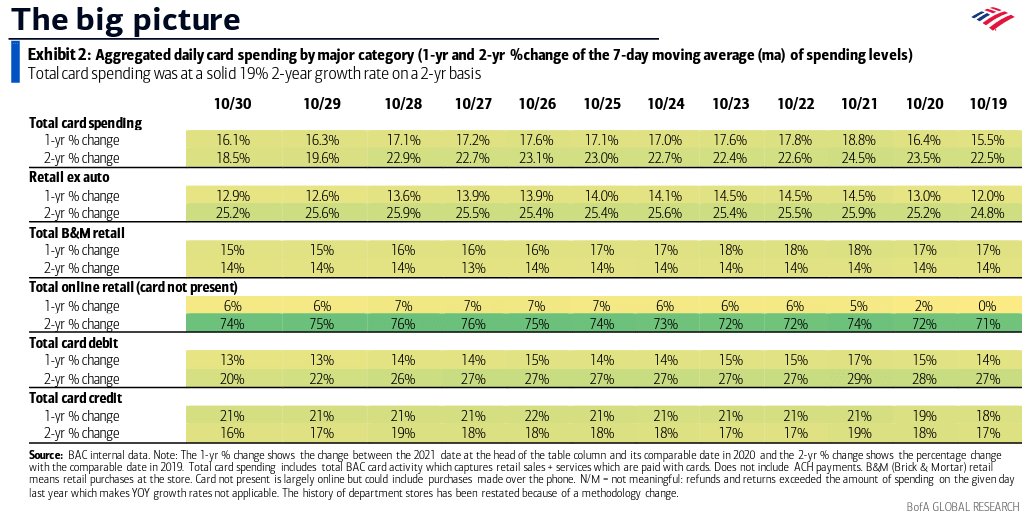
The Bank of America (BofA) consumer spending data provides visibility into changing consumer behaviors and spending patterns. Total card spending is up 16.1% year-over-year and 18.5% compared to 2019 for the 7-day period ending October 30th. These numbers indicate consumer spending is still significantly elevated as we enter November.
Consumer demand remains a key variable in whether or not we see strong truckload demand persist throughout 2022. Elevated consumer activity levels are the main reason for the supply chain congestion and backlogs we face today. Changes in consumer behavior will likely be necessary to ease pressure and allow inventories to be replenished, slowing demand and enabling a return to equilibrium. There are some signs we might be starting to see changes in the data that points to this trend taking place.
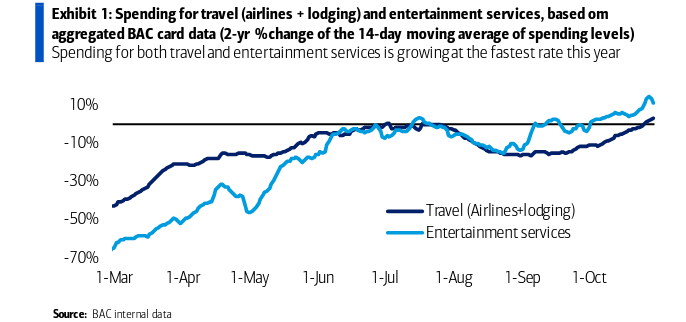
The first indication that we are seeing consumer behavior changes is apparent when looking at spending on travel and entertainment services. As of late, we have seen spending on these sectors increase at the fastest rate this year. This is particularly true in the higher income bracket, those earning >$125k per year, where we’ve seen the majority of the recent overall spending strength.
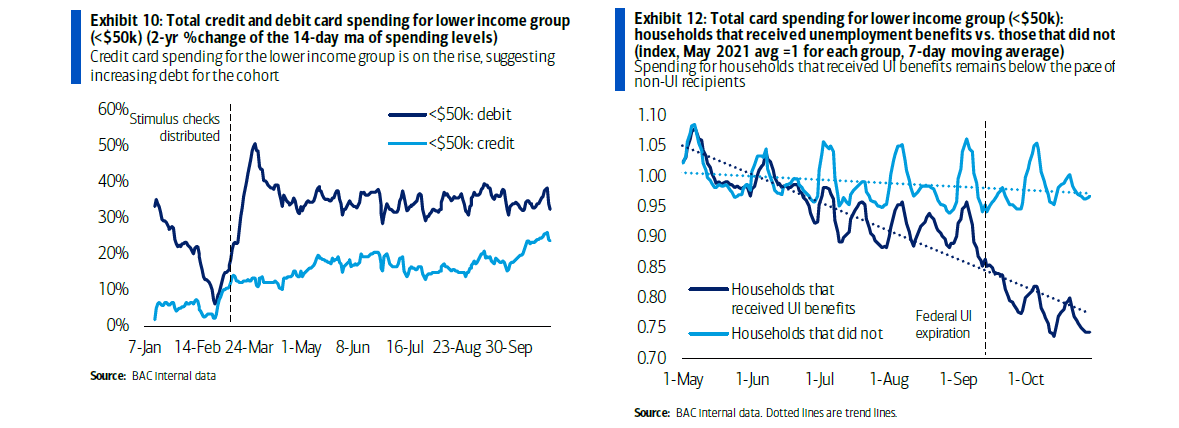
In contrast to the gains in spending on the higher income bracket, there are signs that elevated spending at the lower income bracket is no longer sustainable. As of late, we have seen credit card spending on the rise, indicating that the cohort is likely seeing increasing debt levels. This trend appeared just as the federal unemployment insurance benefits were expiring. The gap in spending between those who were receiving the benefit and those who were not has rapidly expanded since the benefits expired.
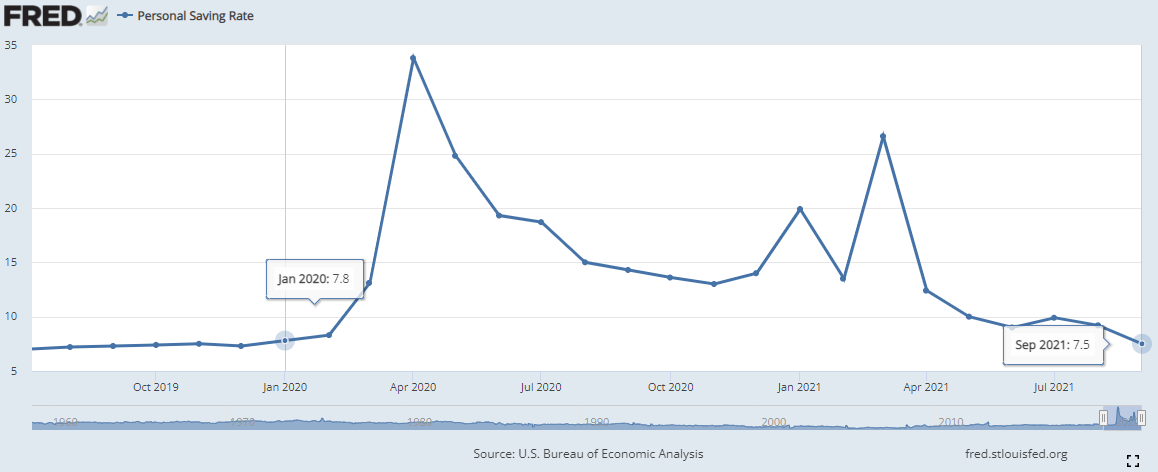
Further supporting the idea that current levels of consumer spending are not sustainable is the recent trend in the personal saving rate, the percentage of disposable income that individuals set aside for personal saving. After a stretch of elevated levels due to government stimulus, we have now seen the personal savings rate fall below January 2020 levels for the first time since the pandemic hit.
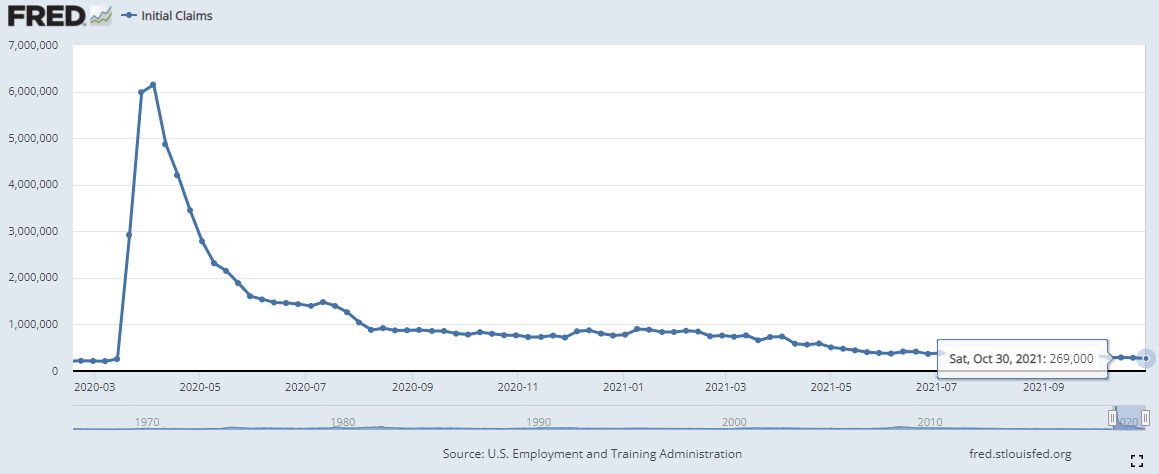
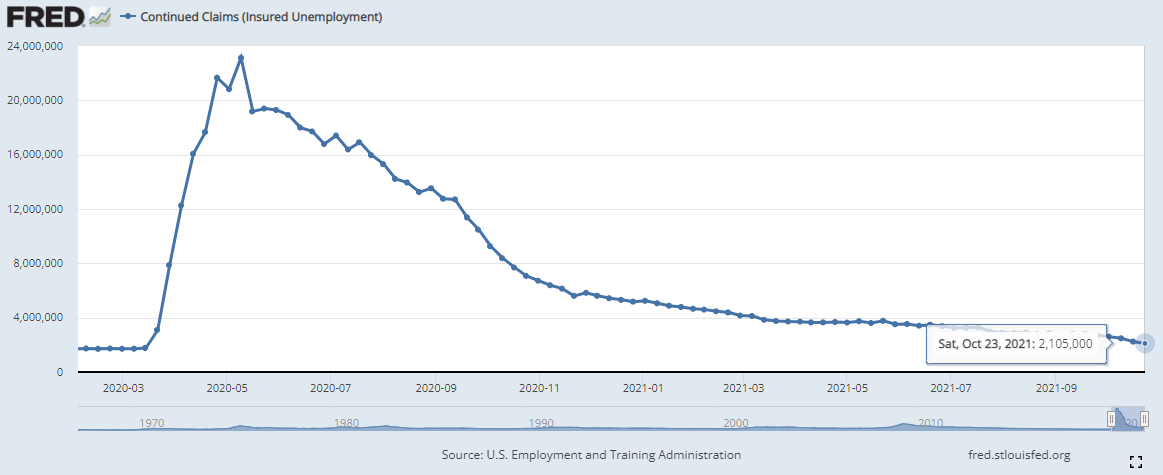
The unemployment trends have improved slightly in October as initial claims in the most recent week came in at 269,000, down from 326,000 from last month, and remain near the lowest totals since the start of the pandemic. Continued claims have declined further, again reaching their lowest levels since the start of the pandemic, down to 2.1 million from 2.7 million last month, on a weekly basis.